
Abstract
Background:
Although shorter telomeres have been associated with Alzheimer’s disease (AD), it is unclear whether longitudinal change in telomere length is associated with AD progression.
Objective:
To investigate the association of telomere length change with AD diagnosis and progression.
Methods:
In 653 individuals from the Alzheimer’s Disease Neuroimaging Initiative (ADNI) cohort, T/S ratio (telomere versus single copy gene), a proxy of telomere length, was measured for up to five visits per participant (N = 1918 samples post-QC) using quantitative PCR (qPCR). T/S ratio was adjusted for batch effects and DNA storage time. A mixed effects model was used to evaluate association of telomere length with AD diagnostic group and interaction of age and diagnosis. Another mixed effects model was used to compare T/S ratio changes pre- to post-conversion to MCI or AD to telomere change in participants with stable diagnoses.
Results:
Shorter telomeres were associated with older age (Effect Size (ES) = –0.23) and male sex (ES = –0.26). Neither baseline T/S ratio (ES = –0.036) nor T/S ratio change (ES = 0.046) differed significantly between AD diagnostic groups. MCI/AD converters showed greater, but non-significant, telomere shortening compared to non-converters (ES = –0.186).
Conclusions:
Although AD compared to controls showed small, non-significant effects for baseline T/S ratio and T/S ratio shortening, we did observe a larger, though still non-significant effect for greater telomere shortening in converters compared to non-converters. Although our results do not support telomere shortening as a robust biomarker of AD progression, further investigation in larger samples and for subgroups of participants may be informative.
INTRODUCTION
Telomeres, chromosomal end caps composed of thousands of hexameric DNA repeats and their associated proteins, insulate the ends of the chromosomes from damage and fusion, and prevent coding DNA loss during DNA replication [1]. Germline telomere length is heritable, influenced by factors including genetic variants, paternal and maternal age, paternal telomere length, and paternal birth year [2–8]. Telomere length decreases by 50–100 bp with every cell division in vitro [9]; this effect can be offset by the action of telomerase, which increases telomere length. Telomeres have been shown to decrease approximately 20–30 bp a year in human leukocytes in vivo [10–12]. In addition to genetic factors, telomere length has been shown to be influenced by environment and behavior. Many different variables appear to associate with somatic telomere length, from stress and diet to drug use and environmental pollution [13–22]. Many of these factors are also associated with risk for Alzheimer’s disease (AD). Additionally, many different disorders have been reported to be associated with shorter or longer telomeres, including disorders which can be comorbid with AD and related disorders (ADRD), such as sleep apnea, cardiovascular disease, and diabetes [23, 24]. Thus, it appears that many factors associated with shorter telomeres or longitudinal telomere shortening have also been associated with ADRD and comorbid disorders, suggesting that telomere shortening and cellular pathways potentially activated by genomic instability and cellular aging may play a role in mediating environmental/behavioral impact on AD risk.
A number of previous studies have provided mixed evidence for the impact of telomere length on AD risk [25–29]. A recent, well-powered meta-analysis of 13 of these studies (N = 2,882) supports an association of shorter telomeres with AD (standardized mean difference of –0.984; 95% confidence interval: –1.433 to –0.535; p value <0.001; Effect size (ES) = –1.213) [30]. However, interpretation of this effect size is difficult, as there were many significant differences between studies included in this analysis including tissue type, measurement method, geographic location, and age. A concern is that several of the included studies, including the largest, have much higher median age for AD participants compared to controls; it would be difficult to successfully adjust for such a difference when studying telomere length, which is intrinsically linked to aging. Furthermore, these studies do not indicate whether this association is driven by inherited telomere length, greater telomere shortening over time, or a combination of these effects. Studies using Mendelian randomization provide support for a causal relationship between shorter telomeres and AD [31, 32]. Furthermore, an association of SNPs in telomerase genes with AD risk also suggests a role for differential telomere shortening in AD risk [33]. However, to date, the contribution of telomere length and telomere longitudinal change to late onset AD risk and progression is unclear. Of note, data from related diseases also suggests the potential role of telomere shortening in AD risk/progression. Studies of older adults with Down syndrome suggest that telomere shortening may play a role in these adults’ progression to mild cognitive impairment (MCI), a prodromal phase of AD [34, 35].
To date, there is a dearth of data on longitudinal telomere length in older cohorts, which has not allowed direct investigation of the impact of telomere shortening rate on AD risk and progression in older adults. We hypothesized that accelerated telomere shortening would be observed in individuals with AD, and that telomere shortening rate may be associated with risk for conversion to a more advanced stage of disease (i.e., from normal cognition to MCI or MCI to AD).
METHODS
Alzheimer’s disease neuroimaging initiative
Data used in the analysis were obtained from the Alzheimer’s Disease Neuroimaging Initiative (ADNI) database (http://adni.loni.usc.edu). ADNI, a multi-year public/private partnership founded in 2003 by Principal Investigator Michael W. Weiner, at UCSF, is a collaboration including the National Institute of Aging (NIA), the National Institute of Biomedical Imaging and Bioengineering (NIBIB), the Food and Drug Administration (FDA), pharmaceutical companies, and non-profit organizations. This multi-phase ongoing longitudinal study includes more than 1800 participants who are cognitively normal (CN), have MCI, or AD, from over 50 sites in the United States and Canada. Further information on the ADNI study design, protocols, and diagnostic criteria as well as the data and measurements used in these analyses can be found at http://adni.loni.usc.edu/; the cohort has also been extensively described in numerous publications [36–38].
Institutional Review Board approval was obtained by each ADNI site, and informed consent was obtained from each study participant or authorized representative. This study was done in accord with the ethical standards of the Helsinki Declaration of 1975.
To study telomere length longitudinally in this cohort, a subset of individuals with longitudinal DNA samples available were selected who were enriched for conversion from CN to MCI or CN/MCI to AD during the study. Each individual had between one and five visits with DNA selected for measurement; since the first visit for each individual was not necessarily the baseline visit, and might differ between individuals (i.e., for individual 1, visit 1 is baseline, but for individual 2, assayed visit 1 is the twelve-month visit), visits are referred to as visit 1–5.
Telomere length measurement
Telomere length was measured from DNA obtained from blood. Blood was drawn and either shipped at room temperature to NCRAD (typically within 1 day) for DNA extraction and storage at –80°C, or processed to buffy coats, frozen, then shipped to NCRAD for extraction and storage at –80°C. DNA was shipped from NCRAD to the Telomere Biology Core Lab (University of California, San Francisco) for telomere length measurement via quantitative PCR (qPCR), with a protocol adapted from the published original method by Cawthon [39, 40].
Control DNAs were included in each run on each plate and were used to normalize batch effects. Every sample was run in triplicate to generate a T/S ratio; this process was repeated to obtain another T/S ratio, and these were averaged to obtain the final T/S ratio. When the duplicate T/S ratio and the initial ratio varied by more than 7%, the sample was run in triplicate a third time and the two closest values were averaged to obtain the final T/S ratio. All assays for the entire study were performed using the same lots of reagents. Baseline and follow-up samples from the same participant were always measured in the same assay plate to control for batch variations. Detailed information about this assay is available in the ADNI telomere methods document on LONI (http://adni.loni.usc.edu/), and is also included in the Supplementary Methods section of this report.
T/S ratio preprocessing
DNAs used in this assay were plated twice at NCRAD, once for telomere length, and once for methylation assays performed independently. The methylation data, which included 59 SNPs used for quality control, was used to eliminate two of the 1,920 DNA samples as potential swaps. Initial quality control identified an instrument calibration bias resulting in unequal DNA pipetting. To correct this, we compared the intra-plate coefficient of variation (CV) within the triplicate wells in each run for all samples and discarded any second or third pipetted well with intra-assay CV >2.5%. The adjusted run data were used to calculate the T/S ratios, and inter-assay CV was used to determine the variance between the two independently run T/S ratios. Any sample with an inter-assay difference greater than 7% was re-run, and the closest two T/S ratios were averaged to obtain the final T/S ratio. The inter-assay CV for telomere length measurement for the corrected data is 3.0% ±3.0%.
Once the additional T/S ratio measurements were integrated into the data set and an acceptable inter-assay CV was obtained, calculations were performed with SAS 9.4 software to adjust for additional sources of experimental variance. A linear mixed effects model was calculated for T/S ratio, including all visits, with plate, row, column, sample type (blood or buffy coat), and months of DNA storage between extraction and qPCR as independent variables. Repeated effects for replicates nested within participants across time used a compound symmetry covariance structure. Results showed that DNA storage and sample type (which changed during the course of the study) resulted in longer telomere length in more recently collected samples (i.e., samples from participants at later visits, which we would normally expect to be shorter than telomere length measurements from earlier visits) Standardized residuals from this model were added to the T/S ratio to obtain an adjusted T/S ratio for each DNA sample. Replicates were averaged to obtain one adjusted T/S ratio for each participant at each visit. This adjusted, averaged value (hereafter referred to as simply T/S ratio) was used for all subsequent analyses.
Statistical analyses
Statistical analyses were conducted in SAS 9.4. Demographic variables were tested for association with AD diagnostic group (CN/MCI/AD) on visit 1 using Pearson Chi-Square and analysis of variance (ANOVA) tests as appropriate. These variables included age, sex, ethnicity, race, education, Apolipoprotein E (APOE) ɛ4 carrier status, and smoking (ever smoked yes/no).
Mixed effects models were used to determine how AD diagnosis groups (CN/MCI/AD) are associated with T/S ratio changes. In the first mixed effects model, diagnostic group is used as a time-varying covariate, e.g., an individual who was CN at visit 1-2, then was diagnosed MCI at visits 3-4, would have T/S ratio at visit 1-2 in the CN group, and visits 3-4 in the MCI group. The mixed effects model accounted for within-subject correlations between visits by including a random subject effect. Age at visit, sex, APOE ɛ4, years of education, diagnostic group at visit, and an interaction between age and diagnostic group were included in this model. Slope for T/S ratio change over time for each diagnostic group was estimated from this model. Effect sizes were derived as the standardized parameter estimates representing changes in T/S ratio measured by standard deviations (SD) associated with one SD change in the independent variable of interest.
A second mixed effects model was used to determine whether T/S ratio rates of change were different between converters and those who remained stable. T/S ratio changes were calculated between those obtained at conversion point visit and the visit prior to conversion for converters, and between the last two visits for those who remained stable. The model included converter status, time interval between preC and postC, sex, APOE ɛ4, years of education, and age at first observation. This mixed effects model allowed for participants to be considered for CN converting to MCI or AD and MCI converting to AD (converters with disease progression) and multiple conversions from an individual. We chose this method with these visits to investigate immediate effects of disease progression on telomere shortening rate. Formulae for both mixed effect models are included in the Supplementary Material (Mixed Effects Model Formulae).
RESULTS
Demographic variables
Demographic variables by AD diagnostic groups for the N = 653 unique individuals with telomere data is shown for visit 1 in Table 1. Most individuals in this study are white non-Hispanic by self-report, with approximately 16 years of education. Of the demographic variables analyzed, APOE ɛ4 (p < 0.001) and older age (p < 0.001) were significantly associated with AD diagnostic group.
Demographics by AD diagnosis at Visit 1 (N = 653)
aone individual missing APOE ɛ4 genotype.
T/S ratio and AD diagnosis and conversion
The results of the first mixed model, including diagnosis at visit and an interaction between age and diagnosis, are presented in Table 2. Older age (ES = –0.23, p < 0.001) and male sex (ES = –0.26, p < 0.001) were both significantly associated with smaller T/S ratios (shorter telomere length; Fig. 1). AD participants had shorter telomeres compared to controls (ES = –0.036), while MCI participants did not show a significant difference in telomere length compared to controls (ES = –0.0087); however, diagnosis was not significantly associated with telomere length (p = 0.657). The interaction term between age and diagnosis also did not reach statistical significance (p = 0.6805). As seen in Table 3, controls and MCI participants showed a similar rate of change (annual change for both groups = –0.005; MCI versus CN ES = –0.001), while AD participants showed a slower rate of telomere shortening (annual change = –0.004; AD versus CN ES = 0.046); however, this effect does not reach statistical significance (p = 0.681). For all three diagnostic groups, annual change in T/S ratio showed significant shortening (p < 0.001 for all).
Results from mixed effects model on T/S ratio by AD diagnosis, age, sex, APOE ɛ4, years of education and age and AD diagnosis interaction
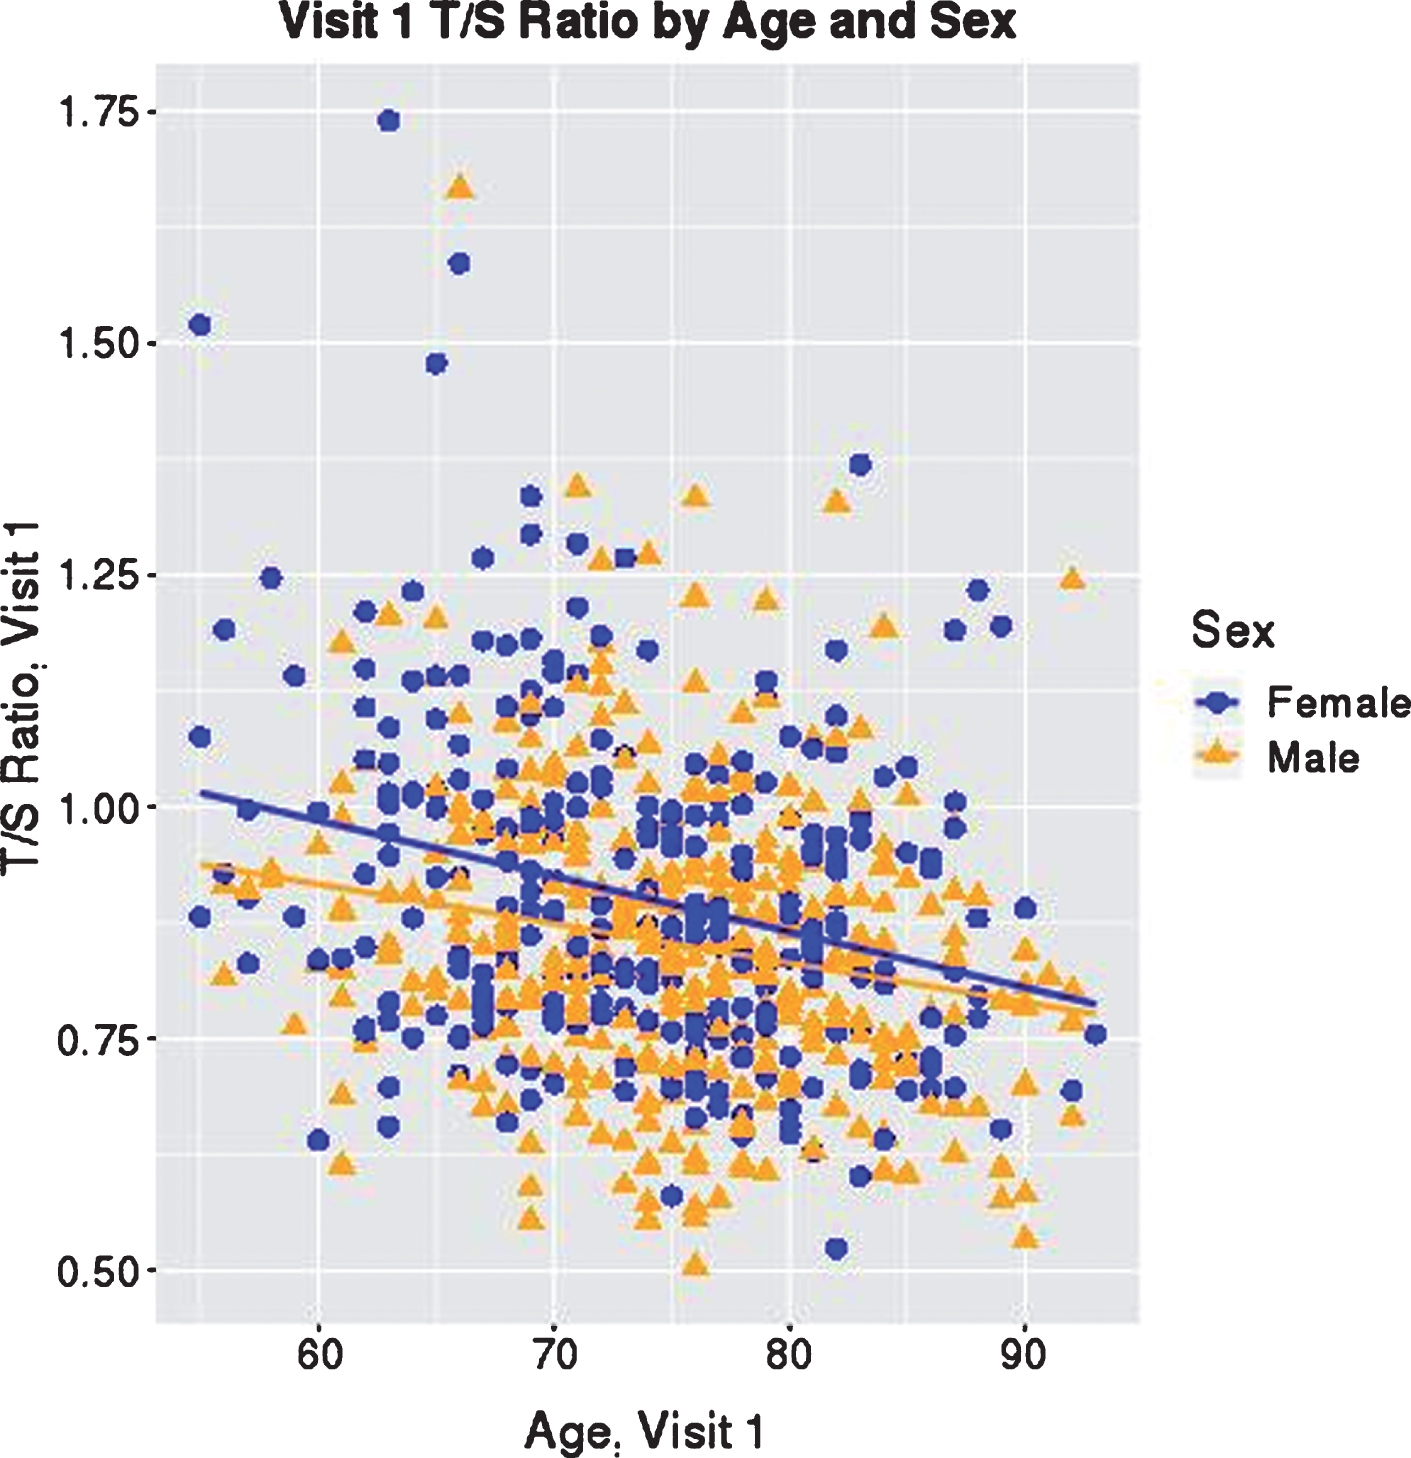
T/S Ratio at Visit 1 by Age and Sex. T/S ratio at visit 1 is graphed with participant age at visit 1. Each participant is indicated by a blue circle or orange triangle, representing female or male, respectively, as shown in the key. Blue and orange lines indicate the average linear change in T/S ratio by age for females and males, showing that lower T/S ratio is associated with older age, and on average, females have longer telomeres than males.
Estimated annual change in T/S ratios by AD diagnosis over all visits from the mixed effects model in Table 2
ap-value tests whether the slope is equal to 0 and comes from mixed effects model on T/S ratio by diagnosis adjusted by age at visit, sex, APOE ɛ4, years of education, and a diagnosis and age interaction. bDoes not include 1 participant with 3 observations since APOE ɛ4 status was missing and was thus dropped from modeling.
Numbers of converters and those with stable disease are show in Table 4, broken into rows by participants whose first visit had a CN diagnosis, and those who converted from MCI to AD. There were eight individuals who converted twice (CN to MCI to AD) during the longitudinal visits included in this study; these individuals’ data were included in the model. Longitudinal T/S ratio values are shown for these individuals in Fig. 2.
Conversion status of participants
*MCI Includes 13 individuals who were CN converters with at least two post-conversion visits, eight of whom subsequently converted to AD.
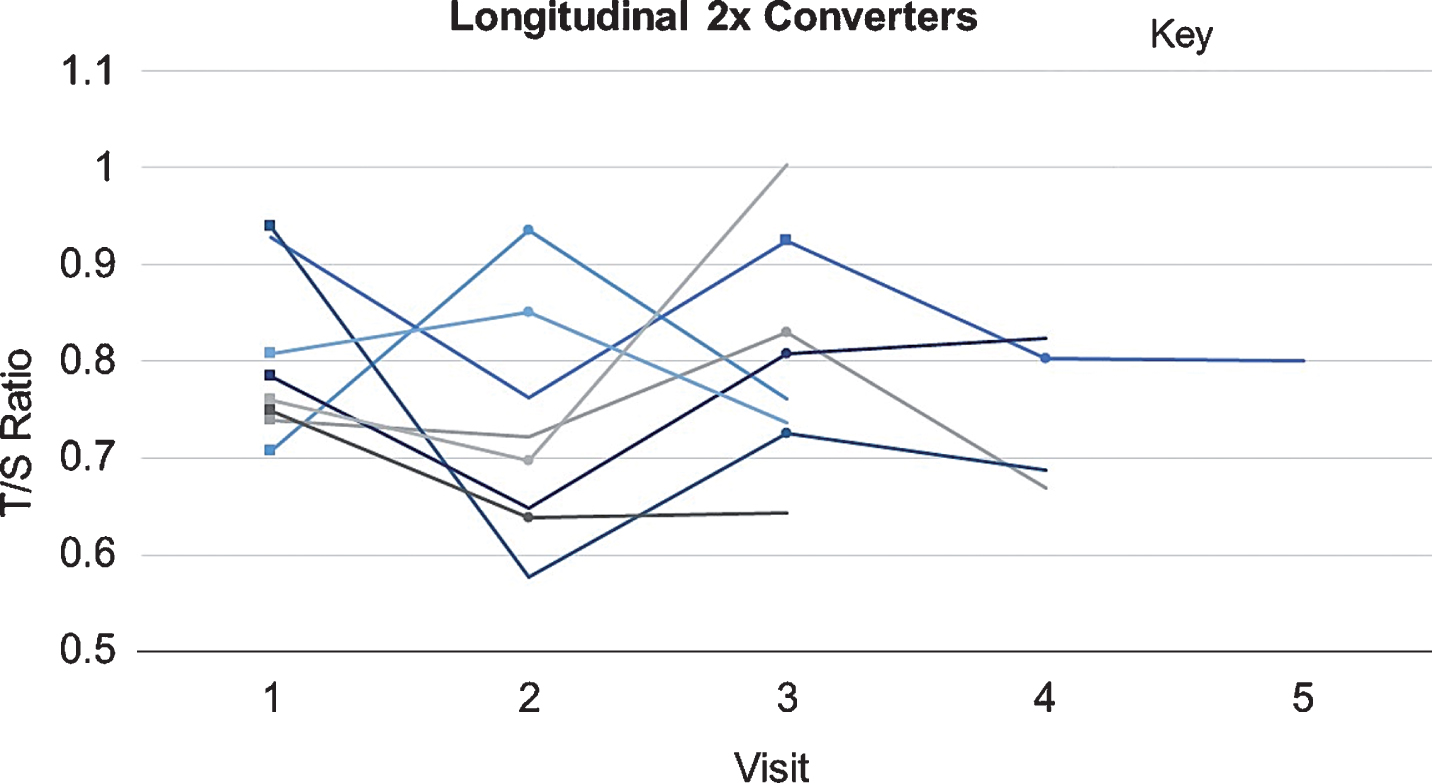
T/S Ratios across Visits of CN⟶MCI⟶AD Converters. T/S ratios at each visit for the eight individuals included in this study who converted twice (CN⟶MCI⟶AD) are shown. Each is represented by a different shaded line. Squares indicate CN⟶MCI pre-conversion visit; circles indicate MCI⟶AD pre-conversion visit.
To test whether rate of change differed by disease progression, a second mixed model was tested with a term for converter status and results are presented in Table 5. Analysis of converters vs. those with stable diagnosis showed an effect of telomere shortening in converters compared to those with stable diagnosis (ES = –0.186, p = 0.083), with converters showing a larger decrease in T/S ratio (mean = –0.023, SE = 0.012, p = 0.050) preC to postC compared to controls and those with stable disease (mean = 0.0015, SE = 0.0071, p = 0.833), though this effect does not reach statistical significance.
T/S ratio change by converter* status
*Converters in this model include CN⟶MCI/AD and MCI⟶AD. aPreC T/S ratio is measured at the last pre-conversion visit for the conversion groups; for stable groups, ‘preC’ is the second to last (chronologically most recent) visit with T/S ratio data available. bPostC T/S ratio is measured at the first post-conversion visit for the conversion groups; for stable groups, ‘postC’ is the most recent visit with T/S ratio data available.
DISCUSSION
This is the first study to perform a longitudinal investigation of change in telomere length in relation to late-onset AD risk and progression. While age and sex showed the expected relationship with telomere length, we did not observe a significant association of T/S ratio at baseline or significant change in T/S ratio with AD diagnostic group. However, examining the effect for AD and MCI compared to controls in the mixed effects model, for AD versus controls telomere length is shorter (ES = –0.036), while for MCI versus controls telomere length shows a negligible difference (ES = –0.0087). This supports the existing literature that AD participants have shorter telomeres than controls, though the effect is smaller than the estimate by the most recent meta-analysis of telomere length in AD compared to controls (ES = –1.213) [30]. However, the much larger effect from the meta-analysis may be partly due to inflation, given that some of the studies in the meta-analysis showed a larger age gap (AD 7 years older than controls in the largest study); it would be difficult to accurately adjust for such a difference when studying telomeres given that telomere length is known to decrease with age. Results from the ADNI cohort also extend these findings to suggest the same effect is not observed in individuals with MCI, who have telomere lengths similar to controls (difference in T/S ratio = 0.0002). In examining the longitudinal rate of telomere length change across diagnostic groups, the observation that the AD group showed a nonsignificant slower rate of change than controls or MCI was unexpected.
Because this model included all visits with a diagnosis regardless of later disease progression, we assessed whether rate of change within diagnostic group, might be confounded by different rates of change in individuals who convert compared to those who are stable. In a mixed effect model including diagnostic conversion status, we observed greater T/S ratio change pre- to post-conversion in converters (ES = –0.186, p = 0.08) compared to non-converters, though this effect did not reach statistical significance, suggesting that in a larger study, AD progression might be significantly associated with a greater decrease in T/S ratio.
A number of previous studies have shown mixed evidence for cross-sectional telomere length association with AD diagnosis with much of the evidence suggesting that shorter telomeres are associated with AD risk [30]. However, these cross-sectional studies were not able to investigate the association of rate of change of telomere length with disease risk. This is an important point, as a variety of behavioral and environmental variables have been shown to play important roles in telomere length change during life, from early life stress to diet, exercise, and various pharmaceuticals. Thus, while shorter telomeres at birth are not currently a viable target for intervention, the rate of telomere shortening could conceivably be modified by behavioral, dietary, or pharmaceutical interventions. Further research is needed to confirm the observation of a medium effect for disease progression associated with telomere length change, to advance this potentially translatable finding.
The present study has several limitations. Although the lack of statistically significant findings may suggest that telomere length is not a key factor in the biological mechanisms predisposing to AD, methodological issues and adjustments for experimental variation may have reduced the power to detect significant relationships in this dataset. Given that the sample type bias and storage time effect had an opposite impact on telomere length compared to the normal shortening observed with age, it is possible that some of the signal was obscured by this experimental variation. Additionally, the trend for greater telomere shortening in converters during the conversion period suggests that this may be a biomarker of disease progression. Blood sample collection in ADNI was originally designed to ensure an adequate supply of genomic DNA but not to minimize sources of variation for analysis of longitudinal changes in DNA. A larger, better-powered study explicitly designed to assess longitudinal DNA changes with comparable biospecimen collection and handling at each time point is needed to investigate these relationships in greater depth.
Interestingly, while a previous study of healthy post-menopausal older women (N = 63) showed that APOE ɛ4 carriers had greater odds of exhibiting enhanced telomere shortening over a two-year period [41], APOE ɛ4 carrier status was not significantly associated with telomere rate of change in the current analysis. This could be due to other differences in demographic factors between these cohorts including mean age (ADNI mean age is approximately a decade older than the cancer study). For the purposes of the current study, APOE ɛ4 was included as a covariate in all analyses due to the known AD risk associated with APOE ɛ4, so this is not likely to have confounded the results.
While large compared to many single site studies of telomere length in AD, the present study is smaller than the recent meta-analysis showing shorter telomeres associated with AD (N = 2,882) [30]. We also show an effect of shorter telomeres in AD, though much smaller than the meta-analytic ES (–0.036 versus –1.213). However, it is possible that we might observe this cross-sectional effect reaching statistical significance in a larger cohort. Another limitation was that ADNI is a relatively well-educated, homogeneous cohort compared to the U.S. population, and excluded individuals with serious mental illnesses. This is an important consideration, as there is likely to be more variability in telomere length, and potentially also in telomere shortening rate, in a fully representative AD population, since telomere length and attrition have been linked to factors including early life stressors, mental illness, drug use, and alcoholism [13, 43]. This study was also limited by the lack of suitable longitudinal replication data. Future directions should also include obtaining more data to perform a well-powered analysis of individuals showing faster disease progression for differences in telomere attrition. This analysis did not incorporate genetic data (other than APOE) to differentiate between genetic predictors of telomere length and differences in length from environmental/behavioral factors, as this was beyond the scope of the current work. Analyses of gene/environment interaction in related to telomere length associated pathways is, however, an important future direction. Future studies should also obtain more telomere measurements at time intervals prior to preC and following postC visits, to evaluate at what point prior to conversion accelerated telomere shortening can be detected, and whether telomere shortening accelerates following disease progression. This study was not powered to evaluate this measure, as only 1/4 of the converters in the subset of ADNI participants selected for this assay had a visit with data prior to the preC visit, and even fewer individuals had a visit with data following the postC visit. Previous research in Down syndrome has shown that accelerated telomere shortening is detectable up to 18 months prior to diagnosis with MCI in this population [34], suggesting that telomere shortening prior to conversion may be a useful biomarker of risk for imminent disease progression.
Another consideration related to study size is the potential influence of drugs on telomere length. As pointed out earlier, there are many different genetic, environmental, and behavioral variables that have been shown to contribute to telomere length; among these, drugs have been shown to influence telomere length and telomerase function [16, 45]. This is particularly important in the ADNI sample, and other cohorts of older individuals, as aging studies and older cohorts tend to be enriched for individuals taking one or more drugs on a long-term basis, as well as individuals with more serious medical histories who have been exposed to biologically disruptive drugs with drastic systemic effects, such as chemotherapy, some of which have a variety of long-term effects. While ADNI does not have complete medical records of past and current medication (data based on self-report, not medical record), and thus adjusting for drug exposure is beyond the scope of the current analysis, future work leveraging cohorts with full electronic health record access should consider how drug use may impact telomere length in the AD population.
It is unclear whether telomere shortening is contributing to the molecular and systemic pathways driving AD progression, though this study presents evidence suggesting that telomere shortening may accelerate during disease progression. However, the theoretical biological underpinnings of this connection are compelling and deserve further investigation. Telomere length has been shown to correlate between tissues, suggesting that shortening in the periphery may be a marker for shortening telomeres in brain cell populations [26]. Telomere shortening in neuronal, microglial, or astroglial populations could potentially lead to genomic instability and cell death, particularly if, as postulated in several recent papers, deficits in neurogenesis may contribute to AD risk [46]. Shorter telomeres in neural stem cells could lead to senescence and deficits in neurogenesis, potentially leading to memory problems and AD. Additionally, it is possible that telomere shortening could be playing a role in increased cellular senescence in the brain. Short telomeres in microglia could potentially contribute to senescence-associated secretory phenotype (SASP), leading to increased brain inflammation and increasing AD risk. It is also possible the leukocyte telomere length is contributing to AD progression via peripheral systemic effects as well. Telomere shortening is a marker of cellular aging, suggesting that accelerated cellular aging could play a role in AD progression. Telomere shortening in leukocytes could result in SASP in these cells as well, increasing chronic inflammation, a known risk factor for AD [47]. While this particular marker of cellular aging is novel for AD, the concept of accelerated aging as a potential contributor to AD has been around for decades [48]. Interestingly, a senescence-accelerated mouse model (SAMP8) has been suggested as a good model of late-onset AD, as it exhibits many features observed in early AD, including increased oxidative stress and differences in amyloid beta and tau phosphorylation [49]. New data have also suggested that telomerase has functions in the cell in addition to extending telomeres. Telomerase has been shown to play roles in bolstering Wnt signaling, enhancing cell proliferation and/or resistance to apoptosis (an effect that has been shown in response to brain injury in mouse brain cells), and promoting DNA damage repair [50–53] which are all biological mechanisms that, if reduced or dysfunctional, could theoretically contribute to AD as well. Although there is not yet a causal link between telomere shortening and AD progression, multiple biological mechanisms that could hypothetically underlie this association including effects of senescence and cellular aging in the periphery and/or the brain, and effects of reduced telomerase activity.
While previous studies have shown an association of shorter telomere length with AD, this is the first study to investigate longitudinal telomere change with AD diagnostic group and disease progression. This study shows a non-significant effect of disease progression on telomere shortening rate; further study in a larger cohort would be useful to identify the mechanism(s) driving this effect. Future studies are needed to investigate the suitability of telomere length change as a biomarker, as well as the potential relationship between peripheral telomere shortening and measures of AD pathology.
Footnotes
ACKNOWLEDGMENTS
We would like to acknowledge the combined expertise of many investigators within the ADNI genetics core, our collaborators at AbbVie, as well as the staff at the National Centralized Repository for Alzheimer’s Disease and Related Dementias (NCRAD), for their contributions to the study. Samples from the National Centralized Repository for Alzheimer’s Disease and Related Dementias (NCRAD), which receives government support under a cooperative agreement grant (U24 AG21886) awarded by the National Institute on Aging (NIA), were used in this study. We thank contributors who collected samples used in this study, as well as patients and their families, whose help and participation made this work possible. We would also like to thank Dr. Brody Holohan (Marshfield Clinic, UW Madison) and Drs. Brittney Herbert, Debomoy Lahiri and Tatiana Foroud (Indiana University School of Medicine) for their expert advice. We are grateful to the members of the Telomere Core of the Blackburn Lab, our collaborators on this project, including particularly co-author Dr. Jue Lin, who was responsible for producing the assay data and for all initial quality control.
Data collection and sharing for this project was funded by the Alzheimer’s Disease Neuroimaging Initiative (ADNI) (National Institutes of Health Grant U01 AG024904) and DOD ADNI (Department of Defense award number W81XWH-12-2-0012). ADNI is funded by the National Institute on Aging, the National Institute of Biomedical Imaging and Bioengineering, and through generous contributions from the following: AbbVie, Alzheimer’s Association; Alzheimer’s Drug Discovery Foundation; Araclon Biotech; BioClinica, Inc.; Biogen; Bristol-Myers Squibb Company; CereSpir, Inc.; Cogstate; Eisai Inc.; Elan Pharmaceuticals, Inc.; Eli Lilly and Company; EuroImmun; F. Hoffmann-La Roche Ltd and its affiliated company Genentech, Inc.; Fujirebio; GE Healthcare; IXICO Ltd.; Janssen Alzheimer Immunotherapy Research & Development, LLC.; Johnson & Johnson Pharmaceutical Research & Development LLC.; Lumosity; Lundbeck; Merck & Co., Inc.; Meso Scale Diagnostics, LLC.; NeuroRx Research; Neurotrack Technologies; Novartis Pharmaceuticals Corporation; Pfizer Inc.; Piramal Imaging; Servier; Takeda Pharmaceutical Company; and Transition Therapeutics. The Canadian Institutes of Health Research is providing funds to support ADNI clinical sites in Canada. Private sector contributions are facilitated by the Foundation for the National Institutes of Health (![]() ). The grantee organization is the Northern California Institute for Research and Education, and the study is coordinated by the Alzheimer’s Therapeutic Research Institute at the University of Southern California. ADNI data are disseminated by the Laboratory for Neuro Imaging at the University of Southern California.
). The grantee organization is the Northern California Institute for Research and Education, and the study is coordinated by the Alzheimer’s Therapeutic Research Institute at the University of Southern California. ADNI data are disseminated by the Laboratory for Neuro Imaging at the University of Southern California.
Additional support for the data analysis was provided by several NIH grants including R01 AG19771, P30 AG10133, K01 AG049050, R01 LM011360, R01 LM012535, R03 AG054936, R03 AG050856, and R00 LM011384, R01 EB022574, U24 AG21886, R01 CA129769, R35 CA197289 and P30 CA082709, and the Biomarkers Across Neurodegenerative Diseases (BAND) by Alzheimer’s Association and UK Alzheimer’s Research.
Dr. Weiner receives support for his work from the following grants: 2U19AG024904, R01MH101472, 1R01AG053798-01A1, P50 AG23501, R01 MH098062 (NIH/NIA/NIMH), W81XWH-12-2-0012, W81XWH-13-1-0259, W81XWH-14-1-0462, W81XWH-14-2-0176, W81XWH-15-2-0070 (DOD), 13-12004 and 16-10054 (CA Dept. of Public Health), 20150802 (Alzheimer’s Disease Discovery Foundation; ADDF), 2015-A-011-NET (Larry L. Hillblom Foundation), PPRN-1501-26817 (PCORI), BHR-16-459161 (Alzheimer’s Association), 174552 (Biogen), as well as funding from the Global Alzheimer’s Platform Foundation (GAP), European Brain Health Registry/NL, Johnson & Johnson, and Monell Chemical Senses Center.