
Abstract
Background:
Emerging evidence shows tau acetylation has been observed in Alzheimer’s disease (AD) brain at early Braak stages and is involved in regulating tau early accumulation. However, the effects of deacetylase Sirtuin 3 (Sirt3) on tau acetylation and its aggregations are unclear.
Objective:
We studied the effects of Sirt3 on tau acetylation and its aggregations.
Methods:
We investigated the protein levels of Sirt3 and tangle tau in human postmortem brains slices from AD, mild cognitive impairment, and age- and education-matched cognitively normal subjects, and AD model mice. We also measured tau acetylation levels in hippocampal HT22 cells after Sirt3 knockdown or overexpression.
Results:
The level of Sirt3 was inversely related with tau protein in brain slices from both human being and AD model mice. Mechanistically, tau acetylation decreased dramatically with Sirt3 overexpression, while tau acetylation increased after Sirt3 knockdown in hippocampal HT22 cells.
Conclusions:
Sirt3 may play a role in tau acetylation and could be a potential target for novel therapy to alleviate tau accumulation.
INTRODUCTION
Accumulation of hyperphosphorylated microtubule-associated protein tau is a pathological hallmark of Alzheimer’s disease (AD) [1]. Acetylation at specific sites of tau reduces its stability, alters its structure and function, and leads to tau aggregation [2]. Emerging evidence show acetylation-dephosphorylation cross-talk may play a role during tau post-translational modification [3]. An increase in tau acetylation has been observed in AD brain at early Braak stages and is involved in regulating early accumulation of tau [2, 4]. Acetylation, but not phosphorylation, also regulates aggregation of recombinant tau in vitro. The NAD-dependent protein deacetylase Sirtuin3 (Sirt3) deacetylates and regulates multiple proteins function [5]. Inhibition of the deacetylase Sirt3elevates tau acetylation in primary neurons. Thus, tau acetylation could be a potential strategy for AD treatment and prevention. Our previous studies have shown that Sirt3 is declined significantly in postmortem brains of patients with AD and this decline is strongly associated with poorer cognition and the severity of tau pathology [6]. However, as an important deacetylase, little is known about the effects of Sirt3 on tau acetylation. In this study, we hypothesize that Sirt3 may be a regulator for tau acetylation and affect tau accumulation.
METHODS
Human postmortem brain slices
Postmortem human brain slices were obtained from the Banner Sun Health Research Institute Brain. All tissues were collected as described previously [6, 7]. Clinical and neuropsychological assessment is performed annually according to the National Alzheimer’s Coordinating Center protocol. Frozen cerebral cortex postmortem brain tissues were originated from subjects with diagnoses of AD, mild cognitive impairment (MCI), and cognitively normal (CN). Subjects designated as “cognitively normal” have no cognitively based limitations in daily living activities and a Clinical Dementia Rating (CDR) score of 0. The diagnosis of MCI was given according to published consensus criteria [8] and a CDR of 0.5. A diagnosis of probable AD by the National Institute of Neurological Disorders and Stroke (NINDS) criteria [9] was given to subjects with a CDR score of ≥1.0 and a neuropsychological profile showing disproportionately severe impairment of learning and delayed recall.
Animals
Triple transgenic (3×TG) mice and controls were produced in colony as described previously [10]. The animals were kept in groups on a 12 : 12 h light and/or dark cycle with food and water ad libitum. All experimental procedures were approved by the Institutional Animal Care and Use Committee of the Barrow Neurological Institute and performed according to the Revised Guide for the Care and Use of Laboratory Animals. Mice were euthanized by injection of a ketamine and/or xylamine cocktail at 24 months of age. They were then perfused transcardially with 0.1 M phosphate-buffered saline (PBS). The fresh cortical tissues were dissected quickly on ice and frozen in liquid nitrogen for subsequent protein extraction and immunoblot or ELISA assay.
Immunohistochemical and immunofluorescent staining
Mice were euthanized by injection of a ketamine/xylamine cocktail at 12 months. They were then perfused transcardially with ice-cold 0.9% Normal Saline solution followed by 0.1 M PBS containing 4% paraformaldehyde (pH 7.4). For immunohistochemistry and immunofluorescent staining, the brains were harvested and post-fixed for 24 h with 4% paraformaldehyde at 4°C. Fixed tissues were embedded in paraffin. Sections were cut at 6μm thickness and mounted on Silane-coated standard glass microscope slides (Sigma, St. Louis, MO).
The sections were immunostained with the following primary antibodies: rabbit anti-Sirt3 antibody, anti-paired helical filament (PHF)-tau (Ser202/Thr205), clones AT-8) antibody, and anti-Aβ 1–16 (6E10) antibody. Secondary antibodies included goat anti rabbit or mouse -HRP secondary antibody, goat anti rabbit Alexa fluor 488 secondary antibody, goat anti mouse Alexa fluor 555 secondary. Respective negative controls that omit primary antibodies and positive controls were applied for each case. Digital images were collected using an Axoplan microscope (Zeiss, Thornwood, NY) under a bright field setting using a 40× objective. Coronal sections of the cortical and hippocampal regions were matched and blindly coded for each group. Cellular staining was quantified on three randomly selected fields of each region. The density of protein expression (mean grey value) was quantified and collected using Image J 1.42q (NIH), GraphPad Prism 7.0 and Excel 2010 were used for data analysis and graphs make.
Thioflavin S and Sirt3 double staining
Amyloid plaques and neurofibrillary tangles were stained using Thioflavine-S staining protocol modification [11]. Brain slices were quick hydrated through gradient ethanol (10 s each) from anhydrous ethanol to distilled water for 5 min. Slices were immersed in 0.25% KMnO4 for 20 min, rinsed in fresh dH2O (20 very quick dips) and transferred into solution containing 1% K2S2O5 (Potassium Metabisulfite) and 1% oxalic acid for 2 min, rinsed in fresh dH2O (20 very quick dips). Then the slices were placed in 1% NaOH solution (30 ml of 3% H2O2 in 470 ml dH2O) for 20 min. Slides were rinsed gently in fresh dH2O (20 s) and 5 s in 0.25% acetic acid, and then rinsed in fresh dH2O again. Slides were placed in 0.0125% filtered Thioflavine-S for 5 min and differentiated in 50% ETOH for 10 s, rinsed in fresh dH2O (2 very quick dips), and slides re-dipped in dH2O. For SIRT3 (#5490S, Cell Signaling, Danvers, MA Cell Signaling) staining, slices were washed in PBST, using the immunofluorescence staining protocol as described before [12]. All slices were mounted using anti-fade mounting medium. Images were taken on confocal laser microscope LSD7.0.
ATP levels measurement in hippocampal HT22 cells
Mouse hippocampal HT22 cells were cultured in a 96-well plate and treated with oligo Aβ42 (0, 10, 100, 1000, and 5000 ng/ml) for 24 h. After oligo Aβ42 treatment, intracellular ATP levels were measured using a Luminescent ATP detection assay kit (#ab113849, Abcam, Cambridge, MA) according to the manufacturer’s protocol [6, 13]. The ATP value of vector cells without Aβ42 treatment was normalized to 100%.
Sirt3 vector construction and transfection
Sirt3 was either overexpressed or knocked down in hippocampal HT22 cells as described previously [6, 13]. Briefly, an exogenous Sirt3 cDNA sequence was cloned into a Lenti vector. Sirt3 shRNA was used to limit the expression of Sirt3. The vector with shRNA, Lenti-Sirt3, or control was packaged into a Lenti-Virus transfection system. After the cells were seeded and grown, the Lenti-Virus particles were added at a multiplicity of infection of 250. The levels of knockdown and overexpression were confirmed by western blot [6, 13]. On the 5th day, successful transfected cells were treated with Aβ42 for 24 h, and then further measures were carried out.
Immunoprecipitation
Total acetylated tau was detected using immunoprecipitation and western blot as described previously [6]. Briefly, 50μl completely resuspended Dynabeads Protein G (#10007D, Thermo Fisher Scientific Inc., Grand Island, NY) were placed on a magnet to remove the supernatant. Resuspended dynabeads were washed, mixed with anti-total tau monoclonal antibody (#ab80579, Abcam, 2μg/mg), and incubated for 10 min at room temperature. The Dynabeads-Ab complex was pelleted on magnet and washed in 200μl antibody binding washing buffer again. 400μl (1μg/μl) sample supernatant was added and incubated for 10 min at room temperature with rotation. The Dynabeads-Ab-Ag complex was washed 3 times. Dynabeads-Ab-Ag complex was gently resuspended by adding 20μl elution buffer and incubated for 2 min at room-temperature. Final supernatant was transferred to a clean tube and mixed with 10μl loading buffer. Samples were loaded on a gel for western blot. Anti-acetylated lysine antibody (#9441, Cell Signaling, Danvers, MA) was used to detect acetylated tau.
Western blot
Cultured hippocampal HT22 cells were treated with oligo Aβ42 (0, 10, 100, 1000, 5000 ng/ml) for 24 h. Total proteins were collected from cultured cells and amount of proteins were applied for Sirt3, total tau, acetylated lysine, and acetylated tau (following immunoprecipitation). Antibodies used were the following: anti-Sirt3 (#5490S, Cell Signaling, Danvers, MA), anti-total tau (Tau-5, #556319, BD Pharmingen, San Diego, CA), Anti-acetylated lysine antibody (#9441, Cell Signaling, Danvers, MA), anti-β-actin (Santa Cruz, Dallas, TX), IRDye 800CW and IRDye 680CW antibodies (LI-COR, Lincoln, NE). Primary antibodies were omitted to serve as negative controls. Immunoreactive signals were quantified using Odyssey CLx. Protein levels were presented by percentage relative to β-actin, an internal control.
Statistics
GraphPad Prism version 7.0 was applied for statistical analysis. Statistical significance was set at p < 0.05. Data was expressed as mean±SEM. Unpaired t-test was applied to analyze significant difference between two groups. ANOVA with Tukey’s multiple comparisons test was used to compare values across multiple groups.
RESULTS
Tangle tau was inversely related with Sirt3 in temporal cortex and hippocampus of mouse brain
Levels of Sirt3 and tangle tau were tested in brain slices from 18-month-old 3×TG mice and age-matched control mice after stained with anti Sirt3 antibody and anti-tangle tau antibody using immunohistochemistry staining. There were very few tau tangles in the brains of wild type mice (Fig. 1A: a and b), while tau tangles signal was strong and existent in most neurons in the triple transgenic mice cortex and hippocampus (Fig. 1B: c and d). The signal of Sirt3 expression in wild type mice brain were extremely strong in both cortex and hippocampus (Fig. 1C: e and f), compared to weak signaling of Sirt3 expression in 3T mice brain (Fig. 1D: g and h). Then, positive staining signals were quantified with Image J software and the mean grey value was analyzed. The smaller the mean grey value was, the stronger the positive signal was. Compared to wild type mice, the mean grey value of tangle tau in 3T mice brain was significantly low in both cortex and hippocampus (Fig. 1E and F, p < 0.01), while the mean grey value of Sirt3 in 3T mice brain was dramatically high in both cortex and hippocampus (Fig. 1G and H, p < 0.01). Similar signals of tangle tau and Sirt3 were found in immunofluorescent staining (Fig. 1i–l). Intracellular neurofibrillary tangles are aggregates of hyperphosphorylated tau protein, which is considered one of the pathological hallmarks of AD. Tau protein is a microtubule-associated protein, part of the cytoskeleton of a cell [14–16], so the immunohistochemistry demonstrated strong cytosolic staining of in both soma and neurites in AD brains and the Tg animal model of AD. By contrast, Sirt3 is generated in the nucleus (44 kDa full length isoform) and then transported into the cytoplasm, mainly located in the mitochondria (28 kDa short length isoform) [17–19]. That is why Sirt3 is detected in the nucleus and soma, but not in the neurites. These data indicated that stronger tangle tau was correlated with weaker Sirt3 expression in mice brain.
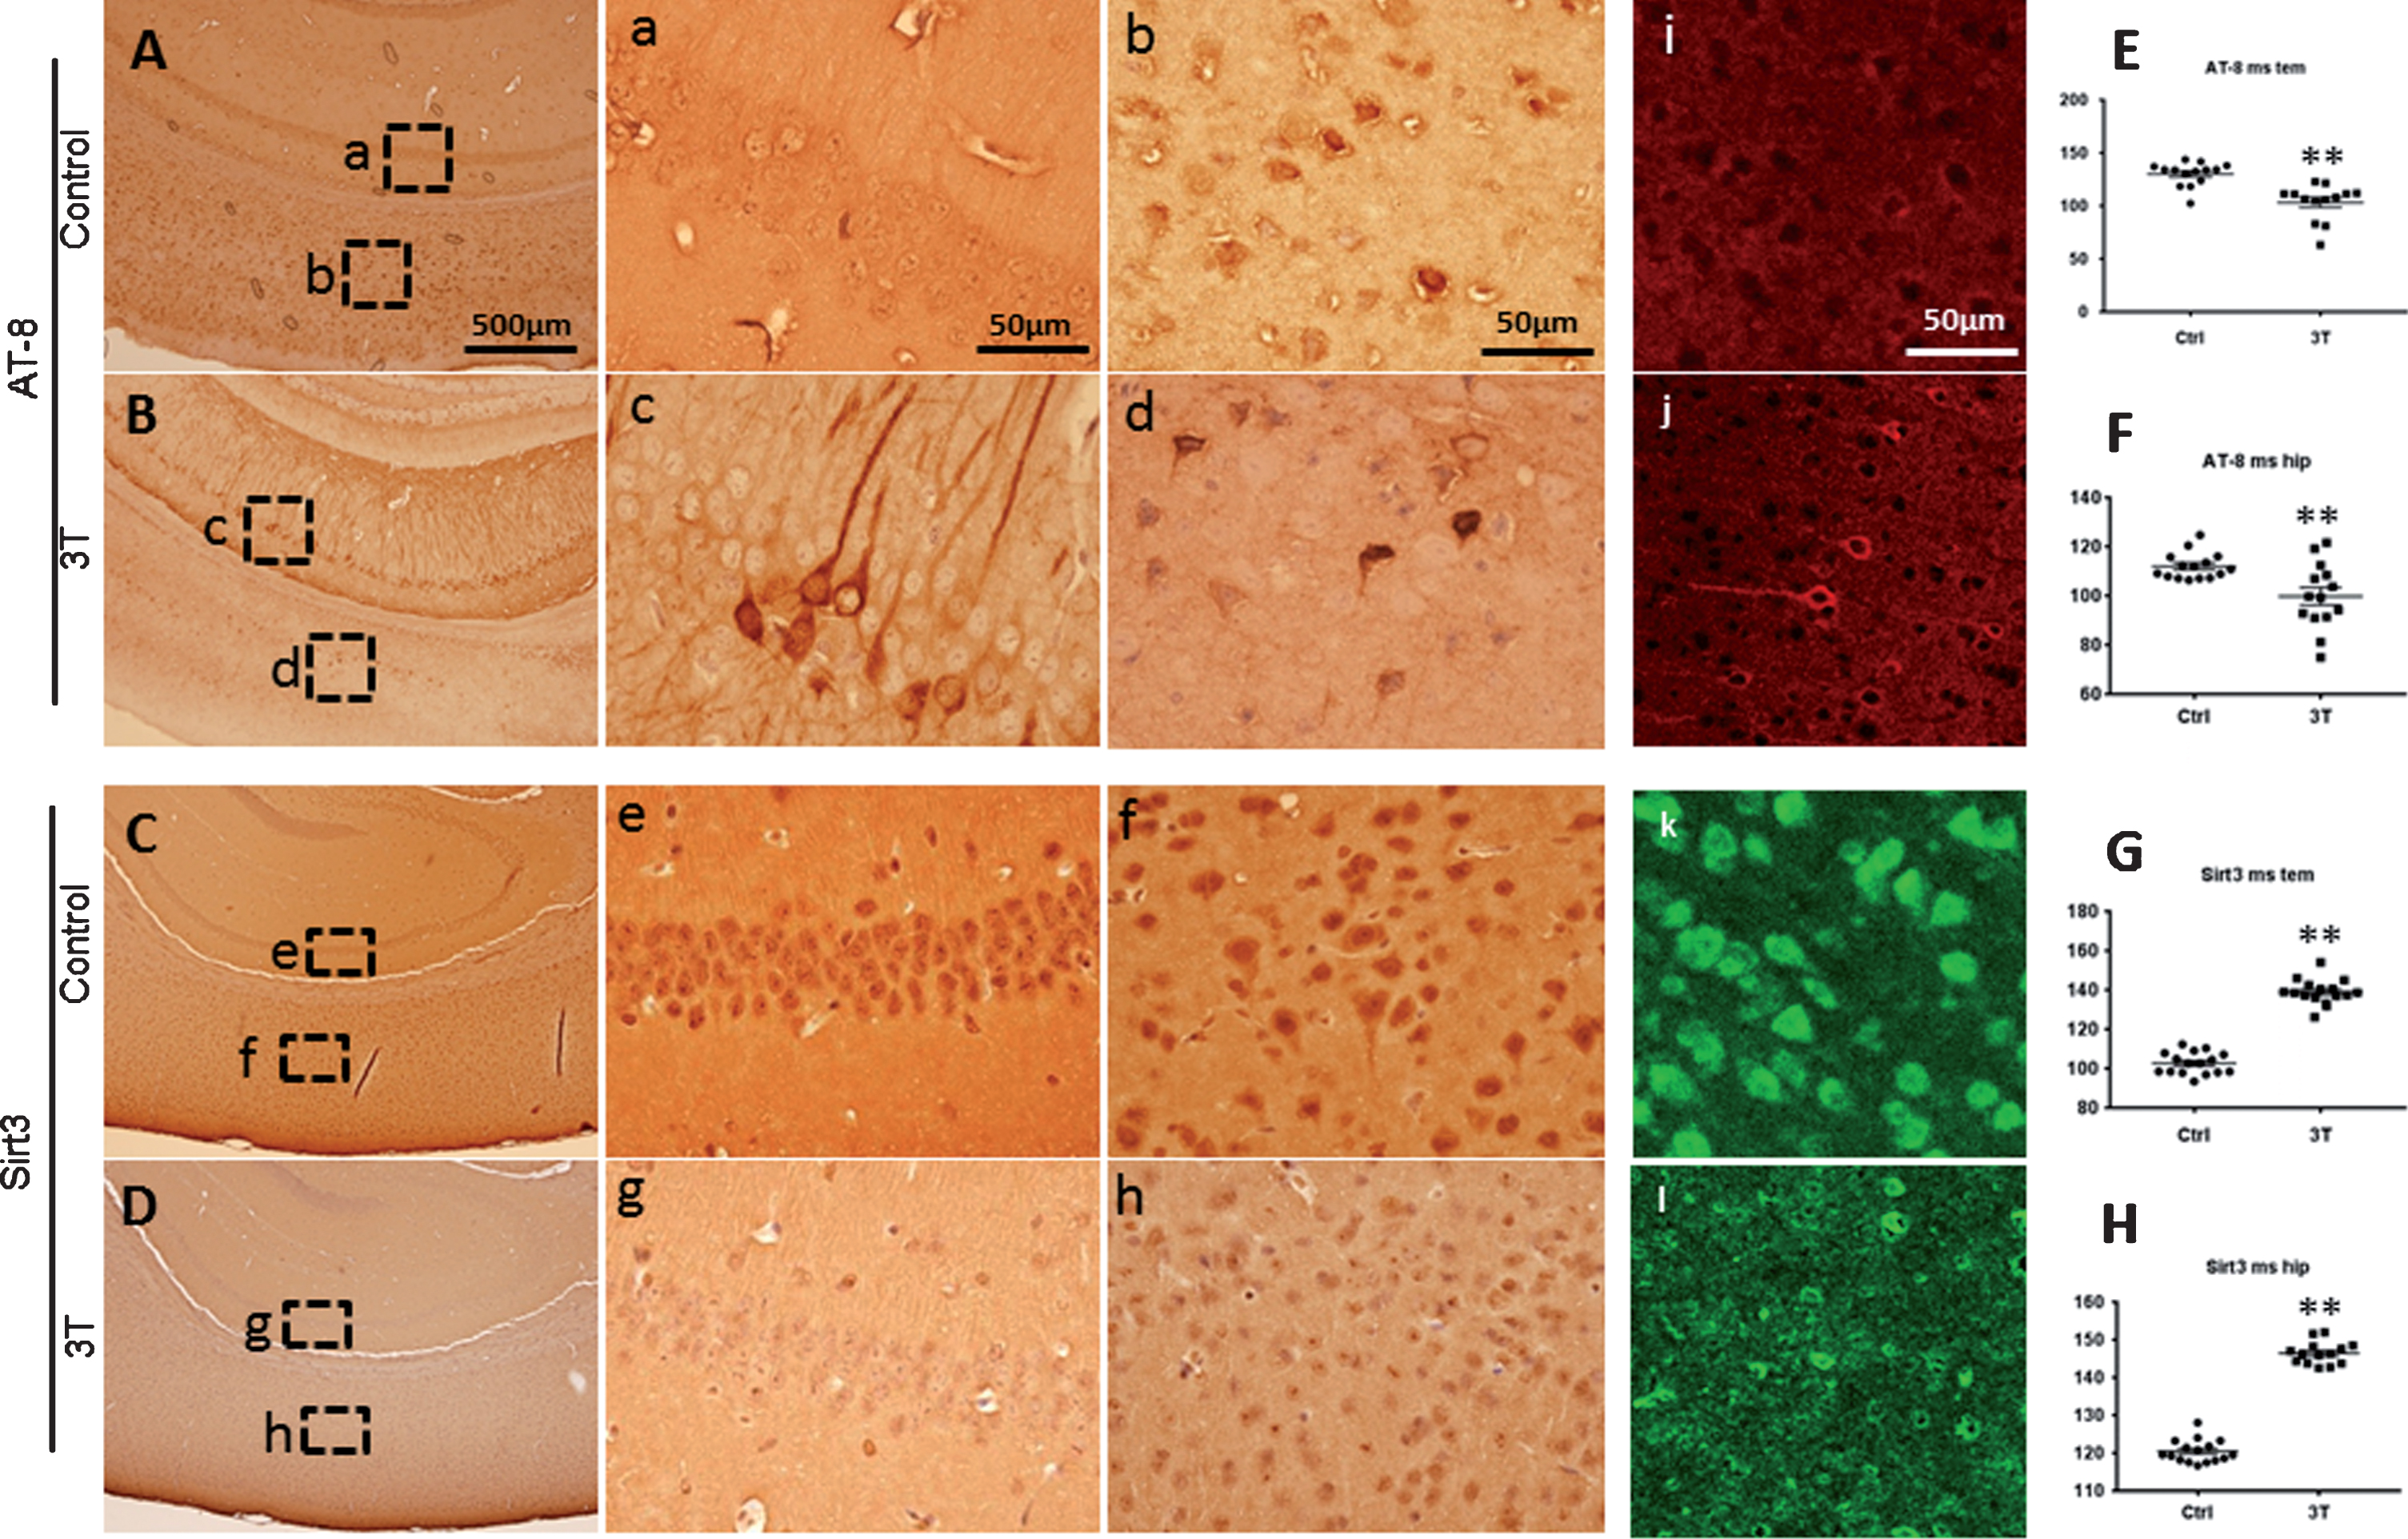
Sirt3 expression was inversely related with tau in temporal cortex and hippocampus of mice. Brain slices from 18-month-old triple transgenic (3T) mice and age-matched control mice were stained with anti Sirt3 antibody and anti-paired helical filament (PHF)-tau (Ser202/Thr205, AT-8) antibody. AT-8 positive staining signaling is very strong in both hippocampus and cortex from 3T mice (B: c, d and j), compared to control mice (A: a, b and i). Sirt3 positive signaling was very weak in both hippocampus and cortex from 3T mice (D: g, h and l), in comparison with stronger signaling in control mice (C: e, f and k). The density of protein expression was quantified and analyzed. For AT-8 positive signaling, scatter plots are showed in E (temporal cortex) and F (hippocampus). For Sirt3 positive signaling, scatter plots are showed in G (temporal cortex) and H (hippocampus). Note: n = 4–5 per group, **p < 0.01.
Sirt3 was inversely related with tangle tau and amyloid plaques in human postmortem brain
Levels of Sirt3, amyloid plaques, and tangle tau were further measured in human postmortem brain slices of subjects with AD, MCI, or CN after stained with anti Sirt3, anti-Aβ antibody, and anti-tangle tau antibody using immunohistochemistry staining. Based on our immunohistochemistry staining, there was extremely strong positive signal for tangle tau and Aβ in AD group in both middle temporal gyrus and superior frontal gyrus. These positive signals became weaker from AD, MCI to CN group (Fig. 2A–F, J–O). For Sirt3, its positive signals became even stronger from AD, MCI to CN group (Fig. 2G–I, P–R). The mean grey value was analyzed and inversely correlated with the positive signal. Quantification data showed the positive signals of tangle tau and Aβ increased dramatically (p < 0.01), and Sirt3 signals decreased significantly (p < 0.01) in the AD and MCI groups, compared to the CN group (Fig. 2S–X). Further immunofluorescent staining including Thioflavin S with Sirt3 double staining and AT-8 with Sirt3 double staining also showed similar results; the signal of tangle tau and amyloid plaque were very strong in the MCI and AD groups, and Sirt3 expression in the CN group was much stronger (Fig. 3).
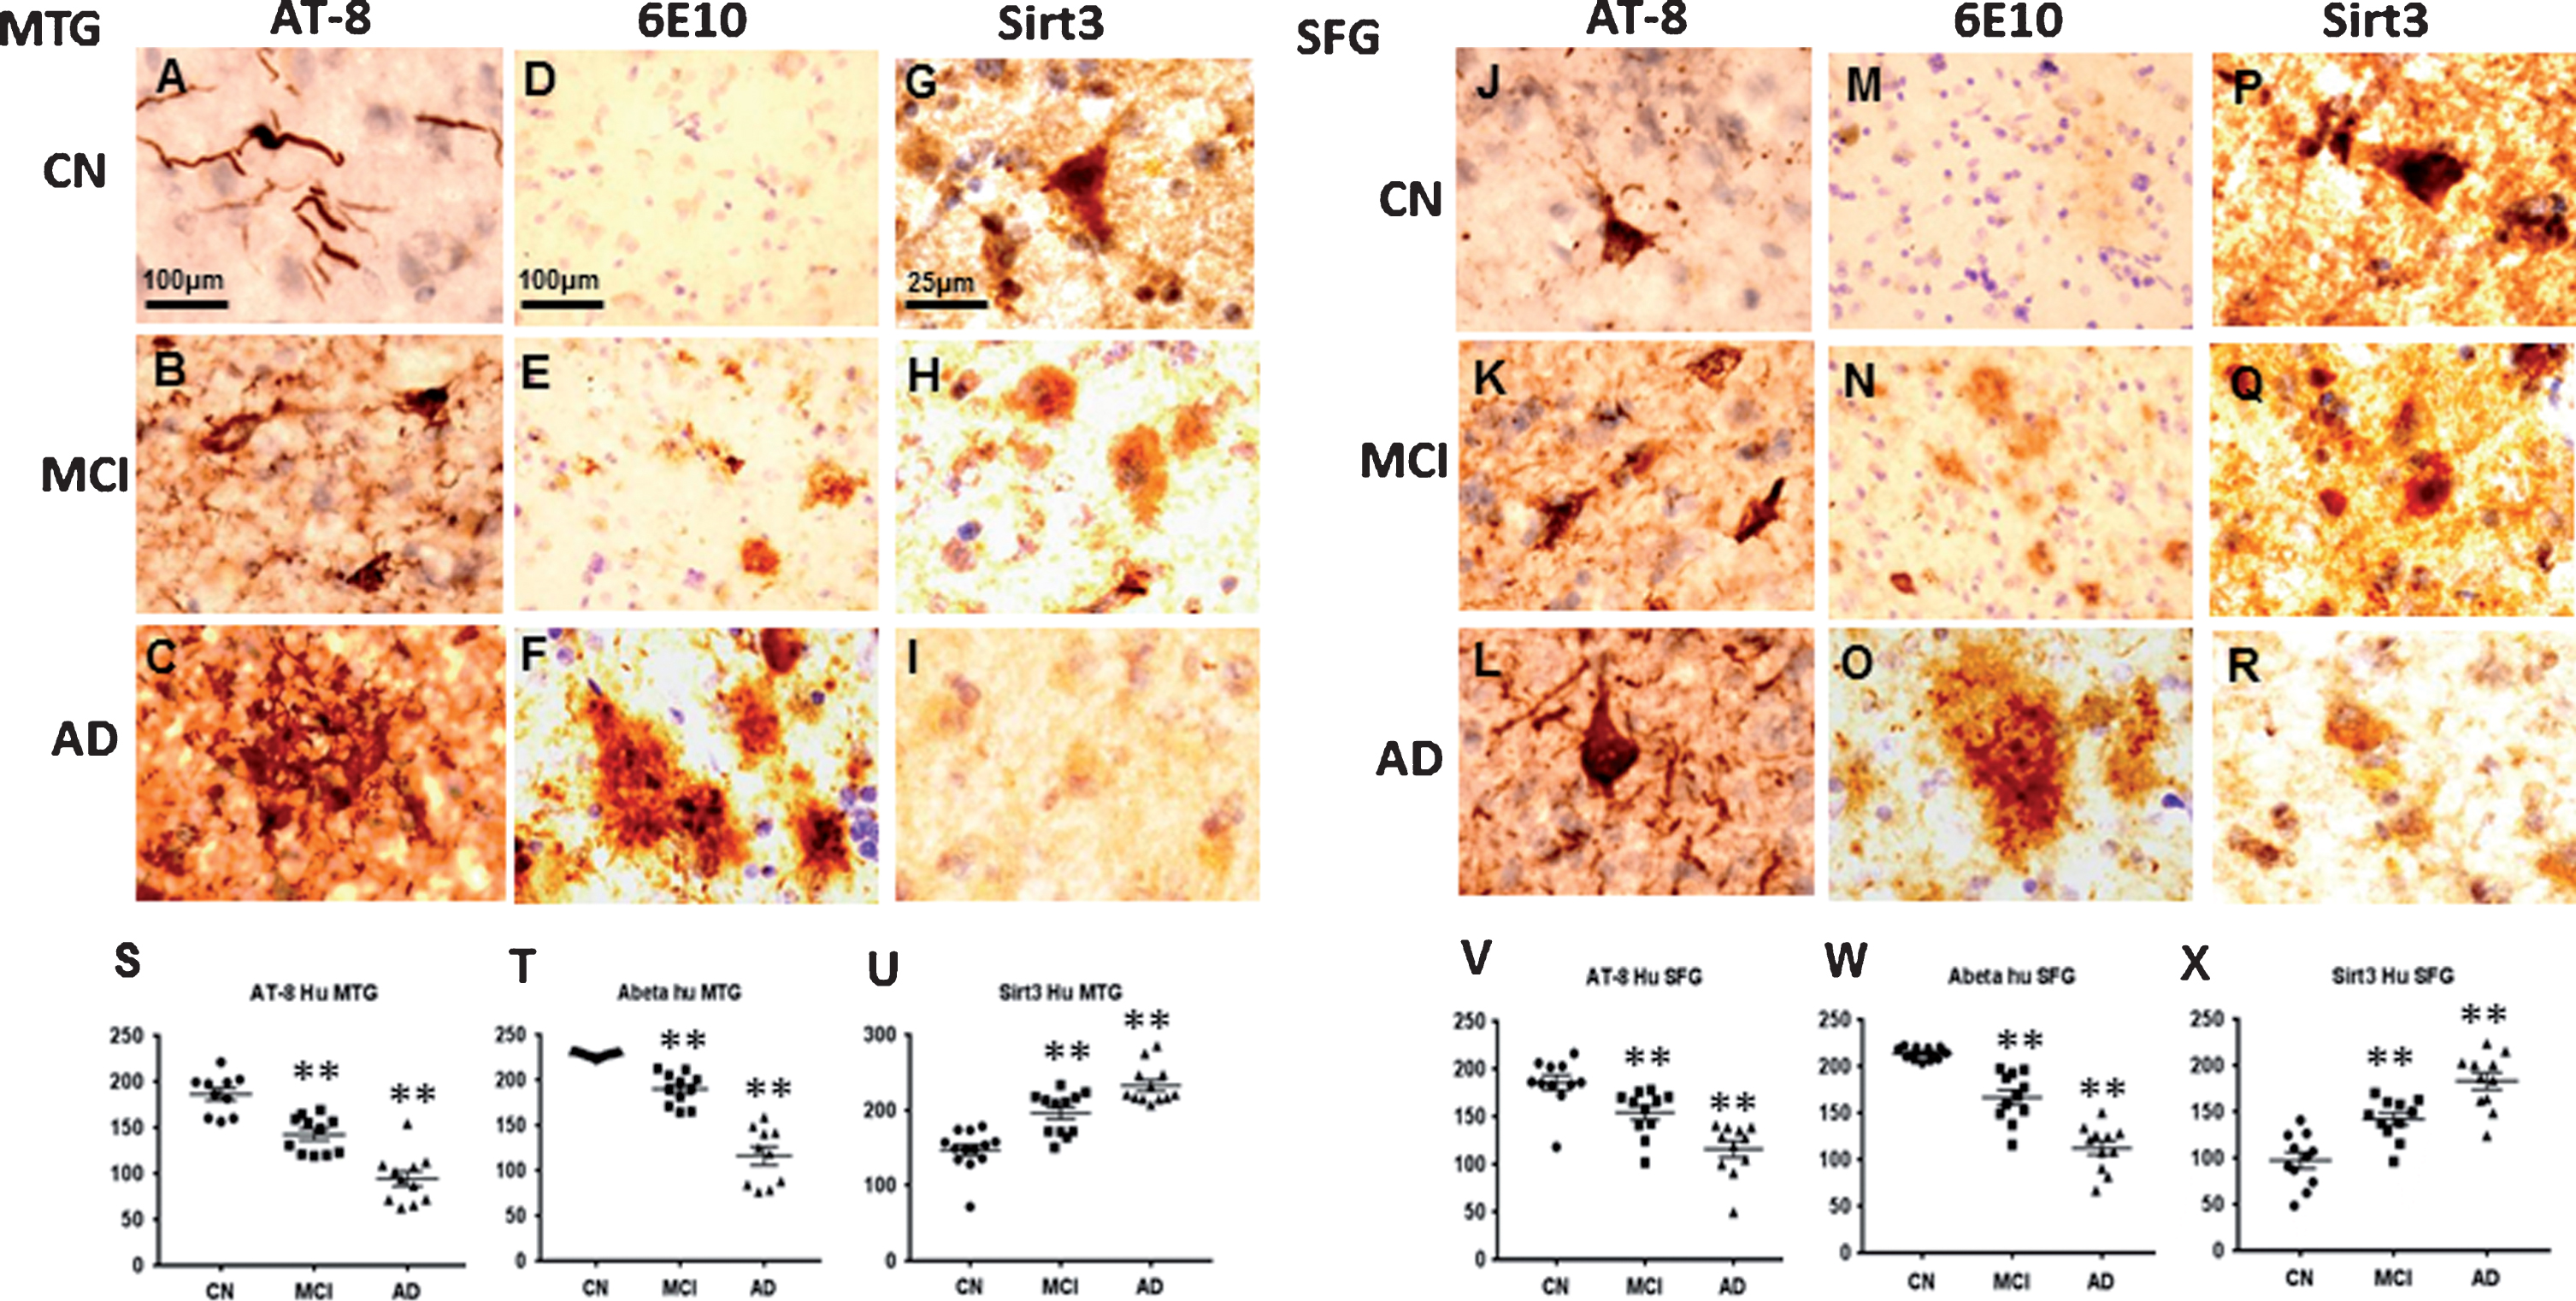
Sirt3 was inversely related with tangle tau and amyloid plaques in human postmortem brain. Human brain slices from middle temporal gyrus (MTG) and superior frontal gyrus (SFG) of subjects with Alzheimer’s disease (AD), mild impairment cognition (MCI), or cognitive normal (CN) were stained with anti Sirt3 antibody, anti- amyloid-β 1–16 (6E10) antibody and anti-paired helical filament (PHF)-tau (Ser202/Thr205, AT-8) antibody. Right panel represents high magnification images from layer V. AT-8 positive signaling and 6E10 positive signaling were weak in MTG and SFG of CN group (A, D, J, and M), AT-8 and 6E10 positive signaling were stronger in MCI group (B, E, K, and N), and AT-8 and 6E10 positive signaling were the strongest in AD patients (C, F, L, and O). The strongest Sirt3 positive signaling was found in CN (G and P), stronger in MCI (H and Q), and weak in AD (I and R). The densities of protein expression were quantified and analyzed. In MTG brain area, scatter plots are showed in S (AT-8 positive signaling), T (6E10 positive signaling), and U (Sirt3 positive signaling). In SFG brain area, scatter plots are showed in V (AT-8 positive signaling), W (6E10 positive signaling), and X (Sirt3 positive signaling). Note: n = 4–5 per group, **p < 0.01.

Sirt3 was inversely related with tangle tau and amyloid plaques in human postmortem brain. Brain tissues from superior frontal gyrus were stained with Thioflavin S (Thio-S) and SIRT3 double staining. There was very strong Thio-S positive staining (green color: red arrow for amyloid plaque, yellow arrow for neural fibrillary tangle) and very weak SIRT3 positive staining (red color) in an AD patient’s brain slice (A). Compared to an AD patient, there was weak Thio-S positive staining and strong SIRT3 positive staining in an MCI patient’s brain slice. Scale: 20μm.
Sirt3 bioactivity declined and total tau protein increased in AD model cells
In this in vitro experiment, hippocampal HT22 cells were treated with oligo Aβ42 to imitate the AD pathophysiological situation. Intracellular adenosine triphosphate (ATP, an important Sirt3 bioactivity parameter), Sirt3 levels, and total tau level were measured in this AD model cells. Data showed the intracellular ATP concentration in HT22 cells decreased gradually and significantly with increasing oligo Aβ42 from 10 to 5000 ng/ml, p < 0.01 compared to the no amyloid treatment group (Fig. 4A). Sirt3 expression was downregulated and total tau was upregulated in imitated AD model cells (Fig. 4B). After normalization with internal control beta actin, Sirt3 protein level decreased and total tau protein level elevated with increasing Aβ concentration, p < 0.05 or p < 0.01 compared with no Aβ treatment (Fig. 4C, D).
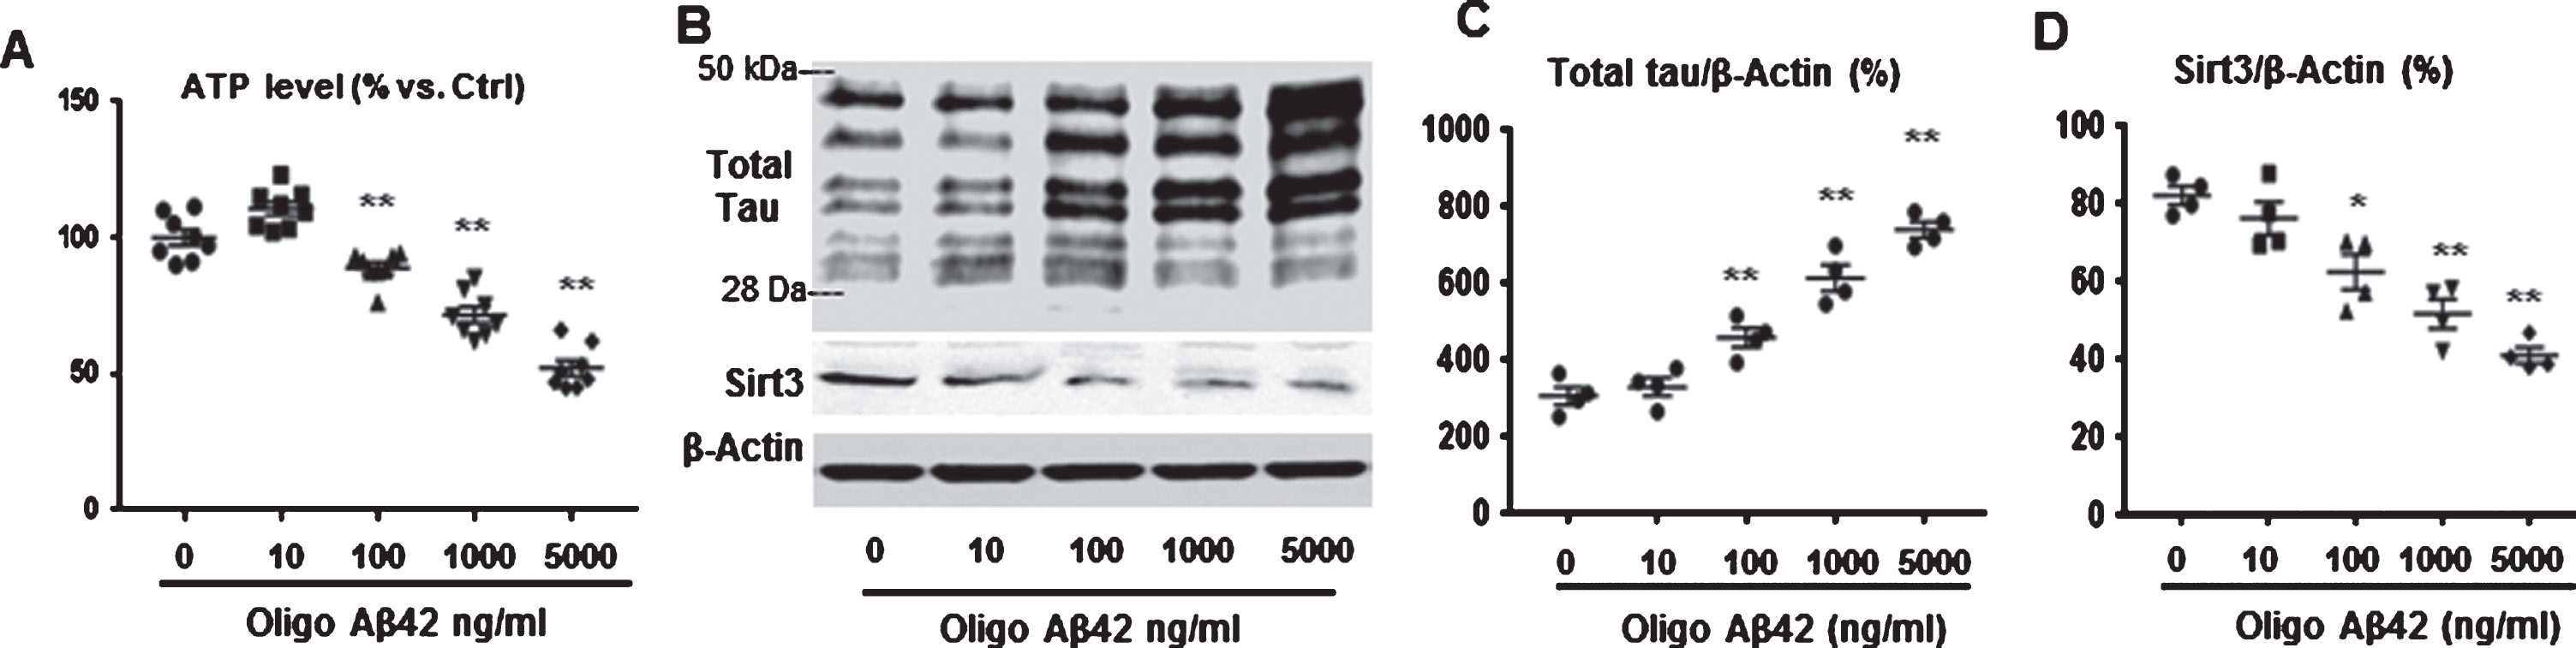
Sirt3 bioactivity was declined and total tau protein was increased in AD model cells. A) Intracellular ATP levels in HT22 cells were evaluated after oligo Aβ42 (10, 100, 1000, and 5000 ng/ml) treatment for 24 h. Data were normalized with control group (100%). B) HT22 cells were treated with oligo Aβ42 for 24 h. Total tau (Tau 5) and Sirt3 levels were detected by western blot (B). β-actin was used as an internal control. C) Total tau was increased with increasing oligo Aβ-42. D) Sirt3 was decreased with increasing oligo Aβ42. Note: n = 4 per group, *p < 0.05, **p < 0.01.
Sirt3 regulated tau acetylation
Our further experiment was to investigate the role of Sirt3 on tau acetylation. Hippocampal HT22 cells were transfected with Sirt3 cDNA or Sirt3 shRNA, and acetylated tau was specifically measured under Sirt3 overexpression or knockdown condition. After Sirt3 successful transfection, purifications of transfected cells were collected for protein levels test, including total tau, acetylated tau, and Sirt3 using immunoprecipitation/western blot. Total tau, acetylated lysine (vector 38.0±1.8%, shRNA 65.2±3.1%, and Sirt3 cDNA 26.1±2.5%), and acetylated tau were significantly increased in shRNA group and dramatically decreased in the Sirt3 cDNA group compared to the vector group (Fig. 5A–C).

Sirt3 regulated tau acetylation. Overexpression and knockdown of Sirt3 were performed in hippocampal HT22 cells. After 7 days transfection, flow cytometry was used to identify and sort the successfully transfected HT22 cells with vector, Sirt3cDNA or shRNA. A) Transfected HT22 cells were treated with oligo Aβ42 (1000 ng/ml) for 24 h. Total tau acetylated lysine (Ac) and Sirt3 were detected by western blot. Proteins levels were normalized with β-actin. Immunoprecipitation/western blot were used detect acetylated tau in transfected HT22 cells with vector, Sirt3 cDNA or shRNA. Total tau (B), acetylated lysine (C) and acetylated tau were increased in shRNA group and decreased in Sirt3 cDNA group compared to vector group. Note: n = 3 per group, *p < 0.05, **p < 0.01.
DISCUSSION
In this study, we found Sirt3 levels were reversely related with tau protein in brain slices from both human and AD model mice. Mechanistically, tau acetylation was dramatically reduced following Sirt3 overexpression while increased under Sirt3 knockdown in hippocampal HT22 cells. This data provided further evidence that Sirt3 plays a role in tau acetylation and could be a potential therapy target in order to alleviate tau aggregation.
Tau acetylation affected tau function and promoted tau aggregation [1]. Tau acetylation was found at an early stage or all stages in AD brains and was thought as a critical determinant in tau toxicity [20]. Reducing tau acetylation decreased the levels of total tau and acetylated tau, rescued tau-induced memory deficits, and prevented hippocampal atrophy in mice [2].Therefore, tau acetylation was thought as a potential target for delaying tau pathology. In our previous report, we found that higher levels of Sirt3 quantified by standard ELISA in middle temporal lobe from postmortem human brains were associated with better cognitive performance, including global cognitive ability, naming, verbal learning, and memory. Sirt3 reduction was also associated with the severity of tau pathology, which indicated that Sirt3 may be involved in tau pathological change [6]. Yet, it is not fully understood about the effect of Sirt3 on tau acetylation. Previous reports from our and others found that Sirt3 was downregulated in AD [6, 22]. In this study, we found Sirt3 was inversely associated with tangle tau and amyloid plaque in human postmortem brains and AD mice brains. Mechanistically, tau acetylation was changed with Sirt3 overexpression or knockdown in AD model cells. Together with our previous studies, Sirt3 may play an important role in tau acetylation and could be a potential therapy target to alleviate tau aggregation.
Footnotes
ACKNOWLEDGMENTS
This work is funded by the National Institute on Aging (P30 AG19610 Arizona Alzheimer’s Disease Core Center), the Arizona Department of Health Services (Contract 211002, Arizona Alzheimer’s Research Center), Barrow Neurological Foundation (Contract 3032226); the Flinn Foundation (Contract 2190) and the National Science Foundation of China (81671050).