
Abstract
In Alzheimer’s disease (AD), disturbances in the circadian rhythm and sleep-wake cycle are frequently observed. Both are controlled by the master clock: the suprachiasmatic nucleus (SCN), which was reported in postmortem studies of AD subjects to be compromised. However, the influence of age and gender on the biophysical integrity and subtle microstructural changes of SCN and mechanistic connections between SCN dysfunction and AD progression in vivo remain to be explored. In the present study, we utilized state-of-the-art in vivo magnetic resonance relaxation measurements in combination with immunohistochemistry to follow microstructural changes in SCN of the Tg2576 mouse model of AD. Longitudinal monitoring of in vivo T2 relaxation with age shows significant shortening of T2 values in the SCN of transgenic mice and more substantially in female transgenic than aged-matched controls. Multiexponential T2 analysis detected a unique long T2 component in SCN of transgenic mice which was absent in wild-type mice. Immunohistochemical examination revealed significantly elevated numbers of activated astrocytes and an increase in the astrocyte to neuron ratio in SCN of transgenic compared to wild-type mice. This increase was more substantial in female than in male transgenic mice. In addition, low GABA production in SCN of transgenic mice was detected. Our results offer a brief appraisal of SCN dysfunction in AD and demonstrate that inflammatory responses may be an underlying perpetrator for the changes in circadian rhythmicity and sleep disturbance in AD and could also be at the root of marked sex disparities observed in AD subjects.
INTRODUCTION
The suprachiasmatic nucleus (SCN) is assigned as the master clock in mammals, which enables anticipation and adaptation to the day night cycle. Individual neurons of the SCN are capable to generate circadian rhythms in a cell autonomous manner, displaying cyclic expression of clock genes and proteins [1, 2]. The later lead to a rhythm in membrane excitability, in electrical activity and in a rhythmic release of humoral signals resulting in several rhythmic physiological processes [2]. The neurotransmitter γ-aminobutyric acid (GABA) is important for synchronization of tissue-level rhythms and intercellular signaling in the SCN [3–5], and is the only neurotransmitter that is produced and received by nearly all SCN neurons [6, 7]. GABA is densely distributed in the SCN and located in the majority of neuronal somata and synaptic terminals [8]. Nevertheless, the role of GABA in the SCN is still not well understood.
The disruption of circadian rhythms and sleep wake cycle are common symptoms in Alzheimer’s disease (AD) and senescence [9–12]. Disturbances in circadian rhythms of human AD patients [13] and in several AD mouse models [14, 15] have been reported. The evidences for SCN abnormalities seen in AD mainly derived from postmortem studies. These studies reported an alteration in the neuronal structure and function of the SCN during senescence and AD [13–15]. The changes in biophysical integrity and subtle microstructural changes in SCN during AD in vivo and its role in disease onset and progression remain unclear. Emerging evidence suggests that females are at greater risk of developing AD dementia [16–18], but the molecular mechanism accounting for sex-related differences in AD remains unknown. A morphometric study of SCN in the human brain revealed that the shape of the SCN in healthy subjects is sexually dimorphic, although SCN volume and cell number were equal in men and women [11]. A decline in SCN volume and cell number occurs during senescence as well as in AD patients [12]. Vasoactive intestinal polypeptide cell number, in particular, decreases more significantly in pre-senile AD female patients than male patients [12]. Thus, the SCN shows gender differences in healthy subjects and AD patients. Up to now, no in vivo studies so far addressed whether and how sex differences in SCN is related with progression of AD pathology.
The quantitative transverse relaxation time (T2) measurement has proven to be a powerful non-invasive magnetic resonance imaging (MRI) tool which provides specific information about changes in tissue microstructure such as demyelination, axonal injury, gliosis, and iron deposition [19–22] and can be used as a marker for the assessments of normal aging and a variety of brain diseases including AD [23–25]. In a long-term follow up traumatic brain injury study, a clear relationship was established between T2 relaxation time and the power spectrum of the electroencephalogram [26]. Furthermore, multicomponent T 2 relaxation analysis is very sensitive to distinguish between various tissue water compartments and to distinguish the processes of inflammation and myelin loss [27]. Thus, monitoring in vivo T2 changes in SCN during AD progression and examining changes in multicomponent T 2 relaxation may provide evidence for dynamic microscopic changes in the SCN, yielding new insights into the biophysical complexity of the underlying circadian rhythm disturbances in AD. Studies using transgenic mouse models of AD have the potential to clarify these in vivo changes in SCN. Tg2576 is a widely used model of AD, which develops amyloid-β (Aβ) plaques (one of the main hallmarks of AD) and it shows a progressive learning and memory impairment [28]. Previous studies employing electroencephalography have reported changes in the circadian rhythms and sleep abnormalities of the Tg2576 AD mouse model [29].
In this study, in vivo T2 analysis along with immunohistochemistry has been applied to identify and characterize age and gender-specific changes in SCN during progression of AD pathology in the Tg2576 mouse model. Our results show that inflammatory responses disturbed the biophysical integrity of SCN in Tg2576 mouse brain and a disruption of the SCN may be accountable for the gender-specific differences in the circadian rhythmicity that have been observed in AD patients.
MATERIALS AND METHODS
Mouse model
The transgenic Tg2576 mice used in this study express as transgene the human amyloid precursor protein (APP695) carrying the Swedish double mutation [28]. The transgene is expressed in C57B6/SJL breeders. The N2 generation mice of both genders (10 male and 10 female) were studied at ages between 10 and 18 months. Age-matched non-transgenic littermates (10 male and 10 female) served as controls. All animal experiments were approved by the Landesdirektion Sachsen (license T28/16) and UDEC commission Leiden University (license number 14199). All methods were carried out in accordance with the relevant guidelines and regulations.
Brain preparation and histology
Following in vivo MR measurements, mice were sacrificed by CO2 inhalation and transcardially perfused with phosphate-buffered saline (PBS, pH 7.4) followed by 4% buffered paraformaldehyde (Zinc Formal-Fixx, ThermoShandon, UK) through the left cardiac ventricle. After perfusion fixation the brain was dissected out and placed in the same fixative for 48 h. Following fixation, the brain was dehydrated and embedded in paraffin. Subsequently coronal sections (30μm thick) were carefully cut using a vibratome while maintaining as much as possible the same spatial orientation of mouse brain as in the MR imaging experiments as described previously [30]. To stain activated astrocytes, brain sections were subjected to immunohistochemistry using a primary polyclonal anti-GFAP (glial fibrillary acidic protein) antibody (DAKO) as described earlier [17]. Immunolabeling was visualized by using the ABC kit (Vectastain) according to the manufacturer’s instructions. Images of the histological sections were obtained using a Leica DM RE HC microscope, interfaced to a Leica DC500 3CCD digital camera.
For preparing sections for fluorescent labelling, after perfusion brains were dissected and placed in the same fixative for 24 h at 4°C. After cryoprotection in 30% sucrose in 0.1 M phosphate buffer for 3 days, coronal sections (30μm) were cut on a sliding microtome and collected in 0.1 M phosphate buffer containing 0.025% sodium azide. For fluorescent labelling of Aβ deposition using thioflavin-S (ThS), sections were incubated with 1% ThS (Sigma) for 20 min, followed by 40 min incubation in 80% ethanol and a final rinse in distilled water, dehydrated in toluene and covered with coverslip using Entellan. For fluorescent immunolabeling, mouse brain slices were pretreated with 60% methanol (30 min), followed by washes in 0.1 M TBS and blocked in TBS containing 0.3% TitonX-100 and 5% goat serum for 30 min. Subsequently slices were incubated overnight with a Cy3-conjugated mouse anti-GFAP antibody (for labelling of astrocytes) (1 : 1,000), mouse-anti-NeuN (for labelling of neuronal nuclei) (clone A60; 1 : 100; MAB 377, Millipore, Billerica, MA, USA) and rabbit anti-GAD antibody (for GABAergic neurons) (1 : 4,000). After washing in PBS three times, sections were incubation with corresponding fluorescence secondary antibodies (Dianova 1 : 400) for 1 h.
Confocal laser scanning microscopy (LSM 510, Zeiss, Oberkochen, Germany) was performed to reveal co-localization of GFAP, NeuN, GAD and ThS staining. ThS (green fluorescence) was visualized by excitation with an argon laser at 488 nm and detection of emission at 510 nm using a low-range band pass (505–530 nm). For Cy3-labelled antigens (red fluorescence), a helium–neon laser with 543 nm excitation was used and emission from Cy3 at 570 nm was detected applying high-range band pass (560–615 nm). The Cy5-labelled antigens were visualized using excitation at 650 nm and emission at 670 nm. Specificity of primary antibody and immunoreaction was confirmed by omitting primary antibodies or changing probes of the secondary antibodies.
MRI experiments
All MRI measurements were performed using 750 MHz (17.6 T) vertical 89 mm bore magnets equipped with a 1 Tm–1 actively shielded imaging gradient insert (Bruker, Germany). A birdcage radio-frequency (RF) coil with an inner diameter 2 cm was used for excitation and detection. The system was interfaced to a Linux PC running Topspin 2.0 and ParaVision 5.0 software (Bruker Biospin GmbH, Germany).
For in vivo μMRI measurements the mice were anesthetized with 2% isoflurane (Forane, Abbott, UK) in air (0.3 L/min) and oxygen (0.3 L/min). During scanning the level of anesthetic was maintained between 1 and 1.5% to keep the breathing of the animal at a constant rate of ∼50 breaths per minute and the respiration rate was constantly monitored using a respiration sensor, (placed on the animal’s abdomen) connected to a respiration unit. The respiration unit was connected to a computer with Bio-SAM respiration monitoring software (Bruker Biospin, Germany). The mouse’s body temperature was kept at a constant temperature by pumping warm water through the gradient system. Cooling of the gradient was performed by circulating water.
T2 relaxation time were measured with the Multi-Slice, Multi-Echo (MSME) sequence which is based on the Carr-PurcellMeiboom-Gill (CPMG) sequence, where transverse magnetization of a 90° pulse is refocused by a train of 180° pulses generating a series of echoes [31, 32]. The following imaging parameters were used: Number of averages (NA) = 2; Number of slices (NS) = 10; Number of echoes = 12 with echo spacing = 6.064; A repetition time (TR) = 2 s with an effective spectral bandwidth = 100 kHz; Field of view (FOV) = 2.0×2.0 cm; Matrix size = 256×256; This yields an effective in-plane resolution of 0.078×0.078 mm and a voxel resolution of 6.10×10⁻³ mm3. The total acquisition time for the experiment was 17 min and 2 s. To study the dependence of T2 on the CPMG refocusing interpulse interval (τ), the T2 measurements were performed using the MSME sequence with 16 echo and 4 different refocusing interpulse intervals, namely 5.6, 8.5, 10, and 18 ms. The last 5 echo of 8.5 ms acquisition, the last 7 echo of 10 ms acquisition and the last 10 echo of 18 ms acquisition were discarded to provide comparable temporal sampling windows (namely, 5.6–91.04 ms, 8.5–93.50 ms, 10–90 ms, 18–90 ms acquisitions, respectively). For the precise localization of regions of interest (ROIs) on the brain regions for T2 measurements, a pilot scan of a mouse brain was acquired with multi-slice rapid acquisition using the relaxation enhancement (RARE) sequence [33] and subsequently ROIs were transferred to T2 maps to ensure precise regional placement. The following imaging parameters were used for the RARE sequence: Echo time (TE) = 8.5 ms; TR = 2000 ms; NA = 1, rare factor = 6; NS = 10, with slice thickness 0.5 mm. To establish the test–retest reliability of T2 measurements and to check systematic errors, the same C57BL6/SJL mice (n = 5) were scanned twice on two subsequent days.
Data processing
Estimation of T2
For the estimation of T2 values, selected regions of interest (ROIs) were manually drawn on the images by using an image sequence analysis (ISA) tool package (Paravision 5, Bruker). Monoexponential fitting was then used to calculate T2 using a monoexponential fit function [y = A + C*exp (–t/ T2)], where A = Absolute bias, C = signal intensity, T2 = transverse relaxation time [22, 34]. ROIs were defined for the SCN, hippocampus, cingulate cortex and piriform cortex on a T2-weighted image using the “Allen Brain Atlas” with the brain explorer program (http://mouse.brain-map.org) as the reference atlas. For all animals, the T2 was the mean of the ROIs drawn on the right and left sides of the brain.
Nonnegative least-squares (NNLS) algorithm for T2 component analysis
The T2 decay curve was also fitted to a multicomponent T2 model. Decay curves were decomposed into an arbitrary number of exponential components using the NNLS algorithm. The NNLS procedures were implemented using the MATLAB codes (MathWorks, Natick, MA) and carried out to analyze the optimum solution of the data from imaging experiments using the “lsqnonlin” function. The signal intensities as a function of the echo time in MRI methods can be written as:
Image analysis of brain sections
For quantitative analysis of histological images, the brain regions (SCN, cingulate cortex, piriforn cortex, and hippocampus) were outlined according to the “Allen Brain Atlas” with the brain explorer program (http://mouse.brain-map.org) as the reference atlas from histological images using PhotoShop. Subsequently, the delineated brain regions were exported and analyzed in ImageJ software (ImageJ, USA). By using the plug-in color deconvolution, the colors were unmixed and the stained area was selected, and subsequently, the number of particles were calculated by using a plug-in called Image-based Tool for Counting Nuclei (ITCN). The percentage of the total Aβ area was calculated using analyze particles. The data were exported to Origin Pro v. 8 software for further analysis. For image co-registration, immunohistological images were matched with each other using common anatomical landmarks such as the ventricles, corpus callosum, and hippocampal fissure using PhotoShop 7.0 (Adobe Systems, San Jose, CA).
Statistics
All statistical analyses (t-test and analysis of variance) of the MRI and histological quantifications were performed with Origin Pro v.8. The paired and/or unpaired Student’s t-test was used to compare mean values. Statistical significance was assigned for values of p < 0.05. Kolmogorov-Smirnov normality tests were performed which confirmed that the longitudinal T2 relaxation data were normally distributed for a particular age and genotype with a probability ranging from 0.5 to 0.9. A Kruskal-Wallis one-way analysis of variance along with rank test was implemented on the MR data to compare the median of T2 values for all group comparisons. This method confirms that samples come from the same population for a particular age, sex, and genotype. Tests for homogeneity of variances between different ages (10, 12, 15, and 18 month) were also computed. No statistically significant change in variance was observed in particular age for any genotype. Subsequent Mann-Whitney tests were used to make pairwise comparisons between different mice groups. To assess the reliability of measurements, the intra-class correlation coefficient (ICC2,1) was computed using a two-way random effects analysis of variance (ANOVA) model and the absolute agreement definition [35, 36]. An ICC close to 1.0 indicates high reliability. The ICC can only be 1.0 if the measures are identical.
RESULTS
Prior to the longitudinal T2 study, the test-retest reliability of in vivo T2 measurements was analyzed by imaging the same mice with an interval of 5 days. Figure 1A shows the ROIs used to quantify T2 relaxation time changes in SCN and three other brain regions (cingulate cortex, piriform cortex and hippocampus). Figure 1B shows test-retest reliability results of in vivo T2 measurements in these brain regions of wild-type mice. Reliability was found to be very high for the SCN (ICC = 0.73, p < 0.05) as well as for cingulate cortex (ICC = 0.75, p < 0.05), piriform cortex (ICC = 0.72, p < 0.05) and hippocampus (ICC = 0.66, p < 0.05). No systematic error, as checked by a paired t-test (p > 0.05, n = 5) was observed between the measurements. The effect of CPMG refocusing interpulse interval (τ) on T2 for the SCN and hippocampus regions was examined in order to rule out any influence of magnetic field disturbances on T2 changes. As shown in Fig. 1C, no statistically significant effect of the interpulse interval in the range of interest (6.6 and 12 ms) was observed on the T2 of the SCN as well as of the hippocampus. This data confirms that the changes observed in T2 values in these brain regions depend on variations in tissue properties rather than magnetic field disturbances.
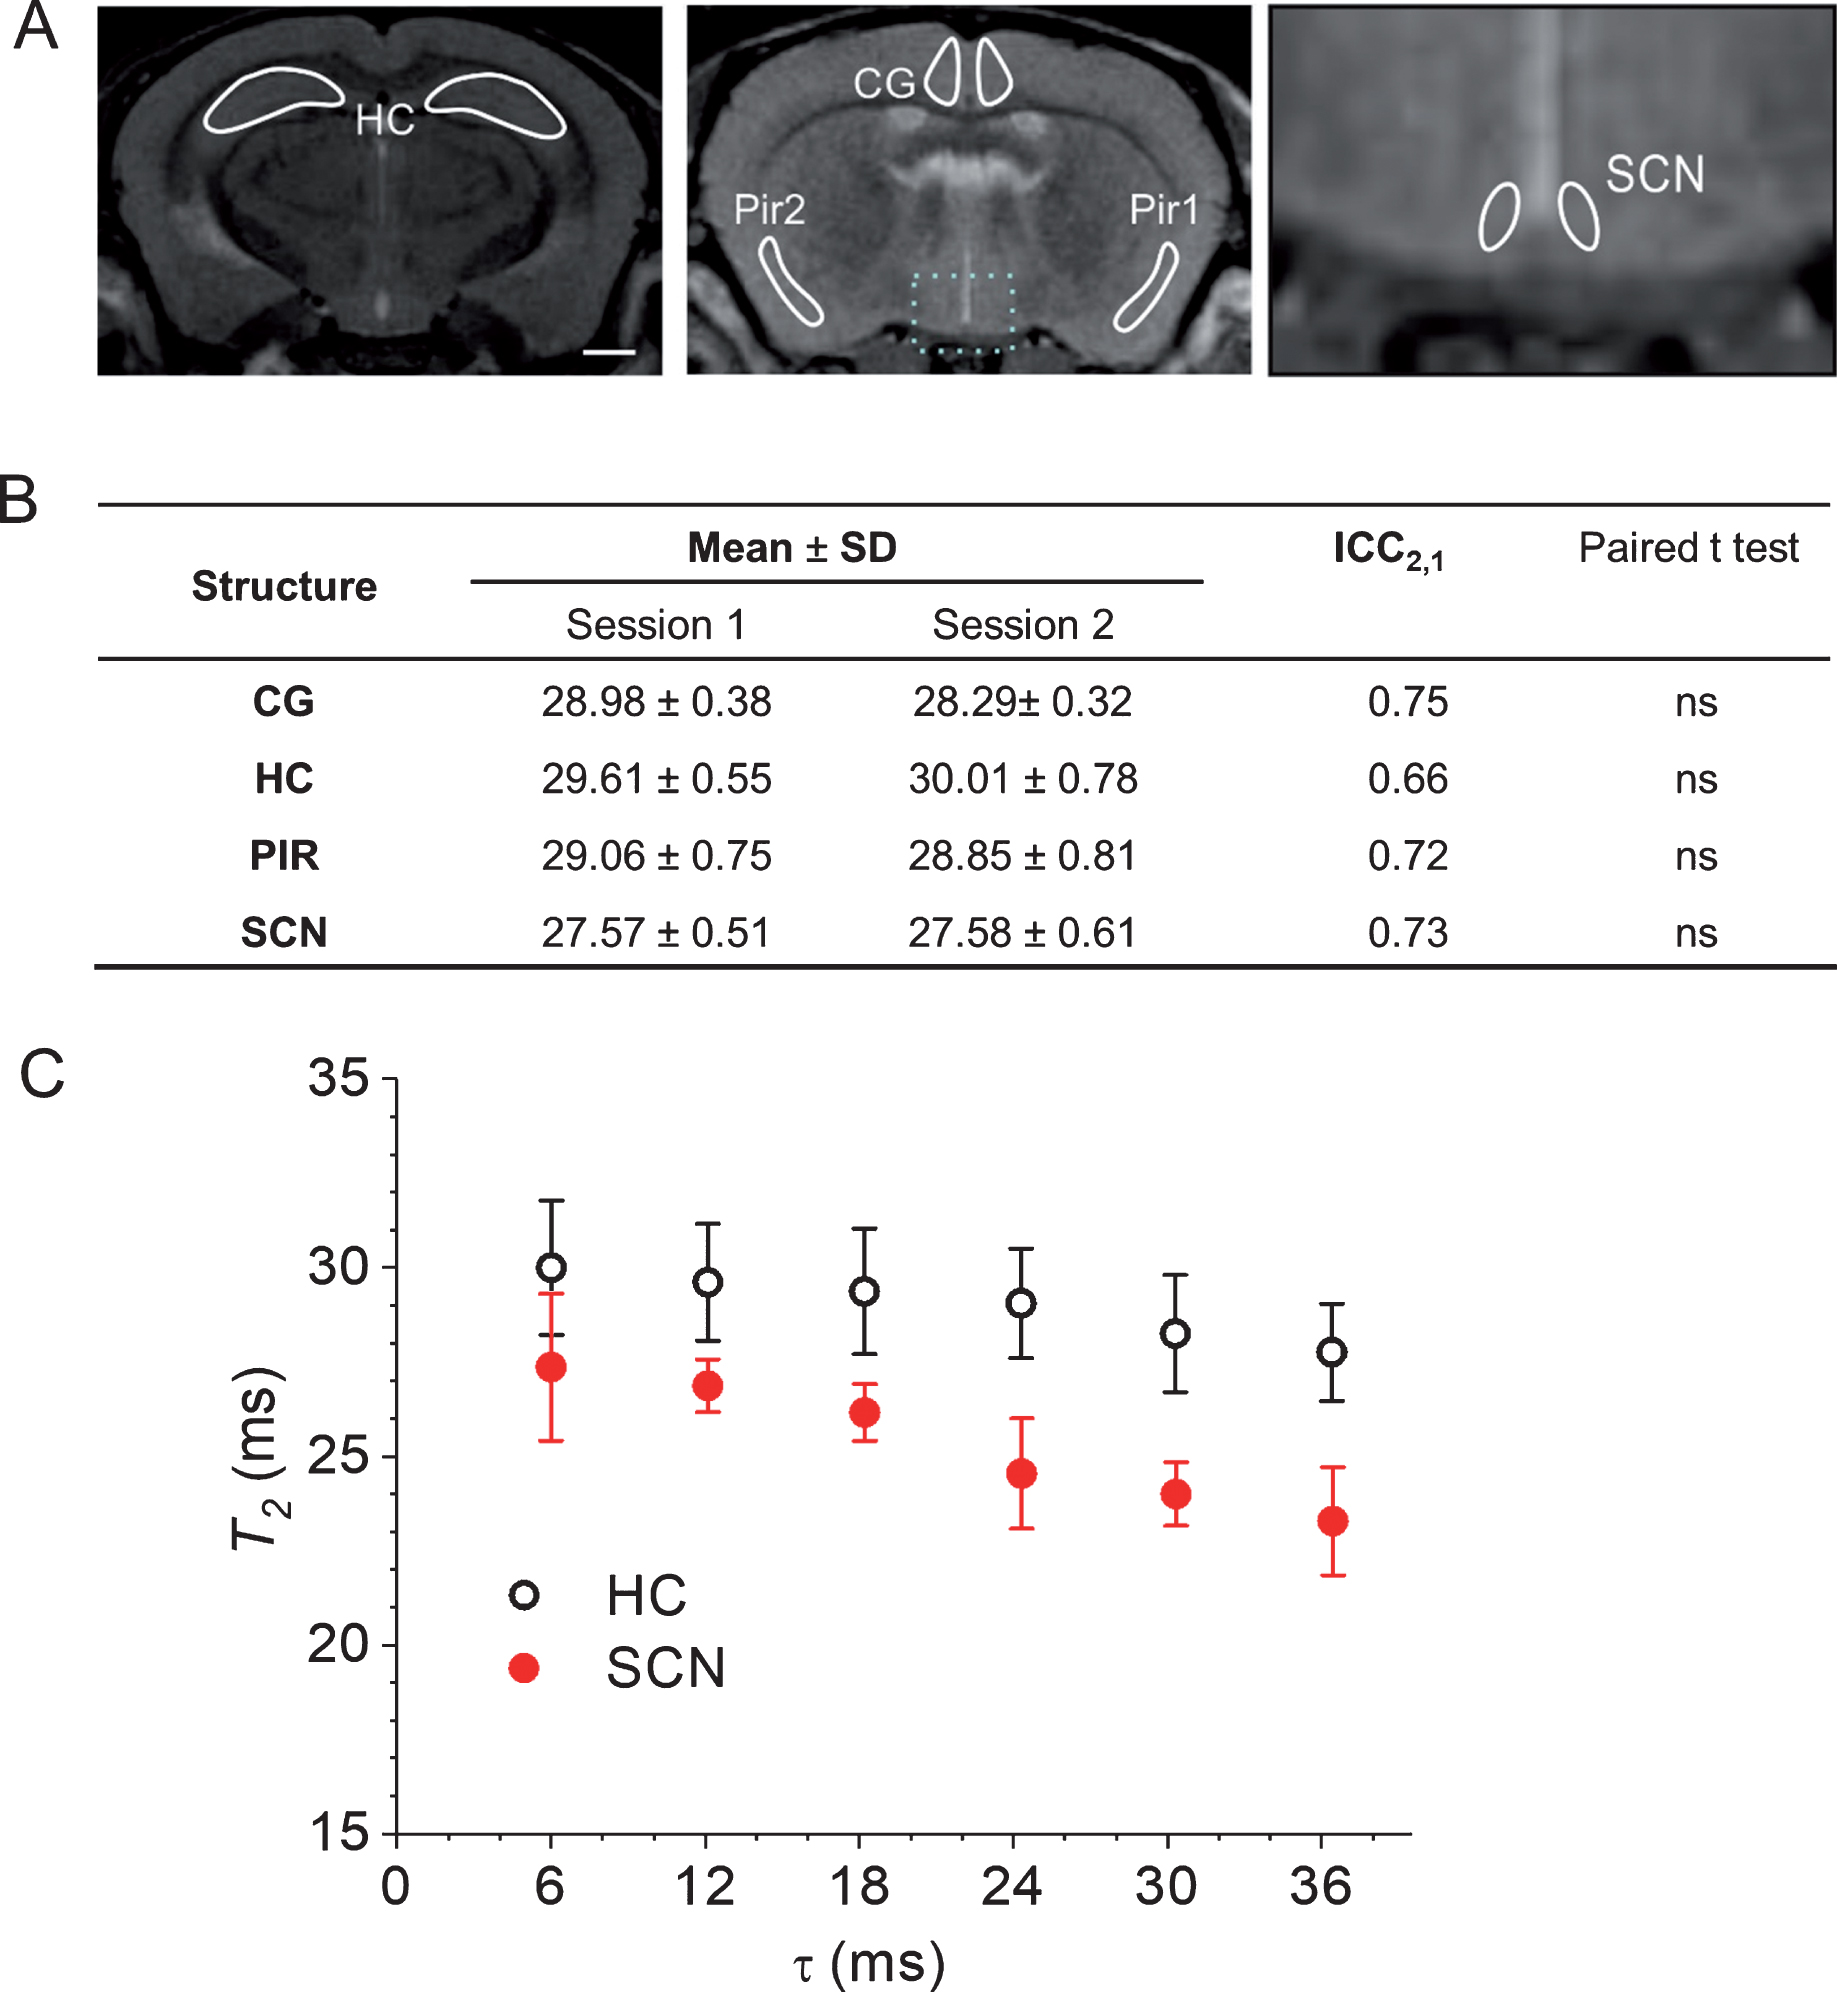
A) Anatomical T2 -weighted MR coronal slices of a mouse brain, showing various brain regions for T2 measurements acquired with the RARE sequence at 17.6 T. Scale bar, 750μm. B) Test-retest reliability of in vivo T2 measurements in a variety of brain regions performed by intra-class correlation coefficient (ICC2,1) using a 2-way random effects ANOVA (subject by session) and the absolute agreement definition. There is a one-day interval between session 1 and session 2 measurements performed on the same mice. T2 values are presented as means from five subjects±SD. Paired t-test results collected from the same mice in two sessions show no significant (NS) difference in all cases (p > 0.05, n = 5). C) Effect of refocusing interpulse interval (τ) on T2 in the SCN and HC regions. T2 values were measured using the multi-slice multi-echo sequence with 4 different τ values namely 6.1, 12.2, 18.3, 24.4, 30.5, and 36.6 ms. Values are expressed as mean T2 in ms±standard deviation (error bars); n = 3. CG, cingulate cortex; PIR, piriform cortex; HC, hippocampus; SCN, suprachiasmatic nucleus.
The T2 values of SCN and other brain regions of male and female Tg2576 and wild-type mice are given in Fig. 2. Clearly, the T2 values of the hippocampus, cingulate, and piriform cortex of the 18-month-old Tg2576 mice showed a significant decrease as compared to the age-matched wild-type mice. The decline in hippocampal T2 relaxation time was more significant in female as compared to male Tg2576 mice [23, 37]. In the thalamus region, T2 values did not show any significant change between wild-type and Tg2576 mice. In the SCN region, the T2 values of Tg2576 mice were significantly lower than wild-type mice. In addition, the decline in T2 in SCN of Tg2576 mice was clearly influenced by gender. In female Tg2576 mice, the decline in T2 was considerably higher (p < 0.001) than in male Tg2576 mice (p < 0.05). Aβ plaques were not detected in SCN of Tg2576 mice (Supplementary Figure 1).
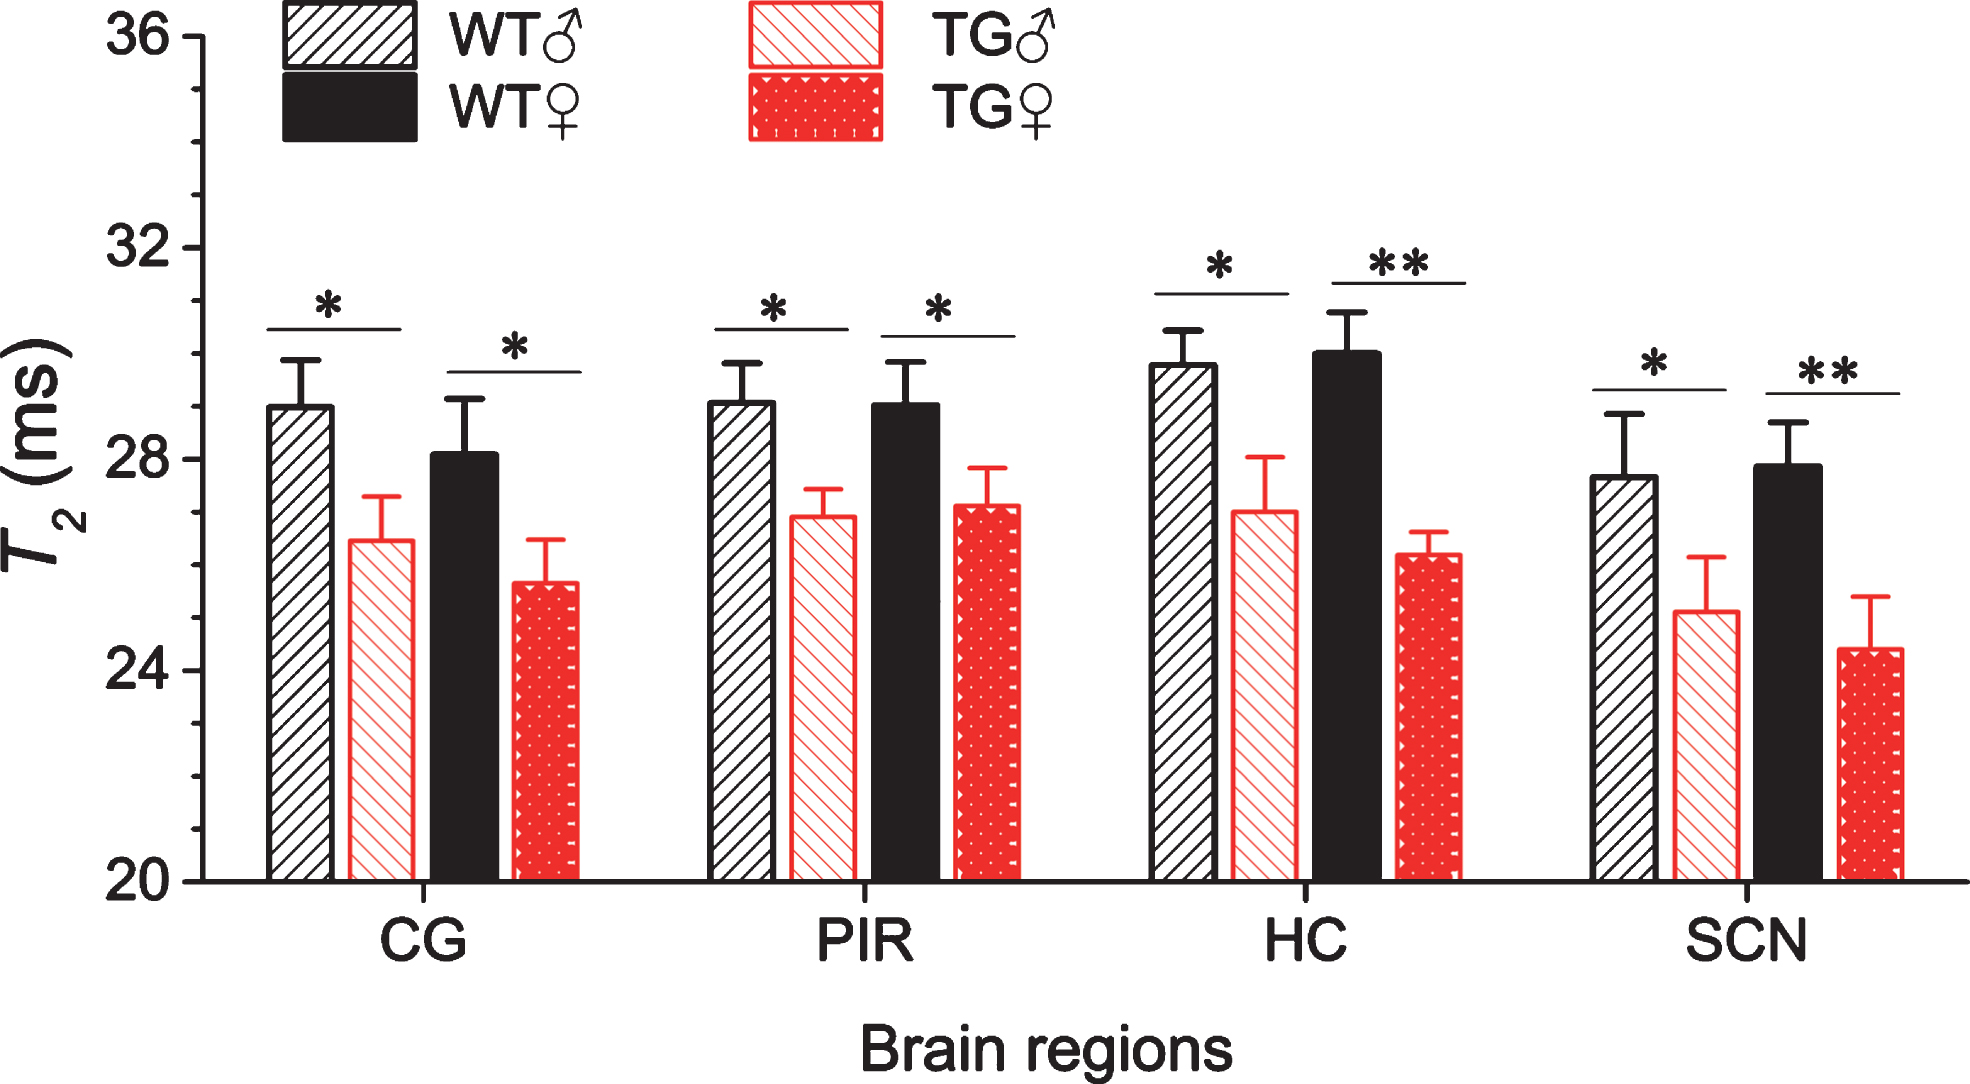
In vivo T2 relaxation time changes in the cingulate cortex (CG), piriform cortex (PIR), hippocampus (HC), and suprachiasmatic nucleus (SCN) regions of a wild-type female (WT ♀), wild-type male (WT ♂), Tg2576 female (TG ♀), and Tg2576 male (TG ♂) at 18 months of age. Data represent the mean T2 in ms±SD (error bars) (95% C.I.) of n = 6, except for TG ♂: n = 4. Student t- test: *p < 0.05, **p < 0.01, #p < 0.001, statistically significant.
Figure 3 shows results of longitudinal monitoring of T2 changes in the SCN of male and female Tg2576 and wild-type mice. In both wild-type male and wild-type female mice, there was no significant change in T2 relaxation time between 10 and 18 months of age. At 10 months of age, T2 values in the SCN of the wild-type and Tg2576 mice were not significantly different in both male and female mice. In male Tg2576 mice, the T2 relaxation times show a trend to decrease with age. However, the difference between wild-type and Tg2576 mice was evident only at the age of 18 months. In contrast, female Tg2576 mice show a significant T2 decrease in SCN as compared to wild-type mice at and above 12 months of age. The extent of decrease in T2 in the SCN region of female Tg2576 mice relative to wild-type mice was 5.3%, 8.5%, and 12.3 % for 12, 15, and 18 months of age, respectively.
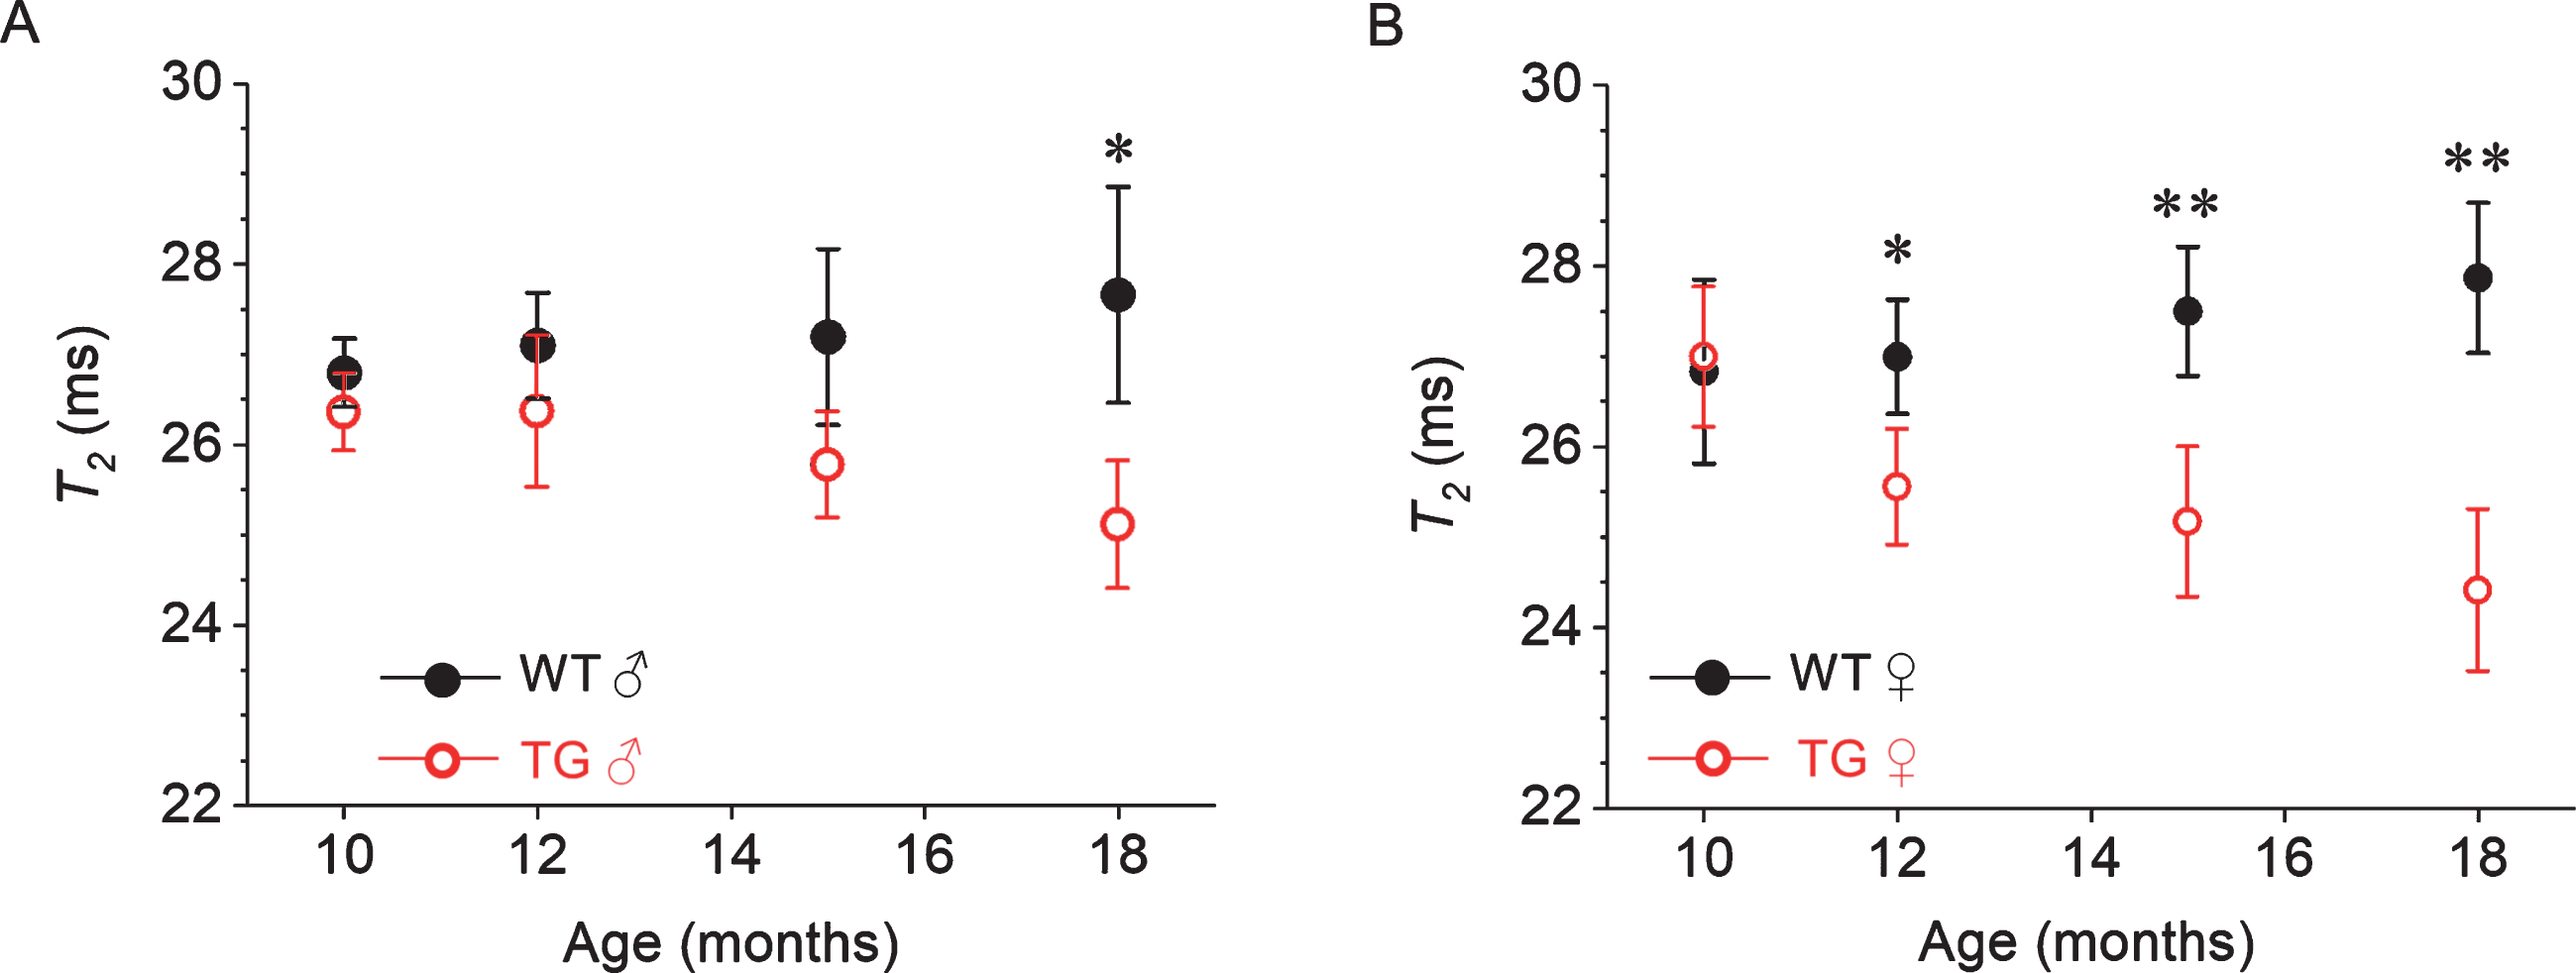
Gender-specific, age-dependent in vivo T2 changes of the suprachiasmatic nucleus (SCN) region of the wild-type (WT) and Tg2576 (TG) mice. Values are expressed as mean T2 in ms±SD (error bars) (95% C.I.). Two tailed student t-test show no significant difference observed between WT and TG mice at the age of 10 months (p > 0.05) in individual gender groups. Significant difference between WT and TG mice at the age of 12 months, 15 months and 18 months were observed in female mice but in male mice decline in T2 relaxation is observed only at 18 months of age. However, female mice have steeper decline in T2 relaxation compared to TG male mice. Student t-test: *p < 0.05, **p < 0.01.
Results for NNLS analysis of the experimental decay curves are presented in Fig. 4. In SCN from wild-type mice two distinct components were consistently detected with NNLS. These were: short T2 component (7.04±0.1 ms in male and 5.47±2.3 ms in female) constituting <0.1% of the total fraction, and an intermediate T2 component (27.6±0.94 ms in male and 27.19±1.02 in female) constituting >99% of the fraction.
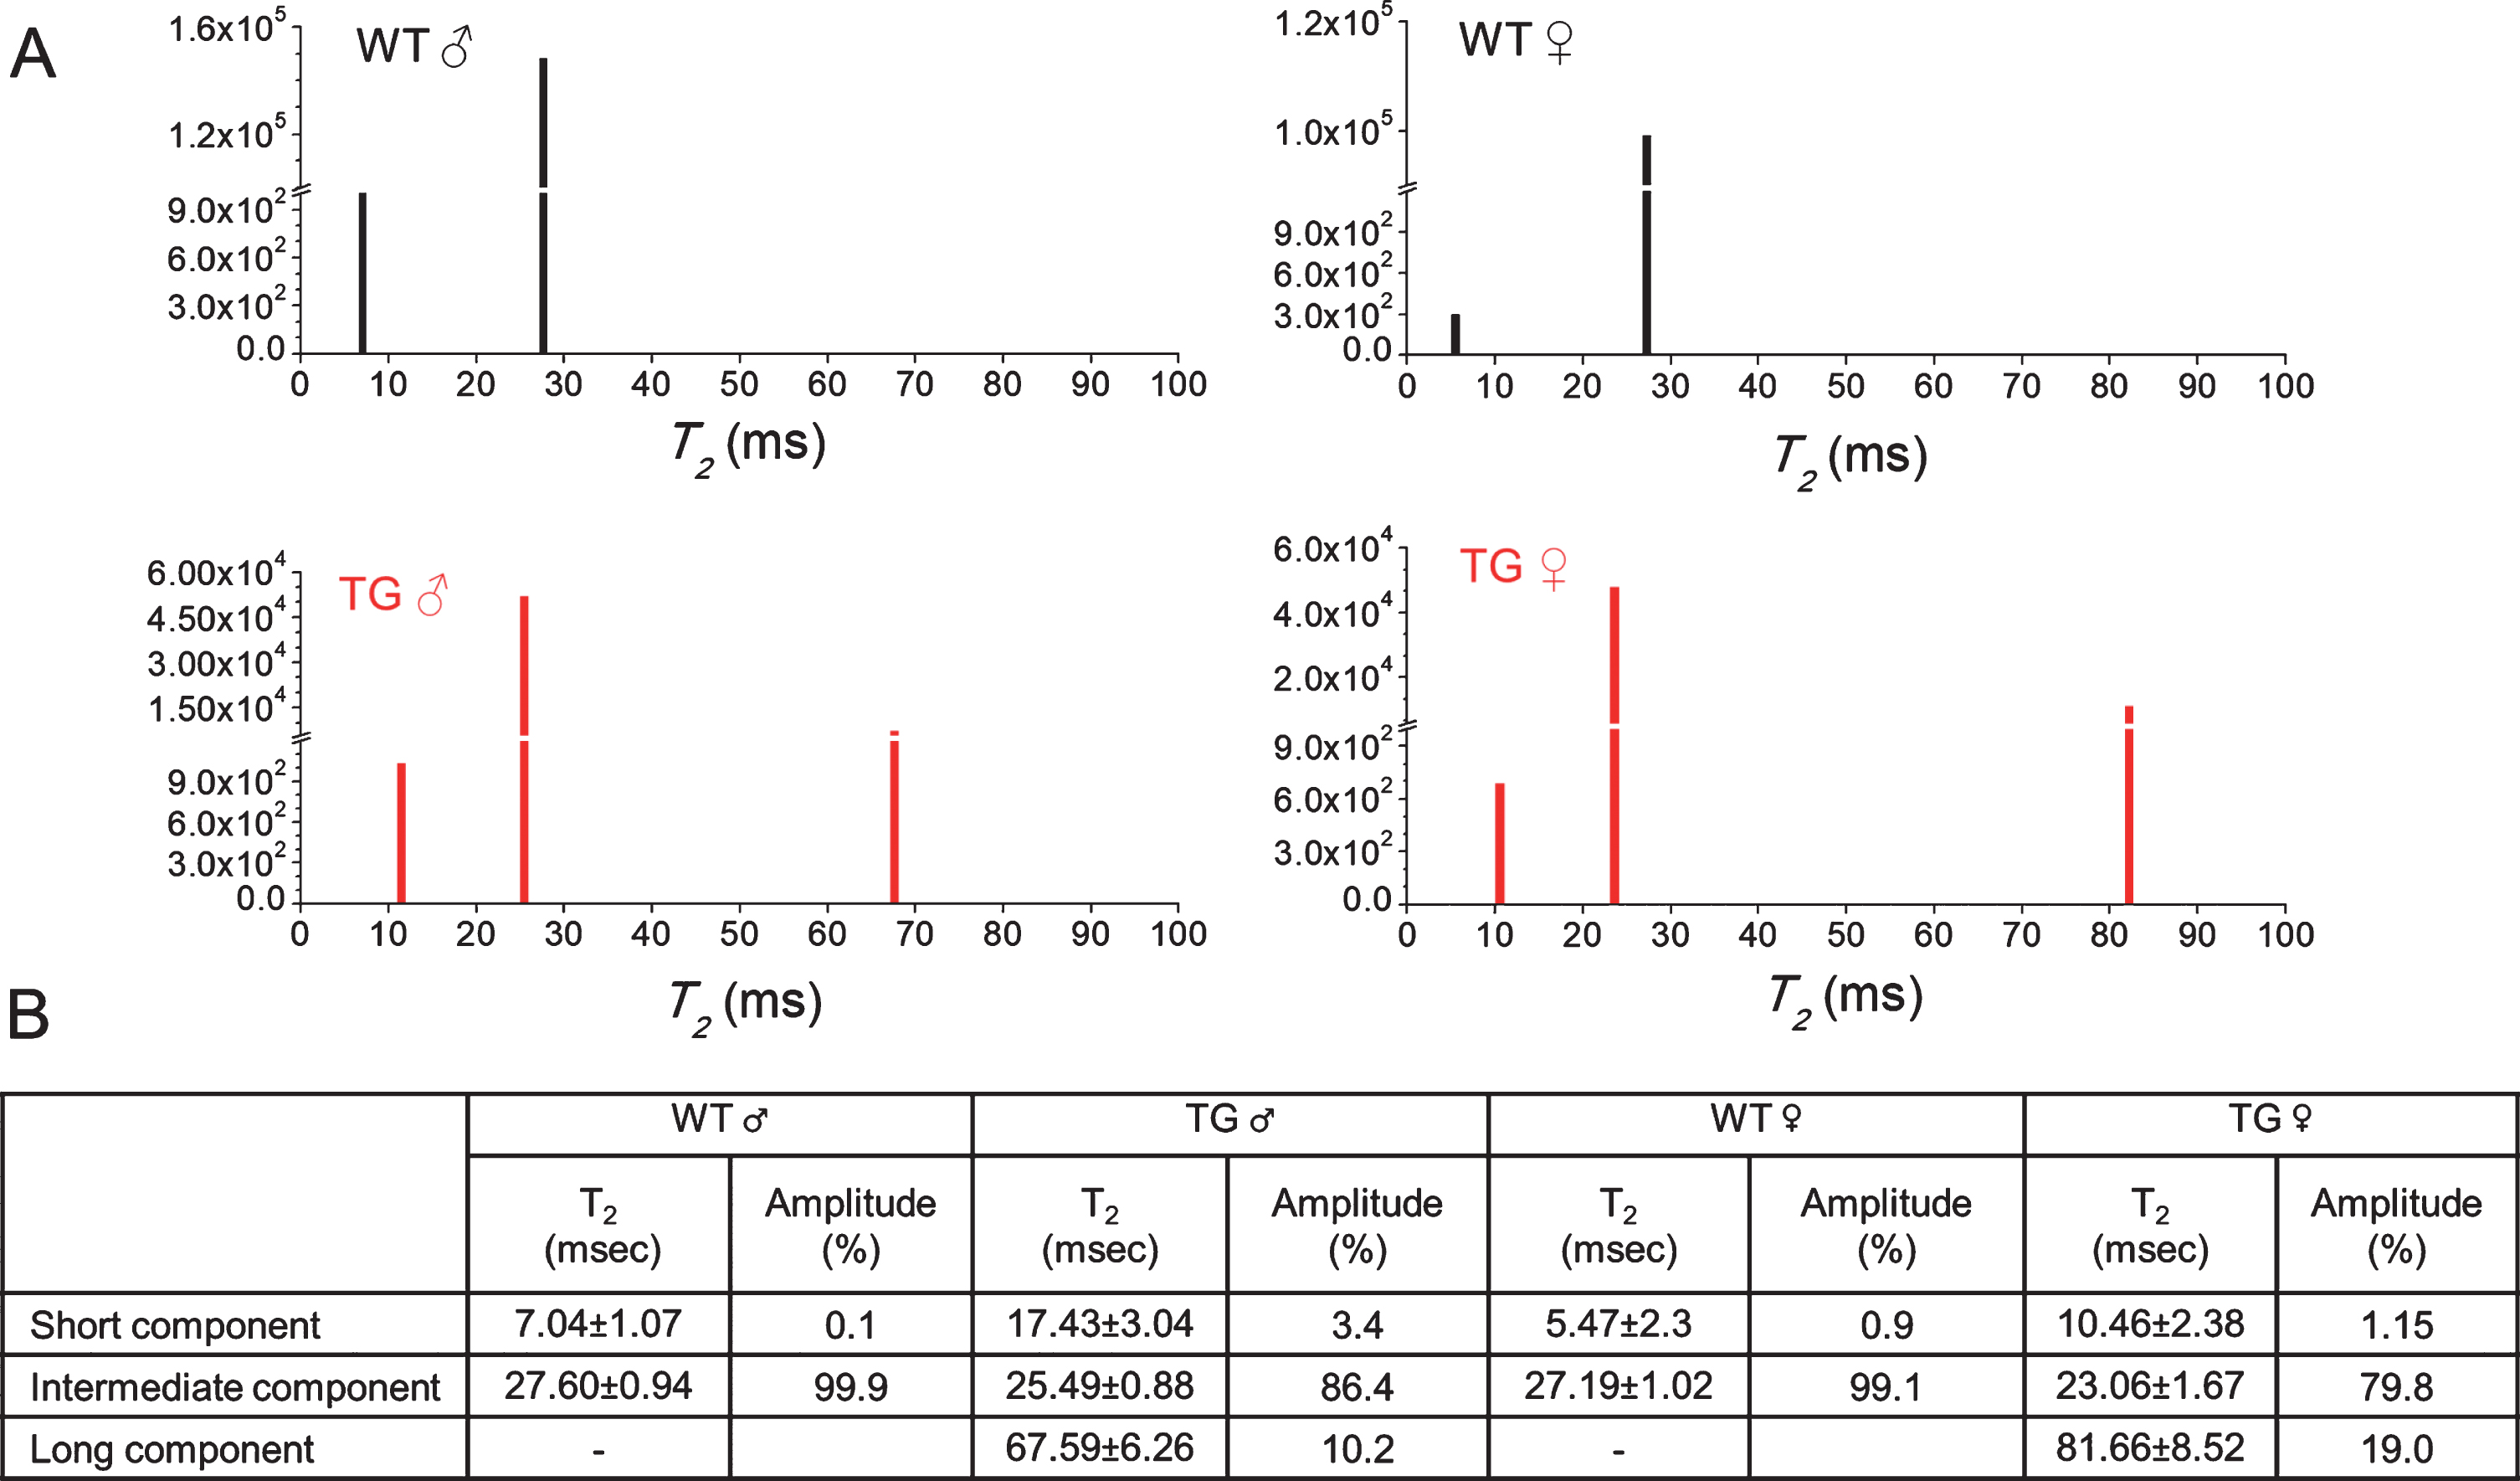
Multicomponent analysis of the experimental T2 relaxation decay curves using a non-negative least square based algorithm (NNLS). A) NNLS least-squares spectra of SCN regions of a wild-type male (WT ♂), wild-type female (WT ♀), Tg2576 male (TG ♂), and Tg2576 female (TG ♀) at 18 months of age. Spectra show difference in the amplitude and time of various relaxation components between WT and TG which were also influenced by gender. B) Time and amplitude of various T2 components are summarized in the table. Intermediate T2 components show largest contribution while short T2 components with smallest contribution in the signal. Long T2 component was only present in the SCN region of TG mice and was absent in the WT mice.
Interestingly, in SCN of Tg2576 mice, NNLS analysis of the experimental decay curves shows three well-distinguished components, These are: short T2 components (17.43±3.04 ms in male and 10.46±2.38 ms in female) constituting <3.5% of the fraction; intermediate T2 components (25.49±0.88 ms in male and 23.06±1.67 in female) constituting ∼80% of the fraction and a long T2 component (67.59±6.26 ms in male and 81.66±8.52 in female) constituting >10–19% of the fraction. The intermediate component was reduced in Tg2576 mice while long T2 component which is absent in SCN of wild-type mice is present in the SCN of Tg2576 mice.
Immunohistological analyses of number of neurons and astrocytes in SCN of male and female Tg2576 and wild-type mice are quantified in Fig. 5. GFAP staining demonstrated significantly high numbers of activated astrocytes and NeuN staining revealed a significantly decreased number of neurons in SCN of 18-month-old Tg2576 mice as compared to age-matched wild-type mice (Fig. 5). Thus, an increase in the astrocytes-to-neurons ratio in SCN was clearly observed in Tg2576 as compared to wild-type mice (Fig. 5). The increase in astrocyte to neuron ratio was more pronounced in female than male mice (Fig. 5B).
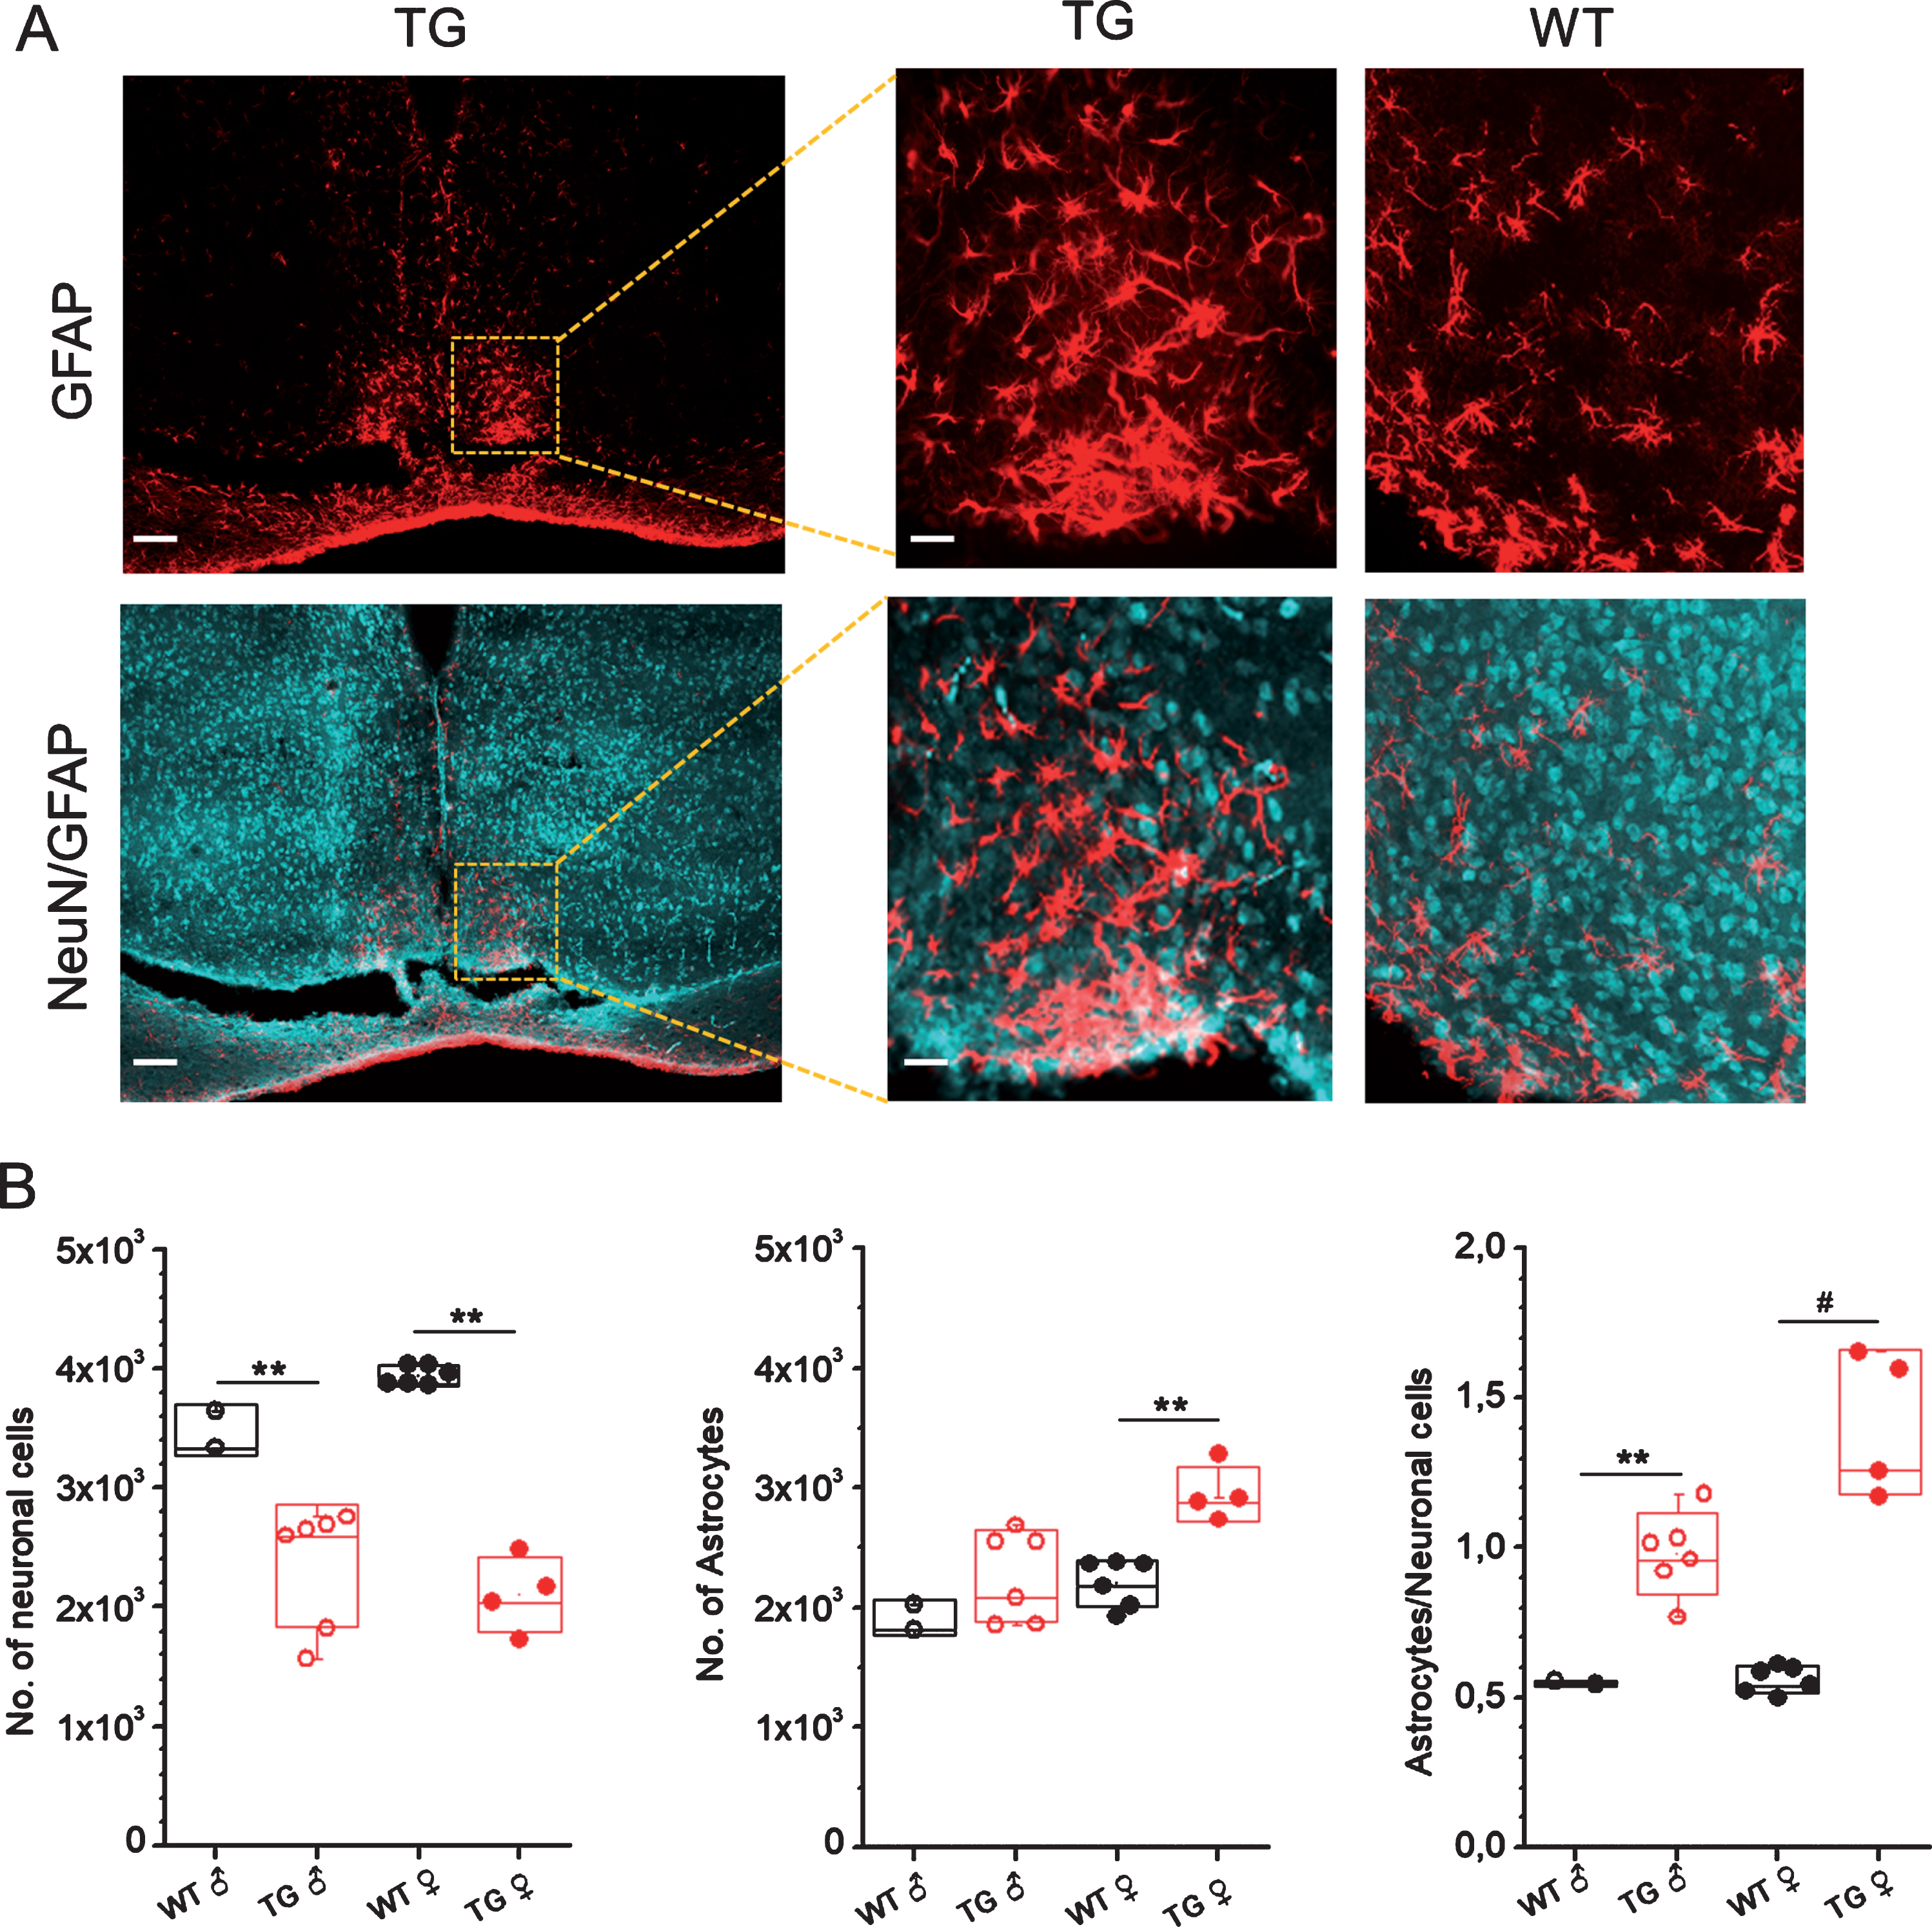
Immunohistochemical analyses of numbers of neurons and astrocytes in SCN of male and female Tg2576 and WT mice. A) Representative confocal images of GFAP (upper) and NeuN/GFAP (lower) stained sections through SCN of TG mice. Scale bar, 250μm (and 60μm in magnifications). B) Quantitative analysis of neuronal cells (left), astrocytes (middle) and ratio of astrocytes to neuronal cells in SCN of 18-month-old male (♂) and female (♀) WT and Tg2576 (TG) mice. **p < 0.05, *p < 0.05. NeuN, neuronal nuclei; GFAP, glial fibrillary acidic protein.
The analysis of the expression level of glutamic acid decarboxylase (GAD), an enzyme involved in synthesizing GABA from glutamate in neurons is shown in Fig. 6. The level of GAD was significantly lower in the SCN of 18-month-old Tg2576 mice as compared to aged-matched wild-type mice (Fig. 6). The decline in GAD was more prominent in female as compared to male Tg2576 mice, and it was inversely allied with high number of astrocytes in SCN of female as compared to male mice (Fig. 5B).
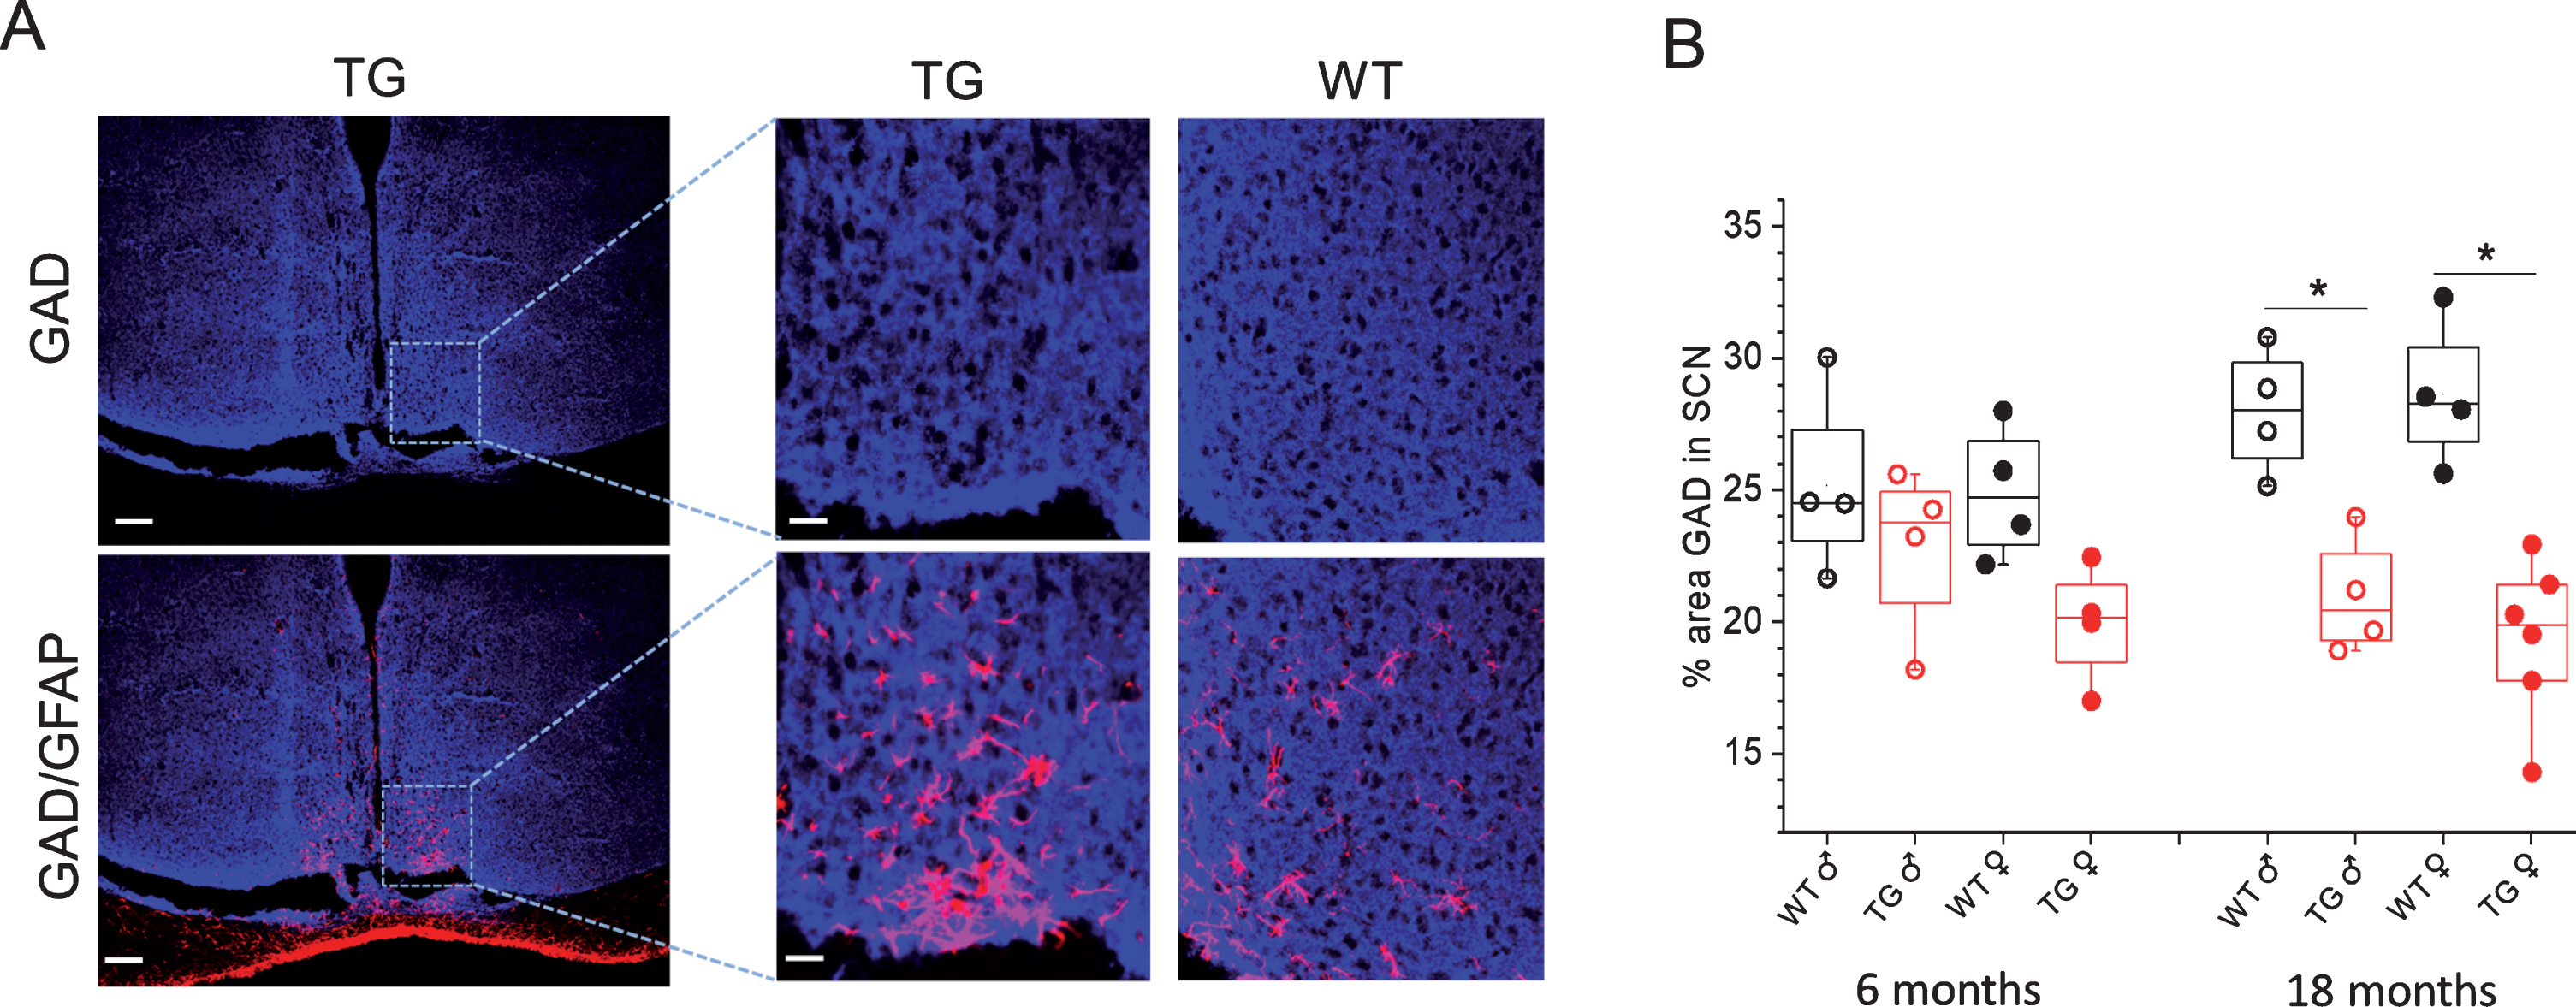
Immunohistochemical analyses of GAD and GFAP staining in SCN of Tg2576 and WT mice. A) Representative confocal images of GAD (upper) and GAD/GFAP (lower) stained sections through SCN of 18-month-old WT and TG mice. Scale bar, 250μm (and 60μm in magnifications). B) Quantitative analysis of GAD staining in SCN of 6- and 18-month-old male (♂) and female (♀) WT and Tg2576 (TG) mice. **p < 0.05, *p < 0.05. GFAP, glial fibrillary acidic protein; GAD, glutamic acid decarboxylase.
DISCUSSION
Several studies have suggested that loss of integrity and dysfunction of the SCN lies at the root of the circadian dysfunction which may be the cause or the consequence of AD pathogenesis. Knowledge on how and when these SCN integrity changes occur would help to find out whether the circadian dysfunction is the cause or the consequence of AD pathogenesis. Therefore, in this study, longitudinal magnetic resonance T2 relaxation measurements were used to probe subtle microstructural changes in the SCN in vivo.
The T2 values of various grey matter regions such as the hippocampus, cingulate and piriform cortex of the 18-month-old Tg2576 mice showed a significant decrease as compared to the age-matched wild-type mice. These results are in agreement with previous studies, which showed a prominent decrease in T2 for Aβ plaque-rich regions such as the hippocampus and cortex of Tg2576 mice as compared to age-matched wild-type mice. Although the source of the T2 reduction in various grey matter regions remains unclear, previous studies have suggested that iron-associated Aβ plaques may be involved in reducing the T2 in AD brain [23]. Interestingly, the decline in hippocampal T2 relaxation time was more significant in female as compared to male Tg2576 mice. These results are in line with higher Aβ plaque load in hippocampus of female mice as compared to male mice seen in our previous studies [37]. On the other hand, in the thalamus region, which was associated with very low Aβ deposition [30], no significant change in T2 values between wild-type and Tg2576 mice was observed. Interestingly, T2 values in the SCN region of Tg2576 mice were significantly lower than wild-type mice. In addition, the decline in T2 in SCN of Tg2576 mice was clearly influenced by gender. Unlike in hippocampus and cortex regions, Aβ plaques were not detected in SCN of Tg2576 mice (Supplementary Fig. 1).
To get further inside into the gender-specific effects on T2 in SCN, we performed a longitudinal in vivo study to follow the change in T2 time with age in wild-type and Tg2576 mice. While there was no significant change in T2 relaxation time between 10 and 18 months of age in wild type mice, the T2 relaxation times show a trend to decrease with age in Tg2576 mice. In males, the significant difference between wild-type and Tg2576 mice was evident only at the age of 18 months; however, in females, the difference between wild-type and Tg2576 mice was evident at 12 months of age already.
T2 is influenced by the mobility of water molecules associated with various effective tissue compartments, defined by intracellular and extracellular macromolecular components, which would be expected to exhibit a distinct T2 [38]. In previous studies, multiexponential T2 analysis has been successfully applied to detect and characterize multiple water compartments associated with tissue microstructures in normal and pathologic tissue [19, 38–41]. Consistent with previous work in other tissues, we expect this approach to lead to an insight into water compartmentation in SCN and how they are influenced during disease progression. We further assume that the ability of multiexponential analysis to detect AD related changes in water compartmentation in SCN would support its use as a potential diagnostic approach in early sleep disturbance in AD. Therefore, in this work, we investigated water compartmentation in SCN under normal and AD-like conditions using multiexponential analysis of T2 relaxation data. This analysis was performed using nonnegative least squares (NNLS) algorithm. In SCN from wild-type mice, two distinct components were detected which include a short T2 component constituting <0.1% of the total fraction, and an intermediate T2 component constituting >99% of the fraction. On the other hand, in SCN of Tg2576 mice, we observed three well-distinguished components namely: a short T2 component constituting <3.5% of the fraction; an intermediate T2 component constituting ∼80% of the fraction and a long T2 component constituting >10–19% of the fraction.
The short T2 component with smallest contribution in the signal with T2 = 6 ms in wild-type and T2 = 13 ms in Tg2576 could be attributed to the protein bound water as has been proposed previously [42]. The amplitude of this fast relaxing component, calculated with NNLS algorithm, is higher in SCN of Tg2576 mice, suggesting an increase in the protein bound water. Intermediate T2 component with largest contribution in the signal can be assigned to the intra or extracellular water in the SCN region of the brain. Signal intensity, calculated with NNLS algorithm, of this component is largely reduced in Tg2576 mice and this reduction was more severe in female than male Tg2576 mice. The T2 value of the intermediate components was also decreased in Tg2576 mice as compared to wild-type mice, and this decrease was also more severe in female mice than male mice.
Long T2 component was present only in Tg2576 but not in wild-type mice. The existence of this slow relaxing component in Tg2576 may either hints toward inflammation, axonal loss, and/or demyelination. However, since SCN contains small, densely packed neurons, and is largely devoid of myelinated fibers [43], the appearance of long T2 component in SCN of Tg2576 mice may not be a manifestation of demyelination. On the other hand, inflammation commonly occurs in a wide spectrum of nervous system diseases including AD. Inflammation has been known to results in an increase in extracellular water volume fraction. This in turn leads to an increase in long T2 component as described by Stanisz et al. [27]. In mice, it has been demonstrated that neuroinflammation plays a role in the functional and molecular changes that the SCN undergoes during senescence [44]. However, little evidence for neuroinflammatory processes in the SCN of AD patients is currently available [45].
In our study, histological analyses show significantly elevated numbers of activated astrocytes in SCN of Tg2576 mice. In contrast, the neuronal numbers were significantly decreased in SCN of 18-month-old Tg2576 mice. Thus, an increase in the ratio of astrocytes to neurons in SCN was clearly observed in Tg2576 as compared to wild-type mice (Fig. 5). These results are in line with human brain studies where an increase in astrocyte to neuron ratio has been observed in SCN of AD subjects [46]. Interestingly, in our study, the increase in astrocyte to neuron ratio was more substantial in female than male mice (Fig. 5B).
When glial cells are activated, common inflammatory agents such as pro-inflammatory cytokines and reactive oxygen species, secreted from these cells, can lead to inflammatory response and contribute to the disease progression [47]. Astrocytes play an important role in water homeostasis. When they are activated, the expression of astrocytic proteins such as aquaporin-4 is reduced which leads to abnormalities in membrane water transport [48, 49]. Subsequently, these abnormalities might lead to an increase in extracellular fluid leading to an increase in the long T2 component in SCN of Tg2576 mice, as observed in our study.
The neurotransmitter γ-aminobutyric acid (GABA) and its receptors are widely expressed in the SCN where they mediate cell- cell communication [3, 6]. The role of GABA in inhibiting pro-inflammatory responses has been well recognized [50, 51]. To explore whether an increase in inflammatory response in SCN of transgenic mice may be associated with low levels of GABA production in neurons, we have analyzed the expression level of GAD, an enzyme involved in synthesizing GABA from glutamate in neurons [52, 53]. A significantly lower level of GAD was observed in SCN regions of 18-month-old Tg2576 mice as compared to aged-matched wild-type mice (Fig. 6). The decline in GAD was more significant in female as compared to male Tg2576 mice which is inversely correlated with high number of astrocytes in SCN of female as compared to male mice (Fig. 5B). These results indicate that low GABA production in SCN and consequently an inefficient GABA signaling may lead to proinflammatory cytokine production and inflammatory responses which are reflected with an increase in long T2 components in SCN of Tg2576 mice. In other brain regions such as hippocampus and cortex, astrocytes and microglia become activated close to senile plaques (Supplementary Fig. 1) in order to internalize and degrade Aβ [54]. Since in SCN senile plaques were not present, the activated astrocytes were independent/unrelated with senile plaques. Future studies, on exploring GABA production specifically in activated astrocytes of SCN and its relation with AD progression would shed more light on the mechanism of SCN dysfunction in AD.
In conclusion, our results suggest that gender-specific differences in inflammatory response, most likely manifested by low GABA production, occur in SCN of Tg2576 mice. This may be an underlying perpetrator for the changes in circadian rhythmicity and sleep disturbance in AD and could also be at the root of marked sex disparities observed in AD subjects. Our results also demonstrate the ability of in vivo multiexponential T2 analysis to detect AD-related subtle microstructural changes in SCN and support its use as a potential non-invasive diagnostic approach in early sleep disturbance in AD.
Footnotes
ACKNOWLEDGMENTS
This work was partly supported by grants from Alzheimer Forschung Initiative e.V. (AFI, Grant Nr 13810). We are grateful to Dr. Karen Hsiao Ashe (University of Minnesota, USA) for providing the initial Tg2576 mice for further breeding. We thank Dr. Firat Kara and Dr. Niels Braakman for providing expert help for T2 experiments.