
Abstract
This study examined the effects of apolipoprotein E4 (APOE4), the most prevalent genetic risk factor for Alzheimer’s disease (AD), on proteins involved in mitochondrial dynamics and autophagy, in the hippocampus of targeted replacement mice. Immunohistochemical measurements revealed that the levels of the mitochondrial fusion-mediating protein, MFN1, were higher, whereas those of corresponding fission-regulating protein, DRP-1, were lower in the hippocampus of ApoE4 mice than in the corresponding ApoE3 mice, indicating that APOE4 is associated with increased mitochondrial fusion and decreased fission. A similar ApoE4-driven decrease in DRP-1 was also observed in AD brains. The levels of the mitochondrial proteins COX1 and Tom40, were higher in the ApoE4 mice, which is consistent with the increased fusion. Measurements of the levels of cleaved PINK1 and parkin, which mark and target mitochondria for mitophagic degradation, revealed lower levels of cleaved PINK1, suggesting reduced mitochondrial membrane potential, and higher levels of parkin in the hippocampus of ApoE4 compared with the ApoE3 mice, indicating altered mitophagy. The levels of the ubiquitin-binding scaffold protein, p62/SQSTM1, which directs selected cargo to the autophagosomes, were also higher in the ApoE4 mice. These findings suggest that APOE4 is associated with enhanced mitochondrial fusion and decreased fission. Additionally, the results indicate that mitophagy/autophagy is reduced in ApoE4 mice, resulting in higher levels of proteins such as parkin and p62, which are normally degraded during this process. Taken together, these results suggest a novel mechanism that may underlie the pathological effects of APOE4 and indicate that use of APOE4 genotyping could pave the way for identification of novel APOE4-related therapeutic targets.
INTRODUCTION
Genetic studies revealed that the ɛ4 allele of the apolipoprotein E (APOE) gene is the strongest genetic risk factor for Alzheimer’s disease. This gene encodes for ApoE, which is the most prevalent brain lipoprotein and plays a major role in the transport and trafficking of brain lipids and cholesterol. More than half of AD patients carry at least one copy of the APOE ɛ4 allele, which is associated with reduction of the age of AD onset by about 7–9 years per allele copy [1]. This translates to a 3- and 12-fold higher risk of developing AD in carriers of one or two copies of the APOE ɛ4 allele, respectively. The other two alleles of APOE in humans are ɛ3; which encodes the most widespread isoform, and which differs from ApoE4 at amino acid position 112 [2, 4], and ɛ2, which encodes the isoform ApoE2, which differs from ApoE4 at amino acids 112 and 168 of the protein. ApoE2, is the least abundant isoform and was shown to be protective and associated with reduced AD risk [5].
Several not mutually exclusive mechanisms have been proposed to mediate the pathological effects of APOE4. These include crosstalk interaction with amyloid-β (Aβ) and the amyloid cascade, the effects on lipid metabolism and transport, the effects on inflammatory processes and membrane trafficking, and the effects on mitochondrial and energy dysfunction [2–4]. The jury is still out regarding the relative contribution of each of these mechanisms to the APOE4-driven pathology in AD.
We will presently focus on mitochondria as the target of APOE4. Measuring key brain mitochondrial markers, such as the electron transport protein, COX1, and the mitochondrial transporter, Tom40, revealed that they decrease with age and are markedly lower in AD brains than in those of age-matched controls [6–12]. This is associated with increased mitochondrial oxidative stress [10, 13–15] and changes in mitochondrial dynamics [16]. Mitochondrial dynamics are characterized by fusion and fission processes, which are respectively driven by the mitofusins MFN1 and MFN2, and by a Dyanmin-1-like protein (DRP-1) [17, 18]. Measuring the levels of these proteins in AD brains revealed marked reductions in the levels of the fusion proteins MFN1 and MFN2 [10, 19–21], and inconsistent changes in the levels of DRP-1 [10, 19–22], suggesting that mitochondrial fusion and fission are specifically altered in AD. Another key process involved in mitochondrial dynamics is mitophagy, which allows the cells to remove damaged and non-functional mitochondria by directing them to autophagosomes followed by lysosomal degradation [17, 18]. Mitophagy requires the fission and the subsequent targeting of mitochondria for degradation via the mitophagic pathway. An important pathway for mitochondrial targeting includes the proteins PINK1 and parkin. Full-length (63 kDa) PINK1, which is situated on the mitochondrial membrane, is cleaved under normal conditions, yielding a 52 kDa cleavage product [17, 23]. This cleavage is inhibited under pathological conditions, such as decreased mitochondrial membrane potential; the subsequent elevation in the levels of the full-length PINK1 thus provides a marker for targeting the mitochondria to mitophagy. An additional key molecule in this process is parkin, a cytosolic E3 ubiquitin ligase [17, 18] that is recruited to the mitochondria by PINK1 and plays a role in labeling the damaged/unwanted mitochondria for degradation. The levels of PINK1 are lower, whereas the levels of parkin are higher in AD brains than in controls, suggesting that mitophagy may be altered [22–25]. It was previously shown that AD [24, 26–29] and in particular, APOE4 [30–32] are associated with impaired autophagy, which might also affect mitophagy and mitochondrial dynamics.
Findings linking APOE4 to mitochondrial function and dynamics in AD and the corresponding models are limited [33]. It has been shown that mitochondrial and oxidative damage is more important for cognitive dysfunction in AD patients who carry APOE4 than those who do not [15], and that mitochondria of APOE4 AD patients are metabolically impaired and contain abnormally high levels of amyloid-β protein precursor (AβPP) [34]. Studies with AD patients homozygous for APOE ɛ4 revealed lower brain mRNA levels of the autophagic proteins LC3 and p62, as well as of the lysosomal glycoprotein LAMP2, compared with patients expressing APOE ɛ3 [32]. The effects of APOE4 on mitophagy in AD have not yet been reported. However, studies utilizing APOE4-expressing mice revealed that APOE4 is associated with increased mitochondrial pathology and metabolism following pharmacological activation of the amyloid cascade and ischemic injury [35, 36]. Interestingly, both in young human subjects [37] and in young naïve ApoE4 mice [38], the mitochondrial content is elevated, suggesting that throughout life, the effects of APOE4 on mitochondrial metabolism may be bell-shaped, with a presumably compensatory activation early, followed by a subsequent degeneration-related decrease. Although the above human and AD model data clearly show that the mitochondria are affected isoform specifically by APOE4 in AD, the interrelationship between APOE4 expression and mitochondrial dynamics, and their functions are not known. In the present study, we used young targeted ApoE4 and ApoE3 female replacement mice in which the mouse Apoe was replaced with either human APOE4 or APOE3 (namely ApoE3 and ApoE4 mice) to determine the expression of proteins that regulate mitochondrial dynamics, namely, fusion, fission, and mitophagy.
MATERIALS AND METHODS
Transgenic mice
APOE-target replacement mice, in which the endogenous mouse Apoe was replaced by either human APOE3 or APOE4, were created by gene targeting, as previously described [39]. These mice were purchased from Taconic (Germantown, NY). In order to minimize possible genetic drift between the ApoE3 and ApoE4 mice, which were offspring of APOE ɛ4 and APOE ɛ3 homozygous mice colonies generated by Taconic around 2001; they were further crossed by us with Harlan C57Bl/6JOlaHsd mice. Further crossing of these mice, which are on an α-synuclein –/– background, led to the generation of APOE ɛ3 and APOE ɛ4 homozygous mouse colonies on either α-synuclein –/– or α-synuclein +/+ backgrounds. The present experiments were performed with APOE ɛ3 and APOE ɛ4 homozygous mice on an α-synuclein –/– background whose ApoE4-driven synaptic and AD-related phenotypes are more pronounced than those of the corresponding ApoE4 mice on an α-synuclein +/+ background [40]. These mice are referred to in the text as ApoE3 and ApoE4 mice. The APOE genotype of the mice was confirmed by PCR analysis [39, 41]. All the experiments were performed on 4-month-old female mice, and were approved by the Tel Aviv University Animal Care Committee. The study was conducted according to the NIH Guidelines for Use and Care of Laboratory Animals and following the approval by Animal Care Committee of Tel Aviv University, #L-04-16-002.
Human brain specimens
Twenty-six postmortem brain specimens from AD patients and age-matched control subjects were obtained from the ADRC Neuropathology Core and Brain Bank at UCSD. Seventeen specimens were from patients diagnosed with AD: seven were APOE ɛ4/ɛ4 and ten were APOE ɛ3/ɛ3 (namely APOE4/4 and APOE3/3); nine specimens were from age-matched control subjects with no diagnosed AD, eight of whom were APOE ɛ3/ɛ3 and one was APOE ɛ2/ɛ3 (namely APOE3/3 and APOE2/3). Diagnosis of the AD patients was confirmed pathologically utilizing the Braak criteria [42]. See Fig. 9B for more clinical and demographic data. The brain samples studied were from the frontal temporal cortex and were quick-frozen and stored at –80°C until used.
Immunohistochemistry and immunofluorescence microscopy
Mice were anesthetized with ketamine and xylazine and perfused transcardially with 10 mM PBS, pH 7.4, and then with 4% paraformaldehyde in PBS. Their brains were removed, fixed for 3 h by shaking them at room temperature with 4% paraformaldehyde in PBS, and then placed in 20% sucrose for 48 h at 4°C. Frozen coronal sections (30μm) were then cut on a sliding microtome, collected serially, placed in 200μl of cryoprotectant, and stored at –20°C until use. The free-floating sections were immunostained with the following primary antibodies (Abs): Mouse anti-DRP-1 (1:1000; Santa Cruz); Rabbit anti-MFN1 (1:1000; Santa Cruz); Mouse anti-Parkin (1:1000, Cell Signaling); Rabbit anti-Tom40 (1:500; Santa Cruz); and Goat anti-COX1 (1:400; Santa Cruz).
Immunofluorescence staining was performed using fluorescent chromogens. Accordingly, sections were first blocked with 20% normal donkey serum in PBS with 0.1% Triton X-100 (PBST) for 1 h at room temperature, and then reacted for 48 h at 4°C with the primary antibodies (dissolved in 2% normal donkey serum in PBST). Next, the bound primary antibodies were visualized by incubating the sections for 1 h at room temperature with Alexa-fluor 488-conjugated donkey anti-rabbit (1:1000; Invitrogen, Eugene, OR), or Alexa-fluor 488-conjugated donkey anti-mouse (1:1000; Invitrogen), depending on the appropriate initial antibody. The sections were then mounted on dry gelatin-coated slides. Sections stained for immunofluorescence were visualized using an Olympus motorized inverted research microscope Model IX81 (20×magnification; scale bars, 50 micrometer). Control experiments revealed no staining in sections lacking the first antibody. The intensities of immunofluorescence staining, expressed as the percentage of the area stained, were calculated utilizing the Image-Pro Plus system (version 5.1, Media Cybernetics) as previously described [43]. All images for each immunostaining were obtained under identical conditions, and their quantitative analyses were performed with no further handling. Moderate adjustments for contrast and brightness were performed evenly on all the images of the different mouse groups. The images were analyzed by setting a threshold for all sections of a specific labeling. The area of the staining over the threshold, compared to the total area of interest, was determined for each mouse and each group was averaged. COX1 and Tom40 Immunohistochemistry were performed as previously described [43]. Accordingly, sections were washed with PBS, and treated with Peroxy Block (10% of [H2O2 30% ], 3% Methanol absolute, diluted in PBS for 25 min), after which they were washed again with PBS and PBST, and were blocked for 1 h in 20% serum diluted in PBST. Thereafter, the primary antibody, diluted in PBST containing 2% of the appropriate serum, was incubated overnight at 4°C. The sections were then rinsed in PBST, and incubated for 1 h at room temperature with the corresponding secondary antibody (Vector Laboratories, Burlingame, CA) then diluted 1:200 in PBST containing 2% of the appropriate serum. After several additional rinses in PBST, the sections were incubated for 0.5 h in avidin-biotin-horseradish peroxidase complex (ABC Elite; Vector Laboratories) in PBST. After rinses in PBST, sections were placed for up to 10 min in diaminobenzidine chromagen solution (Vector Laboratories). To minimize variability, sections from all animals were stained simultaneously. The reaction was monitored visually and stopped by rinses in PBS. The sections were mounted on a dry gelatin-coated slide and then dehydrated and sealed with cover slips. The immunostained sections were viewed using a Nikon light microscope, model ECLIPSE Ci-L, Tokyo, Japan. Interfacing was carried out with a video camera, Y-TV55 Nikon, Japan (10×magnification; scale bars, 100 micrometer). Analysis and quantification of the staining (2 hippocampal images per animal at Bregma –1.7 to –2.06) was performed using the Image-Pro plus system for image analysis (v. 5.1, Media Cybernetics, Silver Spring, MD, USA).
The images were analyzed by marking the area of interest (e.g., a hippocampal subfield such as CA3) and setting a threshold for all sections of a specific labeling. The stained area above the threshold relative to the total area was then determined for each section.
All groups were stained together, and the results presented represent the mean±SEM of the percent area stained normalized relative to the young ApoE3 mice. Moderate adjustments for contrast and brightness were performed evenly on all the presented images of the different mouse groups.
Immunoblot analysis
Mouse brain immunoblot analysis was performed as previously described [44, 45]. In brief, mice were decapitated and their brains were rapidly excised and frozen in liquid nitrogen. The dissected hippocampus samples of each brain were then homogenized in 200μl of the following detergent-free homogenization buffer [10 mM HEPES, 2 mM EDTA, 2 mM EGTA, 0.5 mM DTT, protease inhibitor cocktail (Sigma P8340) and phosphatase inhibitor cocktail (Sigma P5726)]. The homogenates were then aliquoted and stored at –80°C. For human brain samples, 0.2 g of frozen frontal temporal cortex was homogenized in 200μl of the detergent-free homogenization buffer.
Gel electrophoresis and immunoblot assays of the mouse and human brain extracts were performed on SDS-treated samples (boiling for 10 min in 0.5% SDS) as previously described [43, 44] utilizing the following antibodies: Rabbit anti-DRP1 (1:1000; Santa Cruz); Rabbit anti-MFN1 (1:1000; Santa Cruz); Mouse anti-Parkin (1:1000, Cell Signaling); Rabbit anti-PINK1 (1:1000,Cell Signaling); Rabbit anti-p62 (1:2000; MBL), Rabbit anti-Tom40 (1:1000; Santa Cruz), Mouse anti-COX1 (1:1000; Santa Cruz), Mouse-anti GAPDH (1:1000, abcam), and Mouse-anti Actin clone C4 (1:10,000, MP). For all the mice the same amounts of protein were loaded onto the gels per lane. Protein concentration was determined utilizing the BCA protein assay kit (Pierce 23225).
The immunoblot bands were visualized utilizing the ECL chemiluminescent substrate Kit (Pierce), after which their intensity was quantified using ImageLab software (BioRAD). GAPDH and Actin levels were employed as gel loading controls; the results are presented relative to the ApoE3 mice.
Electron microscopy
The mice were sacrificed as mentioned above. The hippocampi were then extracted, and fixed for 24 h in Karnovsky-fixative [2.5% glutaraldehyde with 2.5% paraformaldehyde in a 0.1 M sodium cacodylate buffer (pH 7.4)], and washed with 0.1 M sodium cacodylate buffer. The tissues were then post-fixed in 1% OsO4, 0.5% K2Cr2O7, 0.5% K4[Fe(CN)6] in 0.1 M cacodylate-buffer (pH 7.4) for 1 h at room temperature and washed twice with 0.1 M cacodylate-buffer, followed by rising with DDW three times. This was followed by staining with 2% uranyl acetate for 1 h; washing with DDW and dehydration in ethanol. The stained tissue was then embedded in Epon EMBED 812 (EMS). The resins were polymerized at 60°C for 24 h and cut to semi-thin sections (500 nm), to assist in finding the CA3 location in the tissue followed by ultrathin sections (90-70 nm) that were obtained with a Leica ultracat (UC7). The Ultramicrotome sections were then negatively stained with lead citrate (Pb3C12H10O14) then analyzed in a G-12 Spirit FEI electron microscope. Mitochondrial size and cristae density were measured using ImageJ.
Statistical analysis
Ten ApoE3 and fifteen ApoE4 mice were used in the immunohistochemistry and immunofluorescence experiments. The mice were divided into two cohorts. Each cohort was measured separately and normalized relative to ApoE3, whose values were set at 1. The results presented (mean±SEM) are of both cohorts together. Similar results were obtained when the two cohorts were analyzed separately. Fifteen to twenty ApoE3 and ApoE4 mice were used in different immunoblot assays. Each sample was analyzed on two separate gels and the results of the ApoE4 samples (means±SEM) were normalized relative to the ApoE3 samples run on the same gel.
Two ApoE3 and Two apoE4 mice were used in the electron microscopy experiments in one cohort; ApoE3 values were set at 1 and the results presented as mean±SEM.
The results of the ApoE4 and ApoE3 mice in the different experiments were compared by 2- tailed Student’s t-test. In the human brain specimen immunoblot assay, the results were analyzed using One-Way ANOVA for group analysis, followed by the indicated post hoc analysis.
RESULTS
Brains from mice expressing either human ApoE4 or ApoE3 isoform were used to determine whether the proteins involved in mitochondrial dynamics are differentially regulated by the APOE alleles. The expression levels of the mitochondrial fusion-related protein mitofusin1 (MFN1) was first examined. As shown in Fig. 1A, there was a marked MFN1 staining in the CA3 pyramidal cells of the hippocampal subfield. Quantitation of these results revealed that the MFN1 staining was significantly higher in the ApoE4 compared to the ApoE3 hippocampus brain sections (1.99±0.33 and 1±0.3, respectively, p < 0.05). Similar effects were obtained in the ApoE4 CA1 subfield (4.02±0.82 for the ApoE4 mice versus 1±0.27 for the ApoE3 mice p < 0.005, Supplementary Figure 1A) and in the dentate gyrus (DG) hilus (2.06±0.4 for the ApoE4 mice versus 1±0.32 for the ApoE3 mice p = 0.05, Supplementary Figure 1B). Complementary immunoblot experiments resulted in an 86 kDa MFN1 band (Fig. 1B). Quantitation of these results revealed higher MFN1 protein levels in the ApoE4 than in the ApoE3 mice (1.48±0.17 and 1.02±0.08, respectively, p < 0.05), which is in agreement with the corresponding MFN1 immunohistochemical findings. The effects of the APOE genotype on the levels of the fission Dyanmin-1-like protein (DRP-1) in the hippocampus of the ApoE4 and ApoE3 mice were next examined. As shown in Fig. 2A, there was marked DRP-1 immunohistochemical staining in the CA3 pyramidal cells’ hippocampal subfield, as well as in the corresponding synaptic stratum lucidum subfield. Quantitation of the CA3 pyramidal subfield staining revealed significantly lower DRP-1 levels in the ApoE4 mice compared with those of the corresponding ApoE3 mice (0.51±0.08 and 1±0.15, respectively, p < 0.005). A similar, but not statistically significant difference was observed in the CA3 stratum lucidum synaptic subfield (0.64±0.16 in the ApoE4 mice, compared with 1±0.24 for the ApoE3 mice, p > 0.05). Measurements of the levels of DRP-1 in the CA1 pyramidal neurons subfield of the ApoE4 mice also revealed a lower trend than those of the corresponding ApoE3 mice (respectively, 0.41±0.12 and 1±0.3 p = 0.06, Supplementary Figure 1C). However, there were no differences in DRP-1 levels in the DG hilus of the two mouse groups (1±0.25 for the ApoE4 mice versus 1±0.22 for the ApoE3 mice p > 0.05, Supplementary Figure 1D). The DRP-1 protein levels were also examined by immunoblot analyses, which yielded an 80 kDa protein band (Fig. 2B). Quantitation of these results revealed, in accordance with the immunohistochemical results, lower levels of DRP-1 in the ApoE4 mouse hippocampal homogenates, compared with those of ApoE3 (0.79±0.07 and 1.03±0.1, respectively; p = 0.05). Taken together, these findings suggest that mitochondrial dynamics protein levels are affected isoform-specifically by APOE4, and that APOE4 might be associated with increased mitochondrial fusion and reduced fission compared with APOE3.

The levels of Mitofusin-1 (MFN1) in the hippocampus of ApoE3 and ApoE4 female mice. A) MFN1 immunohistochemistry. Representative images (X20 magnification) of the indicated CA3 hippocampal subfields of the indicated CA3 hippocampal subfields of 4-month-old ApoE3 and ApoE4 mice are presented on the left. White arrowheads represent CA3 pyramidal cells. Scale Bar = 50μm. Quantification of the staining intensity in the CA3 pyramidal cells is shown on the right. Mean±SEM: n = 10 for ApoE3 (white bars) and n = 15 for ApoE4 mice (black bars); *p < 0.05, for ApoE4 compared to ApoE3. B) Representative immunoblots using MFN1 antibodies of ApoE3 and ApoE4 mouse whole hippocampal homogenates are presented on the left. GAPDH was used as a control for loading levels. Quantification of the results (mean±SEM; n = 15 per group) of ApoE3 mice (white bars) and ApoE4 mice (black bars) is depicted on the right (*p < 0.05).
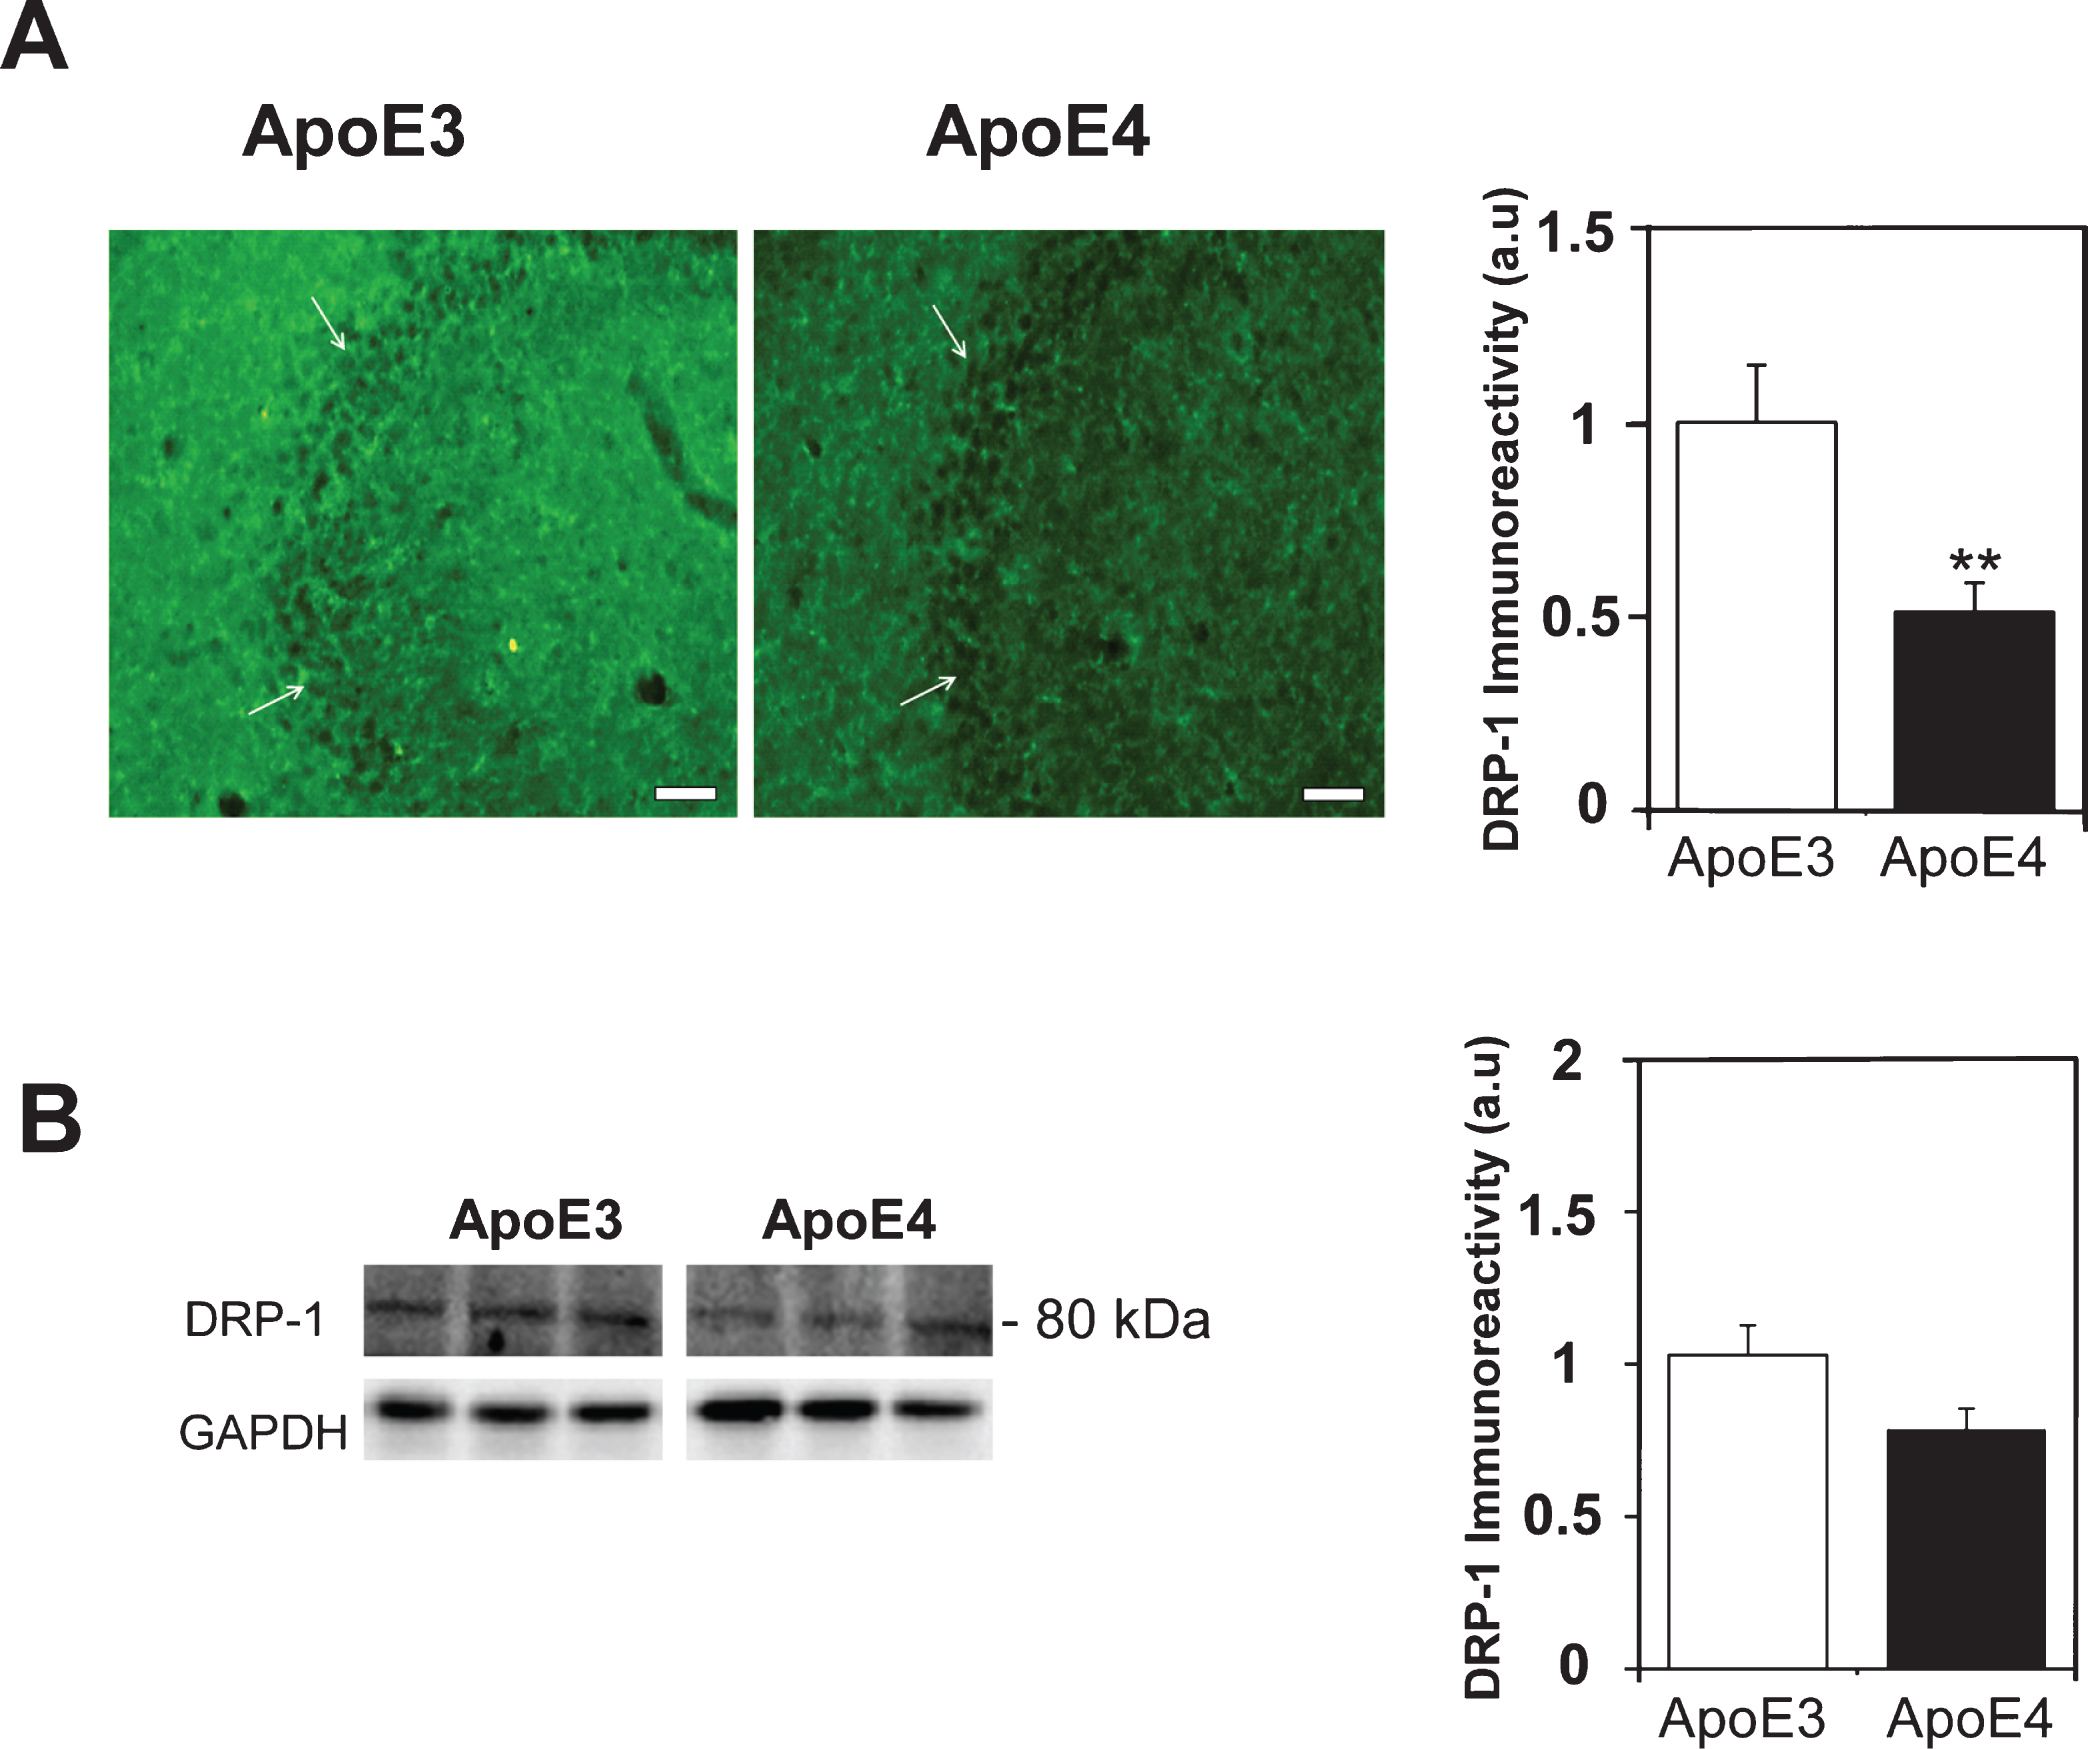
The levels of Dyanmin-1-like protein (DRP-1) in the hippocampus of ApoE3 and ApoE4 female mice. A) DRP-1 immunohistochemistry. Representative images (X20 magnification) of the indicated CA3 hippocampal subfields in the indicated CA3 hippocampal subfields of 4-month-old ApoE3 and ApoE4 mice are presented on the left. White arrowheads represent CA3 pyramidal cells. Scale Bar = 50μm. Quantification of the staining intensity in the CA3 pyramidal cells is shown on the right. Mean±SEM: n = 10 for ApoE3 (white bars) and n = 15 for ApoE4 mice (black bars); **p < 0.01, for ApoE4 compared to ApoE3. B) DRP-1 immunoblot. Representative immunoblots of whole homogenates from the hippocampi of ApoE3 and ApoE4 mice are presented on the left. GAPDH was used as a control for loading levels. Quantification of the results (mean±SEM; n = 15 per group) of ApoE3 mice (white bars) and ApoE4 mice (black bars) is depicted on the right (p = 0.05).
The extent to which the APOE4 genotype also affects the levels of mouse mitophagy-related proteins was next examined by focusing on PINK1 kinase, which senses mitochondrial damage, and on parkin which is an E3 ubiquitin ligase which mediates the clearance of damaged mitochondria through mitophagy [17]. Immunoblot measurements revealed two PINK1 bands, a 63 kDa protein that corresponds to the full-length protein and a ∼52 kDa band, which represents the cleavage product (Fig. 3). Quantitation of these results revealed that the levels of the full-length PINK1 protein were similar in both ApoE3 and ApoE4 hippocampal homogenates (0.85±0.08 and 1.02±0.09, respectively, p > 0.05, Fig. 3B), but that the levels of cleaved PINK1 were significantly lower in the ApoE4 than the corresponding ApoE3 mice (0.73±0.05 and 0.99±0.07, respectively p < 0.05, Fig. 3B). Since low levels of cleaved PINK1 correlate with impaired mitochondrial membrane potential and signals the removal of such mitochondria by mitophagy [17, 46], this finding might reflect increased mitochondrial damage.
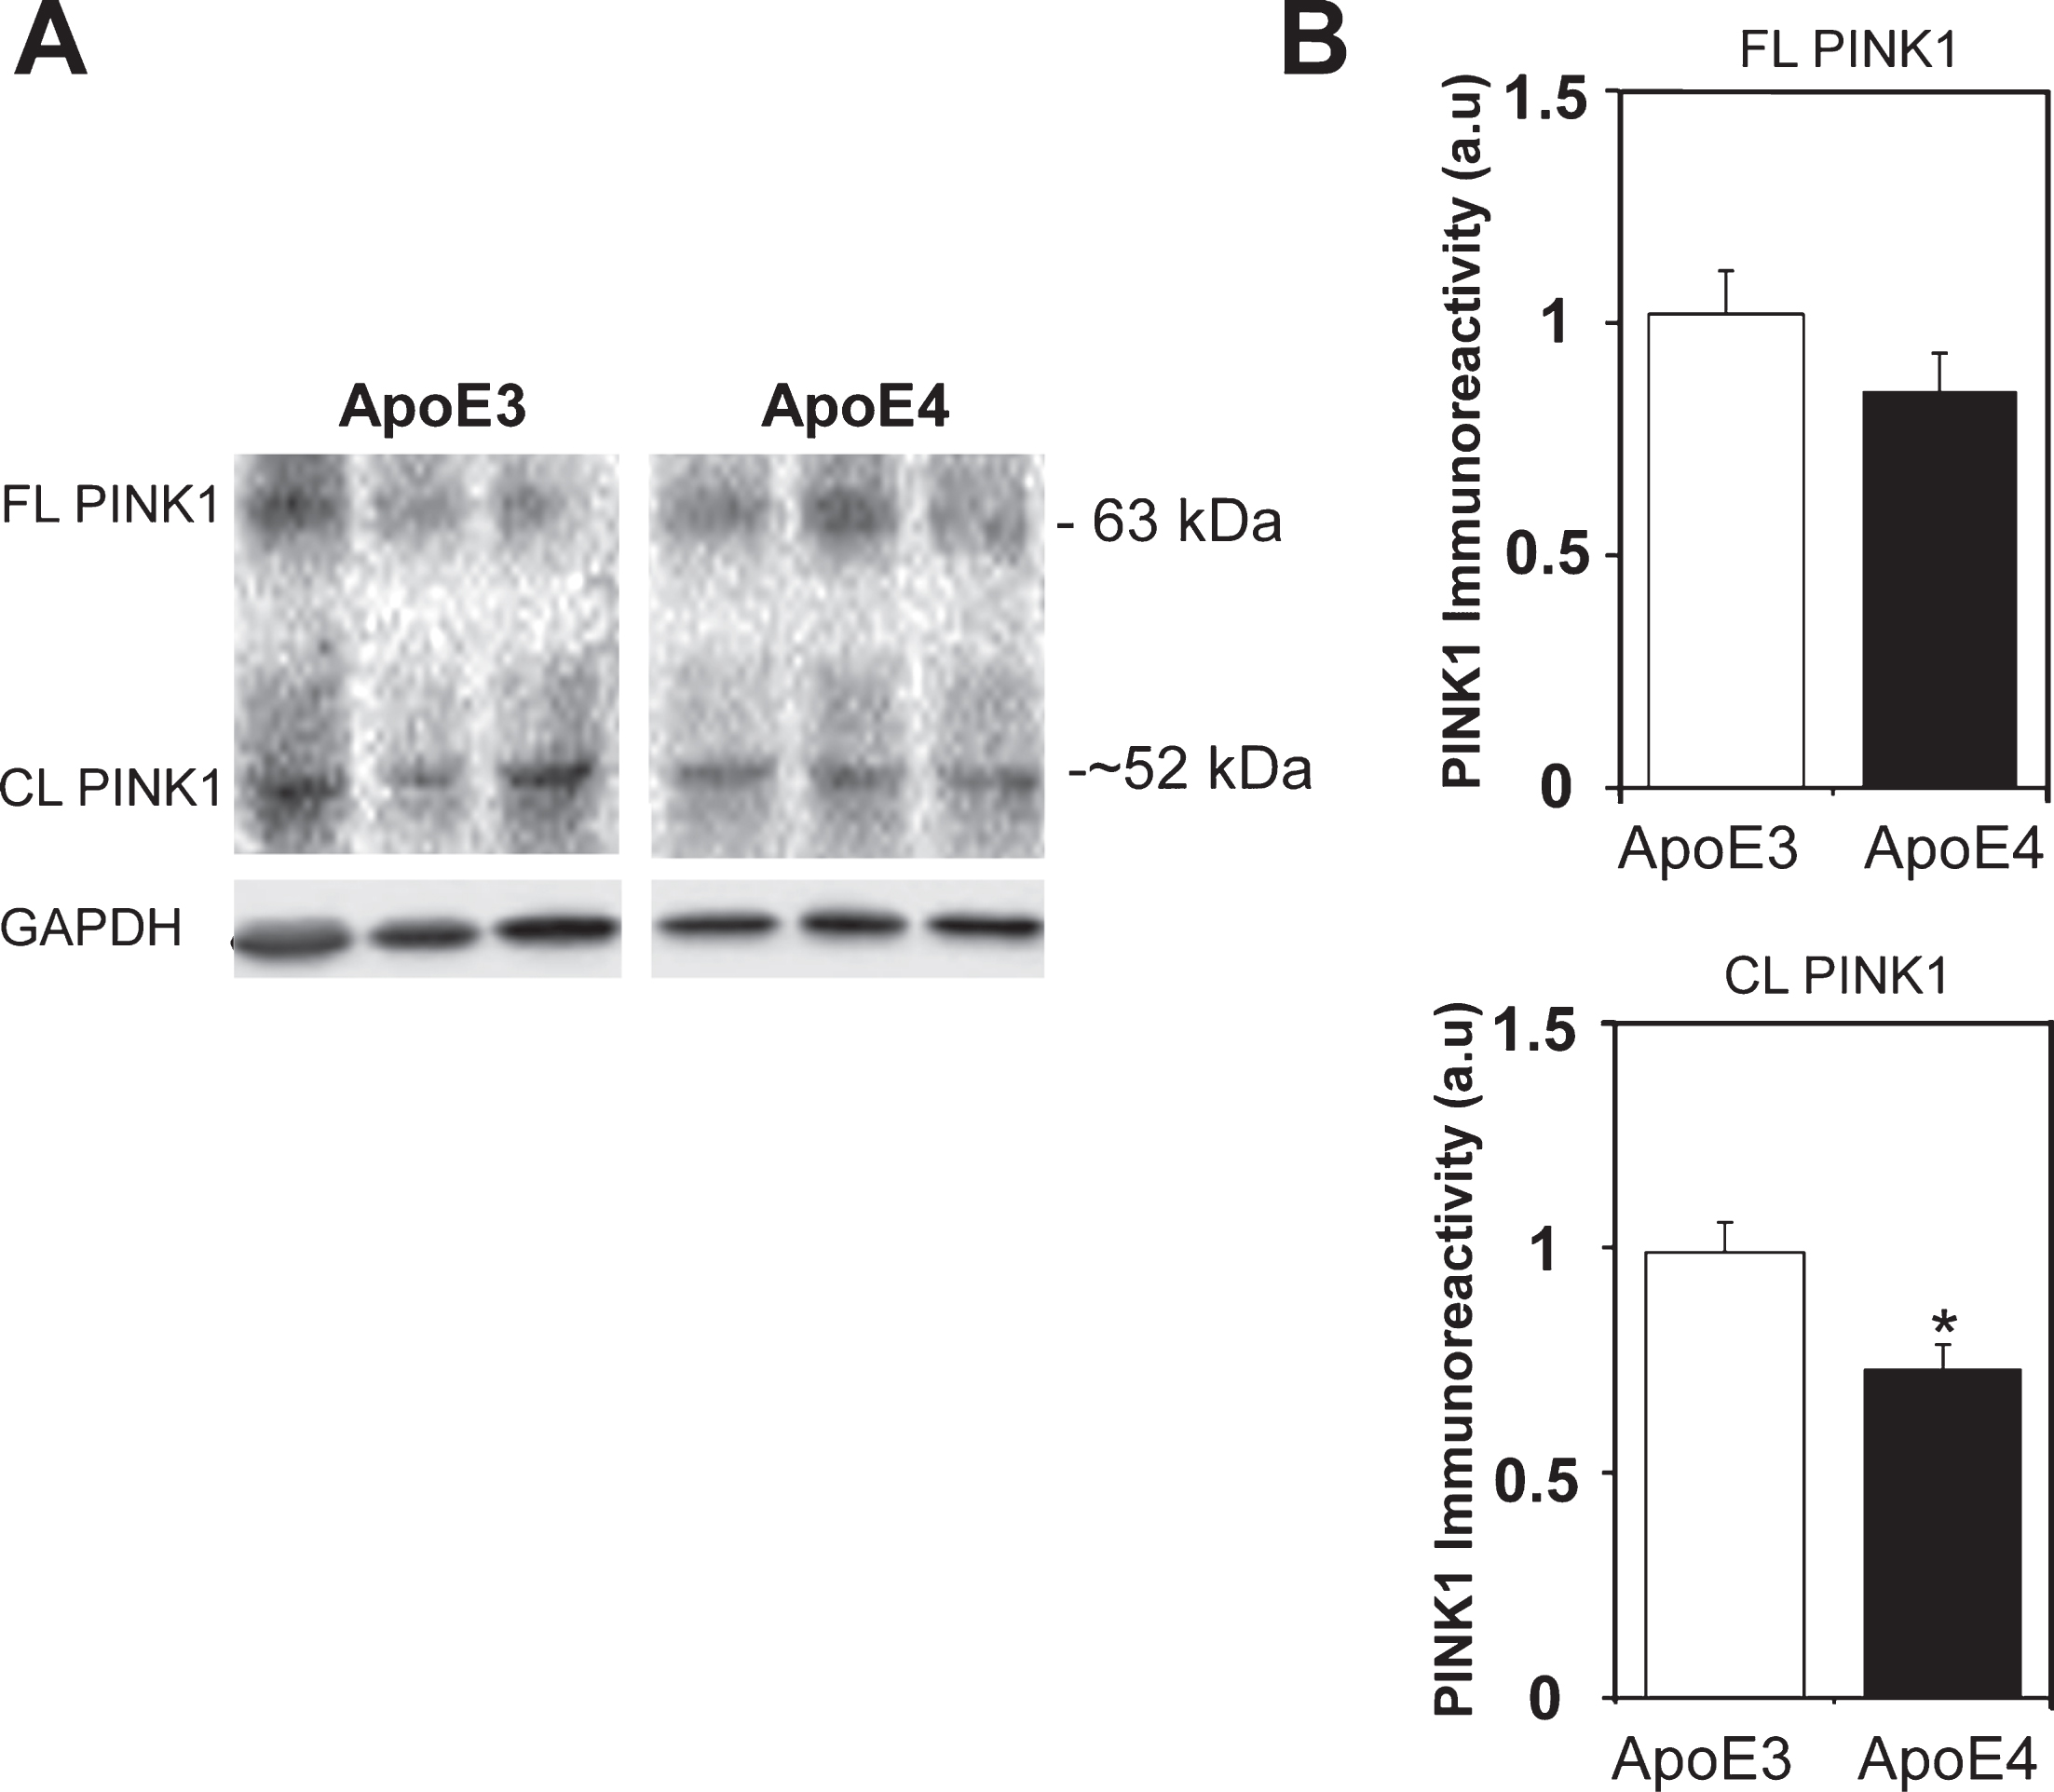
The levels of PINK1 in the hippocampal neurons of ApoE3 and ApoE4 female mice. A) Representative immunoblots of full-length (FL) and cleaved (CL) PINK1 of hippocampal 4-month-old ApoE3 and ApoE4 mice are shown on the left. B) Quantification of the results of the full-length PINK1 is shown in the right upper panel, and the results of the cleaved PINK1 are shown in the lower right panel (mean±SEM: n = 20 for ApoE3 mice and n = 19 for ApoE4 mice). White bars correspond to ApoE3 mice and black bars to ApoE4 (*p < 0.05).
The levels of parkin, which acts downstream of PINK1 and targets mitochondria for mitophagy, are presented in Fig. 4. As can be seen, there was marked parkin staining of the CA3 pyramidal neurons (Fig. 4A) as well as in the synaptic stratum lucidum. Quantification of these results revealed that the levels of brain parkin were markedly and significantly higher in the ApoE4 mice compared with the ApoE3 mice (5.31±0.96 and 1±0.37, respectively, p < 0.005). Similar results were obtained in the ApoE4 CA3 stratum lucidum synaptic subfield (6.99±1.99 and 1±0.5, for the ApoE4 and ApoE3 hippocampal brain sections, respectively, p < 0.05), as well as in the ApoE4 CA1 hippocampal subfield (5.2±0.81 and 1±0.35 for the ApoE4 and ApoE3 hippocampal brain sections, respectively, p < 0.005, Supplementary Figure 2A) and in the DG hilus (9.71±2.31 and 1±0.39 for the ApoE4 and ApoE3 hippocampal brain sections, respectively, p < 0.005, Supplementary Figure 2B). The parkin expression levels were also examined by immunoblot experiments that revealed a 60 kDa protein band (Fig. 4B). Quantitation of these results revealed, in accordance with the immunohistochemical results, that the levels of parkin in the hippocampus of ApoE4 mice were significantly higher in the ApoE4 hippocampal homogenates compared with those of the corresponding ApoE3 homogenates (1.65±0.26 and 1.03±0.07, respectively p < 0.005), indicating either a decreased degradation of parkin, or its increased synthesis. Taken together, the observed decrease in cleaved PINK1 and the increase of parkin in the ApoE4-expressing hippocampi might indicate that APOE4 primes mitochondria for degradation as well as inhibits mitophagy. The extent to which autophagy-related proteins are also affected by ApoE4 expression in the hippocampus was examined by following the expression levels of the ubiquitin-binding scaffold protein, p62/SQSTM1, which directs selected cargo (including mitochondria) to the autophagosomes and is degraded in the autophagolysosome [47]. As shown (Fig. 5), the levels of p62 in the hippocampus of APOE4-expressing mice were significantly higher than those of the ApoE3 mice (1.65±0.15, 0.98±0.09, respectively p < 0.005), indicating either that the ApoE4 hippocampi exhibit either reduced autophagic degradation or increased p62 synthesis. Accordingly, these results suggest that APOE4 is associated with altered mitochondrial dynamics, including changes in fusion, fission, and mitophagy.
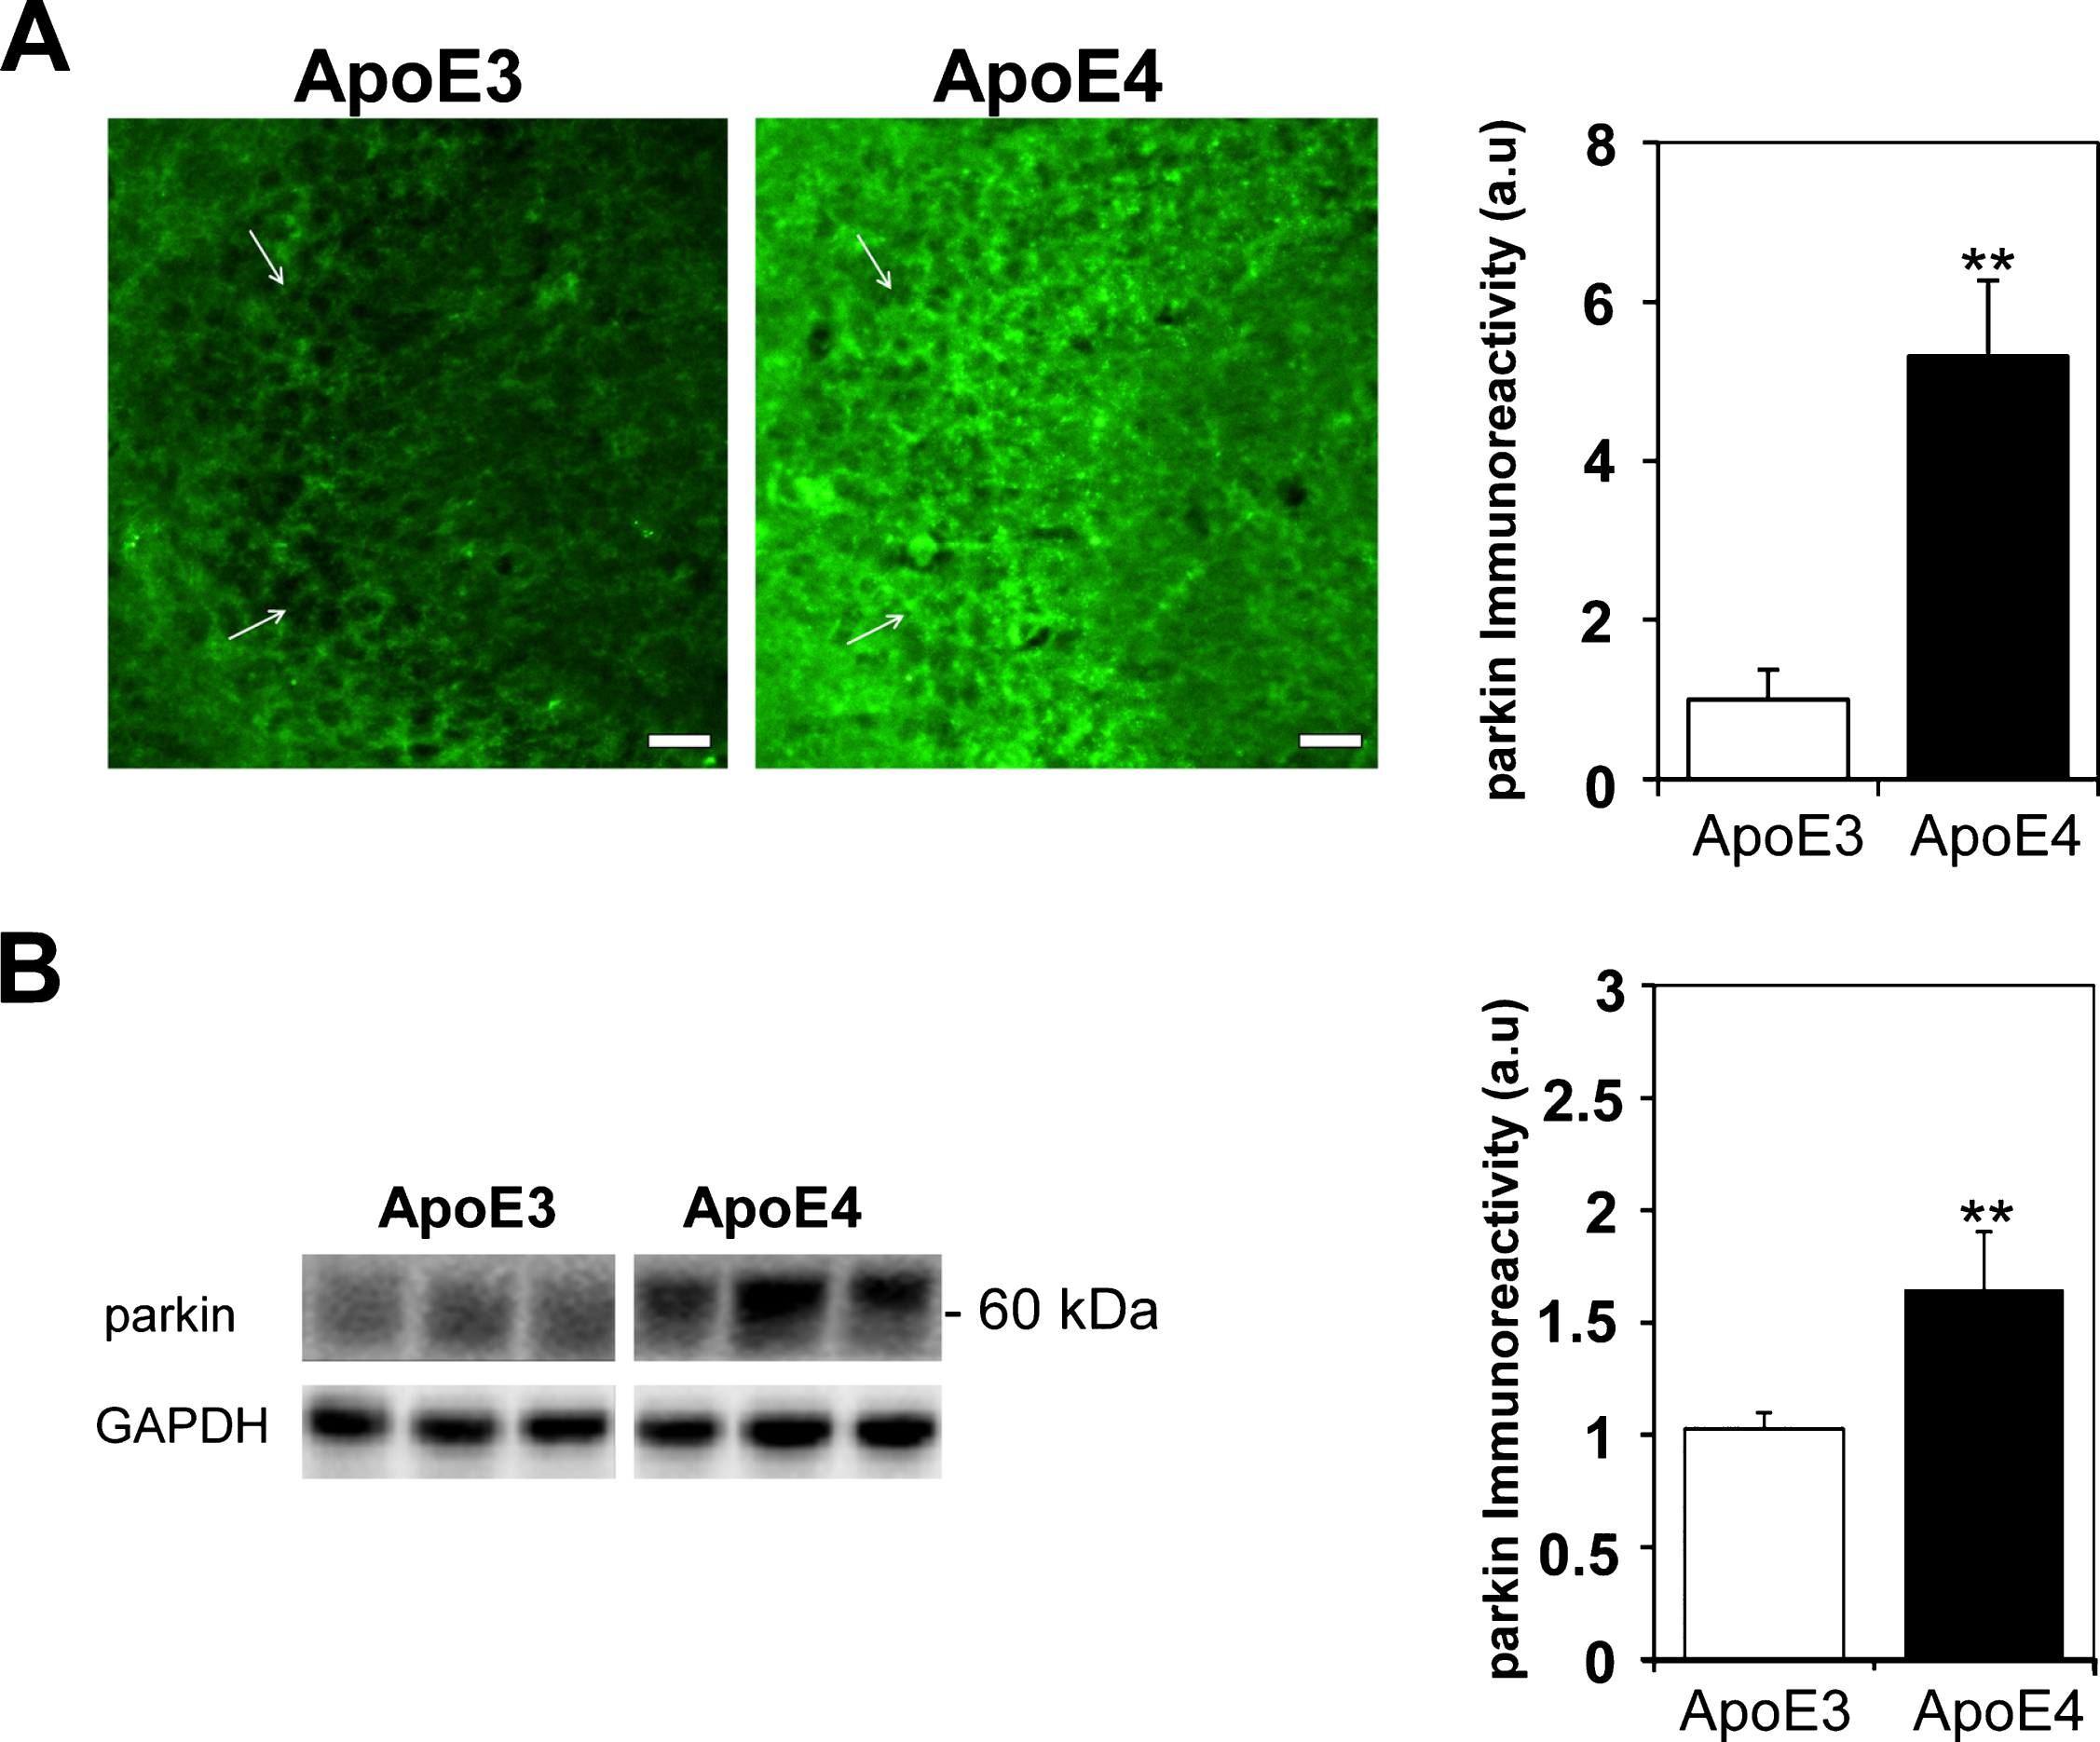
The levels of parkin in hippocampal neurons of ApoE3 and ApoE4 female mice. A) parkin immunohistochemistry. Representative images (X20 magnification) of the indicated CA3 hippocampal subfields of 4-month-old ApoE3 and ApoE4 mice are presented on the left. White arrowheads represent CA3 pyramidal cells. Scale Bar = 50μm. Quantification of the staining intensity in the CA3 pyramidal cells is shown on the right. Mean±SEM: n = 10 for ApoE3 (white bars) and n = 15 for ApoE4 mice (black bars); **p < 0.01, for ApoE4 compared to ApoE3. B) parkin immunoblots. Representative immunoblots of whole hippocampal homogenates using anti-parkin antibodies from ApoE3 and ApoE4 mice are presented on the left. GAPDH was used as a control for loading levels. Quantification of the results (mean±SEM; n = 15 per group) of ApoE3 mice (white bars) and ApoE4 mice (black bars) is depicted on the right (**p < 0.01).
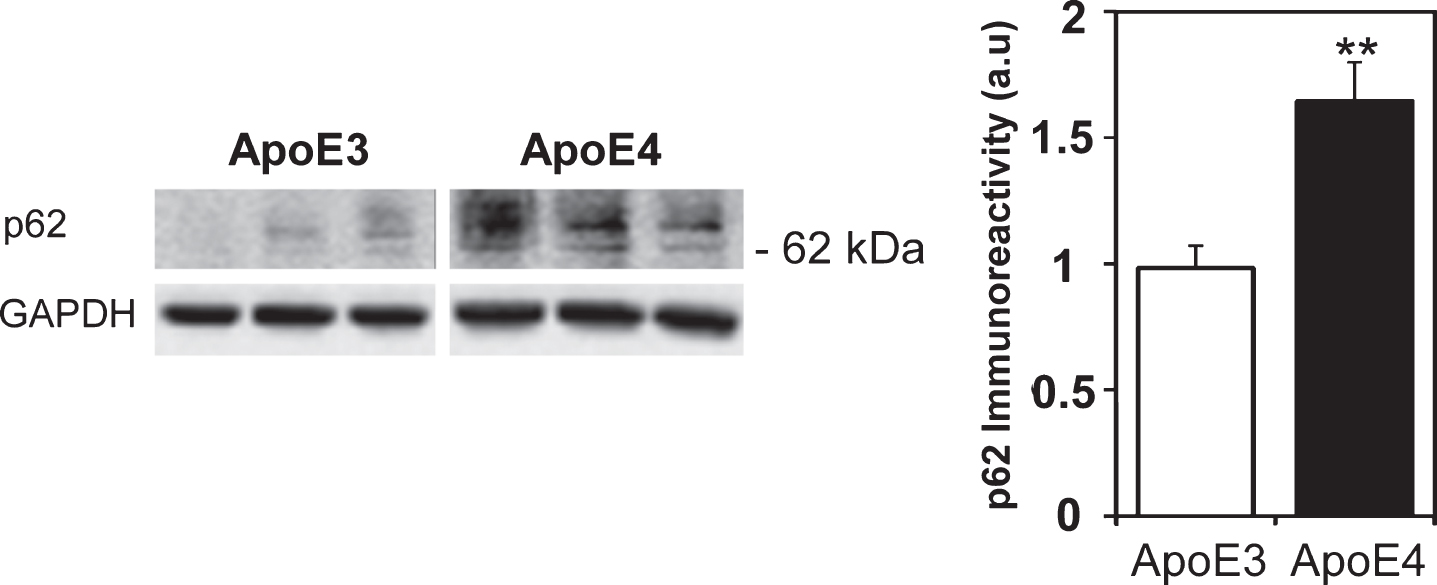
The levels of p62 in the hippocampal neurons of ApoE3 and ApoE4 female mice. Immunoblots of p62. Repressive immunoblots of whole hippocampal homogenates of the indicated 4-month-old ApoE3 and ApoE4 mice using anti-p62 antibodies are presented. GAPDH was used as a control for loading levels. Quantification of the results (mean±SEM; n = 15 per group) of ApoE3 mice (white bars) and ApoE4 mice (black bars) is depicted on the right (**p < 0.01).
To explore whether the altered mitochondrial dynamics protein expression is also accompanied with changes in mitochondrial morphology, we next examined the mitochondrial structure and cristae density in ApoE3 and ApoE4 mice hippocampi. As shown in Fig. 6A, ApoE4 mice exhibit higher number of elongated mitochondrial structures (2.94±0.26 and 1±0.36 for ApoE4 compared to ApoE3, respectively, p < 0.01), indicating either decreased mitochondrial fission/degradation or enhanced fusion. Additionally, the mitochondria of ApoE4 mice display less dense cristae, which is considered an indicator of impaired mitochondrial activity (0.64±0.07 and 1±0.06 for ApoE4 compares to ApoE3, respectively p < 0.01, Fig. 6B) [53, 54].

Transmission electron microscopy analysis of mitochondrial morphology and cristae density in ApoE3 and ApoE4 female mice hippocampus. Upper panel, representative mice hippocampus samples of hippocampal 4-month-old ApoE3 and ApoE4 mice (X10,000 magnification). Lower panel, quantification of elongated mitochondria, defined as mitochondria exhibiting Y axis is at least 2-fold of X axis (left graph) and mitochondrial cristae density (right graph). Mean±SEM: n = 17 fields of 2 animals for ApoE3 mice, and n = 20 fields of 2 animals for ApoE4 mice. White arrows designate representative mitochondria.
To further study the impact of APOE4 expression on mitochondrial dynamics and function, we next examined the expression of the mitochondrial electron chain transport protein COX1 and the mitochondrial transporter Tom40. As shown in Fig. 7A, the levels of COX1 staining in the CA3 subfield were markedly higher in the ApoE4 compared to the ApoE3 mice (2.17±0.28 and 1±0.24, respectively p < 0.01). Similar results were obtained in the CA1 subfield (2.11±0.26 and 1±0.23, respectively p < 0.01, Supplementary Figure 3A). However, there were no differences in the DG subfield (1.1±0.12 and 1±0.15 for the ApoE4 and ApoE3 hippocampal brain sections, respectively p > 0.05, Supplementary Figure 3B). Comparable effects were obtained by immunoblot analysis using anti-COX1 antibodies, which detected a 60 kDa band (1.58±0.13 and 1.1±0.18 for the ApoE4 and ApoE3 mice, respectively p = 0.05, Fig. 7B). The levels of Tom40 in the CA3 subfield were also higher in the ApoE4 than in the ApoE3 hippocampal brain sections (1.84±0.16 and 1±0.24, respectively p < 0.01) (Fig. 8A). A similar trend was also observed in the CA1 (2.26±0.48 and 1±0.24, respectively p > 0.05, Supplementary Figure 3C) and the DG (3.12±0.45 and 1±0.24 for the ApoE4 and ApoE3 hippocampal brain sections, respectively p < 0.005, Supplementary Figure 3D). Tom40 immunoblot experiments (Fig. 8B) revealed a 40 kDa band whose intensity was significantly higher in the ApoE4 than the ApoE3 mice (1.52±0.12 and 1.01±0.08, respectively, p < 0.01). These observed increases in mitochondrial markers may represent a compensatory response to the observed effects of APOE4 on mitochondrial dynamics or they might reflect decreased mitophagic degradation.

The levels of the mitochondrial protein COX1 in hippocampal neurons of ApoE3 and ApoE4 female mice. A) COX1 immunohistochemistry. Representative images (X10 magnification) of the indicated CA3 hippocampal subfields in 4-month-old ApoE3 and ApoE4 mice are presented on the left. Scale Bar = 100μm. Quantification of the staining intensity in the CA3 pyramidal cells is shown on the right. Mean±SEM: n = 10 for ApoE3 (white bars) and n = 15 for ApoE4 mice (black bars); **p < 0.01, for ApoE4 compared to ApoE3. B) COX1 immunoblot. Representative immunoblots of the ApoE3 and ApoE4 mice are shown on the left. GAPDH was used as a loading control. Quantification of the results (mean±SEM; n = 15 per group) of ApoE3 mice (white bars) and ApoE4 mice (black bars) is depicted on the right (p = 0.05).

The levels of the mitochondrial protein channel Tom40 in hippocampal neurons of ApoE3 and ApoE4 female mice. A) Tom40 immunohistochemistry. Representative images (X10 magnification) of the indicated CA3 hippocampal subfields of 4-month-old ApoE3 and ApoE4 mice are presented on the left. Scale Bar = 100μm. Quantification of the staining intensity in the CA3 pyramidal cells is shown on the right. Mean±SEM: n = 10 for ApoE3 (white bars) and n = 15 for ApoE4 mice (black bars); **p < 0.01, for ApoE4 compared to ApoE3. B) Tom40 immunoblot. Representative immunoblots of whole hippocampal homogenates of ApoE3 and ApoE4 mice are depicted on the left. GAPDH was used as a loading control. Quantification of the results (mean±SE; n = 15 per group) of ApoE3 mice (white bars) and ApoE4 mice (black bars) is shown on the right (**p < 0.01).
The extent to which the observed effects of APOE4 on mitochondrial dynamics in the mouse also occur in human AD brains was next examined. To this end, the levels of DRP-1 in brain tissue from AD patients homozygous for either APOE ɛ4/ɛ4 or APOE ɛ3/ɛ3 (namely APOE4/4 and APOE3/3) and from corresponding age-matched normal controls were determined by immunoblot analysis. As can be seen in Fig. 9, the levels of DRP-1 in the APOE4/4 AD patients (0.37+ 0.21) were markedly lower than those of both APOE3/3 AD patients and normal controls (0.83±0.46, p < 0.05 and 1.01±0.27, p < 0.005, respectively). The levels of DRP-1 of the APOE3/3 AD patients were slightly but not significantly lower than those of normal non-AD controls. These results are consistent with a similar trend was obtained with the ApoE4 mice (Fig. 1, p = 0.05).
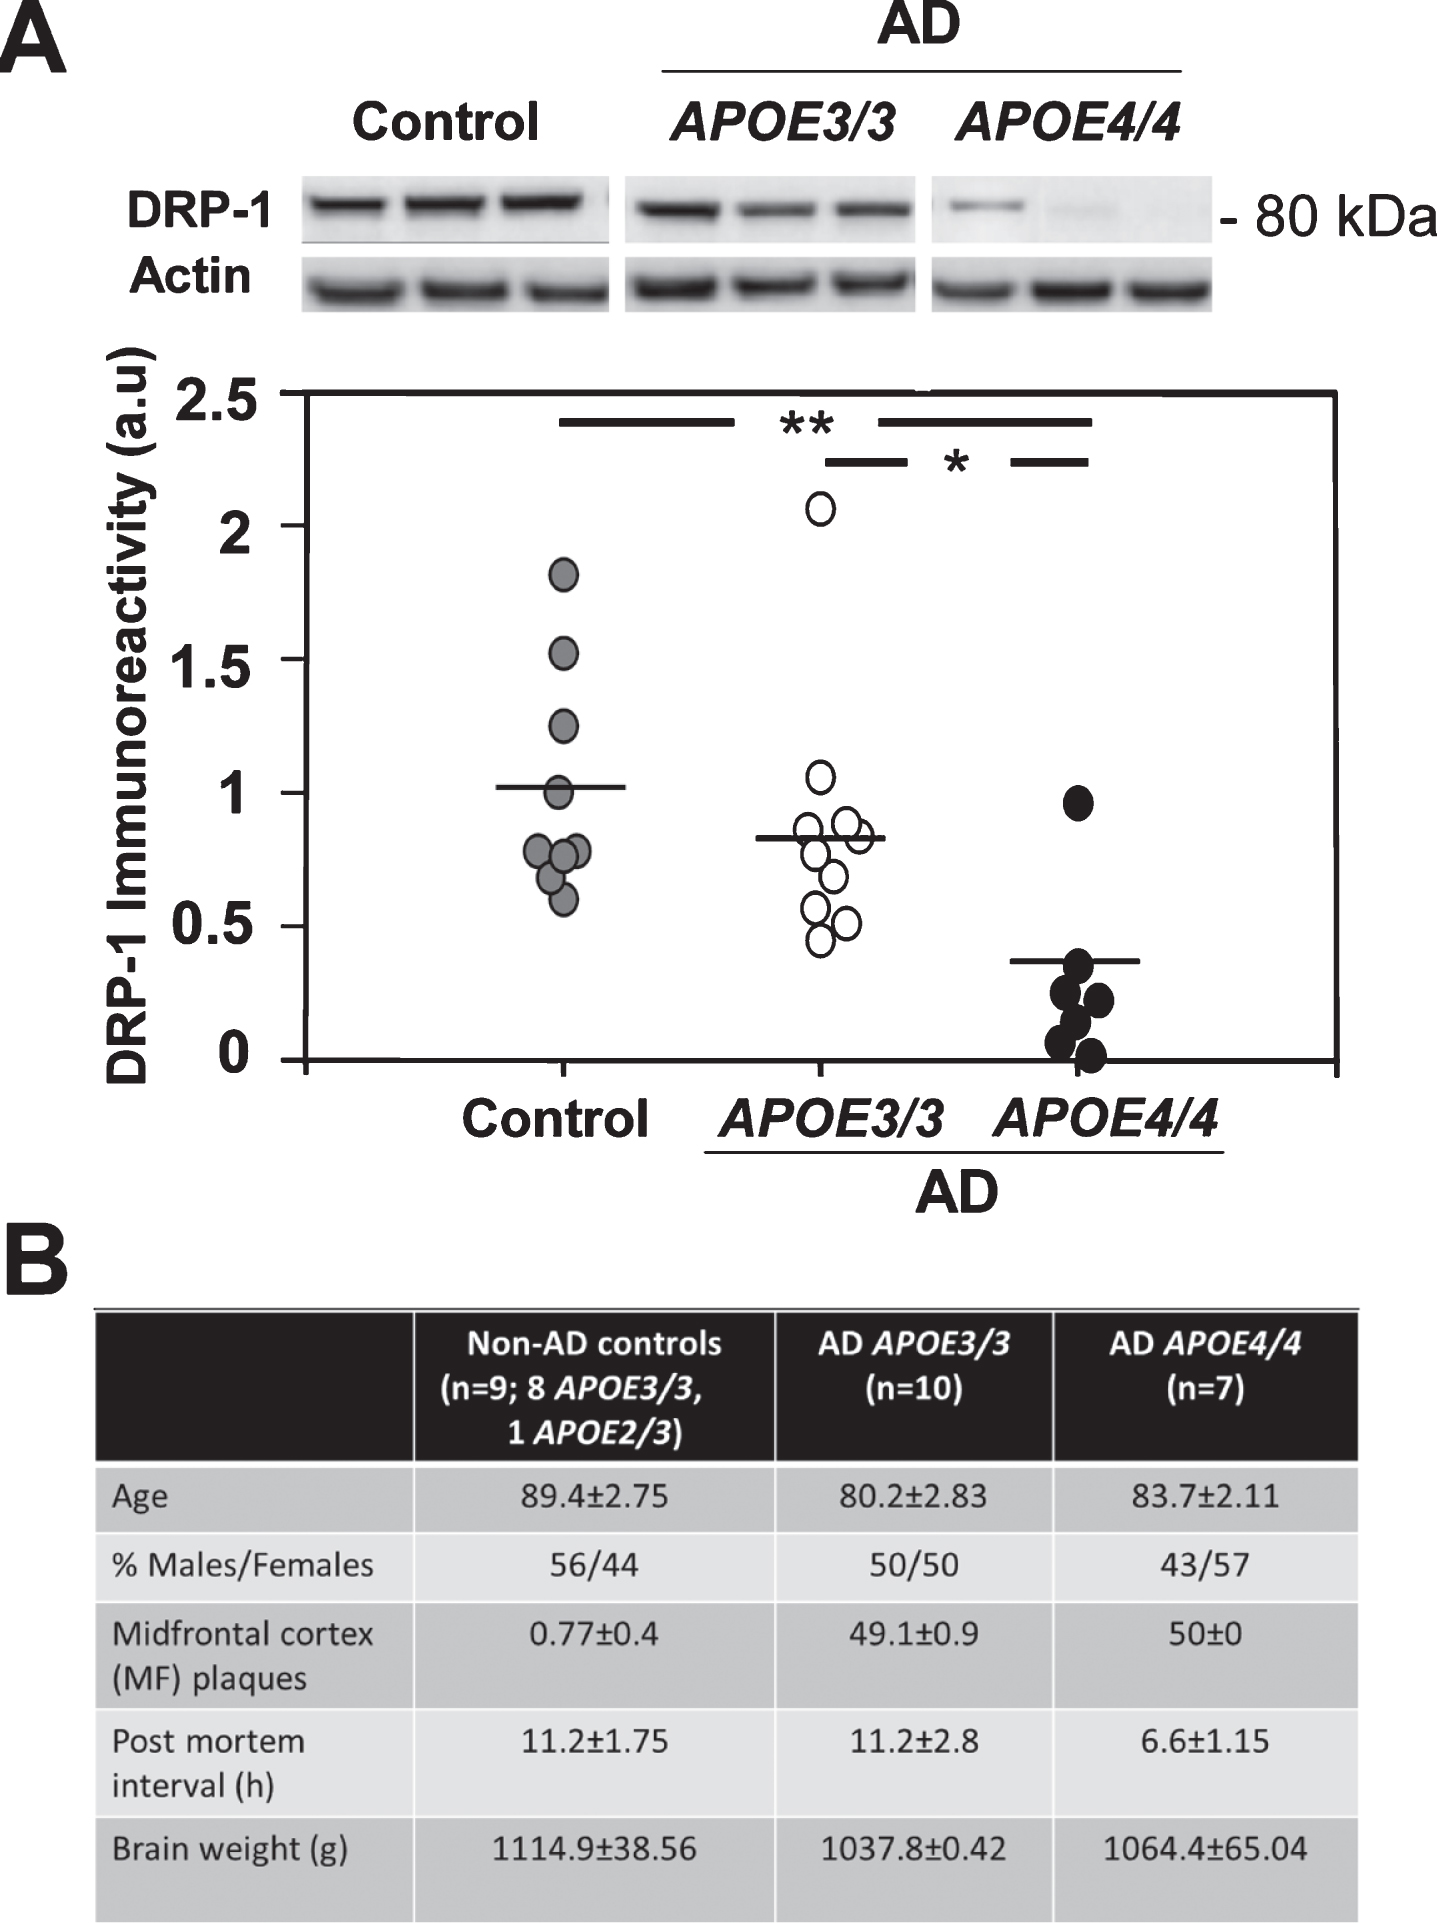
The levels of DRP-1 in human brains of control and in APOE4/4 and APOE3/3 AD patients. A) Brain tissue from the frontal temporal cortex of APOE4/4 (n = 7) and APOE3/3 (n = 10) AD patients and of age-matched normal controls (APOE3/3, APOE2/3; n = 9) were collected and immunoblotted as described in Materials and Methods. Results are the mean±SEM of the different groups. p < 0.01 for one-Way ANOVA for the effects of groups. *p < 0.05 for post-hoc Tukey Krammer analysis for a comparison of the AD APOE4/4 and APOE3/3 groups, and **p < 0.01 for such a comparison of the AD APOE4/4 and the control groups. B) Table summarized clinical and demographic data: age, % males, midfrontal (MF) plaques, postmortem interval (h) and brain weight (g); mean±SE.
DISCUSSION
This study examined the effects of APOE4, the most prevalent genetic risk factor for AD, on the levels of mitochondrial dynamics proteins expression in the hippocampus of female ApoE-targeted replacement mice. Immunohistochemical and immunoblot measurements of the levels of the mitochondrial fusion-related protein, MFN1, and the fission-related protein, DRP-1, in the hippocampus revealed that APOE4 is associated with both elevated levels of the fusion protein MFN1 and reduced levels of DRP-1. The levels of the PINK1 cleavage product, which is regulated by the mitochondrial membrane potential, were lower in the hippocampus of the ApoE4 mice. The levels of parkin, an E3 ubiquitin ligase that labels mitochondrial proteins and damaged mitochondria for degradation through the proteasome and via mitophagy, respectively, were significantly higher in the hippocampus of the ApoE4 compared with ApoE3 mice. The levels of the ubiquitin-binding scaffold protein, p62/SQSTM1, which directs selected cargo (e.g., mitochondria) to the autophagosomes and undergoes degradation in the autophagoslysosome [47], were also higher in ApoE4 compared with ApoE3 mice. Taken together, these findings indicate that mitochondrial dynamics, namely, fusion, fission, and mitophagy, are altered in ApoE4 mice. These findings might point out that fusion is increased, and the processes of fission and mitophagic degradation are hindered in the ApoE4 mice, resulting in the accumulation of proteins such as parkin and p62, which are normally degraded during mitophagy [46, 47]. The finding that these effects were accompanied by elevated levels of COX1 and Tom40 may reflect a compensatory response to the observed mitochondrial changes or may result from the decreased mitochondrial degradation. The elevated levels of COX1 and Tom40 are localized primarily to the neuronal perikarya of the hippocampal CA1, CA3, and DG subfields of ApoE4 mice, although COX1 is expressed to a lesser extent in the dentate gyrus. These observed altered mitochondrial dynamics in ApoE4 mice may be independent on Aβ pathology or may be mediated indirectly via the reported effects of APOE4 on the accumulation of Aβ [40].
Elevated levels of MFN1 and mitochondrial fusion (Fig. 1) have been observed in several stressed cellular systems including HEK-293 cells and primary hippocampal neurons overexpressing full-length tau [48], as well as in aged human dermal cells [49]. In addition, the brain neurons of young APP mice have increased mitochondrial fusion, whereas during aging fission is increased [50]. Accordingly, it is possible that the presently observed elevated levels of the mitochondrial fusion protein MFN1 in ApoE4 mice represent a compensatory response to the APOE4-induced stress and synaptic pathology [38, 40]. Interestingly, in AD patients [19, 21] and in the corresponding aged (12 months) mouse models, the levels of MFN1 are lower than those of controls [16, 22], whereas the levels of the fission protein DRP-1 are variable and inconsistent in different studies of AD [10, 19–22], unlike the lower levels that were observed both in ApoE4 mice and AD patients (Figs. 2 and 9). The finding that the levels of MFN1 are elevated in young ApoE4 mice but are reduced in AD patients and in aged mouse models could be because the presently observed effects of APOE4 are monitored early, when the compensatory response can still counteract the pathology. In contrast, the effects of APOE4 in AD patients and in the aged mouse models on MFN1 and DRP-1 may be driven primarily by age-dependent degeneration.
The observed reduction in the levels of cleaved PINK1 and the increase of parkin in ApoE4 hippocampi (Figs. 3 and 4) are similar to the observed changes in the levels of these proteins in AD [23, 24] as well as in AD mouse models [22, 25], and in wild-type mice injected intracerebrally with Aβ [51]. Unlike the presently described increase in p62 in ApoE4 hippocampi (Fig. 5), the reported levels of p62 in AD patients and in AD models including APP transgenic mice are inconsistent [24, 31].
The elevated levels of parkin and p62 in ApoE4 mouse brains may be due to nonfunctional/impaired mitophagy, resulting in the accumulation of damaged mitochondria, since parkin and p62 are degraded during normal mitophagy [17, 46]. Indeed, we and others have previously shown that autophagy is impaired in APOE4-expressing cells [30–32], which might also negatively affect the process of mitophagy. This could be driven by various mechanisms [31, 33], for example, the recently described binding of ApoE4 to CLEAR motifs, which inhibits autophagy [32].
The reduced levels of cleaved PINK1 in mice probably reflects compromised mitochondrial membrane potential, although other techniques should be employed in order to validate this possibility. Such a decrease in the mitochondrial membrane potential could result from reduced fission and mitophagic degradation of mitochondria in the ApoE4 mice, leading to impaired removal of damaged mitochondria and their accumulation in the cells.
Importantly, the altered expression of mitochondrial dynamics proteins found in ApoE4 mice brains is also accompanied by consistent changes in mitochondrial morphology, namely, elongated mitochondria and less dense cristae (Fig. 6). The elongated mitochondria are indicative of reduced mitochondrial fission/degradation and/or enhanced fusion, and the abnormal cristae density might indicate deficient mitochondrial activity [53, 54].
APOE4 in young targeted replacement mice is associated with neuronal pathology such as reduced levels of presynaptic nerve terminals [38] and activation of astrocytes [40], as well as activation of HIF-1α [52]. It is thus possible that these stress-related events trigger mitochondrial damage that results in compensatory elevated levels of mitochondrial fusion protein as well as COX1 (Fig. 7) and Tom40 (Fig. 8). Such a response has been demonstrated in AD, where it was shown that the levels of the mitochondria marker COX1 are higher in young subjects and fall in AD [6–9], as well as in AD models, which were shown to exhibit higher levels of COX1 at a young mice [10, 38]. Alternatively, the high levels of Tom40 and COX1 may result from decreased mitophagy, leading to the accumulation of mitochondrial proteins.
Conclusions
In summary, the present findings show that in mice expressing APOE4 the levels of the mitochondrial fusion protein, MFN1, are raised and the levels of the corresponding fission protein, DRP-1, are reduced, suggesting that the fusion of mitochondria is enhanced and that their fission is inhibited by APOE4. In addition, APOE4 was shown to be associated with impaired mitophagy. Collectively, this suggests a novel pathological effect of APOE4 and might pave the way for identifying novel therapeutic targets.
Availability of supporting data
The data sets generated and analyzed during the current study is included in this article and its supplementary material. In addition, the data is available from the corresponding author upon request.
Footnotes
ACKNOWLEDGMENTS
We would like to thank Alexander Smolar for technical assistance and for maintaining the mice colonies. This work was supported in part by grants to DMM from the Israel Science Foundation (grant No. 794-17), the Sagol Foundation, the Joseph K. and Inez Eichenbaum Foundation, and the Harold and Eleanore Foonberg Foundation, and to RPK by the Prajs-Drimmer Institute for the development of anti-degenerative drugs.
This research was supported in part by grants to DMM from the Israel Science Foundation (grant No. 794-17), the Sagol Foundation, the Joseph K. and Inez Eichenbaum Foundation, and the Harold and Eleanore Foonberg Foundation, and to RPK by the Prajs-Drimmer Institute.