
Abstract
The accumulation of amyloid-β protein (Aβ) and tau in the brain is a major pathological change related to Alzheimer’s disease. We have continued to develop Extracorporeal Blood Aβ Removal Systems (E-BARS) as a method for enhancing Aβ clearance from the brain. Our previous report revealed that dialyzers effectively remove blood Aβ and evoke large Aβ influxes into the blood, resulting in a decrease in brain Aβ accumulation after initiating hemodialysis, and that patients who underwent hemodialysis had lower brain Aβ accumulation than those who did not. Here, plasma total tau concentrations from 30 patients undergoing hemodialysis were measured using an ultrasensitive immunoassay and compared to those from 11 age-matched controls. Plasma total tau concentrations were higher in patients with renal failure regardless of whether they underwent hemodialysis, suggesting the involvement of the kidneys in tau degradation and excretion. Hemodialyzers effectively removed blood Aβ but not extracorporeal blood tau. The influx of tau into the blood was observed at around the 1 h period during hemodialysis sessions. However, the influx amount of tau was far smaller than that of Aβ. Furthermore, histopathological analysis revealed similar, not significantly less, cerebral cortex phosphorylated tau accumulation between the 17 patients who underwent hemodialysis and the 16 age-matched subjects who did not, although both groups showed sparse accumulation. These findings suggest that hemodialysis may induce both tau and Aβ migration into the blood. However, as a therapeutic strategy for Alzheimer’s disease, it may only be effective for removing Aβ from the brain.
INTRODUCTION
Abnormally phosphorylated tau (p-tau) and amyloid-β proteins (Aβ), mainly the 40-amino acid (Aβ1–40) and 42-amino acid (Aβ1–42) forms, are two major hallmarks in the brains of individuals with Alzheimer’s disease (AD), both of which impair neurological functions. Aβ1–42 aggregates more easily and is thus more toxic. Furthermore, soluble Aβ oligomers are more likely than Aβ monomers to cause synapse loss and affect long-term potentiation of hippocampal neurons [1–2]. Recent findings have suggested that decreased clearance of Aβ from the brain may be a mechanism for the increase in brain Aβ in AD, especially in sporadic cases. Although the production of Aβ in the brains of patients with AD was found to be similar to that in normal subjects, its clearance was 30% lower [3].
As a method for enhancing the clearance of Aβ from the brain, we have proposed an Extracorporeal Blood Aβ Removal System (E-BARS) based on our hypothesis that the rapid removal of Aβ from the blood may act as a peripheral Aβ drainage for the brain (Fig. 1a) [4]. Several data supporting our hypothesis have been identified as will be described later.

Schematic diagrams of the Extracorporeal Blood Aβ Removal System (E-BARS) and tau. a) Hypothesis of the Extracorporeal Blood Aβ Removal System (E-BARS); 1) An Aβ removal device removes blood Aβ in an extracorporeal circulation system; 2) rapid decrease in plasma Aβ and 3) triggering of accelerated Aβ transport from the brain into the blood. b) Evidence and supporting data for the hypothesis of the E-BARS. Evidence for (1) in Fig. 1a: hemodialyzers of appropriate materials and HexDC are able to remove plasma Aβ effectively (removal rates of 30%–97%, depending on circulation conditions). Evidence for (2): plasma Aβ concentrations decreased (Aβ1–40: around 50%, Aβ1–42: around 35%) in a 4 h HD session. Evidences for (3): (a) large Aβ influxes into the blood were observed during the HD session, one form of the E-BARS (Aβ1–40: 9.2 μg, Aβ1–42: 0.7 μg); (b) brain Aβ deposition as senile plaques were lower in HD patients than in age-matched controls (perhaps due to blood Aβ removal); (c) brain Aβ accumulation in a HD patient was decreased by – 0.19 SUVR after 6 months of HD, which was confirmed through PiB/PET; (d) rat studies showed that Aβ concentrations in the cerebrospinal fluid (CSF) decreased during blood Aβ removal using HexDC; (e) cognitive function in HD patients were maintained or slightly improved during 18 or 36 months of HD; (f) dementia risk in HD patients decreased as HD duration increased. c) The aim of this study was to determine whether or not tau is removed using the E-BARS. HD, hemodialysis; conc., concentration; HexDC, hexadecyl alkylated cellulose beads.
Another confirmed hallmark of AD is the increase in total tau (t-tau) and p-tau in the cerebrospinal fluid (CSF), which can be a useful biomarker for the diagnosis of AD [5]. Plasma t-tau [6] and p-tau [7] are also higher in AD, which suggests a correlation between tau levels in the plasma and the brain. Plasma tau concentrations range from around 0.1 to 10 pg/ml [6], while those in the CSF range from around 60 to 1000 pg/ml [6, 8], almost 100 times higher than that in the plasma. Therefore, there seems to be a certain tau excretion pathway from the brain into the blood, although tau is 10 times larger (around 50 kDa) than Aβ (around 4 kDa). In fact, intracranially administered tau was found in the plasma within minutes after anti-tau antibody (HJ8.5) had been peripherally administered [9]. Thus, circulatory and peripheral clearance of tau and Aβ has been proposed as a potential therapeutic target for AD [10].
However, to the best of our knowledge, no report has investigated whether or not blood purification techniques, such as hemodialysis (HD), remove plasma tau and reduce brain tau. Recently, we obtained a very sensitive system for detecting plasma t-tau [11], through which we have attempted to investigate changes in t-tau concentrations during HD, one of the E-BARS.
Regarding Aβ removal through the E-BARS, as shown in the brain depicted in Fig. 1a, several proteins, such as LRP-1, ApoJ, and ApoE, have been reported to work as Aβ transporters of the Aβ influx pathway into the blood [12,13, 12,13]. Receptor for advanced glycation end products (RAGE) has also been considered a bidirectional Aβ transporter between the blood and the brain [14], while perivascular elimination of Aβ in brain capillaries has been also proposed [15].
Some evidence obtained by us for Aβ removal through the E-BARS is presented in Fig. 1b. We found that a medical adsorptive material consisting of hexadecyl alkylated cellulose beads (HexDC) can act as an Aβ remover (Evidence 1 in Fig. 1b) [4, 16]. Furthermore, based on our analyses of patients undergoing HD, we previously reported that dialyzers of appropriate materials showed Aβ removal efficiencies as high as around 50% for both Aβ1–40 and Aβ1–42 (Evidence 2 in Fig. 1b) [17 –19].
The mechanism whereby dialyzers remove blood Aβ is mainly through adsorption [20, 21]. Interestingly enough, a large influx of Aβ into the blood had been observed from certain tissues during HD, which removed blood Aβ (Evidence 3a in Fig. 1b) [17 –19]. Related to the origin of this large Aβ influx, we reported histopathological studies showing that Aβ accumulation in the brains of patients undergoing HD was significantly lower than that of age-matched controls not undergoing HD (Evidence 3b in Fig. 1b) [22], suggesting that the brain may be one of the origins of the Aβ influx during HD sessions. As more direct evidence, brain Aβ accumulation in a patient undergoing HD decreased by – 0.19 SUVR after 6 months of HD, which was confirmed using PiB/PET (Evidence 3c in Fig. 1b) [23]. Furthermore, rat studies showed that Aβ concentrations in the CSF decreased while plasma Aβ concentrations increased during blood Aβ removal, with HexDC columns achieving Aβ removal efficiencies of around 90% (Evidence 3d in Fig. 1b) [24].
A prospective study of 30 patients undergoing HD found that cognitive function had been maintained or slightly improved (Evidence 3e in Fig. 1b) [19]. Recently, a statistical analysis of over 200,000 patients undergoing HD in Japan reported that a longer HD duration was correlated with a lower risk of dementia (Evidence 3f in Fig. 1b) [25].
Several other groups also reported that removing blood Aβ may be useful for AD therapy. Peritoneal dialysis, one of the dialysis modalities albeit using devices different from those used in HD, also reduced plasma Aβ in the peritoneal-dialysis patients and reduced brain Aβ in mouse AD models (APPswe/PSEN1dE9 transgenic mice) [26]. Furthermore, plasma exchange therapy was effective in improving cognitive function in patients with AD [27]. This method consists of two steps: 1) discarding plasma containing Aβ and 2) administering albumin, another Aβ-binding substance, as a supplemental solution. Furthermore, although not a direct blood purification technique using artificial devices, parabiosis (connecting the blood circulation of AD model transgenic mice with that of normal wild-type mice) reduced brain Aβ deposition in AD model mice through the normal organs of wild-type mice [28]. Thus, the removal of blood Aβ through peripheral Aβ clearance has attracted considerable attention as a potential therapeutic strategy for AD [29].
Here, we investigate whether devices used for blood Aβ removal, such as hemodialyzers and HexDC, are also able to remove plasma tau and whether HD affects tau concentrations in the blood and tau accumulation in the brain (Fig. 1c).
MATERIALS AND METHODS
Ethical considerations
This study was conducted in accordance with the Declaration of Helsinki and Good Clinical Practice. This research was comprehensively reviewed and approved by the institutional review board of Fujita Health University, the institution responsible for the entire study.
Subjects for blood analysis
The demographics of subjects for blood analysis are summarized in Table 1. None of the subjects had diabetes mellitus, a risk factor for AD. After obtaining written consent, blood samples were obtained from 11 age-matched controls with healthy renal function (HCTL group) (five males and six females) between the ages of 62–72 (67.8±3.9) years and 30 patients with renal failure (RF group) (18 males and 12 females) between the ages of 48–86 (69.8±9.2) years at the time of the first blood collection. Among the 30 RF subjects, 24 had already undergone HD at the first blood collection (withHD/RF group). Moreover, five RF patients had not undergone HD at the start of prospective follow-up (nonHD/RF group) but were included into the withHD/RF group after initiation of HD. One patient with RF, whose first blood sample was collected just before initiation, was included on the day HD was initiated. The five nonHD/RF patients and one withHD/RF patient were prospectively investigated several times during the study period.
Demographics of the subjects for blood collection
HCTL, age-matched controls with normal renal function; RF, renal failure patients; HD, hemodialysis; nonHD, RF who did not receive HD; withHD, RF who received HD.
Blood samples from six withHD/RF patients were collected at the inlet (pre) and outlet (post) of the hemodialyzers at 1 and 4 h of a HD session to determine the removal efficiencies for tau and Aβ. Pre (inlet) hemodialyzer samples from 21 withHD/RF patients collected at 1 and 4 h of a HD session were analyzed for changes in tau and Aβ concentrations during HD sessions.
Given that HexDC removed Aβ very effectively [4, 16], we investigated the tau removal activity of HexDC. HexDC (LIXELLE®, Kaneka, Osaka, Japan) has been used for the removal of β2-microglobulin from the blood to treat carpal tunnel syndrome, a complication of HD. Subjects from RF007 to RF011 (Table 1) underwent apheresis for the removal of β2-microglobuline using HexDC during HD sessions. For these patients, t-tau concentrations were measured at the inlet (pre) and outlet (post) of the HexDC columns, which were equipped tandemly just after the hemodialyzers.
Cognitive function was assessed using the Mini-Mental-State Examination (MMSE).
Treatment of blood samples
Blood was sampled with bis-potassium ethylendiamine triacetate (EDTA-2K) and centrifuged as soon as possible after sampling. The collected samples were divided into aliquots of 200–300 μl in polypropylene tubes. Plasma aliquots were stored at –20°C for several hours. The frozen plasma was then transferred into a deep freezer and stored at –80°C. Freeze and thaw cycles were minimized. Plasma Aβ concentrations at the inlet of the hemodialyzer were considered to be equivalent to those in the whole-body circulation at the designated times.
Calculation of removal efficiency and estimated influx
The removal efficiency of a hemodialyzer or HexDC column was calculated as follows:
A decrease in plasma concentration is expressed using a negative sign. Eq (3)
Dialysis sessions were divided into two periods: 0–1 h and 1–4 h. The concentration of Aβ or tau at the inlet of a device was the average of each period: the average concentrations at 0 and 1 h for the 0–1 h period and average concentrations at 1 and 4 h for the 1–4 h period. The removal efficiency for the 0–1 h period is that at 1 h, while the removal efficiency for the 1–4 h period is the average of that at 1 and 4 h. Whole blood volume was set at 1/13 of the patient’s body weight. Plasma volume was calculated as (whole blood volume)×(1–hematocrit/100).
Measuring blood concentrations of t-tau and Aβ
Plasma t-tau levels were analyzed using an ultrasensitive immunoassay specific for total tau that uses digital array technology [30] with the Human Total Tau kit (Simoatrademark Tau 2.0 Kit, Quanterix, Lexington, MA) on the Simoa HD-1 analyzer (Quanterix). This kit uses a monoclonal capture antibody that reacts with a linear epitope in the midregion of all tau isoforms and a detection antibody that reacts with an epitope in the N-terminal region of tau [7].
Plasma Aβ concentrations were measured using the High Sensitive Human β Amyloid (1–40) and (1–42) ELISA Kit Wako II (WAKO Pure Chemical, Osaka, Japan). ApoE4 was measured using the ApoE4/Pan-ApoE ELISA kit (MBL, Nagoya, Japan).
Histopathological study
Cerebral cortices (frontal, parietal, temporal, and occipital lobes) were obtained from the postmortem brains of 17 HD patients (mean age at death, 75.5±10.6 years) and 16 age-matched nonHD subjects (79.0±12.9 years). From these brains, hippocampi were obtained from five HD patients and five nonHD subjects. Paraffin-embedded sections of these brains were generated and immunostained using anti-phospho-tau (pSer202 + pThr205) antibody AT-8 (1 : 200 dilution, Funakoshi/Thermo Scientific, Tokyo, Japan) and anti-Aβ antibodies 4G8 (anti-Aβ17–24, 1 : 100 dilution, Funakoshi/BioLegend, Tokyo, Japan) and DE2 (anti-Aβ1–16, 1 : 100 dilution, Funakoshi/MILLIPORE, Tokyo, Japan). Cells positive for p-tau and senile plaques were visualized using the avidin–biotin complex (VECTOR, Elite ABC Kit, USA), according to the manufacturer’s instructions. For each subject, p-tau as neurofibrillary tangles and Aβ as senile plaques, including cored, diffuse, and neuritic plaques, were counted in at least five microscopic fields, each having a size of 3×106 μm2. The results were evaluated as “–,” none; “1+,” 2.5–9; “2+,” 10–60; and “3+,” more than 61 per 3×106 μm2/field.
Statistical analysis
All data are expressed as mean±standard deviation unless otherwise specified. Differences were determined using the Wilcoxon rank sum test for non-parametric variables and ANOVA for correlation analysis of two factors, unless otherwise specified. The statistical package JMP11 (SAS Institute Inc., Cary, USA) was used for all analyses with p values <0.05 being considered statistically significant.
RESULTS
Increase in plasma t-tau, Aβ1–40, and Aβ1–42 concentrations in patients with renal failure
Plasma t-tau concentrations in nonHD/RF (2.03±0.87 pg/ml) and withHD/RF (2.91±1.23 pg/ml) patients were significantly higher than those in HCTL (0.63±0.30 pg/ml) patients (p = 0.0008 and <0.0001, respectively) (Fig. 2a). WithHD/RF patients showed higher t-tau concentrations than nonHD/RF patients, although insignificant (p = 0.0699). Similar tendencies were observed for plasma concentrations of Aβ1–40 and Aβ1–42 (Fig. 2b, c, respectively): Aβ1–40, 218.8±41.0 pg/ml for HCTL, 992.0±292.3 pg/ml for nonHD/RF (p = 0.0003 versus HCTL), and 808.6±182.0 pg/ml for withHD/RF (p < 0.0001); Aβ1–42, 24.6±5.7 pg/ml for HCTL, 96.6±20.1 pg/ml for nonHD/RF (p = 0.0003 versus HCTL), and 82.7±18.1 pg/ml for withHD/RF (p < 0.0001). Unlike t-tau, Aβ concentrations in withHD/RF patients were lower than those in nonHD/RF patients, although insignificant (p = 0.1135 for Aβ1–40; p = 0.1054 for Aβ1–42). As a whole, plasma t-tau concentrations in these subjects showed a significant positive correlation with Aβ1–40 (p = 0.0012) and Aβ1–42 (p = 0.0019) (Fig. 2d and e, respectively). Furthermore, plasma t-tau concentrations in all three groups significantly increased along with a decline in renal function (increase in serum creatinine) as shown in Fig. 2f (p < 0.0001). This finding suggests that the kidneys may be involved in the metabolism and excretion of plasma tau.

Plasma concentrations of t-tau, Aβ1–40, and Aβ1 – 42 in all groups. Plasma concentrations of tau (a), Aβ1–40 (b), and Aβ1–42 (c) for all three groups. Correlations between plasma tau and Aβ1–40 (d), Aβ1–42 (e), and serum creatinine (f) for all subjects. Plasma t-tau concentrations in nonHD/RF and withHD/RF patients were significantly higher than those in HCTL patients, and significantly increased along with a decline in renal function (increase in serum creatinine). HD, hemodialysis; HCTL, controls with healthy renal function; nonHD/RF, renal failure (RF) patients who had not undergone HD; withHD/RF, RF who had undergone HD.
To clarify the effects of HD, all subjects were subsequently divided into two groups, one without HD (HTCL and nonHD/RF) and the other with HD (withHD/RF) as shown in Fig. 3. Correlations between plasma tau concentration and serum creatinine, Aβ1–40, and Aβ1–42 concentrations were quite apparent in those without HD (HTCL and nonHD/RF) (Fig. 3a–c), whereas such correlations were not present in those with HD (Fig. 3d–f).
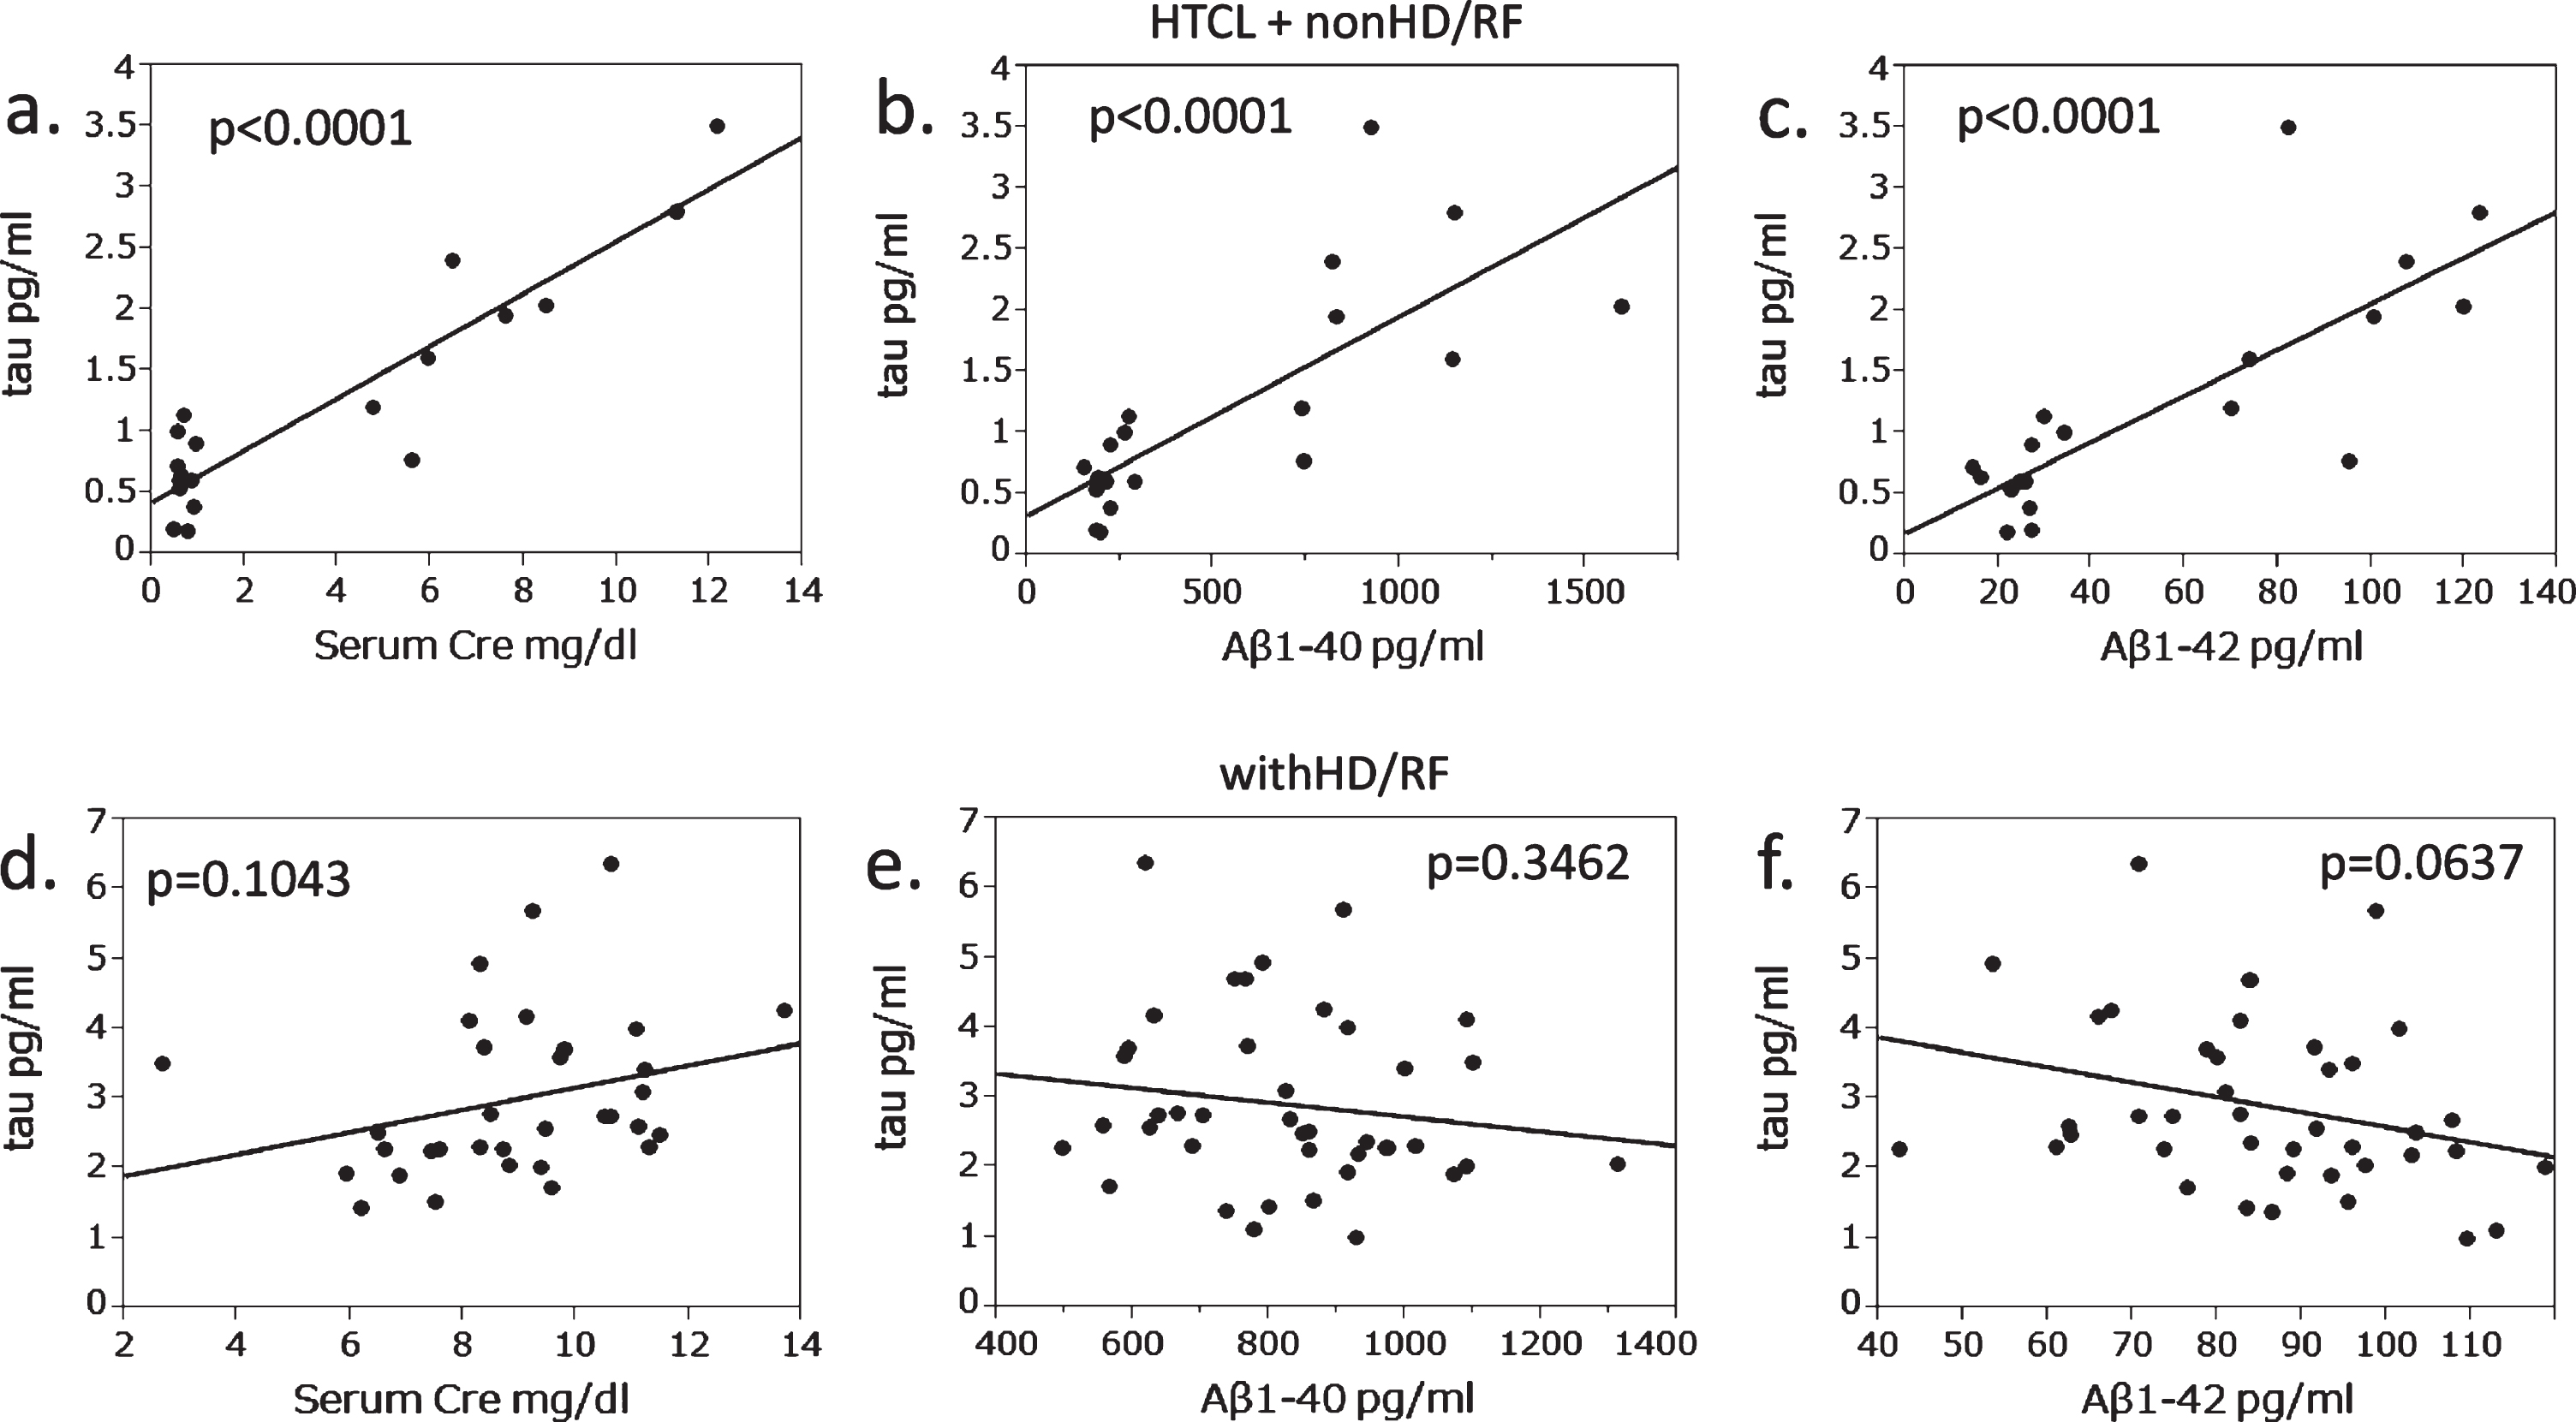
Groups who did and did not undergo hemodialysis showing different correlations between plasma tau and serum creatinine, plasma Aβ1 – 40, and Aβ1 – 42. a–c) withoutHD group (HTCL and nonHD/RF). d–f) withHD-RF group. Correlations between plasma tau and serum creatinine (a, d), plasma Aβ1–40 (b, e), and plasma Aβ1–42 (c, f). Correlations between plasma tau concentration and serum creatinine, Aβ1–40, and Aβ1–42 concentrations were quite apparent in those without HD (HTCL and nonHD/RF). HD, hemodialysis; HCTL, controls with healthy renal function; nonHD/RF, renal failure (RF) patients who had not undergone HD; withHD/RF, RF patients who had undergone HD.
Longer hemodialysis duration did not increase plasma tau concentration but decreased Aβ concentrations
Considering that plasma t-tau concentrations in withHD/RF patients tended to be higher than those in nonHD/RF patients (Fig. 2a), we investigated whether plasma t-tau increased along with HD vintage (duration). Firstly, a cross-sectional analysis of withHD/RF patients was conducted. Plasma t-tau was not correlated with HD vintage (Fig 4a), while plasma Aβ1–40 and Aβ1–42 significantly decreased (Fig. 4b, c, both p < 0.0001) with HD vintage.
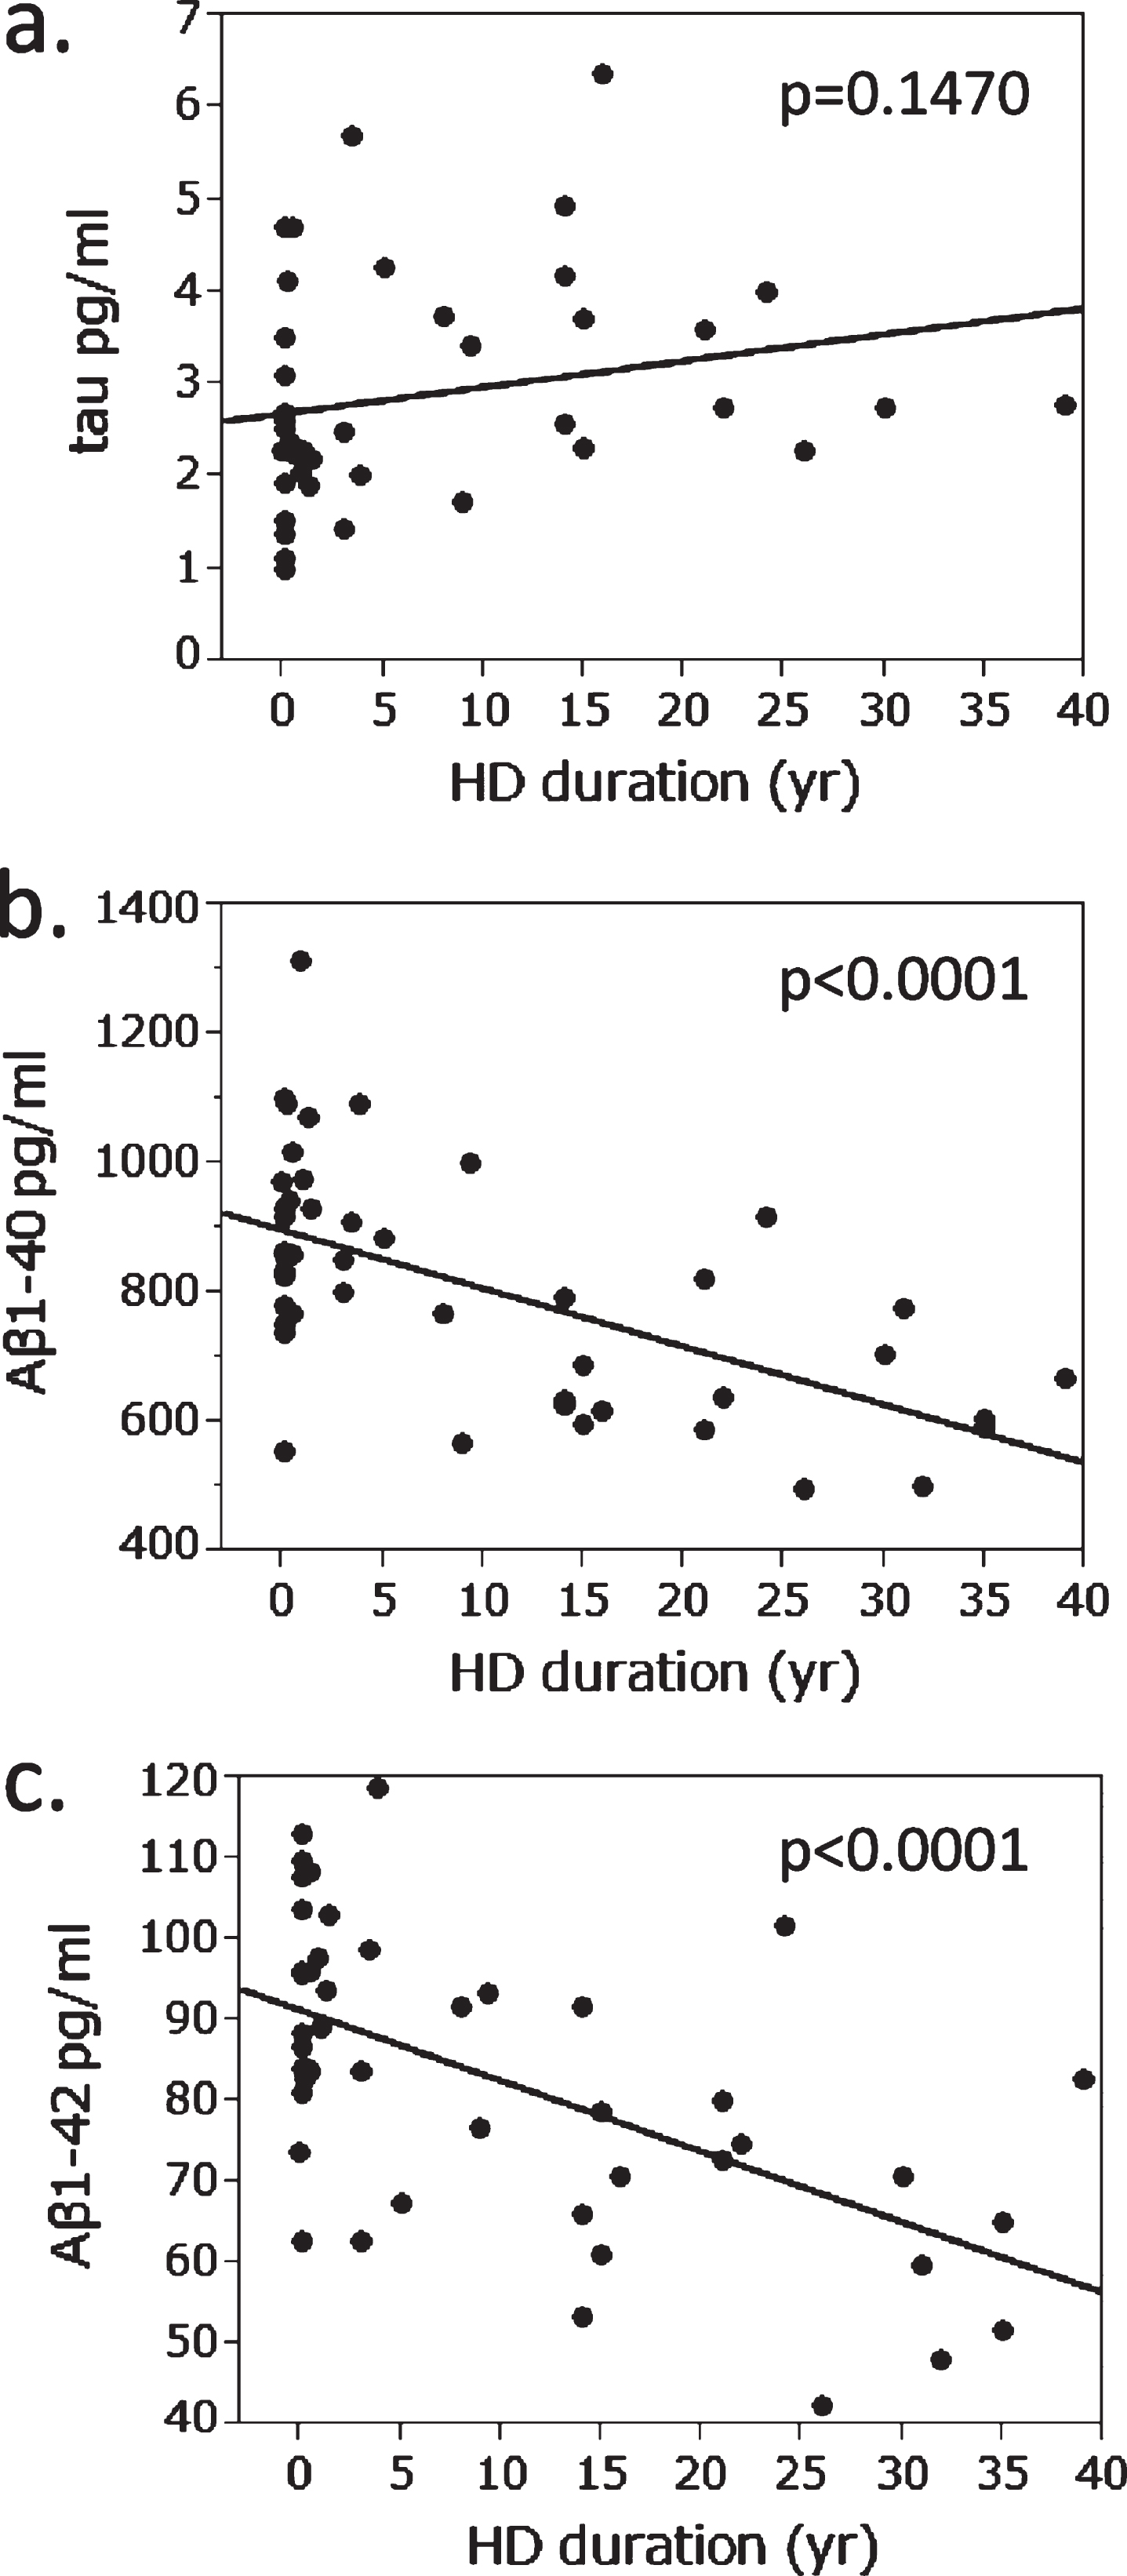
Relationship between hemodialysis duration and plasma concentrations of tau, Aβ1 – 40, and Aβ1 – 42 in patients who had undergone HD. Plasma t-tau was not correlated with hemodialysis (HD) vintage (a). Plasma Aβ1–40 (b) and Aβ1–42 (c) decreased significantly along with HD duration.
A prospective analysis was then conducted for six patients with RF during the periods preceding and following the initiation of HD. As shown in Fig. 5a, plasma t-tau did not decrease after the initiation of HD in five of the six patients but rather increased from 0.1–1.0 years just after initiation (depending on the subjects), after which it seemed to be unchanged. Unlike plasma t-tau, plasma Aβ1–40 and Aβ1–42 decreased after HD initiation in most of the cases, after which they continued to be unchanged or a little increased (Fig. 5b, c).
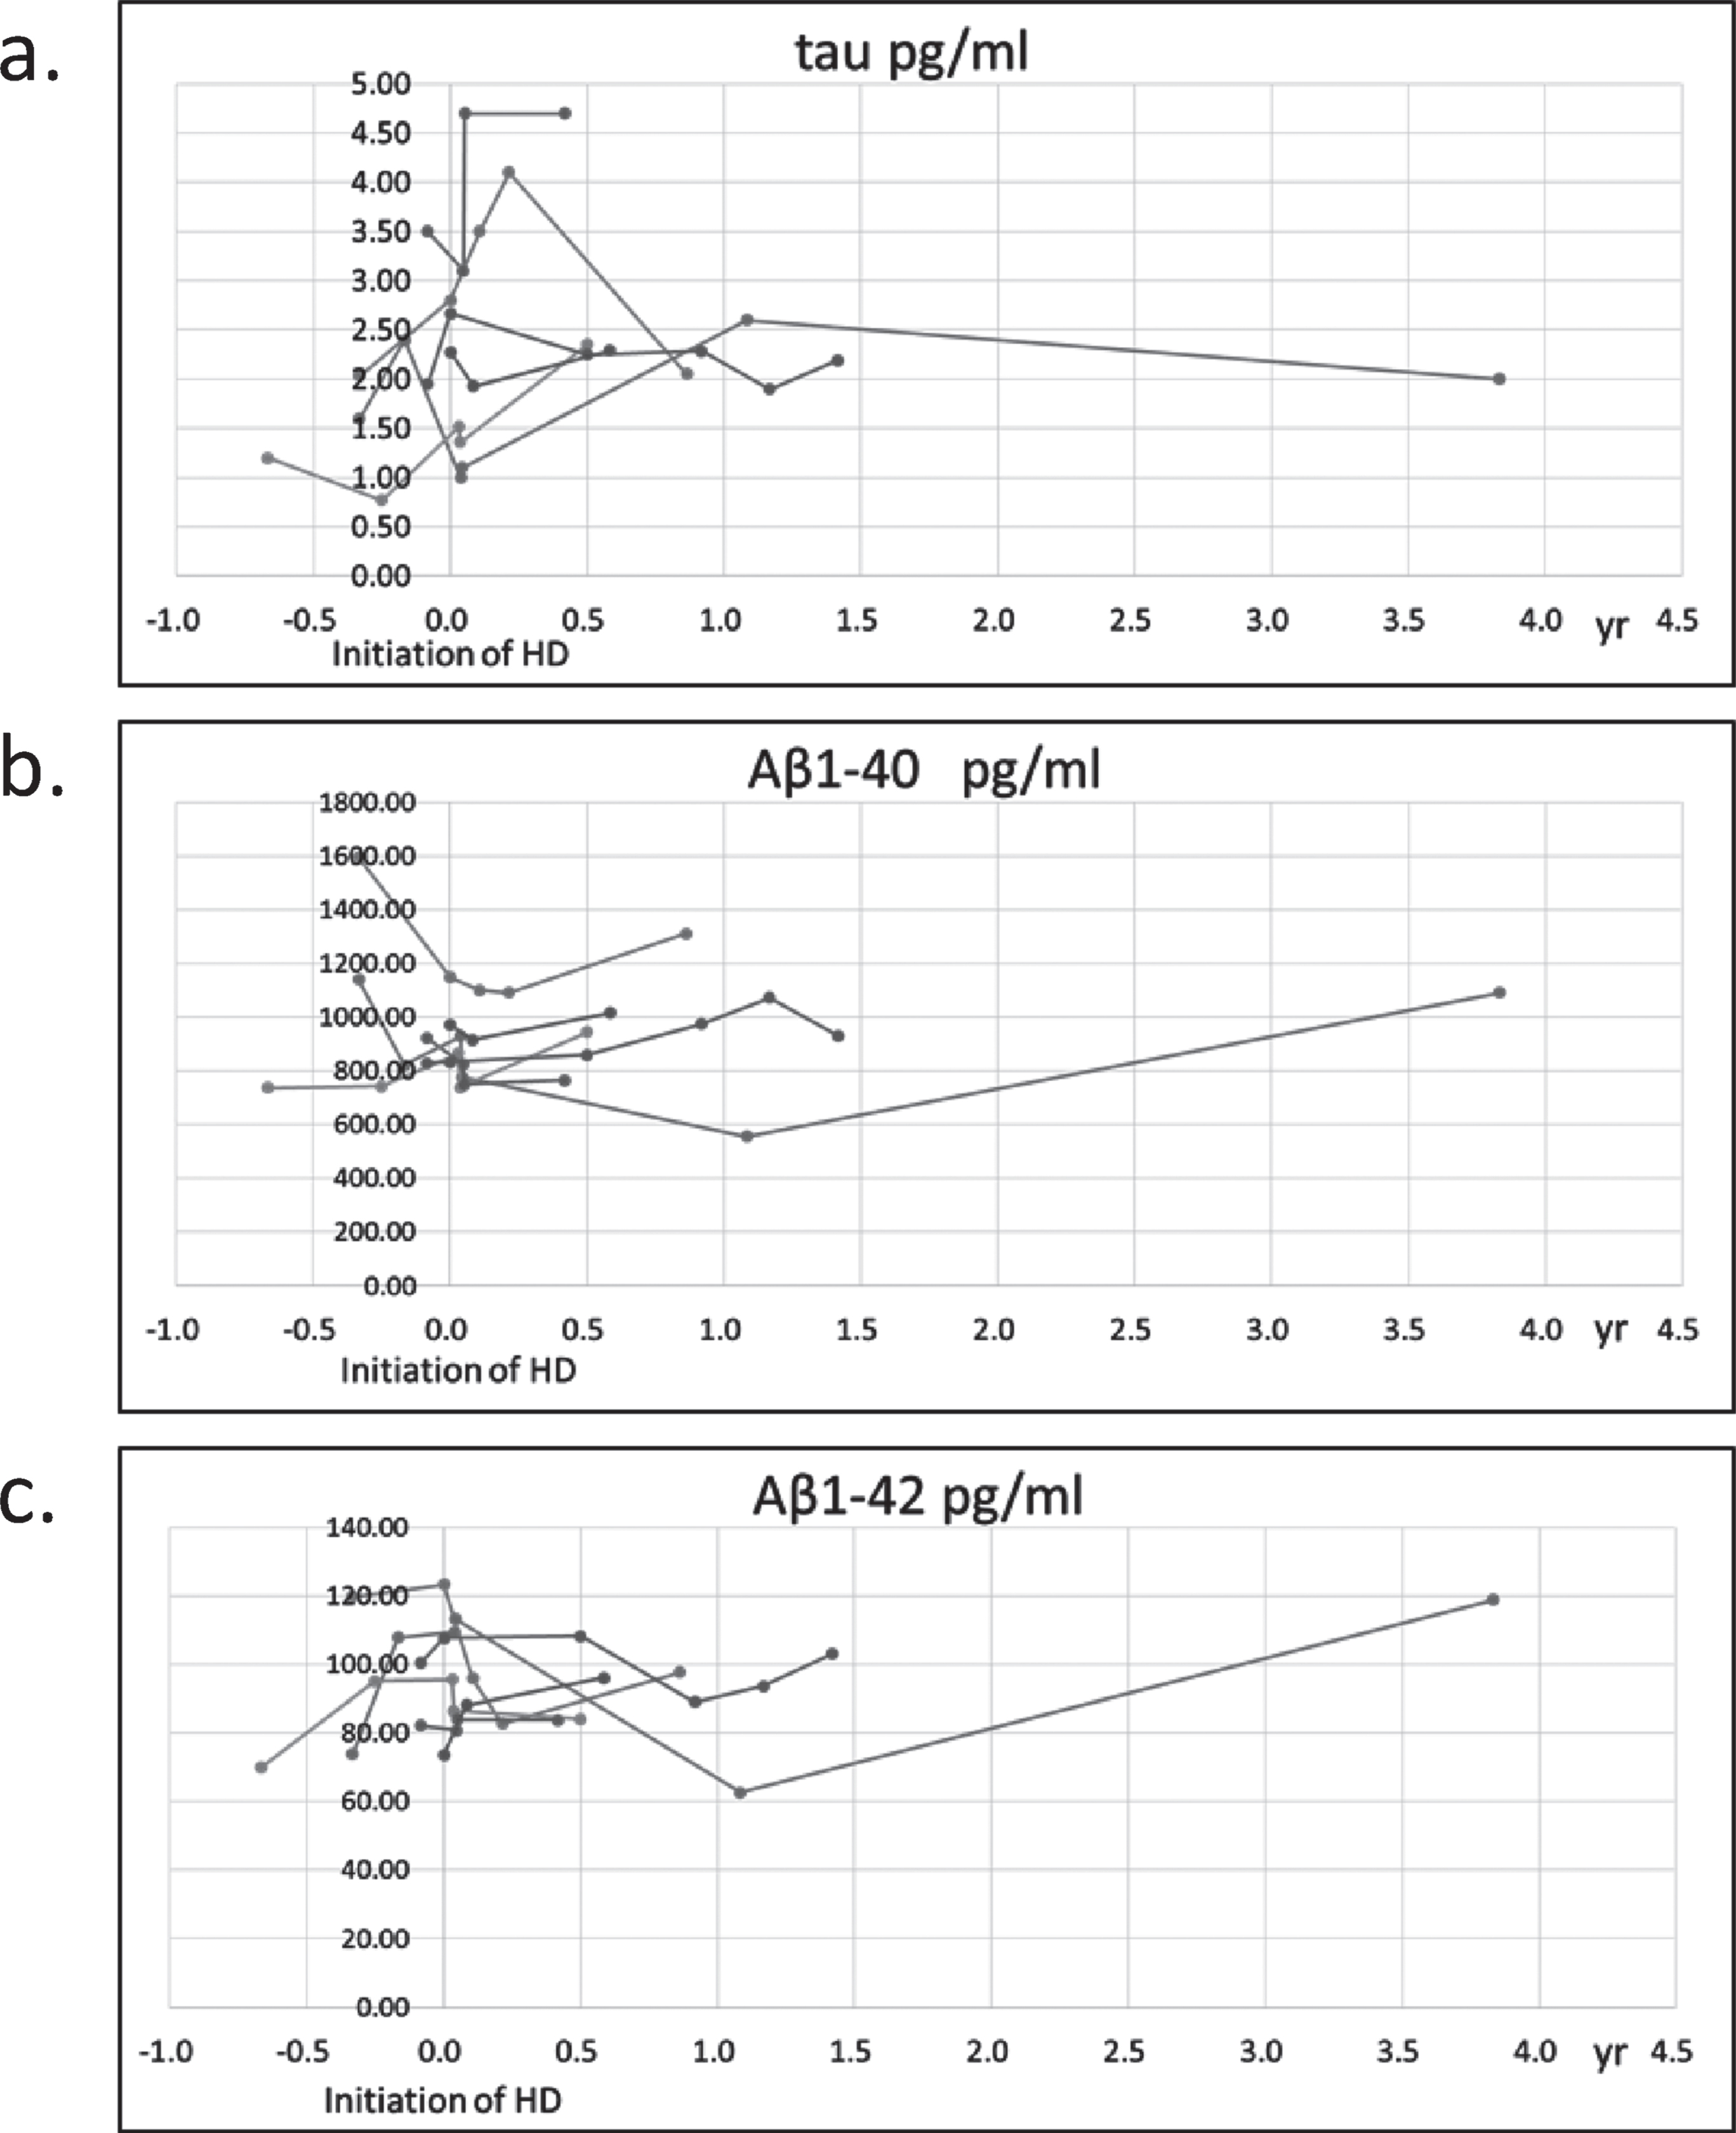
Prospective study on plasma concentrations of tau, Aβ1 – 40, and Aβ1 – 42 in patients with renal failure. Plasma concentrations of tau (a), Aβ1–40 (b), and Aβ1–42 (c). The day hemodialysis was initiated was set as 0 day. Each line shows data from different patients. Plasma t-tau did not decrease after the initiation of HD in five of the six patients but rather increased from 0.1–1.0 years just after initiation. Plasma Aβ1–40 and Aβ1–42 decreased after HD initiation in most of the cases, after which they continued to be unchanged or a little increased.
Hemodialyzers removed Aβ but not tau
Blood samples from six patients were obtained at the inlet (pre) and outlet (post) of the hemodialyzers at 1 and 4 h points of the HD sessions. These patients received only HD and no co-treatment with HexDC. Post hemodialyzer plasma t-tau concentrations were similar to pre hemodialyzer concentrations 1 and 4 h (end) of the dialysis sessions (Fig. 6a, b), which indicated that the removal efficiency for plasma tau, as defined as Eq (1), was almost 0% during 4 h sessions. Unlike t-tau, plasma Aβ were effectively removed by the hemodialyzers. The removal efficiencies of hemodialyzers for Aβ1–40 were 52% and 47% at 1 and 4 h (Fig. 6c, d), while those for Aβ1–42 were 56% and 50% at 1 and 4 h (Fig. 6e, f), respectively.
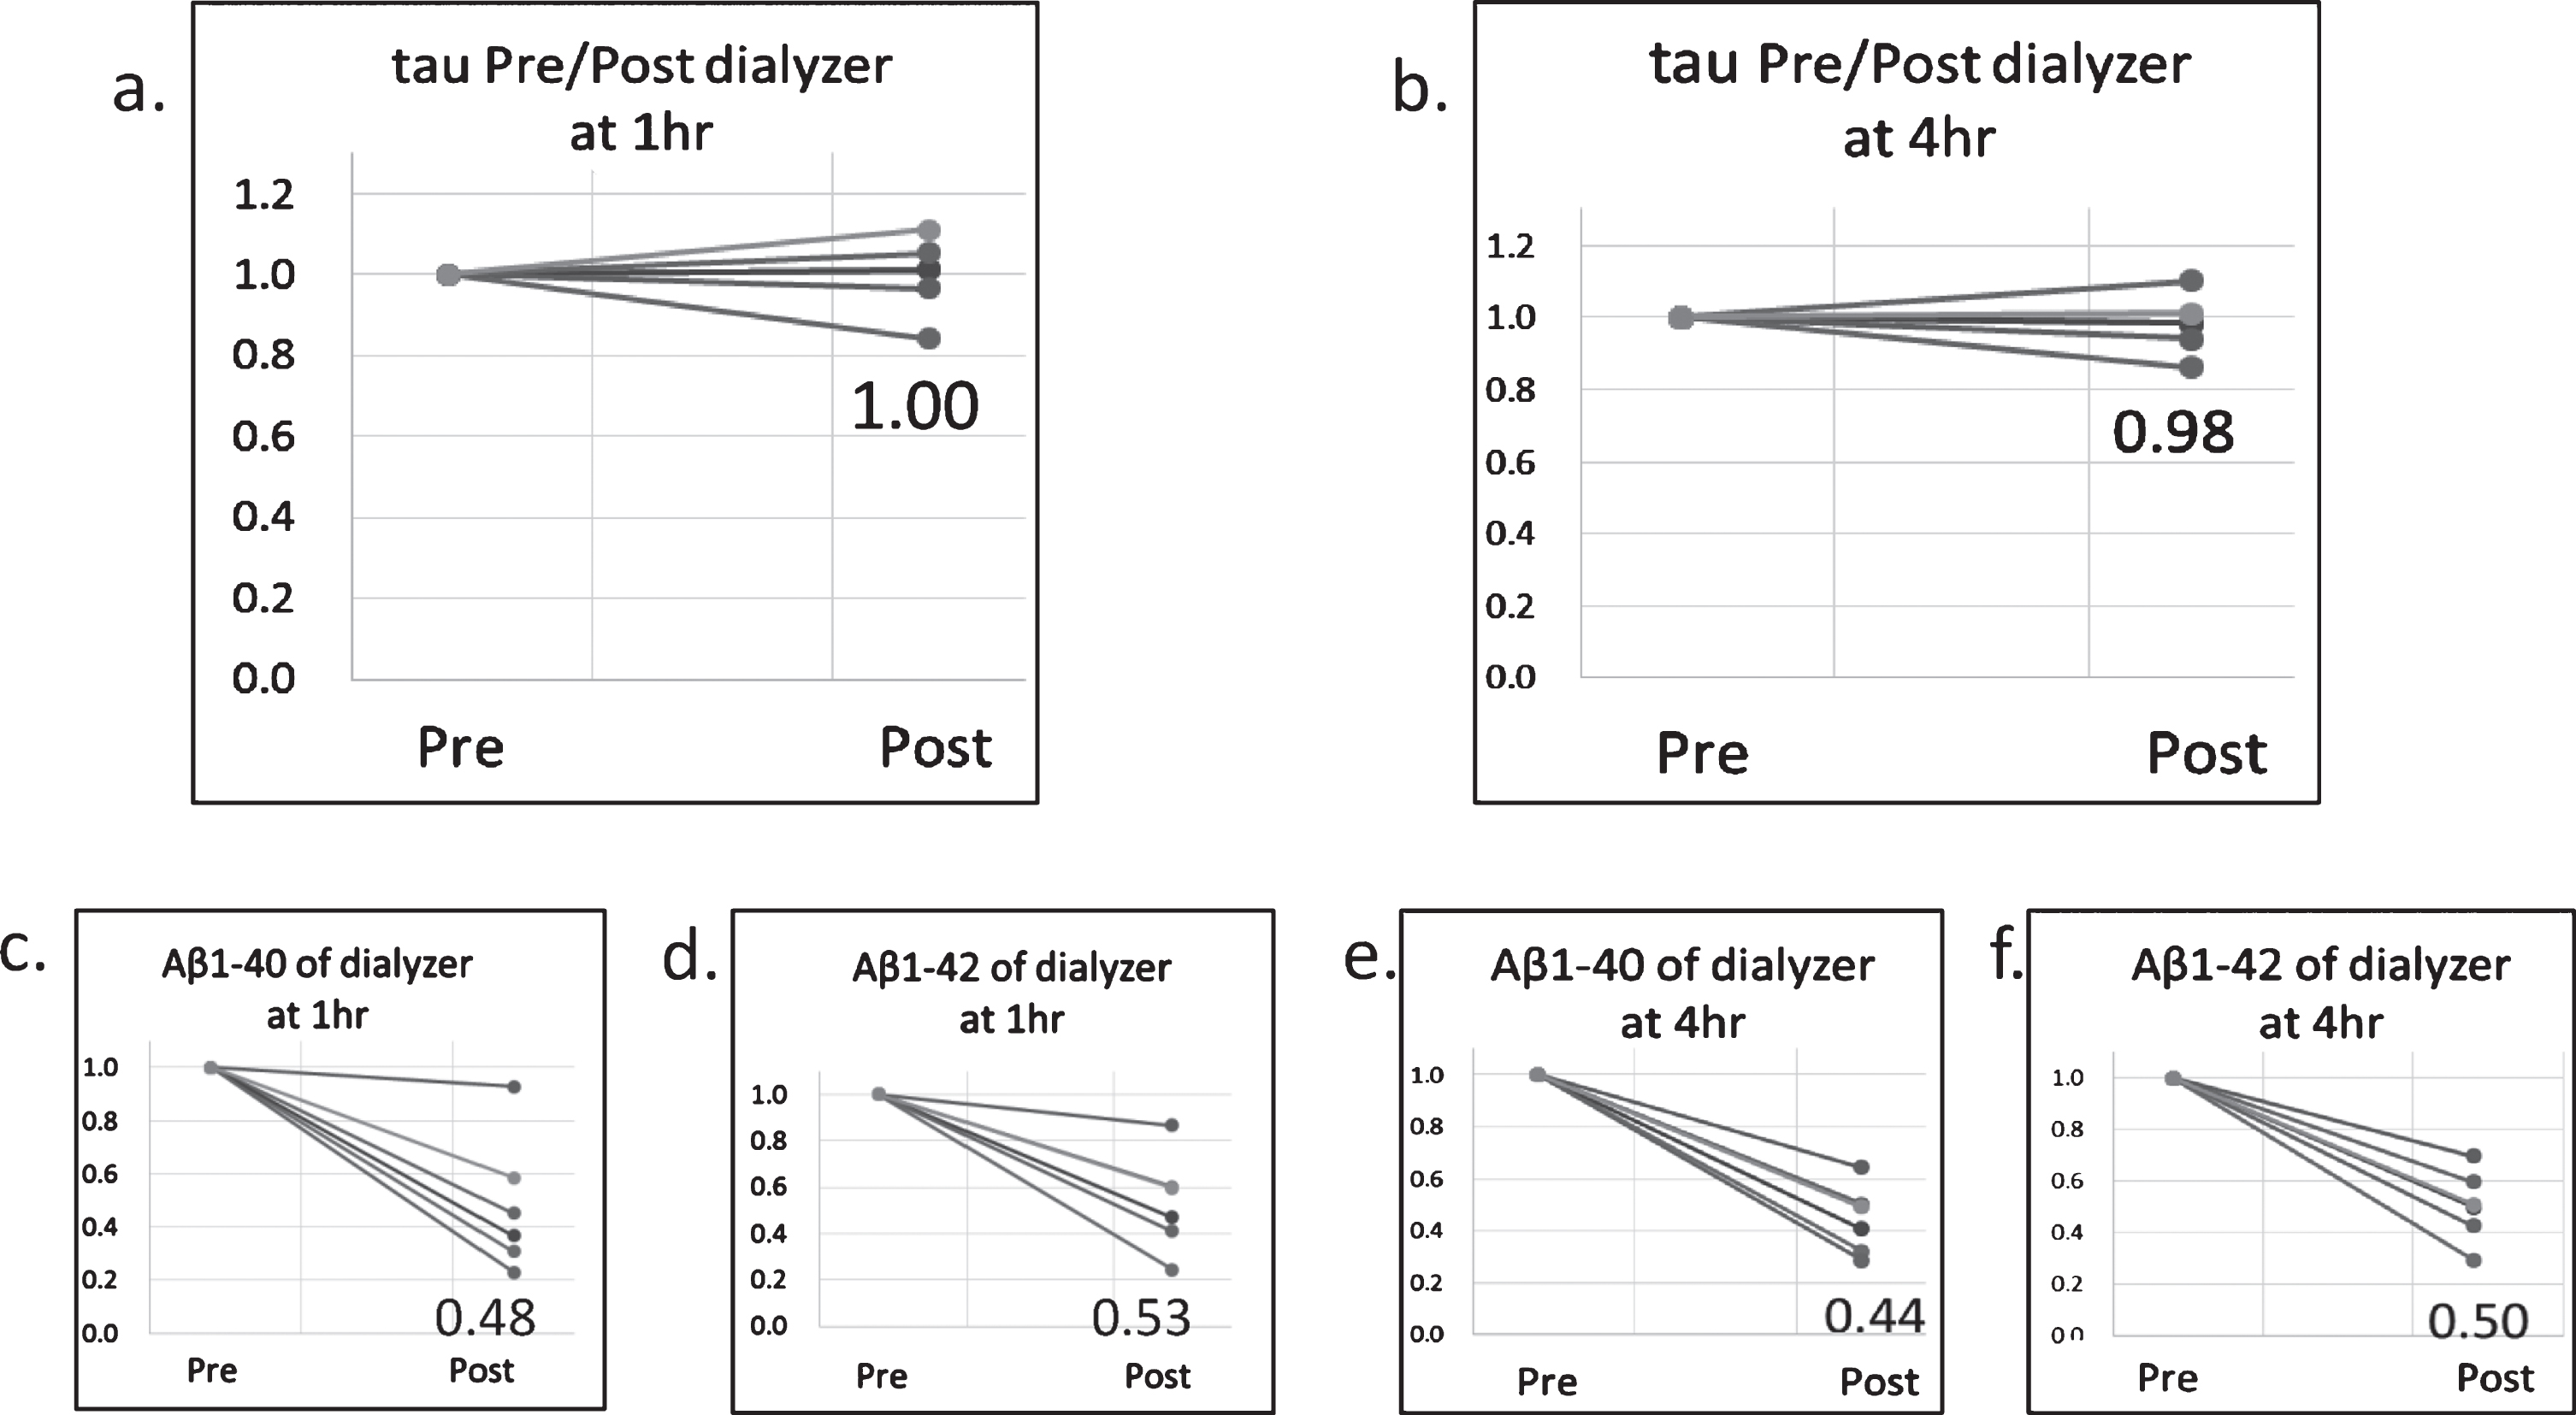
Concentration changes in t-tau, Aβ1–40, and Aβ1–42 at the inlet (pre) and outlet (post) of the hemodialyzers. The concentrations at Pre were set at 1.0. (a) Relative concentrations of tau 1 h of a hemodialysis session; (b) tau at 4 h; (c) Aβ1–40 at 1 h; (d) Aβ1–42 at 1 h; (e) Aβ1–40 at 4 h; (f) Aβ1–42 at 4 h. The three digits in each graph are the average relative concentrations at Post. The removal efficiency for plasma tau was almost 0% during 4 h sessions. Plasma Aβ were effectively removed by the hemodialyzers.
HexDC removal of Aβ but not t-tau
Given that HexDC is a very effective adsorbent for Aβ, its removal efficiency for tau was investigated. Plasma t-tau concentrations were measured pre and post HexDC columns for five patients who received β2-microglobuline removal treatment during HD. Pre and post t-tau concentrations were similar during the 4 h HD sessions (Fig. 7a, b), indicating that, similar to hemodialyzers, HexDC also did not remove plasma tau. The removal efficiencies of HexDC for Aβ1–40 were 55% and 48% at 1 and 4 h (Fig. 7c, d), while those for Aβ1–42 were 49% and 43% at 1 and 4 h (Fig. 7e, f), respectively.
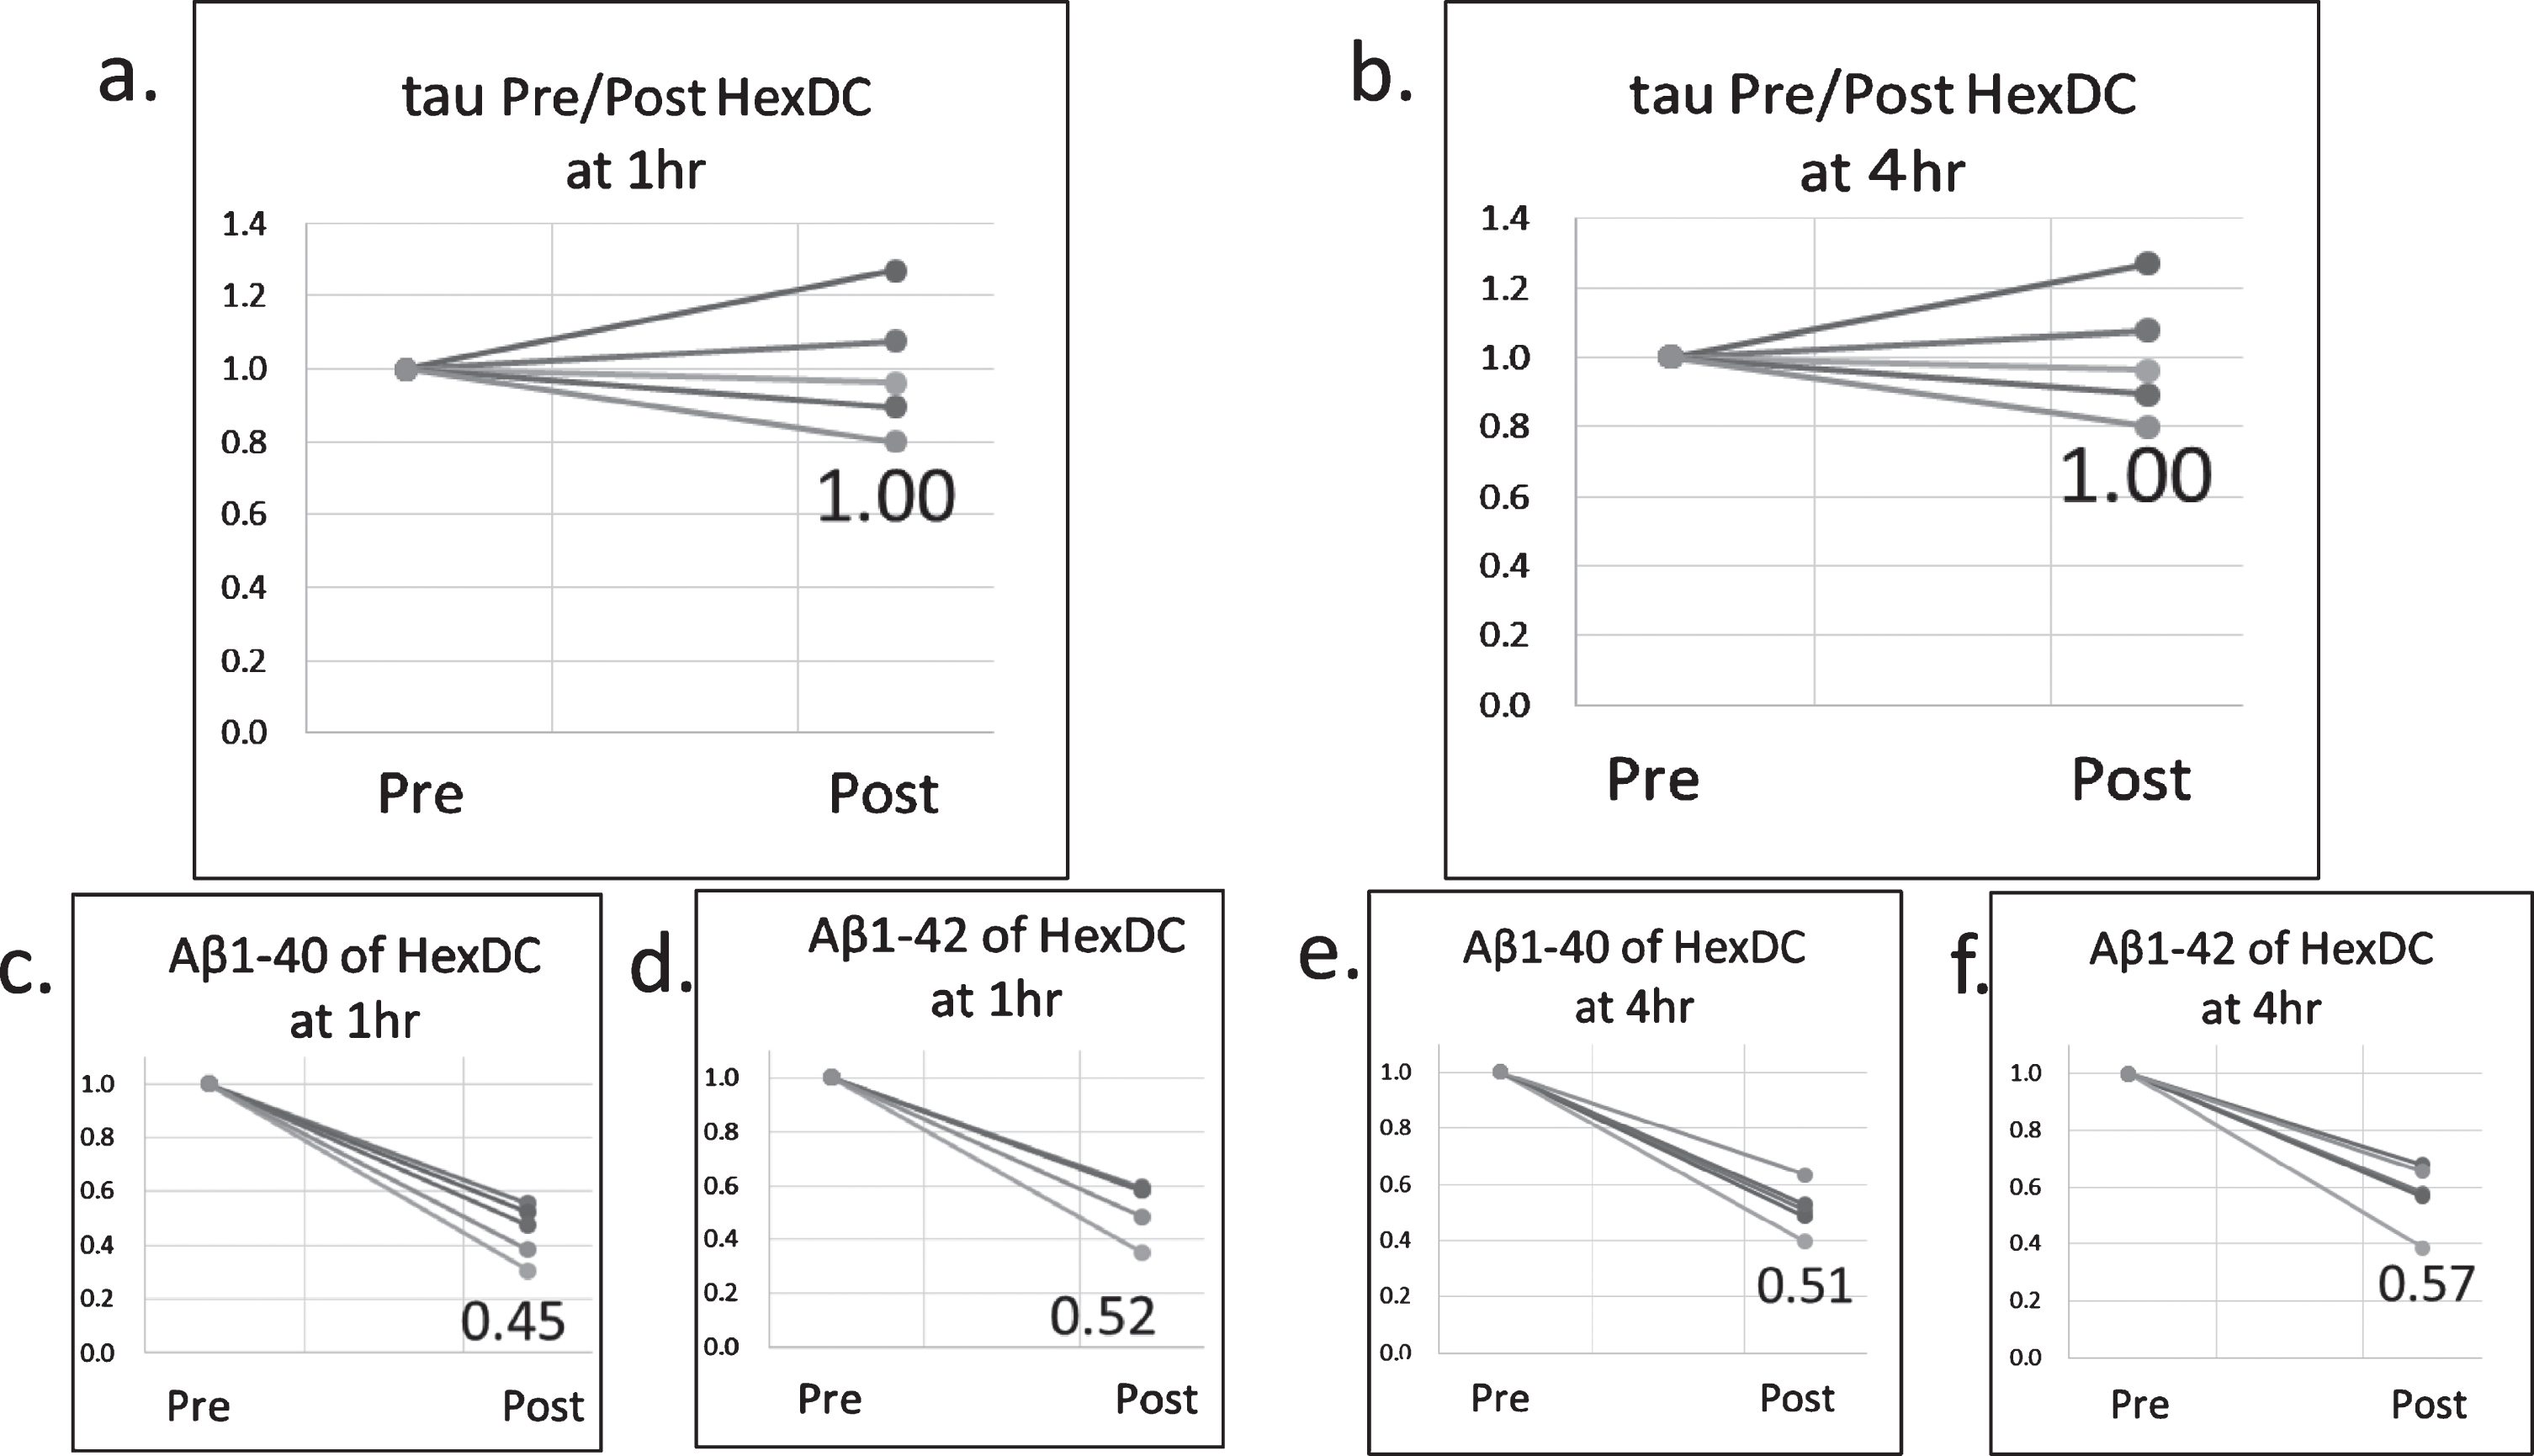
Concentration changes in t-tau, Aβ1–40, and Aβ1–42 at the inlet (pre) and outlet (post) of the HexDC columns. Concentrations at Pre were set at 1.0. (a) Relative concentrations of tau 1 h of a hemodialysis session; (b) tau at 4 h; (c) Aβ1–40 at 1 h; (d) Aβ1–42 at 1 h; (e) Aβ1–40 at 4 h; (f) Aβ1–42 at 4 h. The three digits in each graph are the average relative concentrations at Post. HexDC also did not remove plasma tau, but Aβ effectively.
Increase in plasma tau triggered by hemodialysis
The time course of plasma t-tau and Aβ during a HD session was analyzed in 21 patients (Fig. 8). Although hemodialyzers did not remove tau, plasma t-tau concentrations interestingly increased during HD sessions, especially at 1 h of the sessions (Fig. 8a). To minimize individual variations, relative concentrations were calculated so as to be 1.0 for the concentrations at the start of HD. Relative concentrations of plasma t-tau significantly increased at 1 h (p = 0.0001) and then decreased at 4 h (p = 0.0071) of the sessions (Fig. 8b). Unlike t-tau, relative plasma concentrations of both Aβ1–40 and Aβ1–42 significantly decreased at 1 h and further at 4 h of the sessions (Fig. 8c, d). Differences in these three factors during a HD session are shown Fig. 8e as the average relative concentrations at each time point.

Changes in plasma Aβ/tau concentrations in the whole-body circulation during a hemodialysis session. a) absolute tau concentration (pg/ml); (b) relative tau concentration compared at 0 h; (c) relative Aβ1–40 concentration; (d) relative Aβ1–42 concentration. e) Average relative concentrations of tau, Aβ1–40, and Aβ1–42. Relative concentrations of plasma t-tau significantly increased at 1 h and then decreased at 4 h of the sessions. Relative plasma concentrations of both Aβ1–40 and Aβ1–42 significantly decreased at 1 h and further at 4 h of the sessions. Error bars show standard deviations. ** p < 0.01; *** p < 0.001; n.s., not significant.
Based on these data, the influx of each protein into the blood was calculated according to Eq (2), where the amounts removed by the hemodialyzers are taken into account. Figure 9a shows the schematic estimation of the influx, which consists of two components (a) and (b): (a) the removed tau/Aβ by the hemodialyzers and (b) the increased or decreased tau/Aβ in the plasma during a HD session. For tau, the influx is “(a) + (b: increased amount in the plasma),” where (a) is almost zero. For Aβ, the influx is “(a)–(b: decreased amount in the plasma), where (a) is very large.
The influx of t-tau during dialysis sessions was calculated as 3.52±2.48 ng and –1.31±2.81 ng for the 0–1 h and 1–4 h periods, respectively (Fig. 9b). For the same sessions, the influx of Aβ1–40 was 2174±856 ng and 5144±1652 ng for the 0–1 h and 1–4 h periods, respectively. The influx of Aβ1–42 were 217±84 ng and 456±252 ng for the 0–1 h and 1–4 h periods, respectively. Thus, the tau influx was around 1/1000 of the Aβ1–40 influx and 1/100 of the Aβ1–42 influx.
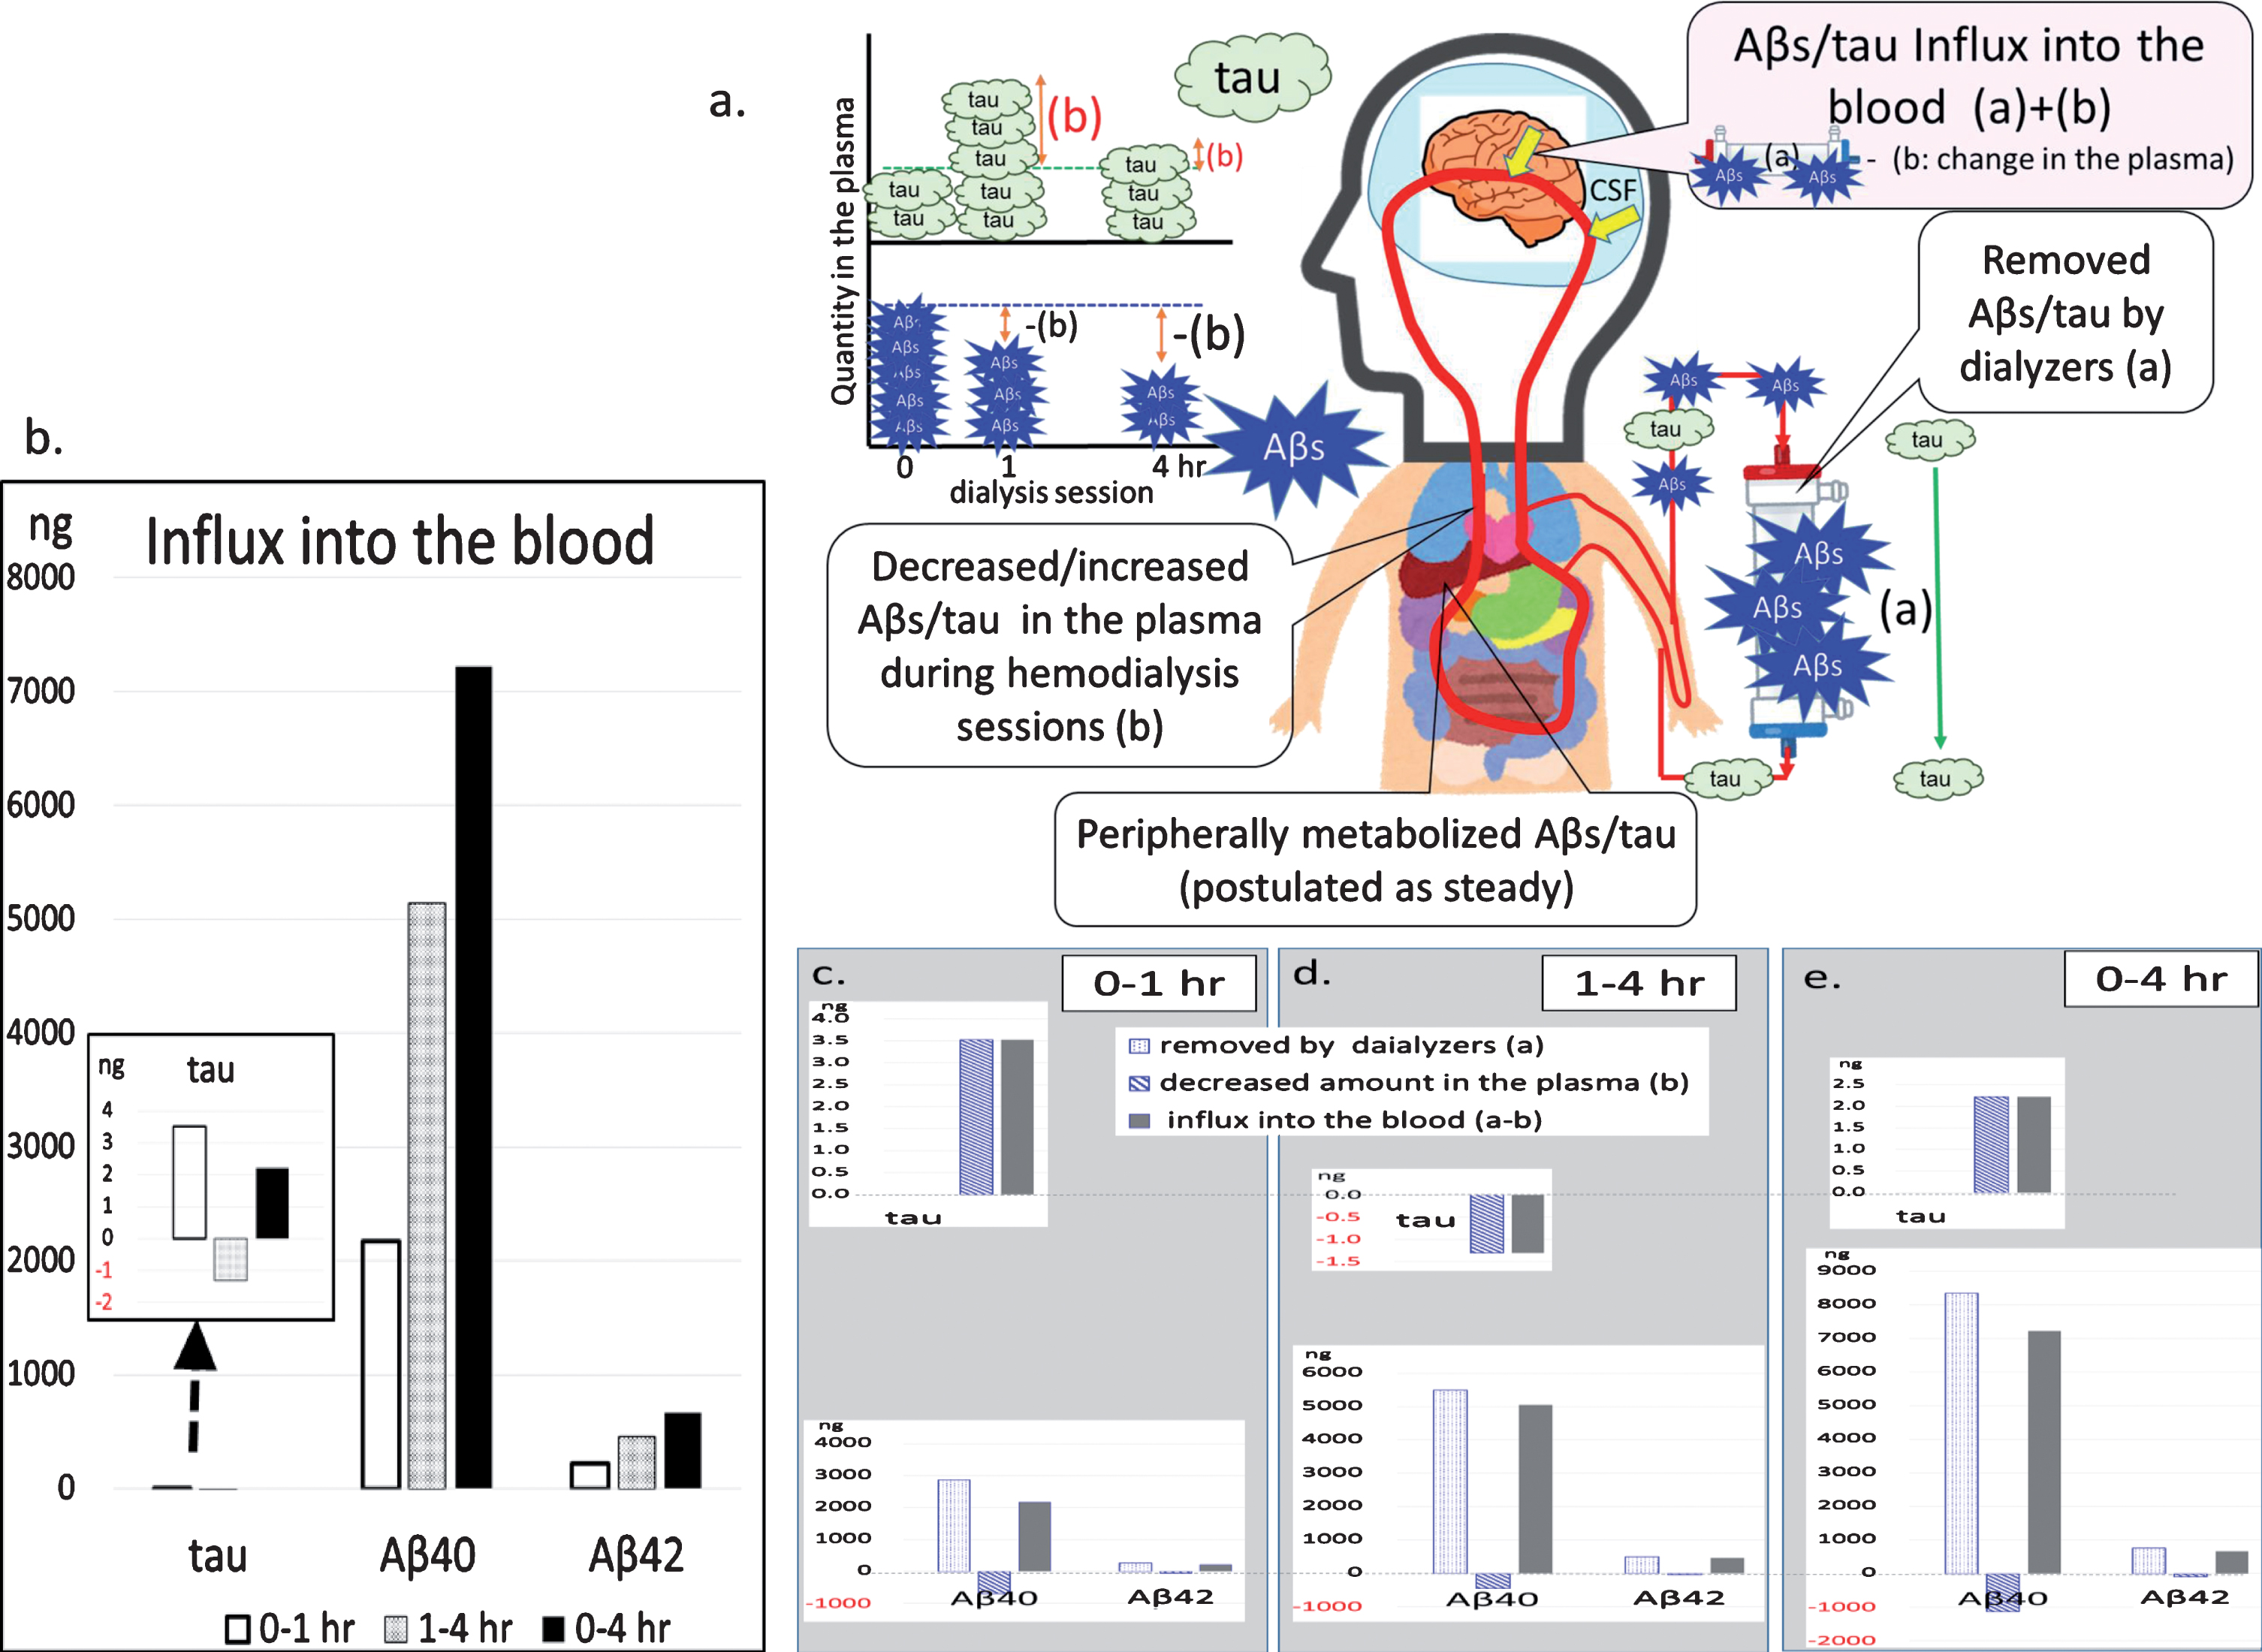
T-tau and Aβ influx into the blood during a hemodialysis session. a) Schema of the estimated Aβ/tau influx: amount of influx = [Aβ/tau removed by the dialyzers (a)] + (increased [when decreased, –] plasma Aβ/tau during the hemodialysis session (b)). Tau passed through the dialyzers (hardly removed). b) Influx of tau, Aβ1–40, and Aβ1–42 during the 0–1 h (left), 1–4 h (middle), and 0–4 h (right) periods. Though the influx of tau was not zero, it was much small compared to that of Aβ. The inset shows an enlarged view of the tau influx. c–e) Components of each influx: c) 0–1 h; d) 1–4 h; e) 0–4 h. In panels c–e, amounts removed by the dialyzers (a) (left), increased amounts in the blood calculated based on concentration change (b) (middle), and summation of these two components (a)-(b) (right) are provided: top, tau; bottom, Aβ1–40 and Aβ1–42.
Figure 9c–e shows the influxes divided into two components, (a) and (b), in the 0–1 h, 1–4 h, and 0–4 h periods: (a) the removed tau/Aβ by the hemodialyzers and (b) the increased or decreased tau/Aβ in the plasma during the HD session. Given that Aβ were effectively removed by the hemodialyzers, Aβ that flowed into the blood were continuously removed by the hemodialyzers, resulting in lowered plasma Aβ concentrations. Aβ influx during the 1–4 h period was similar to that during the 0–1 h period. Unlike Aβ, tau was hardly removed by the hemodialyzers. Therefore, tau that flowed into the blood accumulated in the blood for some time during the 0–1 h period until intrinsic metabolism by peripheral organs reduced such accumulated tau in the plasma (1–4 h).
Cognitive function and plasma t-tau concentrations
Regarding cognitive function, MMSE scores showed no clear relationship with plasma t-tau concentrations in all subjects (Fig. 10a). However, the opposite correlations were observed in the analysis of each group. MMSE scores significantly decreased along with an increase in plasma t-tau concentrations in HCTL subjects (p = 0.0216, Fig. 10b), whereas MMSE scores tended to increase along with plasma t-tau concentrations in nonHD/RF and withHD/RF patients (nonHD/RF, p = 0.0459 and withHD/RF, p = 0.0470 in Fig. 10c, d).

Relationship between MMSE scores and plasma t-tau concentrations. a) All subjects; (b) HCTL; (c) nonHD/RF; (d) withHD/RF. MMSE scores significantly decreased along with an increase in plasma t-tau concentrations in HCTL subjects, whereas MMSE scores tended to increase along with plasma t-tau concentrations in nonHD/RF and withHD/RF patients. HD, hemodialysis; HCTL, controls with healthy renal function; nonHD/RF, renal failure (RF) patients who had not undergone HD; withHD/RF, RF patients who had undergone HD.
Histopathological study of phosphorylated tau accumulation in the brain
If the tau influx into the blood during HD was from the brain as shown in Fig. 9, then the accumulation of tau in the brain of HD patients might have been decreased. Therefore, brain p-tau accumulation was investigated in the cortex and hippocampus of HD patients (HD in Fig. 11) and subjects who had not undergone HD (nonHD in Fig. 11). P-tau accumulation was analyzed using anti-phospho-tau antibody AT-8. Representative images of p-tau are shown in Fig. 11a and b for the cortex and Fig. 11c and d for the hippocampus. P-tau accumulations in the cortices were sparse in both nonHD and HD subjects, although some AT-8 positive structures were observed (yellow arrows in Fig. 11a). Compared to that in the cortex, p-tau accumulation in the hippocampus was more apparent (Fig. 11c, d). Both anti-Aβ antibodies 4G8 and DE2 gave similar results wherein Aβ deposition as senile plaques in the cortices of HD subjects was lesser than that in nonHD subjects (data not shown) as reported previously [22].
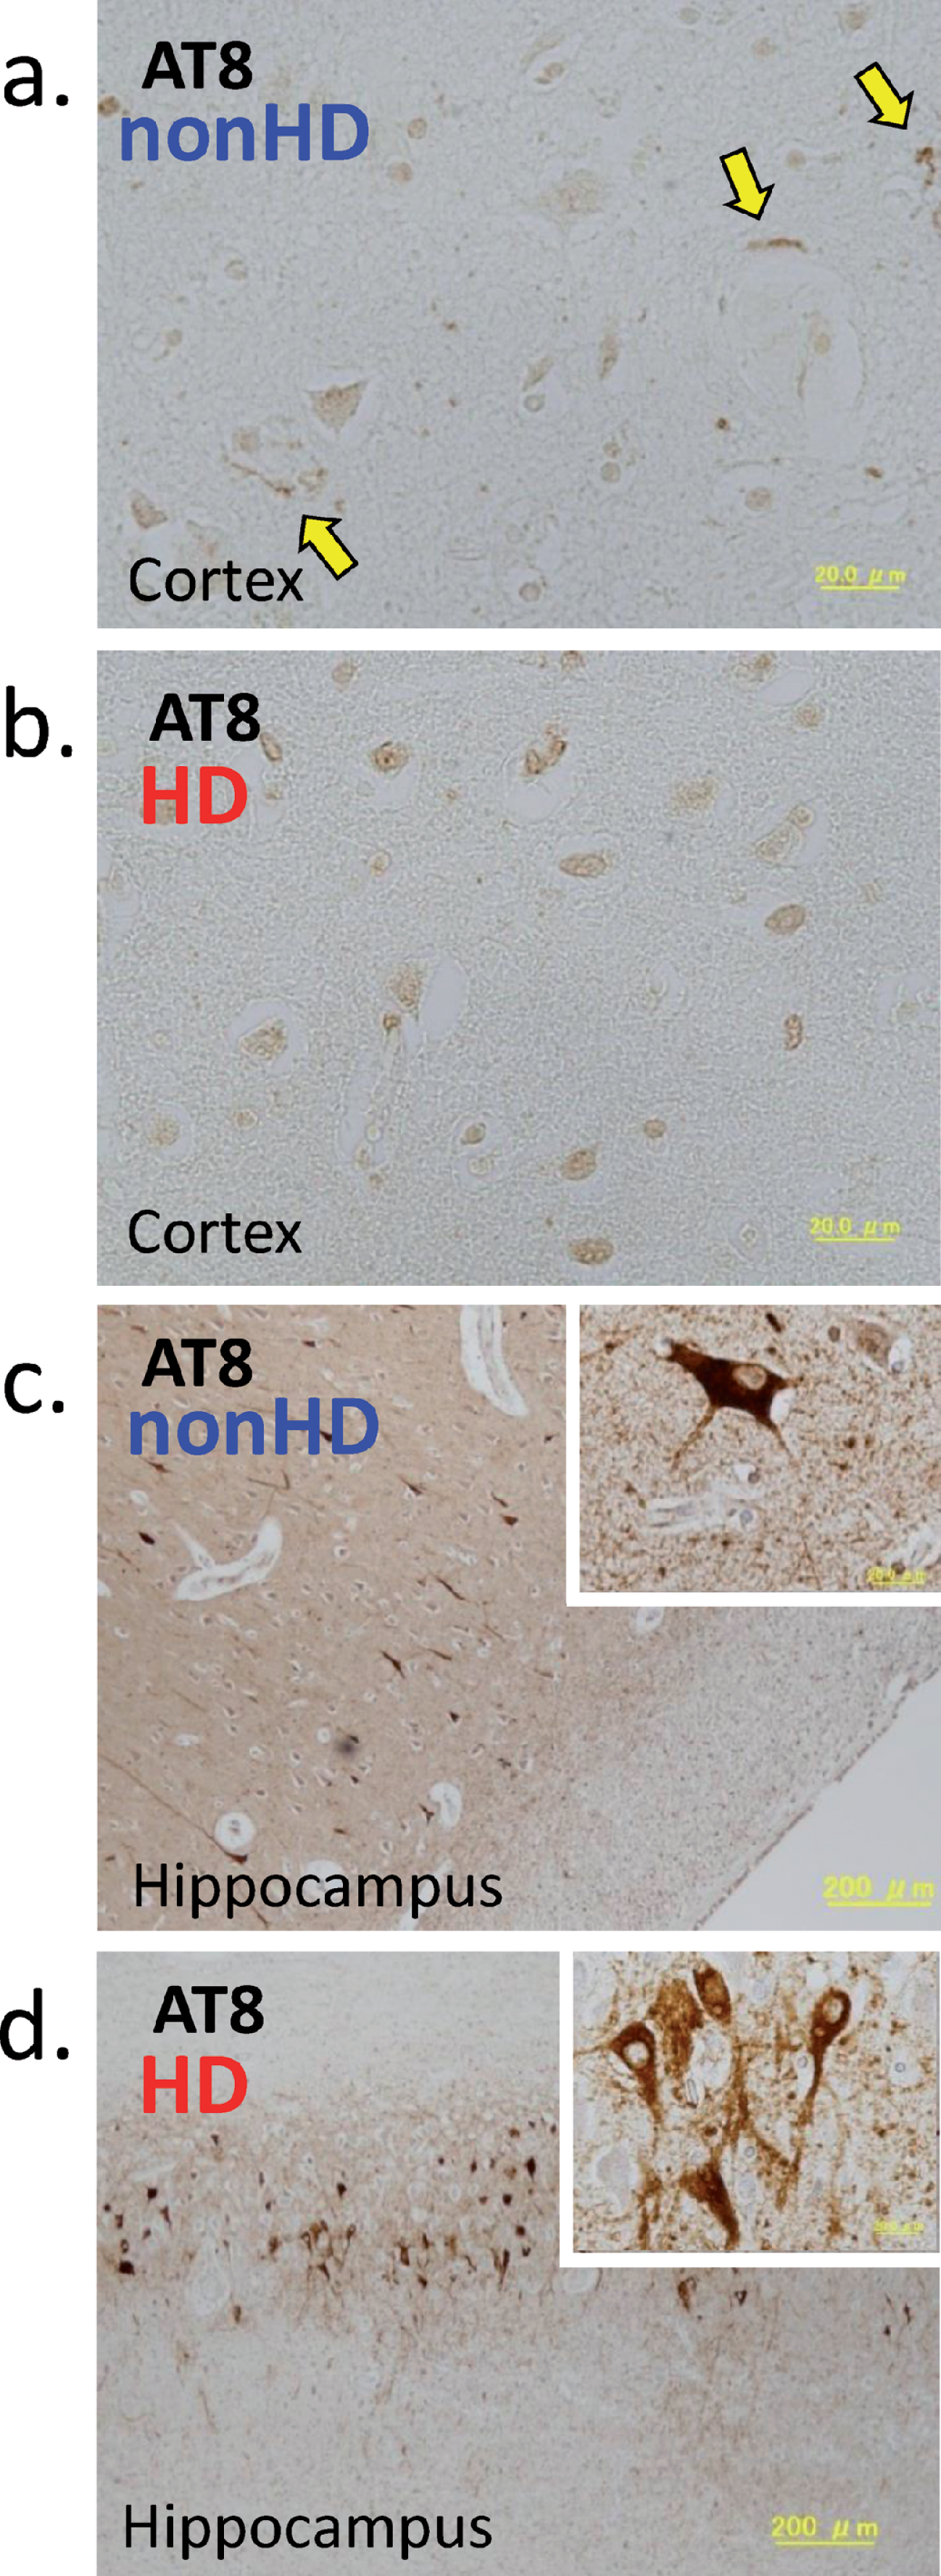
P-tau accumulation in the brain detected using the antibody AT-8. (a) and (b), Cortex; (c) and (d), hippocampus. (a) and (c), A 90-year-old subject who had not undergone hemodialysis (nonHD). (b) and (d), A 69-year-old patient who had undergone HD for 29 years (HD). Insets in (c) and (d) show a magnified image of the neurofibrillary tangles. P-tau accumulations in the cortices were sparse in both nonHD and HD subjects, although some p-tau depositions AT-8 positive structures were observed in the non-HD cortex (yellow arrows in (a)). P-tau accumulation in the hippocampus was more apparent (c, d).
To clarify the difference between HD and nonHD subjects, as well as between the cortex and hippocampus, semi-quantitative analysis was conducted for at least five microscopic fields of each brain region from each subject. The degree of p-tau and Aβ accumulation was evaluated as “–” (none) to “3+” (many) as defined in the Materials and Methods section. Although both HD and nonHD subjects showed sparse p-tau accumulation in the cortex, semi-quantitative analysis revealed that HD and nonHD subjects had similar (not significantly less) p-tau accumulation (p = 0.0929, Fig. 12a). Unlike that in the cortex, p-tau accumulation in the hippocampus was more apparent, with HD subjects having slightly more accumulation than nonHD subjects, although not significant (p = 0.1564, Fig. 12b). Cortices of nonHD subjects showed more Aβ deposition as senile plaques than those of HD subjects (p = 0.0282, Fig. 12c), while very sparse Aβ depositions in the hippocampus were observed for both nonHD and HD subjects (Fig. 12d).
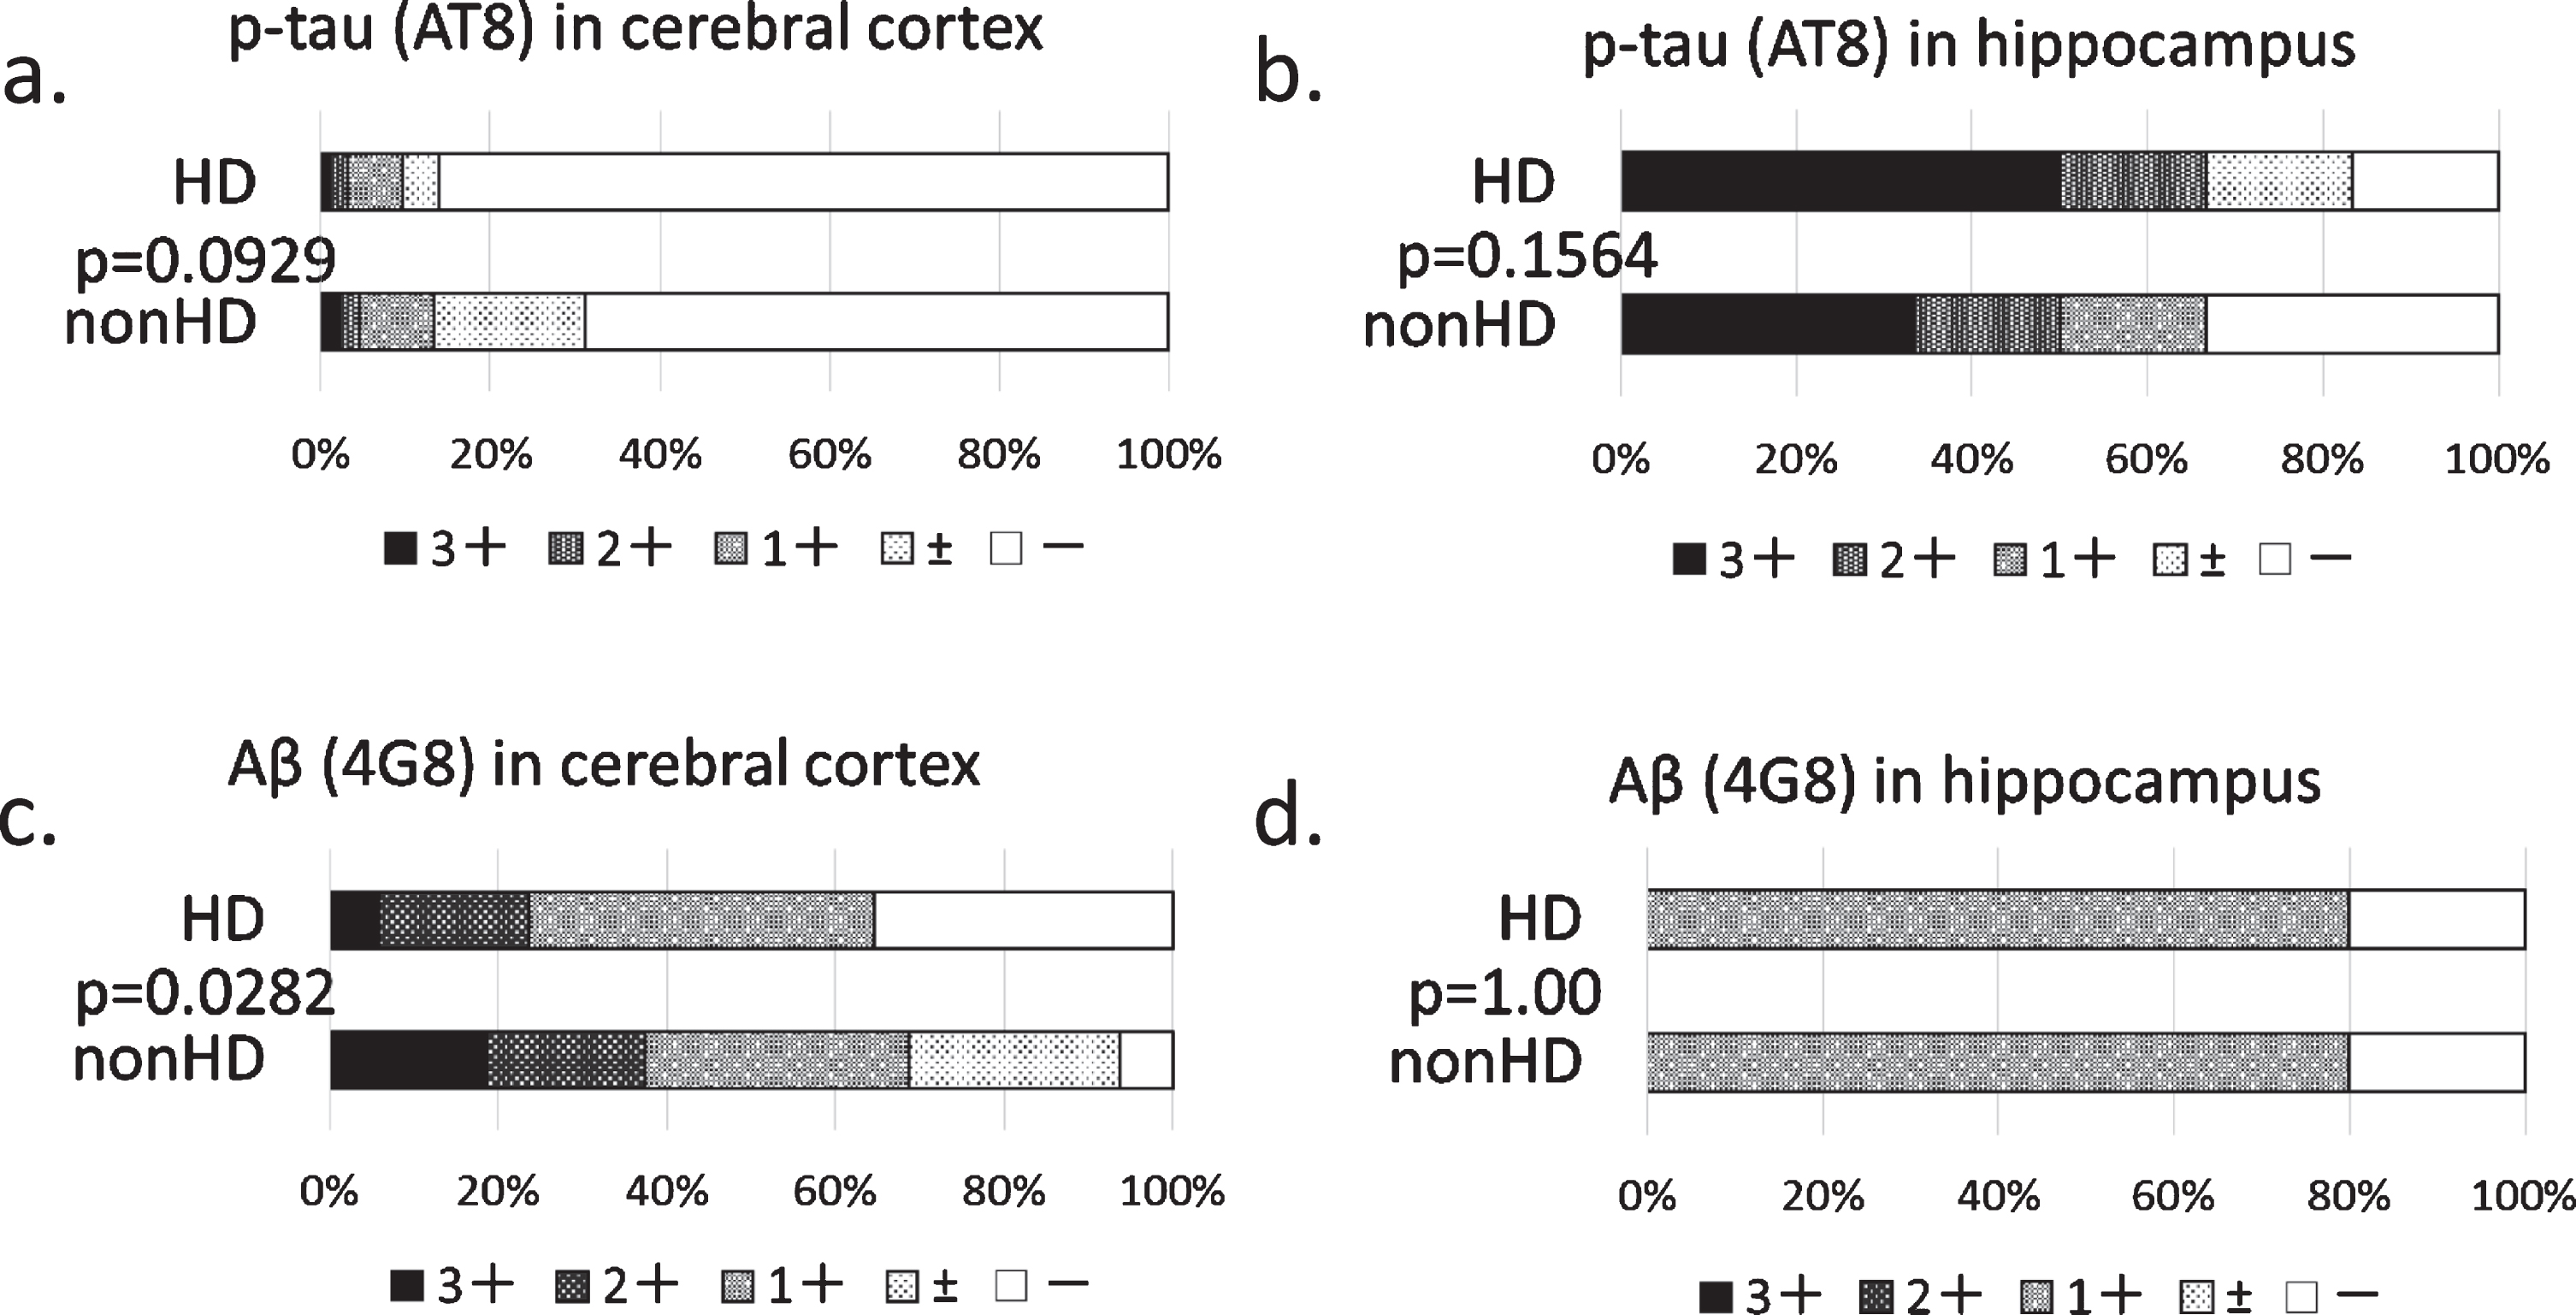
Semi-quantitative evaluation of p-tau and Aβ deposition in the brain of HD and nonHD patients. (a, b) P-tau evaluation using AT8; (c, d) Aβ evaluation using 4G8. (a, c) Cortex; (b, d) hippocampus. P-tau accumulations in the cortices were sparse in both nonHD and HD subjects, while those in the hippocampus was more apparent. The difference between nonHD and HD subjects was not significant. Cortices of nonHD subjects showed more Aβ deposition as senile plaques than those of HD subjects. P-tau as neurofibrillary tangles and Aβ as senile plaques were counted in at least five microscopic fields, each having a size of 3×106 μm2. The results were evaluated as “–,” none; “1+,” 2.5–9; “2+,” 10–60; and “3+,” more than 61 per 3×106 μm2/field. Statistical analysis was performed using the likelihood-ratio χ 2 test. HD, hemodialysis.
DISCUSSION
As shown in Fig. 2a, plasma t-tau concentration was significantly higher in patients with renal failure than in age-matched controls regardless of HD. Given that the decline in renal function was strongly correlated with plasma t-tau concentration (Figs. 2f and 3a), impaired catabolism of plasma t-tau in the kidney might be involved in the increase of t-tau concentration among patients with renal failure. Higher plasma concentrations of Aβ1–40 and Aβ1–42 were also observed in patients with renal failure (Fig. 2b,c). Our previous paper also reported an increase in plasma Aβ1–40 and Aβ1–42 along with a decline in renal function [18]. These findings for Aβ are consistent with Aβ clearance in the kidney and liver [28]. Unlike Aβ, however, tau metabolism in the peripheral tissues remains unclear at present.
Based on our findings presented in Fig. 2a and f (for all groups) and Fig. 3a (for HTCL + nonHD/RF patients), blood tau concentration strongly depended on renal function (serum creatinine). This shows that the kidney is one of the important organs involved in the peripheral metabolism of tau. After the initiation of HD, no clear increase in blood tau concentration had been observed (Fig. 4a). During and after the initiation of HD, high blood tau levels were maintained, similar to those in nonHD/RF subjects (Fig. 2a), probably because almost all renal function is impaired in the withHD/RF group, while hemodialyzers do not remove tau. Tau influx into the blood during HD sessions is small and may be gradually metabolized by peripheral tissues. This tendency in blood tau concentration after initiation of HD (Fig. 4a) was quite different from that in blood Aβ given that hemodialyzers removed Aβ effectively (Fig. 4b, c).
Although the possibility for the peripheral origin of plasma tau cannot be denied at the moment, brain tau can migrate into the blood. Human tau injected into the cisterna magna of mice were detected in the plasma within 10 min [31]. Tau transport from the brain to the blood has been reported to be similar to Aβ via blood circulatory clearance, including the blood–brain barrier, arachnoid villi, and blood–CSF barrier [10]. However, the transportation efficacy of tau is thought to be lower than that of Aβ given that the molecular weight of tau (around 50 kDa) is far larger than that of Aβ monomers (4–5 kDa). Furthermore, although several transporters, such as LRP-1, ApoJ, ApoE, and RAGE, have been known to transport Aβ from the brain to the blood [12 –15], transporters that transport tau from the brain have not yet been reported, to our knowledge.
In a cross-sectional study, plasma t-tau concentration showed no obvious dependency on HD vintage (Fig. 4a). This suggests that the influx of tau into the blood, if any, may be balanced by its degradation and excretion in peripheral tissues. The prospective study conducted herein (Fig. 5a) also supports this concept. Three out of the five nonHD/RF patients showed higher plasma tau concentrations after HD initiation compared to those just before HD initiation. Moreover, four nonHD/RF patient showed no clear change (less than 0.5 pg/ml) or increase of plasma tau, while one showed a decrease of 2 pg/ml during 1 years after the initiation of HD.
Compared to tau, Aβ had a greater decreasing tendency during and after the initiation of HD. The cross-sectional study showed that both plasma Aβ1–40 and Aβ1–42 concentrations significantly decreased along with longer HD durations for 40 years (Fig. 4b, c). This decreasing tendency can be attributed to the high Aβ, but not tau, removal efficiencies of the dialyzers (Fig. 6). However, this decreasing tendency in plasma Aβ was not obvious during the prospective study for 1–4 years (Fig. 5b, c). This may be because of the large influx of Aβ into the blood (from the brain) during HD sessions (Fig. 9b) (we reported similar influx of Aβ previously [17 –19]), especially for the initial several years after HD initiation.
Regarding tau influx into the blood, we revealed that plasma t-tau concentrations increased significantly during a HD session, especially around the 1 h period (Fig. 8a, b, e, and Fig. 9c), although dialyzers did not remove plasma tau (Fig. 6a, b). This tau influx seemed to cease in the latter half of a HD session, whereas Aβ influxes continued during the whole session (Fig. 9b–e).
We speculate that this tau influx may have been triggered by the start of a large Aβ influx (Fig. 13). As described before, a certain tau pathway from the brain to the blood exists [9 , 31]. Accordingly, one study showed that intracranially administered tau was found in the plasma within minutes after anti-tau antibody had been peripherally administrated as a tau binding substance [9]. However, unlike Aβ, we found no report of concrete molecules that transport tau into the blood. Considering that this tau pathway has been postulated to be common for both tau and Aβ [10], large Aβ influxes or E-BARS itself may accelerate/open such a pathway (“Gate for Aβ, tau?” in Fig. 13). Convective influx/glymphatic system might be one candidate for such pathway [32].
We next determined why the calculated Aβ influxes were large while plasma Aβ were decreased, as well as why the calculated tau influxes were small while plasma tau was increased, questions which may be raised from the data shown in Figs. 8e and 9b. One possible brief answer would be that Aβ but not tau, are very effectively removed by the dialyzers. Aβ entering into the blood are continuously removed by the dialyzers, resulting in lowering plasma Aβ concentrations. Unlike Aβ, tau is not removed by the dialyzers. Therefore, tau entering into the blood is accumulated for some time until the intrinsic metabolism reduces such an accumulation.
A more detailed schematic explanation is shown in Fig. 13. In the ordinal human body without E-BARS, which can be regarded as a steady state, the influxes of Aβ or tau into the blood are balanced by the intrinsic metabolism in peripheral tissues so as to maintain blood concentrations, similar to homeostasis (open arrows in Fig. 13). However, when patients are treated with E-BARS, Aβ removal devices, such as hemodialyzers, effectively remove blood Aβ, which triggers the influx of Aβ into the blood and tends to balance removal and influx (blue closed arrows in Fig. 13 top). Given that the amounts of Aβ removed by hemodialyzers and peripheral metabolism are a little larger than the influx, blood concentrations of Aβ may decrease during HD sessions. Unlike Aβ, however, tau is hardly removed by Aβ removal devices, such as hemodialyzers. Therefore, tau in the blood increases during the first half of the HD sessions but is then gradually metabolized by peripheral tissues (green closed arrows at the bottom of Fig. 13). The deference in the influx amounts of Aβ1–40, Aβ1–42, and tau is reflected of their blood concentrations (Aβ1–40, 100–1800 pg/ml; Aβ1–42, 10–130 pg/ml; tau, around 0.1–7 pg/ml), around 100 : 10 : 1, respectively.

Schematic explanation of differences in the influx of Aβ and tau triggered by hemodialysis as the E-BARS. Top, Aβ bottom, tau. Blood concentrations of Aβ are 10 to 100 times higher than that of tau. In a steady state, small influxes of Aβ or tau into the blood are balanced by the intrinsic metabolism in peripheral tissues. In the E-BARS process, Aβ removal devices, such as hemodialyzers, can effectively remove blood Aβ but almost no tau. Aβ removal by hemodialyzers triggers the influx of Aβ into the blood, which tends to balance removal and influx. Given that the amounts of Aβ removed by the hemodialyzers and peripheral metabolism are a little larger than the influx amount, blood concentrations of Aβ decrease during hemodialysis sessions. Tau influx is also triggered by Aβ removal during hemodialysis. However, given that tau is not removed by the hemodialyzers, it accumulates in the blood during the first half of the hemodialysis session and is then gradually metabolized by peripheral tissues.
Regarding the amount of Aβ removed by dialysis, Jin et al. revealed that peritoneal dialysis removed 131.33 ng of Aβ, which was around 2% of the total Aβ (7760 ng) in the normal human brain [26] as shown in Fig. 14 (the left open column for Aβ in the normal human brain, the right hatched column for Aβ removed by peritoneal dialysis, the middle closed column for Aβ removed by hemodialysis). Though peritoneal dialysis is one of the dialysis modalities, the devices used are totally different from HD. Peritoneal dialysis does not use an artificial kidney but rather the patients’ own peritonea as dialysis membranes. In a study of HD where artificial kidneys (hemodialyzers) were used as dialysis membranes, we revealed that hemodialyzers were able to adsorb and remove large amounts of blood Aβ1–40 and Aβ1–42 [19 –21]. Unlike the amount of Aβ removed through peritoneal dialysis [26], we revealed that HD removed 7219 ng of Aβ1–40 and 664 ng of Aβ1–42, totaling 7883 ng of Aβ removed during one HD session (4 h) (Fig. 9b). This amount of Aβ (7883 ng) removed through HD is consistent with that presented in our previous report [19] and comparable to the total Aβ (7760 ng) [33] in the normal human brain (Fig. 14). Of course, dynamic production and metabolism of Aβ continue even during HD sessions. However, this large Aβ amount removed through HD may form the basis of our histopathological finding that HD patients have significantly lower brain Aβ deposition than nonHD patients [22].

Comparison of Aβ amounts existing in the normal human brain to those removed by hemodialysis and by peritoneal dialysis. Left, the total Aβ in the normal human brain [33]; middle, total Aβ removed during one HD session (this study); right, total Aβ removed by peritoneal dialysis [26]. The amount of Aβ removed through HD is comparable to the total Aβ in the normal human brain. Aβ removed through peritoneal dialysis is only 1/60 of that through HD. HD, hemodialysis.
The difference in the amount of Aβ removed between HD and peritoneal dialysis is mainly attributed to the amount removed by hemodialyzers ((a) in Fig. 9c–e). This is because hemodialyzers continuously and effectively remove blood Aβ during the entire dialysis session such that the amount of Aβ removed becomes comparable to the total amount of Aβ in the brain.
However, other important factors related to the elimination of brain Aβ, such as microglia, astrocytes, inflammation, cerebral blood flow, blood–brain barrier, and perivascular lymphatic drainage, should also be considered [34 –36]. The relationship between these factors and HD should be investigated in the near future.
Provided that tau influx occurs during HD, tau accumulation in the brain might then be affected by HD. Therefore, the histopathology of p-tau in the brain of HD patients had been investigated. As shown in Fig. 11, p-tau were apparent in the hippocampus but sparse in the cortex perhaps due to the absence of AD among the subjects included in the present study. Semi-quantitative analysis revealed that p-tau accumulation in the cortex of HD patients was sparse and not significantly lower than those of nonHD patients (Fig. 12a). Moreover, p-tau accumulation in the hippocampus was higher than that in the cortex with no significant deference being found between HD and nonHD patients (Fig. 12b).
Differences in Aβ deposition between HD and nonHD patients were more apparent than those of p-tau in the cortex, where blood perfusion is larger than in hippocampus (Fig. 12c). The lesser deposition of Aβ in HD patients may be attributed to the large Aβ influx into the blood during HD sessions [17 –19]. These observations are consistent with those presented in our previous report [22], where HD patients showed fewer cortical plaques of each type (diffuse, neuritic, and cored) but no apparent difference in hippocampal plaques compared to nonHD patients.
The difference between tau and Aβ in the cortices shown in Fig. 12a (similar between HD and nonHD patients for tau) and Fig. 12c (significantly less in HD than nonHD patients for Aβ) is consistent with plasma concentration changes during long-term HD (Fig. 4), where tau remained unchanged and Aβ were significantly decreased.
Regarding the relationship between plasma tau concentration measured using our sensitive method (Simoa® by Quanterix) and cognitive function measured using the MMSE, a significant negative correlation had been found in HCTL patients (Fig. 10b, p = 0.0216). This finding is not inconsistent with previous reports, which showed that t-tau levels in the CSF and plasma were elevated in patients with AD [5 –7]. Furthermore, unlike HCTL patients, we also found a weak positive correlation between tau and cognitive function in nonHD/RF and withHD/RF patients regardless of HD (Fig. 10c, p = 0.0495 and 10d, p = 0.0470). Nonetheless, the interpretation for this finding remains unclear at present.
The present study revealed that dialyzers and HexDC do not remove plasma tau, although both effectively remove plasma Aβ (Figs. 6 and 7; also confirmed for 57 HD patients in our previous report [18]). Previous reports have shown that the main mechanism through which dialyzers and HexDC remove Aβ is through adsorption [4 , 21] wherein hydrophobic interactions between their surface and Aβ molecules take place. The low tau removal efficiencies of these materials would seem to suggest that tau has a weaker hydrophobicity than Aβ or that the adsorption pockets (microstructure of the surface) might be far smaller compared to the tau molecule (around 50 kDa).
At present, the possibility of HD becoming a brain tau removal method remains rather low. As an Aβ removal method, however, HD can be considered a good E-BARS. The Aβ influx amount triggered by HD is comparable to the total Aβ in the brain as described above. In fact, our histopathological studies showed that Aβ accumulation in the brains of patients undergoing HD was significantly lower than that in age-matched controls without HD [22]. A more direct evidence would be that brain Aβ accumulation in a patient who underwent HD was decreased by – 0.19 SUVR after 6 months of HD, which was confirmed through PiB/PET [23]. Unlike Aβ, tau influx during HD sessions was 1/100–1/1000 that of the Aβ influx (Fig. 9b), a difference is reflected in their blood concentrations (around 100 : 10 : 1 for Aβ1–40:Aβ1–42:tau). Previous studies have shown that CSF concentrations for Aβ1–40, Aβ1–42, and tau in control subjects were around 19200, 630, and 224 pg/ml, respectively [37, 38]. A concentration gradient of around 100 : 1 exists between the CSF and plasma for tau, whereas this gradient is around 10 : 1 for Aβ. Thus, tau (around 50 kDa) may be much harder to move into the blood from the brain compared to Aβ (4–5 kDa). Furthermore, hemodialyzers remove almost no tau from the blood (Fig. 6a, b). As a result, histopathological studies on p-tau accumulation in the cerebral cortices did not indicate an apparent reduction in p-tau among patients undergoing HD (Fig. 12a). Because both HD and nonHD subjects in this study did not have AD, they had few depositions of p-tau in their cortices. Considering that perfusion is lower in the hippocampus than in the cerebral cortex, the effects of HD on both Aβ and tau in the hippocampus seem to be small (Fig. 12b, d).
Therefore, our hypothesis that blood Aβ removal may reduce brain Aβ (Fig. 1a) seems to be valid during HD given that the amount of Aβ influx was comparable to the amount Aβ in the brain. This validity is based on rather high concentrations of blood Aβ and high Aβ removal efficiencies of hemodialyzers, one of the E-BARS. However, using HD to remove brain tau seems to be difficult considering that tau concentrations in the blood are much lower compared to that in the CSF (Fig. 2a), hemodialyzers have almost zero tau removal efficiencies (Fig. 6a, b), and tau influx during HD is small (Fig. 9b). Despite the low blood tau concentrations, it cannot be totally denied that an extracorporeal system using a device that removes blood tau effectively could reduce brain tau levels.