
Abstract
The APOE ɛ4 gene variant is the strongest genetic risk factor for Alzheimer’s disease (AD), whereas APOE ɛ3 conventionally is considered as ‘risk neutral’ although APOE ɛ3-carriers also develop AD. Previous studies have shown that the apolipoprotein E3 (apoE3) isoform occurs as monomers, homodimers and heterodimers with apolipoprotein A-II in human body fluids and brain tissue, but the relevance of a plasma apoE3 monomer/dimer profile to AD is unknown. Here we assessed the distribution of monomers, homodimers and heterodimers in plasma from control subjects and patients with mild cognitive impairment (MCI) and AD with either a homozygous APOE ɛ3 (n = 31 control subjects, and n = 14 MCI versus n = 5 AD patients) or APOE ɛ4 genotype (n = 1 control subject, n = 21 MCI and n = 7 AD patients). Total plasma apoE levels were lower in APOE ɛ4-carriers and overall correlated significantly to CSF Aβ42, p(Thr181)-tau and t-tau levels. Apolipoprotein E dimers were only observed in the APOE ɛ3-carriers and associated with total plasma apoE levels, negatively correlated to apoE monomers, but were unrelated to plasma homocysteine levels. Importantly, the APOE ɛ3-carrying AD patients versus controls exhibited a significant decrease in apoE homodimers (17.8±9.6% versus 26.7±6.3%, p = 0.025) paralleled by an increase in apoE monomers (67.8±18.3% versus 48.5±11.2%, p = 0.008). In the controls, apoE monomers and heterodimers were significantly associated with plasma triglycerides; the apoE heterodimers were also associated with levels of high-density lipoprotein cholesterol. The physiological relevance of apoE dimer formation needs to be further investigated, though the distribution of apoE in monomers and dimers appears to be of relevance to AD in APOE ɛ3 subjects.
INTRODUCTION
The APOE gene in humans has three common alleles, ɛ2, ɛ3, and ɛ4, that generate the apolipoprotein E (apoE) isoforms apoE2, apoE3 and apoE4 [1]. Carriers of the ɛ4 gene variant are known to harbor an increased risk of sporadic Alzheimer’s disease (AD) [2] whereas the ɛ2 variant appears to be protective, and the ɛ3 is considered to be neutral to the risk of AD [3, 4]. Apolipoprotein E found in the plasma is mainly produced by hepatocytes whereas astrocytes are the main source of apoE in the central nervous system. In both compartments, apoE is considered a major player in lipid metabolism [5]. Although the biological mechanisms related to the increased risk of AD in carriers of the ɛ4 allele are yet to be clearly identified, a multitude of apoE4 functions [5] have been proposed and related to mechanisms both dependent and independent of the amyloid-β (Aβ) peptide [6–11]. Subjects carrying the APOE ɛ4 allele exhibit a phenotype in which plasma apoE levels are significantly reduced due to a specific reduction of the apoE4 isoform concentration, as assessed in APOE ɛ4 heterozygous individuals [12]. Interestingly, low plasma apoE levels were previously shown to increase the risk of not only AD but all types of dementia in a population-based study including more than 75,000 subjects [13]. A connection between plasma apoE and the risk of AD is, however, controversial since liver transplantation studies have demonstrated that apoE does not cross the blood-brain barrier [14]. Regardless, we recently demonstrated that plasma apoE levels could in fact be related to pathological processes in the brain since an increased relative ratio between the plasma concentrations of the apoE4 to apoE3 isoforms was associated with glucose hypometabolism and reduced grey matter volume in several brain areas normally affected in AD [15]. Our understanding of a potential relationship between peripheral apoE levels and brain pathological processes potentially promoting AD is, however, still limited, and complicated by the fact that also non-APOE ɛ4-carriers develop AD.
The apoE isoform-specific sequence variation at positions 112 and 158 (ɛ2; Cys, Cys, ɛ3; Cys, Arg, ɛ4; Arg, Arg) affects its lipid-binding capacity [16, 17] and vulnerability to proteolytic fragmentation [18], which in turn may have physiological significance as well as relevance to AD. It was previously shown that the apoE isoforms have different turnover rates in the periphery and in the brain with an accelerated turnover of apoE4 in plasma but not cerebrospinal fluid (CSF) [19]. A differential distribution of the apoE4 to apoE3 concentrations in plasma versus CSF was also demonstrated and pointed to an under-representation of apoE4 in plasma (20–40% of total apoE) compared to CSF (50–60% of total apoE) in APOE ɛ3/ɛ4 heterozygous individuals [12, 20]. Also, peripheral apoE isoforms are distributed differently in lipoprotein particles; apoE3 is generally associated with high density lipoproteins (HDL) and apoE4 with very low density lipoproteins (VLDL) [21]. In terms of receptor binding, apoE4 appears to have a higher affinity to members of the low-density lipoprotein receptor (LDLR) family than apoE3 and apoE2 [22]. The functional interaction between apoE isoforms and LDLR may moreover be related to spatial memory [23] and relevant to AD. The apoE isoform sequence variation results in the ability to form homo- and heterodimers so that apoE2 and apoE3 but not apoE4 can form homodimers and also heterodimers with apolipoprotein A-II (apoA-II) owing to the formation of disulfide bridges between cysteine residues in the apoE2 and apoE3 isoforms [24]. Formation of apoE dimers has been recorded in plasma [24], CSF [25], and AD-relevant areas in the brain [26]. Previous studies pointed out that dimerization of apoE3 altered its lipid-binding property which in turn affected its function as a lipid carrier. It was further proposed that the apoE3 dimerization-induced altered property, including reduced affinity to LDLR, may be a rate-limiting factor in metabolic processes involving LDLRs [24]. However, the functional relevance of monomeric or dimeric apoE to the risk of AD and the development of AD pathology or any other neurodegenerative disease is not clear.
In the current study we have investigated a potential association between plasma apoE monomer and dimer profiles, and AD in APOE ɛ3 versus APOE ɛ4 (known not to form apoE dimers) homozygous individuals in a well-characterized cohort from which CSF samples have previously been assessed for levels of the conventional AD biomarkers [27–29]. Our results reveal novel insights into a potential relationship between altered apoE3 dimer formation in plasma and AD.
MATERIALS AND METHODS
Participants
Subjects with either APOE ɛ3/ɛ3 (n = 50, whereof controls (n = 31); mild cognitive impairment (MCI) (n = 14) and AD (n = 5) patients) or APOE ɛ4/ɛ4 (n = 29, whereof control (n = 1); MCI (n = 21) and AD (n = 7) patients) genotypes were included in this study. Subjects were part of a previously described cohort enrolled at the Department of Neurology, University Hospital, Trondheim, Norway, between 2009 and 2015 as described elsewhere [27, 28]. Clinical diagnoses were determined by two neurologists. Patients diagnosed with AD met the NINCDS-ADRDA criteria and those with MCI met the International Working Group on Mild Cognitive Impairment criteria [30]. Control subjects were genetically unrelated to the patients. Sampled blood was centrifuged at 1500×g for 10 min at room temperature (RT) and plasma was collected. APOE genotyping [31] and assays for core AD biomarkers including Aβ42, Aβ40, total tau (t-tau) and phosphorylated tau at Thr181 (p-tau) were performed as described before [27]. Plasma levels of homocysteine, total cholesterol, low-density lipoprotein (LDL), high-density lipoprotein (HDL) cholesterol, and triglycerides were assessed using clinical routine protocols by the Karolinska University Laboratory at the Karolinska University Hospital in Solna (Sweden). All subjects included in the study, or their proxies, gave written informed consent. The present study was approved by the Regional Committee for Medical Research Ethics, Trondheim, Norway and the local ethics committee in Stockholm, Sweden. The research was carried out in agreement with the Helsinki Declaration.
Determination of total plasma apoE concentrations
Plasma was diluted in phosphate buffered saline (PBS) containing 1% nonfat milk and total apoE concentrations were quantified using a sandwich enzyme-linked immunosorbent assay (ELISA) as described previously [32]. Briefly, plasma apoE was captured with a monoclonal pan-apoE antibody WUE-4 (final concentration 1 μg/mL, Novus biologicals) and detected by a biotinylated pan-apoE antibody (final concentration 0.2 μg/mL, Meridian Lifesciences). The interaction was amplified by poly-HRP-Streptavidin (final concentration 1 μg/mL, Fitzgerald) and visualized by the addition of tetramethylbenzidine (TMB, Sigma-Aldrich). After the addition of stop solution (1 M H2SO4), the optical density at 450 nm was quantified using the HiPo-96 microplate photometer (BIOSAN, Riga, Latvia). Standard curves were generated by serial dilutions of recombinant apoE3 and apoE4 proteins (Fitzgerald, USA) using a 4-parametric curve fit. Plasma apoE3 versus apoE4 levels were determined by interpolation from the apoE3 and apoE4 standard curves, respectively. All samples and standards were run in duplicates and the results averaged. Average intra- and inter-plate variation coefficients (CV%) were <5% and <10% respectively and the spike-recovery percentage ranged between 84–89%.
Assessment of plasma apoE monomers, homodimers and heterodimers
To initially set-up the apoE dimer analysis, three pools of plasma samples (Sera Laboratories International Ltd, United Kingdom) were analyzed by SDS-PAGE and western blotting under both reducing and non-reducing conditions with the aim to detect apoE monomers and dimers. Using standardized conditions, the plasma samples from the included subjects with either an APOE ɛ3/ɛ3 or APOE ɛ4/ɛ4 genotype were analyzed to determine the distribution of plasma apoE monomers, homodimers and heterodimers in each sample. Briefly, plasma samples were diluted 1:20 in PBS pH 7.4 and mixed with non-reducing SDS-PAGE loading buffer to a final concentration of 60 mM Tris-HCl, 1% SDS, 0.04% bromophenol blue and 10% glycerol, with or without 2% β-mercaptoethanol. Samples with the reducing agent were heated to 80°C for 5 min. Samples were run on 4–15% pre-cast polyacrylamide gels (Bio-Rad Tris-Glycine-TGX) and transferred to a polyvinylidene difluoride membrane (PVDF, Immobilon-P Millipore) using the Bio-Rad Trans-blot semi-dry system. Unspecific binding sites on the membranes were blocked with 1% w/v non-fat dry powder milk in Tris-buffered saline (TBS- 20 mM Tris base and 150 mM NaCl) with 0.05% Tween-20 (TBS-T) for 1 h at RT. Apolipoprotein E was targeted with the pan-apoE antibody WUE-4 (concentration 1 μg/mL, Novus Biologicals) and apoE-apoAII heterodimers were targeted by an antibody against human apoA-II, 43H22L4 (concentration 2 μg/mL, ThermoFisher Scientific). Specific bands were detected either with HRP-conjugated secondary antibodies (dilution 1:5000 in TBST) followed by visualization with enhanced chemiluminescence solution (ECL) in a ChemiDoc scanner (BioRad), or with secondary antibodies conjugated to a fluorophore dye (680CW or 800CW, dilution 1:20000 in TBS-T) followed by visualization using the Odyssey imaging system (LI-COR Biosciences). Images were analysed using ImageJ open source software. The obtained images were converted to 8-bit format, de-pixilated, and from the un-calibrated integral density readouts, the blank background was subtracted. The density of each visualized band was measured by using the same rectangular area based on the size of the largest relevant band. First, we determined the total apoE levels for each APOE ɛ3/ɛ3 subject by adding together the intensities of the apoE antibody-detected bands on the western blots, and the results were set to 100%. Next, we determined the % of homo- and heterodimers of the total apoE (100%) by dividing the intensity of the individual bands with the total apoE intensity and multiplied by 100. Hence, we obtained the % distribution of plasma apoE monomers, homodimers and heterodimers to total plasma apoE. Additionally, we calculated the ratios of plasma apoE homodimers and heterodimers to monomers as well. Values were used for statistical analysis.
Statistical analysis
JMP Pro statistical software version 14.0.0 (SAS Institute, NC, USA) was used to analyze the total plasma apoE results. A p value ≤0.05 was considered statistically significant and significance was indicated as p≤0.05, p≤0.01, and p≤0.001. The ELISA-generated plasma apoE data did not follow a normal distribution, as assessed by Shapiro-Wilk test for normality and the goodness of fit. Therefore, nonparametric tests were employed for group comparisons of plasma apoE levels (Kruskal-Wallis test and Mann-Whitney U test) between APOE genotypes and among clinical diagnostic groups. Bonferroni correction was used to account for multiple comparisons with the number of comparisons (n) indicated where applicable. Due to the non-normal distribution of the AD biomarker data, nonparametric correlation analysis (Spearman’s rho) was performed to assess potential correlations of plasma apoE levels with age at examination, Mini-Mental State Examination (MMSE) score and CSF levels of Aβ42, Aβ40, t-tau, and p-tau. CSF AD biomarker profile data from the entire cohort have been reported previously [28, 29].
Statistical analysis following western blotting was performed using the software GraphPad Prism 7 (GraphPad Software). The levels of plasma apoE monomers, heterodimers, and homodimers were expressed as % distribution of total apoE in each subject. Since concentrations of monomers and dimers followed a normal distribution, the comparison between the three groups was performed using parametric one-way ANOVA. Correlation analysis of plasma apoE monomers and dimers to CSF AD biomarkers was performed using the JMP Pro 14.0.0 statistical software. Parametric (Pearson’s r) or non-parametric (Spearman’s rho) correlation analysis was carried out depending on the distribution of CSF biomarker data points as normal or non-normal respectively. Depending on the distribution, results are presented as median with range (min-max) or average with standard deviation.
RESULTS
Cohort demographics and clinical characteristics
Detailed descriptive statistics for the whole cohort were previously reported [28]. From that cohort, all subjects with an APOE ɛ3/ɛ3 and an APOE ɛ4/ɛ4 genotype were selected totaling n = 79 subjects, whereof n = 50 with an APOE ɛ3/ɛ3 (n = 31 controls, n = 14 and n = 5 patients with MCI versus AD) and n = 29 with an APOE ɛ4/ɛ4 genotype (n = 1 control, n = 21 and n = 7 MCI versus AD patients) for the present study. The clinical characteristics of the subjects studied are summarized in Table 1. The age-distribution was similar between groups and, as expected, total MMSE scores and CSF levels of AD biomarkers were significantly different between the diagnostic groups (Table 1). We also compared the examined individuals based on their APOE genotype. Regardless of their disease status, APOE ɛ3 individuals showed significantly higher MMSE scores (Mann-Whitney U test, p < 0.0001) and CSF levels of Aβ42 (student’s t-test, p < 0.0001). On the contrary, APOE ɛ4/ɛ4 exhibited higher levels of both CSF t-tau (Mann-Whitney U test, p = 0.0004) and p-tau (Mann-Whitney U test, p = 0.0004). The plasma lipid profile differed between APOE ɛ3/ɛ3 and APOE ɛ4/ɛ4 subjects based only on the triglycerides of which the APOE ɛ4-carriers exhibited higher levels (Supplementary Table 1). No differences in plasma lipid levels were observed between the controls, MCI and AD patients with the APOE ɛ3/ɛ3 genotype (Supplementary Table 1). The same pattern was observed for plasma homocysteine levels for which APOE ɛ4-carriers exhibited significantly higher levels compared to APOE ɛ3-carriers; no differences were observed between patients and controls with the APOE ɛ3/ɛ3 genotype (Supplementary Table 1).
Demographics and clinical characteristics of study subjects
Data represented as average±standard deviation, or median (min-max). AD, patients with Alzheimer’s disease; MCI, patients with mild cognitive impairment; APOE, apolipoprotein E; MMSE, Mini-Mental State Examination; CSF, cerebrospinal fluid; Aβ42, amyloid β 1–42; Aβ40, amyloid β 1–40; p-tau, tau phosphorylated at Thr181; t-tau, total tau; ap-value indicates potential significant differences between controls MCI and AD patients; bχ2test; cNon-parametric analysis of variants by Wilcoxon/Kruskal-Wallis test; dParametric analysis of variants by one-way ANOVA; na, not applicable multiple comparison between the diagnostic groups due to statistically insufficient sample size; *p≤0.05, **p≤0.01, ***p≤0.001; –, not significant.
Plasma total apoE levels
We employed a pan-apoE ELISA to quantify total plasma apoE levels in APOE ɛ3/ɛ3 and APOE ɛ4/ɛ4 subjects by use of individual standard curves generated by recombinant apoE3 or apoE4 proteins. As expected, plasma apoE levels were found to be almost three times higher in APOE ɛ3/ɛ3 compared to APOE ɛ4/ɛ4 subjects (Fig. 1A). When the subjects were grouped based on clinical diagnosis, total plasma apoE levels in controls were higher compared to MCI and AD patients (Fig. 1B). When analyzing apoE levels among diagnostic groups stratified according to APOE genotype, a trend of lower levels was noticed among APOE ɛ3/ɛ3 AD patients compared to healthy individuals of the same genotype (p = 0.0744). Among APOE ɛ4/ɛ4 subjects, there was no difference in apoE levels between MCI and AD patients (the sole APOE ɛ4/ɛ4 carrying healthy control subject was excluded from the analysis due to insufficient sample size (n = 1)).

Plasma total apoE levels. Comparison of plasma apoE levels, as assessed by ELISA, between individuals with an APOE ɛ3/ɛ3 (green dots) and APOE ɛ4/ɛ4 (red dots) genotypes using the Mann-Whitney U test (A). Comparison of plasma apoE levels among healthy individuals, MCI and AD patients with p-values indicated after applying Bonferroni correction for multiple comparisons (n = 3) (B). Comparison of plasma apoE levels between females and males in subjects with an APOE ɛ3/ɛ3 (C) and APOE ɛ4/ɛ4 (D) genotype.
No significant gender difference was observed for the total plasma apoE levels. However, when subjects were analyzed separately for each genotype it was observed that within APOE ɛ3/ɛ3 subjects, females exhibited nearly 40% higher plasma apoE levels than males (Fig. 1C). The opposite was found in APOE ɛ4/ɛ4 subjects where females had roughly 20% lower plasma apoE levels than males (Fig. 1D).
Correlations between total plasma apoE, age, global cognition and CSF biomarkers
Next, we assessed if plasma apoE levels were associated with age, global cognition (MMSE scores) and CSF levels of AD biomarkers including Aβ42, Aβ40, t-tau, and p-tau. Plasma apoE levels were not related to age in the whole cohort nor in any of the subgroups (data not shown). However, plasma apoE levels were positively associated with MMSE scores (Fig. 2A). We further observed a strong positive correlation between plasma apoE and CSF Aβ42 (Fig. 2B) and a negative correlation with both CSF t-tau and CSF p-tau (Fig. 2C, D). No significant correlation was found between plasma apoE and CSF levels of Aβ40.
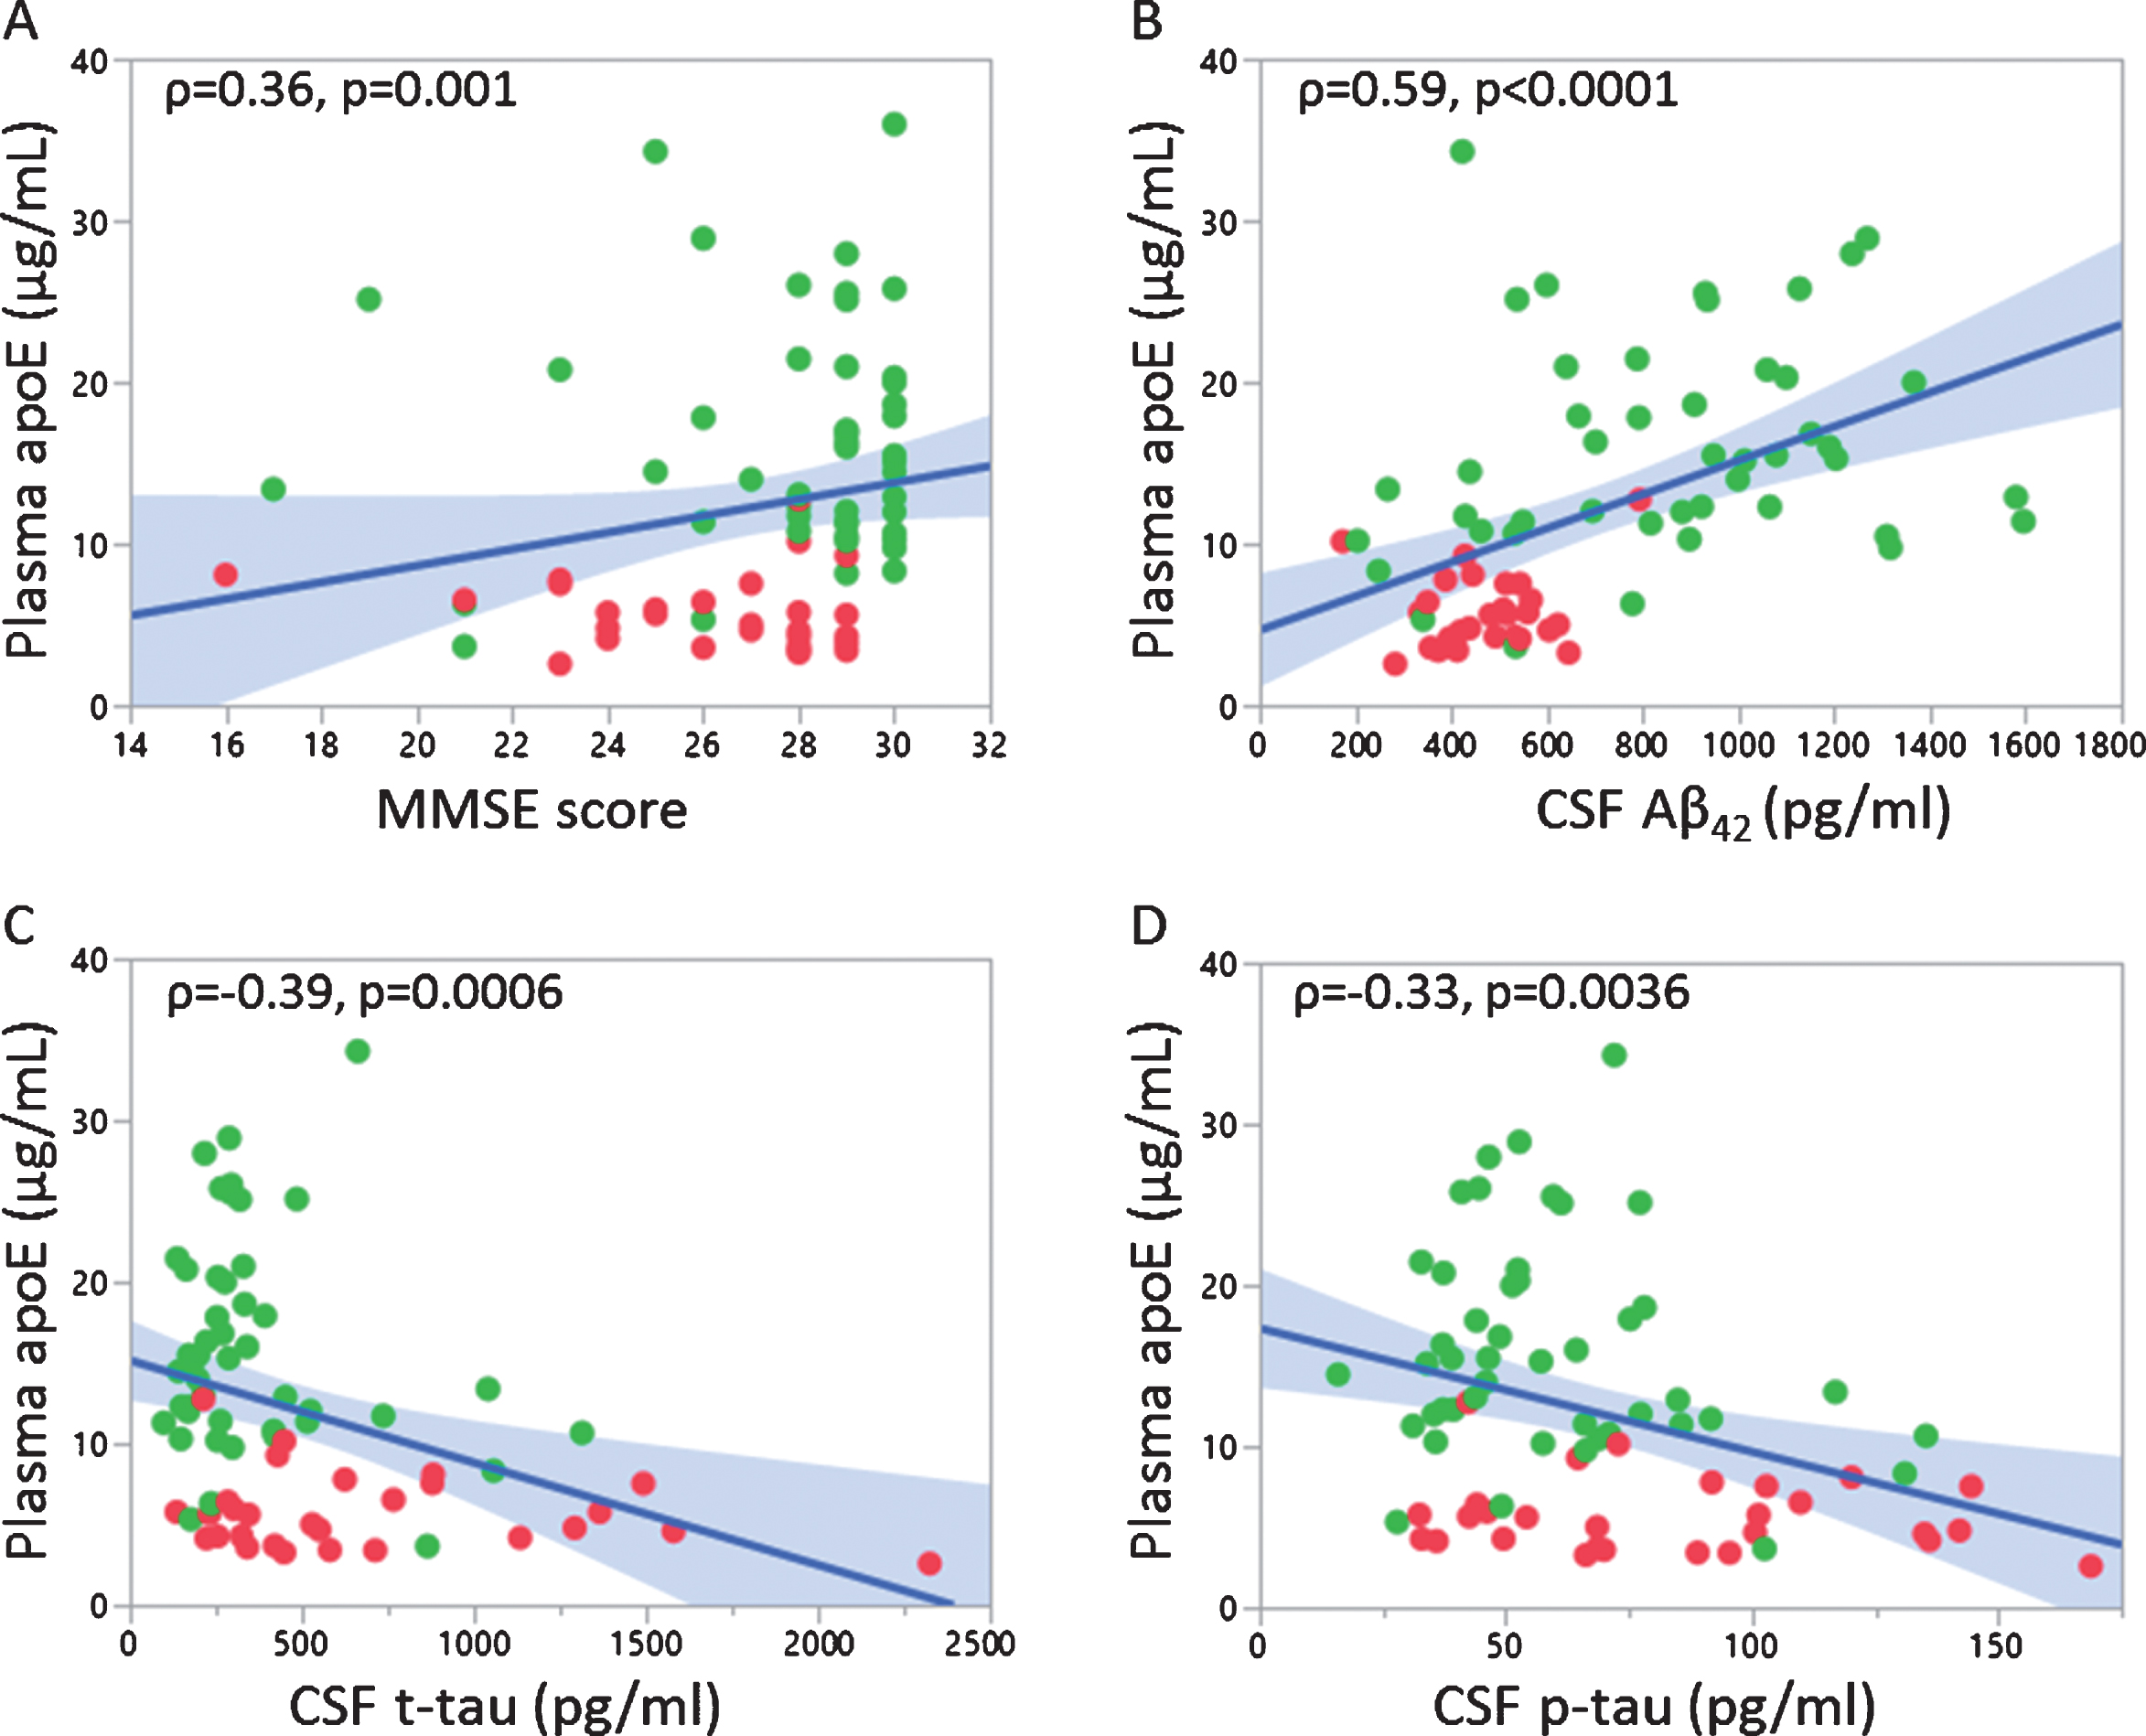
Correlation of plasma apoE levels with MMSE scores and CSF AD biomarkers. Correlation between plasma apoE levels and MMSE scores (A), CSF Aβ42 (B), CSF t-tau (C) and CSF p-tau (D). Non-parametric correlation analysis (Spearman’s rho) was performed with corresponding p-value mentioned; APOE ɛ3/ɛ3 (green dots) and APOE ɛ4/ɛ4 (red dots).
Plasma apoE monomer and dimer profiling in pooled plasma samples
To confirm the presence of apoE homodimers and apoE-apoA-II heterodimers, three pools of plasma samples were analyzed using reducing and non-reducing SDS-PAGE, followed by western blotting against apoE and apoA-II (Fig. 3). An apoE antibody-reactive band was observed at 36 kDa corresponding to the monomeric form of apoE, under both reducing and non-reducing conditions. As expected, only under non-reducing conditions we were able to detect two additional bands at 43 and 95 kDa. These bands corresponded to apoE-apoA-II heterodimers and apoE homodimers, respectively, and could not be detected under reducing conditions in line with a previous report [24]. The elimination of apoE dimers under reducing conditions was paralleled by a corresponding increase in the levels of apoE monomers. To confirm the presence of apoA-II in the apoE heterodimers, we probed the membranes with antibodies against apoA-II. Regardless of whether reducing or non-reducing conditions were applied, we observed a band at approximately 12 kDa corresponding to the monomeric form of apoA-II, according to the supplier (ThermoFisher Scientific). Under non-reducing conditions, we detected an apoA-II antibody-specific band at 43 kDa, identical to the band detected with antibodies against apoE (Fig. 3).
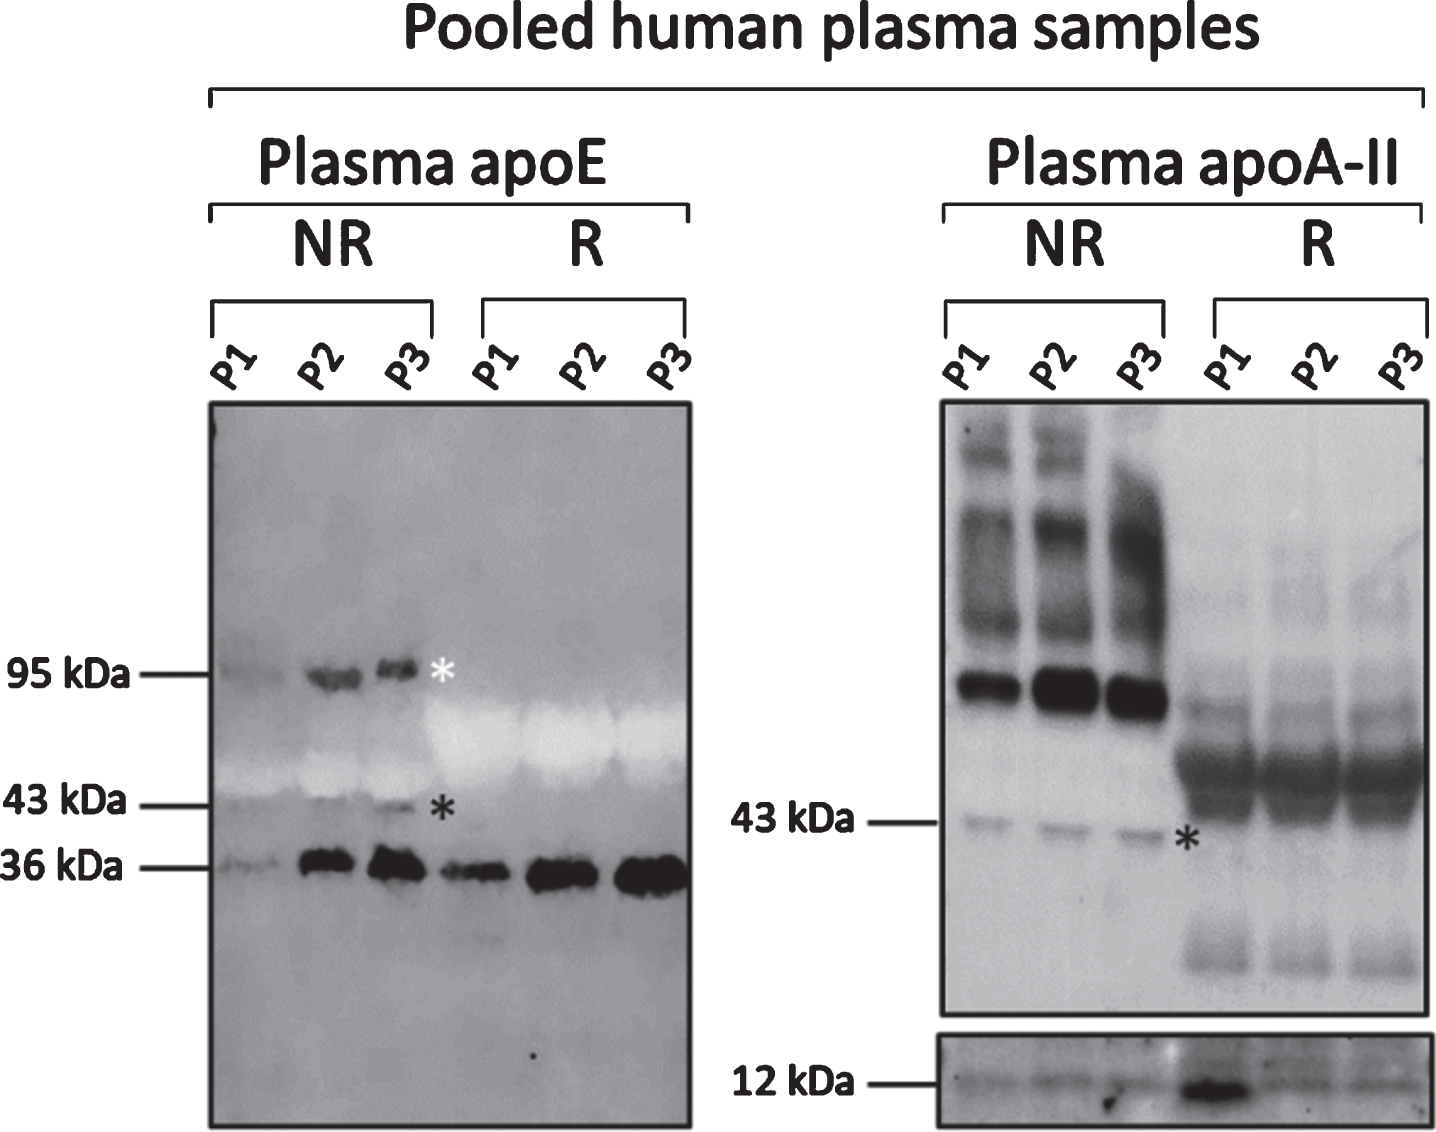
Plasma apoE monomer and dimer profiles in pooled plasma samples. Western blot analysis of three different pools of plasma samples (P1, P2, P3) under non-reducing (NR, left on blots) and reducing conditions (R, right on blots) using pan-apoE and apoA-II antibodies illustrating that the detection of apoE homodimers (white star, band approximately at 95 kDa) and apoE-apoAII heterodimers (black star, band approximately at 43 kDa) was eliminated in reducing conditions. Monomers of apoE and apoA-II were detected under both conditions as indicated by the appearance of the bands at 36 and 12 kDa, respectively.
Plasma apoE monomer and dimer profiles in APOE ɛ3/ɛ3 versus APOE ɛ4/ɛ4 subjects with different disease status
As mentioned above and consistent with previous studies [24–26], we observed only one band at approximately 36 kDa corresponding to monomeric apoE in the plasma from APOE ɛ4/ɛ4 subjects (Fig. 4A and Supplementary Figure 1). On the contrary, in the plasma of APOE ɛ3/ɛ3 subjects, we recorded monomeric apoE of 36 kDa and two more bands at approximately 43 kDa and 95 kDa. These higher molecular weight bands corresponded to the heterodimeric form of apoE with apoA-II and to the apoE homodimers (Fig. 4B and Supplementary Figure 1). We further investigated potential differences in the % distribution of apoE monomers, heterodimers and homodimers between APOE ɛ3 homozygous control subjects, MCI and AD patients. In the control subjects, plasma apoE existed as dimers (51.5±11.2%, whereof homodimers 26.7±6.3% and heterodimers 24.8±9.2%) and monomers (48.5±11.2%). The investigated diagnostic groups differed significantly in the amount of apoE monomers (p = 0.011), total dimers (p = 0.011), and apoE homodimers (p = 0.029). Specifically, in AD patients the amount of apoE monomers was 19.3 % higher (p = 0.008) and that of apoE homodimers was 8.9% lower (p = 0.025) (Fig. 5). We observed no significant differences in apoE dimer formation between the control subjects and the MCI patients though we recorded 15.6% higher levels of apoE monomers (p = 0.023) and 7.9% lower levels of apoE homodimers (p = 0.028) in AD versus MCI patients. These differences, however, did not survive correction for multiple comparisons (n = 3). No differences in the levels of apoE heterodimers were detected among the examined groups (Fig. 5).
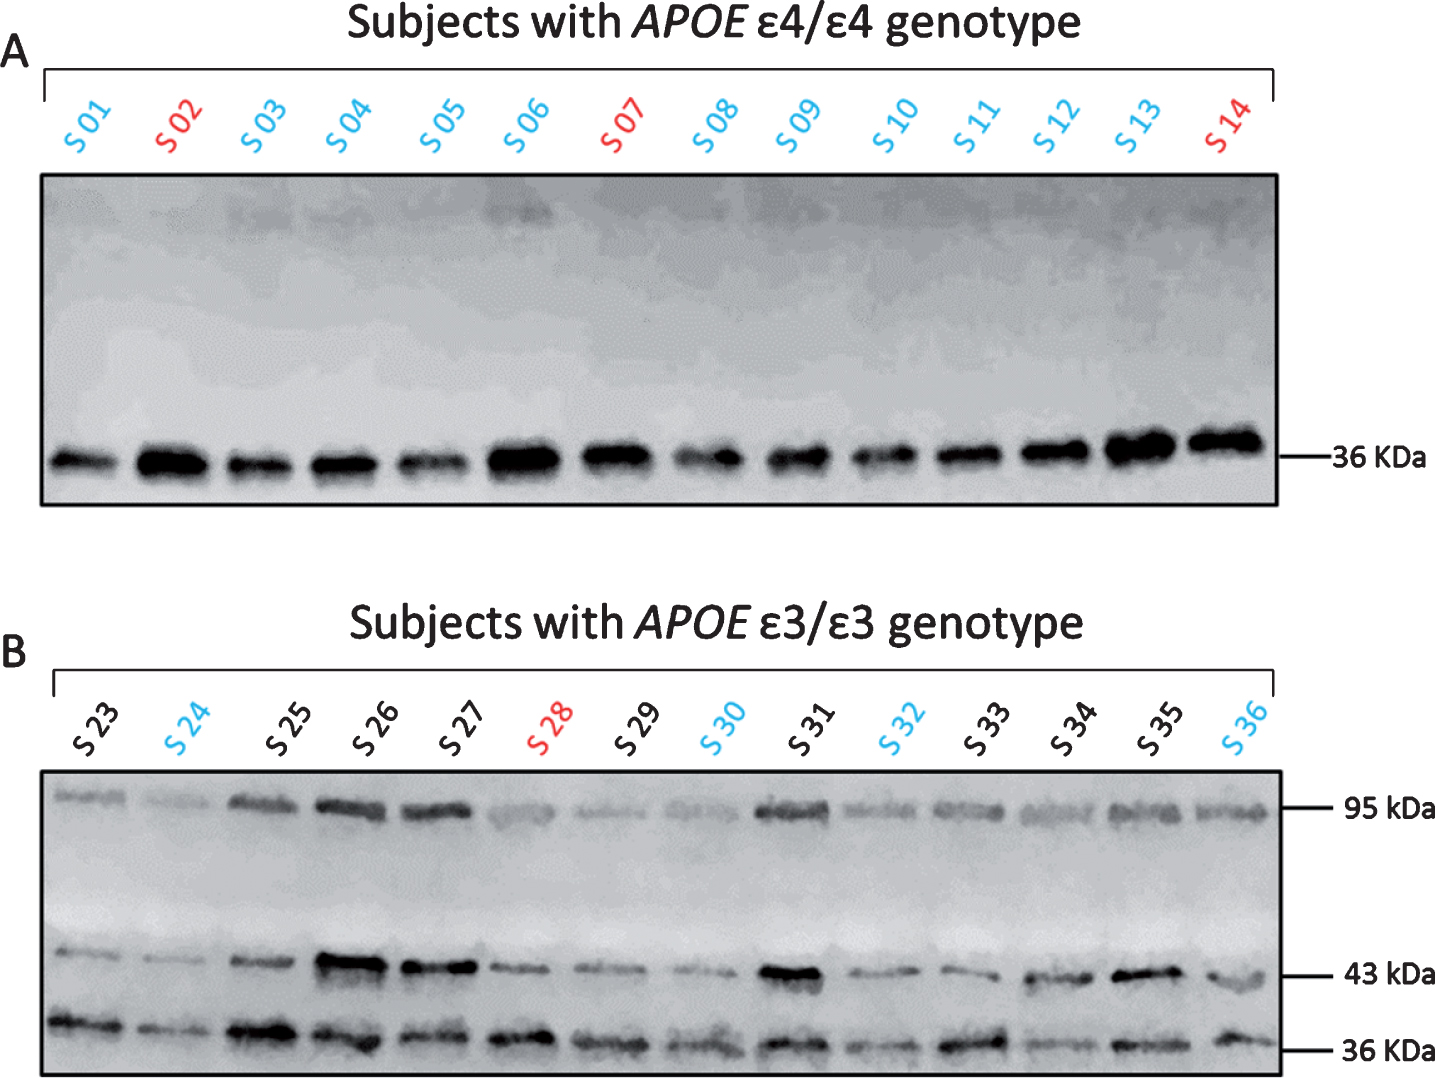
Plasma apoE monomer and dimer profiles in APOE ɛ3/ɛ3 and APOE ɛ4/ɛ4 subjects. Representative western blot images showing the different forms of plasma apoE in APOE ɛ3/ɛ3 and APOE ɛ4/ɛ4 subjects (S). The color differences in the letter S, correspond to the clinical diagnosis (black = controls, blue = MCI and red = AD patients). Plasma apoE4 was only present as monomeric apoE, as indicated by a single band at 36 kDa (A). Plasma apoE3 was additionally found as heterodimers with apoA-II (43 kDa) and homodimers (95 kDa) (B).
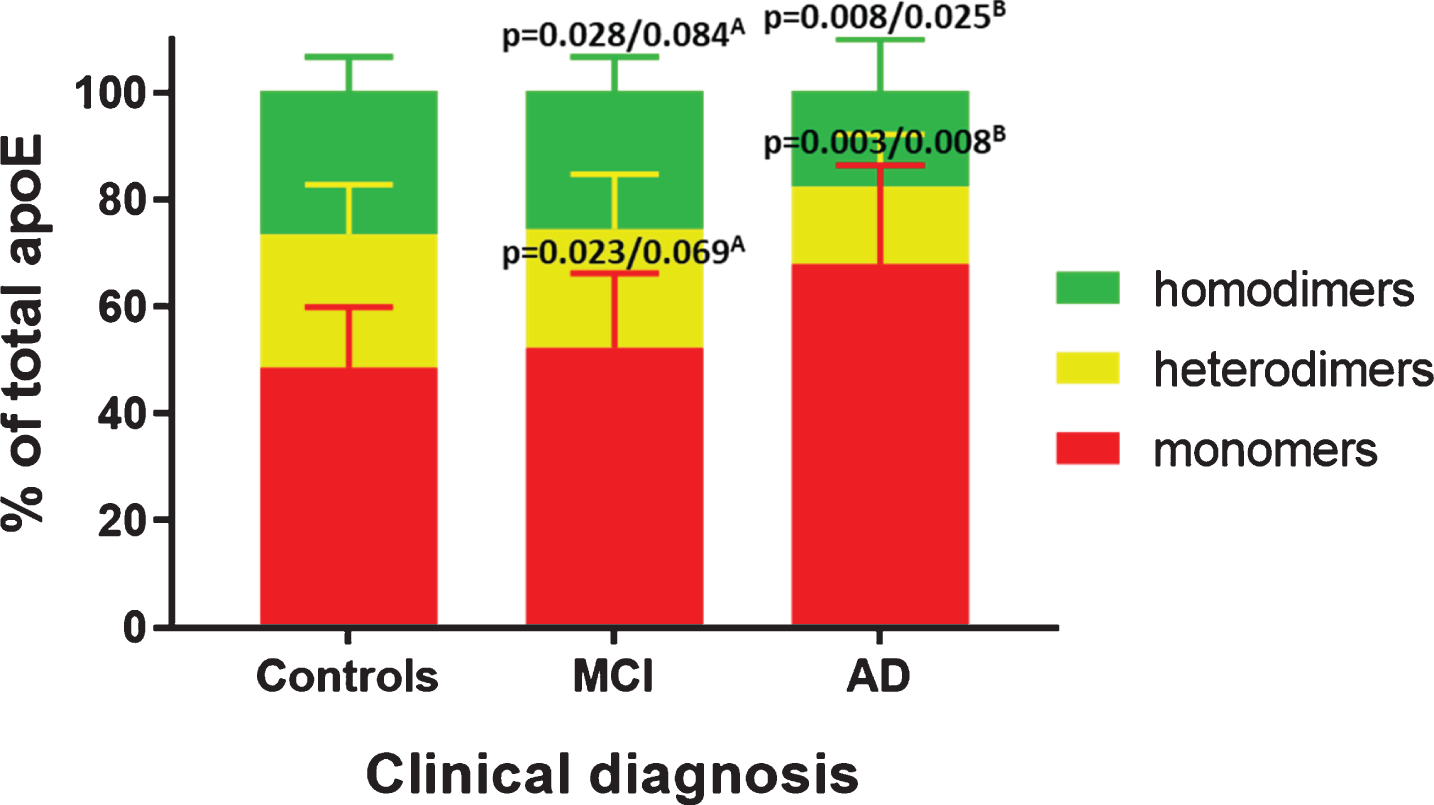
Distribution of plasma apoE monomers and dimers in plasma from APOE ɛ3/ɛ3 controls, MCI and AD patients. Distribution (% of total apoE) of apoE homodimers (green), heterodimers (yellow) and monomers (red) in controls, MCI and AD patients. p-values are indicated as uncorrected/corrected for multiple comparisons (n = 3) using Bonferroni. ADetails comparisons between MCI and AD patients. BIndicates comparisons between AD patients and controls.
Next, we wanted to assess whether the ratio of dimers to monomers in APOE ɛ3/ɛ3 were of relevance to disease status. Patients with AD exhibited lower ratios of plasma apoE dimers to monomers compared to healthy controls (average: 0.57±0.45 versus 1.17±0.48, p = 0.05). Furthermore, in the AD patients the ratios of both apoE homodimers and heterodimers to apoE monomers were lower compared to healthy controls (apoE homodimer/monomer average: 0.31±0.25 versus 0.59±0.22, p = 0.0441) and (apoE heterodimer/monomer median: 0.30 (0.02–0.57) versus 0.57 (0.11–1.38), p = 0.0395). However, the significant differences in the ratios of heterodimers/monomers did not survive correction for multiple comparisons (n = 3). The ratio of apoE homodimers to apoE heterodimers were not significantly different between the groups.
Considering that only monomeric apoE was found in the plasma of APOE ɛ4 homozygous subjects, we compared the levels of apoE monomers between APOE ɛ3/ɛ3 and APOE ɛ4/ɛ4 subjects. As expected, we observed that the levels of apoE monomers in APOE ɛ4/ɛ4 individuals were significantly higher than those observed in the APOE ɛ3/ɛ3 subjects (p < 0.0001). Upon separation of all the individuals based on the disease status, we noticed that the levels of apoE monomers in APOE ɛ4/ɛ4 MCI and AD patients were significantly higher (p < 0.0001 and p = 0.0045, respectively) compared to the APOE ɛ3/ɛ3 patients.
Lastly, we investigated whether the distribution of the plasma apoE monomers, homodimers and heterodimers as well as their ratios were gender dependent. Irrespective of their disease status, the APOE ɛ3/ɛ3 males exhibited a lower ratio of plasma apoE heterodimers/monomers compared to females (males (n = 15) median: 0.31 (0.08–0.8), females (n = 35) median: 0.57 (0.02–1.38), p = 0.04). Homozygous APOE ɛ3 males also showed a trend of higher levels of apoE monomers compared to females (males median: 52 (41–76), females median: 45.2 (32–93), p = 0.08).
Associations between plasma apoE3 monomers and dimers, CSF AD biomarkers and cognition
In order to evaluate whether the plasma apoE3 monomer and dimer distribution in APOE ɛ3 homozygous subjects may be relevant to surrogate markers of AD pathology (CSF AD biomarkers) and cognition, we performed correlation analysis. First, we evaluated the association between the different species of apoE in the same sample. Plasma apoE monomers were negatively correlated to the total amount of apoE dimers (all subjects: ρ= –1.000, p < 0.0001; controls: r = –1.000, p < 0.0001; MCI: r = –1.000, p < 0.0001; AD: r = –1.000, p < 0.0001), as well as to both apoE heterodimers (all subjects: r = –0.886, p < 0.0001; controls: r = –0.829, p < 0.0001; MCI: r = –0.903, p < 0.0001; AD: r = –0.947, p = 0.0148) and homodimers (all subjects: r = –0.689, p < 0.0001; controls: r = –0.580, p = 0.0006; MCI: r = –0.717, p = 0.0039; AD: r = –0.946, p = 0.0151) in all investigated groups. However, the occurrence of homodimers and heterodimers was weakly and positively related only when not stratifying the APOE ɛ3 subjects by diagnosis (r = 0.303, p = 0.03). Next, we assessed whether the frequency of apoE monomers and dimers was related to the total plasma apoE levels, as quantified by ELISA. In APOE ɛ3/ɛ3 subjects, regardless of diagnosis, we found that plasma apoE levels were negatively associated with the amount of apoE monomers and consequently positively associated with the amount of total apoE dimers including both homodimers and heterodimers (Table 2). In the same group, no significant correlations between plasma apoE monomers and dimers, cognitive status and CSF AD biomarker levels were noticed. Upon segregation of the study subjects into their diagnostic groups, we found a strong positive correlation between CSF Aβ40 levels and apoE monomers in the AD group and a strong negative association between CSF Aβ40 and apoE dimers (Table 2). Only in the control subjects a positive link between apoE homodimers and the ratio of CSF t-tau/Aβ42 was recorded, and a negative association between apoE homodimers and the total MMSE score (Table 2). Also in controls, the CSF p-tau/Aβ42 ratio was negatively associated with apoE monomers and positively associated with apoE total dimers and homodimers.
Correlation analysis of plasma apoE3 monomers and dimers with total plasma apoE, CSF AD marker levels and cognition
Number indicates coefficient of correlation. Pearson’s (r) correlation test or Spearman’s (ρ) rank coefficient were used. Significance is indicated as *p≤0.05, **p≤0.01, ***p≤0.001, –, not significant.
To take into account the relationship between the different apoE3 species, we further created ratios of apoE total dimers/monomers, homodimers/monomers, heterodimers/monomers and homodimers/heterodimers and assessed whether these were related to CSF AD biomarkers and cognition in the APOE ɛ3 subjects. Similar to the findings from the correlation analysis using the individual apoE monomer and dimer data and the combination of all included study subjects, total plasma apoE was significantly correlated to the various ratios (apoE dimers/monomers, apoE homodimers/monomers, apoE heterodimers/monomers) but not to the ratio between apoE homodimers/heterodimers (Table 3). Similar results were found in the AD but not the MCI group (Table 3). Only in the AD patients we documented negative correlations between the ratio of the apoE heterodimers over monomers and CSF Aβ40 levels (Table 3). Only controls exhibited significant links between the CSF Aβ42 levels, CSF t-tau/Aβ42, CSF p-tau/Aβ42 ratios, and the ratios of apoE dimers to monomers.
Correlation analysis between the distribution of plasma apoE3 dimers and monomers, CSF AD biomarkers and cognition
Numbers indicate correlation coefficients. Pearson’s (r) correlation test or Spearman’s (ρ) rank coefficient were used. *p≤0.05, **p≤0.01, ***p≤0.001. –, not significant.
Assessed correlations between plasma apoE3 monomers and dimers, plasma lipids, and homocysteine levels
To assess the relevance of alterations in the apoE3 distribution between monomers and dimers to the plasma lipid profile, we assessed associations between apoE3 monomers and dimers and levels of total cholesterol, LDL and HDL cholesterol and triglycerides. We found a positive association between the percentage of apoE3 monomers and triglycerides in the controls only (ρ= 0.538, p = 0.0018) which was paralleled by an inverse correlation with apoE dimers, specifically the apoE3 heterodimers (ρ= –0.512, p = 0.0032) and not the homodimers. Furthermore, again only in the controls, we observed a positive correlation between apoE3 heterodimers and HDL cholesterol (ρ= 0.385, p = 0.0327). We further explored whether plasma levels of homocysteine were related to apoE dimer formation, but, however, failed to find any significant associations between plasma homocysteine, apoE monomers and dimers (data not shown), although we could document a near-significant relationship between plasma homocysteine and apoE3 homodimers in the MCI patients (r = –0.511, p = 0.0744).
DISCUSSION
To identify an APOE-related phenotypical trait that could aid the prediction of AD is highly desirable. Such a trait would also aid the understanding of the functional aspects of apoE that may relate to AD and its pathogenesis. As mentioned, low plasma levels of apoE per se, as those seen in APOE ɛ4-carriers [12], appear to be linked to an increased risk of AD [13, 33]; however, a causal relationship is lacking since also non-APOE ɛ4 individuals are afflicted by AD. A major difference between the apoE3 and apoE4 isoforms is the presence of the cysteine residue at position 112 [34], which enables the apoE3 isoform to not only exist as a monomer but also allows dimerization, either with itself [24] or with apoA-II [35]. To the best of our knowledge, the relevance of these species to AD prior to our study has not been investigated.
For our purposes, we first assessed and compared plasma apoE levels in homozygous APOE ɛ3 and ɛ4 individuals from a previously well-characterized cohort [27–29] and analyzed potential associations with clinical diagnosis, gender, age, and CSF AD biomarkers. Furthermore, we investigated whether the apoE homodimers and heterodimers exclusively detected in APOE ɛ3/ɛ3 individuals exhibited any association with clinical diagnoses, CSF AD biomarkers, cognition, the plasma lipid profile and plasma homocysteine levels.
Previous studies have yielded inconsistent results regarding plasma apoE levels and a relationship to both AD and APOE genotype. Some studies have shown decreased levels of CSF [36–38] and plasma apoE [13, 40], while others have documented higher levels of total apoE in both plasma [41] and CSF [42, 43] from AD patients. We previously reported no differences between controls and AD cases in regard to both plasma and CSF total apoE levels [12]. In the current study we found slightly higher plasma total apoE in controls compared to patients with AD or MCI. This difference, however, was mainly due to the over-representation of cases with an APOE ɛ4/ɛ4 genotype among the patients, since in line with previous studies we found that plasma levels of apoE were significantly lower in APOE ɛ4-carriers versus non-carriers [12, 45]. If looking at total plasma apoE in the entire cohort, our results suggest that higher plasma apoE levels are associated with better cognition (higher MMSE scores) and a beneficial influence on CSF AD markers where higher plasma apoE levels were related to higher CSF Aβ42 and lower CSF tau-levels. Higher plasma apoE levels per se may therefore be beneficial. Whether higher levels of plasma apoE4 also may be beneficial is, however, questionable. Given our previous findings proposing that a higher relative ratio of plasma apoE4 to apoE3 levels in cognitively unimpaired APOE ɛ3/ɛ4 subjects was related to lower glucose metabolism in the hippocampus and gray matter volume reductions in several brain areas relevant to AD, the apoE4 may have gained a toxic function rather than lost a protective function, as discussed previously [11].
In the present study, we have further documented a slight difference in apoE plasma levels between males and females where females exhibited slightly lower apoE plasma levels if they were ɛ4-carriers but higher plasma apoE levels if they were ɛ3-carriers, compared to the male subjects. Hence, gender-dependent differences may be affected by the APOE genotype, and lower plasma apoE levels in female APOE ɛ4 homozygotes may additionally aggravate the inherent risk of AD which has been shown to be higher in females [46]. Furthermore, early studies [47, 48] as well as a recent meta-analysis [49] reported that female APOE ɛ4-carriers are at higher risk of AD compared to APOE ɛ4 carrying males. Importantly, contrary to our current findings, our previous study describing the plasma apoE3 and apoE4 levels in healthy APOE ɛ3/ɛ4-carriers showed slightly higher plasma apoE4 levels in females [15], and we therefore speculate that APOE heterozygosity may affect the plasma apoE levels of apoE4 and thereby possibly also the risk of AD.
Whether altered apoE levels specifically have a functional consequence is not clear since the distribution of functional apoE within samples with the same concentrations may differ. For instance, it is known that apoE in plasma from APOE ɛ4-negative individuals exists as monomers, homodimers and heterodimers with apoA-II [24]. Apolipoprotein E dimer formation was earlier demonstrated to be of importance for its lipid-carrying role and monomeric apoE2 and apoE3 preferentially bind to HDL [34]. Interestingly, using plasma from type III hyperlipoproteinemic and healthy individuals, Weisgraber and Mahley demonstrated that the apoE-apoA-II complex was present specifically in the HDL subclass HDL-I and that the composition of this subclass was different from other HDL subclasses [35]. Importantly, it was further suggested that the majority of the HDL binding affinity to the LDLRs was attributed to the apoE-apoA-II complex-containing HDL-I subclass whereas the other HDL subclasses HDL-II and HDL-III (which did not contain the apoE-apoA-II complex) exhibited limited or no binding affinity to LDLRs. The authors further showed that the affinity of the HDL-I particle to LDLRs was directly proportional to the content of apoE in these particles [50]. Specifically in APOEɛ3/ɛ3-carriers, Weisgraber and Shinto described the presence of the apoE-apoA-II heterodimers and apoE3 homodimers which together constituted approximately 55% of the plasma apoE3 levels. Both dimers were found to associate with HDL particles and both were found to inefficiently compete with monomeric apoE3 for LDLRs. The authors speculated that dimerization of apoE may be a rate-limiting process affecting the metabolic events associated with the LDLR [24]. In agreement with previous studies of samples from APOE targeted replacement mice [51, 52] and humans [24–26], we confirmed that plasma apoE in APOE ɛ3/ɛ3 individuals, regardless of the disease status, exists as disulfide-linked homodimers as well as heterodimers with apoA-II. Importantly, our study for the first time shows that AD patients with an APOE ɛ3/ɛ3 genotype exhibited higher levels of monomeric apoE3 paralleled by lower levels of apoE3 homodimers, compared to healthy controls of the same genotype. We measured levels of triglycerides, total cholesterol, HDL and LDL in plasma from individuals of APOE ɛ3/ɛ3 genotype but could not find any significant difference between diagnostic groups. Further, exclusively in the controls, apoE3 heterodimers but not homodimers were significantly related to plasma triglyceride and HDL levels, whereas apoE3 monomers in the same group were linked to triglyceride levels in the opposite direction compared to the apoE3 heterodimers. Hence, our results indicate that in the absence of disease the apoE3 dimerization with apoA-II may have a greater association with the plasma lipid profile (triglycerides and HDL) than the apoE3 homodimers. These associations may be beneficial and may be lost during the course of MCI and AD. The cause of the observed reduced plasma apoE homodimers in the investigated APOE ɛ3 homozygous AD patients we do not know. Interestingly, it was previously shown that homocysteine interferes with apoE3 dimer formation resulting in impaired apoE3 function and reduced apoE3-mediated generation of HDL [53]. Hyperhomocysteinemia per se has been proposed to increase the risk of AD [54] and patients with hyperhomocysteinemia were found to exhibit reduced apoE dimers in the CSF [53]. In the current study, higher plasma levels of homocysteine were observed in APOE ɛ4/ɛ4 individuals compared to APOE ɛ3/ɛ3 subjects; however, APOE ɛ3/ɛ3 individuals of different diagnostic groups had similar levels of plasma homocysteine. Hence, the observed difference in the apoE monomer and dimer profile between controls and AD patients with an APOE ɛ3/ɛ3 genotype cannot be explained by alterations in plasma homocysteine levels.
Our study furthermore found that AD patients exhibited a trend toward lower levels of apoE-apoA-II heterodimers compared to controls. Not many studies have assessed the connection between apoA-II and neurodegeneration; however, it was shown that sporadic AD-patients [55], and patients with neurological diseases [56] exhibited lower levels of serum apoA-II compared to healthy controls. Based on our observations and previously published findings, we speculate that an apoE monomer/dimer profile of increased apoE monomers and reduced dimers results in altered LDLR affinity and LDLR-mediated metabolic events in AD patients. Indeed, neuroprotective effects attributed to apoE3 were proposed to be mediated by apoE3 dimer formation. The apoE dimers were previously identified in both the cortex and hippocampus of the human brain [26] where they may be of importance to ABCA1-dependent neuronal lipid efflux [57] and binding to Aβ42 resulting in inhibited internalization by neurons [58, 59]. The relevance of plasma apoE monomer/dimer profiles is yet to be properly elucidated but our results from a limited number of control subjects, MCI and AD patients provide a first indication that the apoE3 monomer/dimer profile is altered in AD compared to controls. We conclude that, as expected, apoE homodimers and heterodimers exist in plasma from APOE ɛ3/ɛ3 but not APOE ɛ4/ɛ4-carriers and that the composition of monomeric and dimeric apoE3 differs in the plasma of control subjects and AD patients. The relevance of our findings to the pathophysiology of AD needs to be further explored in larger patient cohorts.