
Abstract
Background:
Clinical-pathological Alzheimer’s disease (AD) subtypes may help distill heterogeneity in patient presentation. To date, no studies have utilized neuropsychological and biological markers to identify preclinical subtypes with longitudinal stability.
Objective:
The objective of this study was to empirically derive AD endophenotypes using a combination of cognitive and biological markers.
Methods:
Hierarchical cluster analysis grouped dementia-free older adults using memory, executive and language abilities, and cerebrospinal fluid amyloid-β and phosphorylated tau. Brain volume differences, neuropsychological trajectory, and progression to dementia were compared, controlling for age, gender, education, and apolipoprotein E4 (ApoE4).
Results:
Subgroups included asymptomatic-normal (n = 653) with unimpaired cognition and subthreshold biomarkers, typical AD (TAD; n = 191) showing marked memory decline, high ApoE4 rates and abnormal biomarkers, and atypical AD (AAD; n = 132) with widespread cognitive decline, intermediate biomarker levels, older age, less education and more white matter lesions. Cognitive profiles showed longitudinal stability with corresponding patterns of cortical atrophy, despite nearly identical rates of progression to AD dementia.
Conclusion:
Two clinical-pathological AD subtypes are identified with potential implications for preventative efforts.
INTRODUCTION
Pathophysiological changes typical of Alzheimer’s disease (AD) are thought to precede clinical symptoms [1]. Realistically, both clinical manifestation and biomarker presentation of AD vary considerably during the prodromal phase [2–4]. Furthermore, mixed neuropathology accounts for most dementia cases and can have summative or interactive effects altering clinical presentation [5, 6]. Several notable atypical AD variants illustrating this variability are described, including frontal, posterior cortical, and logopenic aphasia [7–9]. Such heterogeneity contributes to diagnostic errors, inaccurate prognosis, and undesirable treatment outcomes [10–12].
Investigating clinical-pathological subtypes may generate insight into how disease-modifying factors interface with pathophysiology [5]. Clinical symptomology and AD pathogenesis may depend on genetic (e.g., ApoE4 carrier status), environmental (e.g., socioeconomic status, culture), and neuropsychological factors (e.g., cognitive reserve) [13, 14]. Therefore, separation of syndromal and etiological features may obscure key modifying factors.
The present study sought to identify AD endophenotypes using cluster analysis, a machine learning technique that categorizes individuals using a set of characteristics. Similar work has yielded a classic AD subtype with amnesia, AD biomarker abnormality, high ApoE4 rate, and disproportionate medial temporal atrophy [2–4, 16]. Atypical subtypes have demonstrable clinical heterogeneity, diffuse cortical atrophy, and less salient CSF biomarker signature [2, 18]. Whether subtypes represent true variants or advanced disease severity remains unclear. We hypothesized that combined clinical and pathological markers would form subtypes with longitudinal stability and equifinality regarding clinical progression [3, 19]. This approach may assist clinicians who evaluate both clinical and biological data when drawing diagnostic and prognostic conclusions.
METHOD
Subjects
Participants included 367 cognitively normal (CN) and 609 mild cognitive impairment (MCI) subjects participating in the Alzheimer’s Disease Neuroimaging Initiative (ADNI). ADNI, a longitudinal study with sites across the United States, was designed to track AD using clinical and cognitive tests, magnetic resonance imaging (MRI), positron emission tomography (PET), cerebrospinal fluid (CSF), and blood biomarkers. The study was approved per site by local Institutional Review Boards (IRB). Written informed consent was obtained for all participants.
The ADNI cohort has been previously described [20]. AD diagnosis was based on the National Institute of Neurological and Communicative Disorders and Stroke and the AD and Related Disorders Association (NINCDS-ADRDA) criteria [21–23]. Subjects with other neurological disorders, psychiatric history, recent alcohol or substance dependence, less than 6 years of education, or without fluency in English or Spanish, were excluded. The full list of inclusion/exclusion criteria is available online (http://www.adni-info.org/Scientists/ADNIScientistsHome.aspx). Data were available at the Laboratory of NeuroImaging (LONI) ADNI repository (https://ida.loni.usc.edu).
Neuropsychological testing
Subjects completed annual neuropsychological testing. The American National Adult Reading Test (ANART) estimated premorbid verbal IQ. Consistent with prior studies, six neuropsychological scores were selected from three cognitive domains [Executive Function: Trail Making Test (TMT) A and B; Memory: Rey’s Auditory Verbal Learning Test (RAVLT) free recall and recognition trials; Language: Category Fluency and Boston Naming Test 30-item (BNT)] for neuropsychological profiles [10]. Follow-up comparisons used Z-scores normed by age, sex, and education [(TMT A&B, Category Fluency, BNT, Mini-Mental State Examination (MMSE)] and age-normed Z-scores (RAVLT).
Cerebrospinal fluid biomarkers
Subjects participated in biennial lumbar punctures for CSF collection. Aliquots of ADNI GO plus ADNI 2 CSF samples were analyzed using the xMAP Luminex platform and Innogenetics/Fujirebio AlzBio3 immunoassay kits. Baseline CSF markers were examined using cutoff values reported by Shaw and colleagues for the ADNI sample [24]. Biomarker values for Aβ and p-tau were separately coded “positive” or “negative” for AD-type profile. An alternative CSF immunoassay, Elecsys®, was used in follow-up analyses to confirm the identified AD subtypes [25, 26].
Genotyping
ADNI 1 participants were genotyped according to the Illumina Human610-Quad BeadChip (Illumina, Inc., San Diego, CA) protocol, and ADNI-2/GO participants according to the Illumina HumanOmni Express BeadChip (Illumina, Inc., San Diego, CA) protocol. ApoE genotyping was performed on DNA samples obtained from subjects’ blood as described in http://www.adni-info.org/Scientists/Pdfs/ADNI_GeneralProceduresManual.pdf. ApoE is a polymorphic gene with the following isoforms: ApoE2 (ɛ2 allele), ApoE3 (ɛ3 allele), and ApoE4 (ɛ4 allele). In our analyses that included ApoE status, we coded ApoE genotype as 0 or 1, with 1 indicating the presence of one or more ApoE ɛ4 alleles.
Magnetic resonance imaging
Baseline MRI scans for a subset of subjects with scans passing ADNI quality control measures (n = 536; asymptomatic n = 367, typical n = 89, atypical n = 64) were analyzed using voxel-based morphometry (VBM) conducted in SPM12 (Wellcome Department of Cognitive Neurology, London, UK; http://www.fil.ion.ucl.ac.uk/spm/software/spm12) [27].
Whole-brain-analysis was conducted to examine group differences. T1-weighted images were segmented into gray and white matter tissue classes using SPM12’s unified segmentation procedure, spatially normalized to a template image, and smoothed with an 8 mm full-width at half-maximum (FWHM) isotropic Gaussian kernel. Normalized voxel size was 1.5 mm. All clusters and peak voxels of gray matter T-statistic brain maps were thresholded at p < 0.05, using family wise error (FWE) correction. We used absolute threshold masking to exclude voxels with gray matter probabilities of less than 0.1. Total intracranial volume (TIV) was computed by summing the segmented gray matter, white matter, and CSF for each individual. One-way analysis of variance (ANOVA) was used to compare groups, controlling for age, sex, and TIV.
White matter hyperintensity volumes (WMH) were derived by the Department of Neurology and Center for Neuroscience at the University of California, Davis. In ADNI 2/GO, WMH were quantified using an updated four-tissue segmentation pipeline (http://adni.loni.usc.edu). Baseline data were available for 559 ADNIGO/2 subjects. Log-transformation was applied to correct for kurtosis in the distribution of the WMH volumes.
Statistical analyses
We applied hierarchical cluster analysis with Ward’s method using cognitive and biomarker variables to classify dementia-free subjects. We chose this approach based on prior machine learning studies which revealed high rates of false positive diagnosis in the ADNI sample [10]. Z-scores were calculated from means and standard deviations of the whole sample prior to analyses. Discriminant function analyses (DFA) selected the optimal number of clusters and quantitatively assessed the ability of selected cognitive and biomarker measures to correctly predict cluster membership.
Chi-square analyses, logistic regression, and ANOVA were used to examine group demographics. Analysis of covariance (ANCOVA) with least significant difference (LSD) post-hoc analysis compared groups on cognitive performance, biomarker status, and disease risk factors. General linear mixed models (GLMM) with unstructured covariance matrix and maximum likelihood estimation were used for longitudinal examination of group membership as a predictor. Group × time, age, sex, education, and ApoE4 carrier status were included in the model as fixed factors. Intercept and time were entered as random effects. The model included three time points (Baseline, Month 12, and Month 24 visit), coded as 0, 1, and 2. LSD post-hoc analysis was used to conduct pairwise comparisons. Cox regression was used to examine rate of progression to AD. Age, gender, education, and ApoE4 status were included as covariates. Analyses were two-tailed with α set at p < 0.05. False discovery rate (FDR) was controlled using the Benjamini-Hochberg procedure to address type I error due to multiple comparisons. Results were assessed when FDR was controlled at both 0.05 and 0.10 [28]. Analyses were performed with SPSS for Windows OS version 20.0.0 (SPSS, 263 Armonk, NY: IBM Corp).
RESULTS
Hierarchical cluster analysis
We identified three distinct subtypes. One, labeled asymptomatic-normal (n = 653; 66.9% of sample), was characterized by normal neuropsychological performance and biomarker levels subthreshold for abnormality. Another group, labeled typical AD (n = 191; 19.6% of sample), had substantial memory impairment, relatively preserved executive and language abilities, and elevated biomarker signature consistent with AD. The third group, identified as atypical AD (n = 132; 13.5% of sample), displayed relatively preserved memory ability in the presence of impaired executive function and language domains, and a biomarker signature falling between the asymptomatic-normal and the typical AD groups. Figures 1 and 2 summarize the AD profiles.
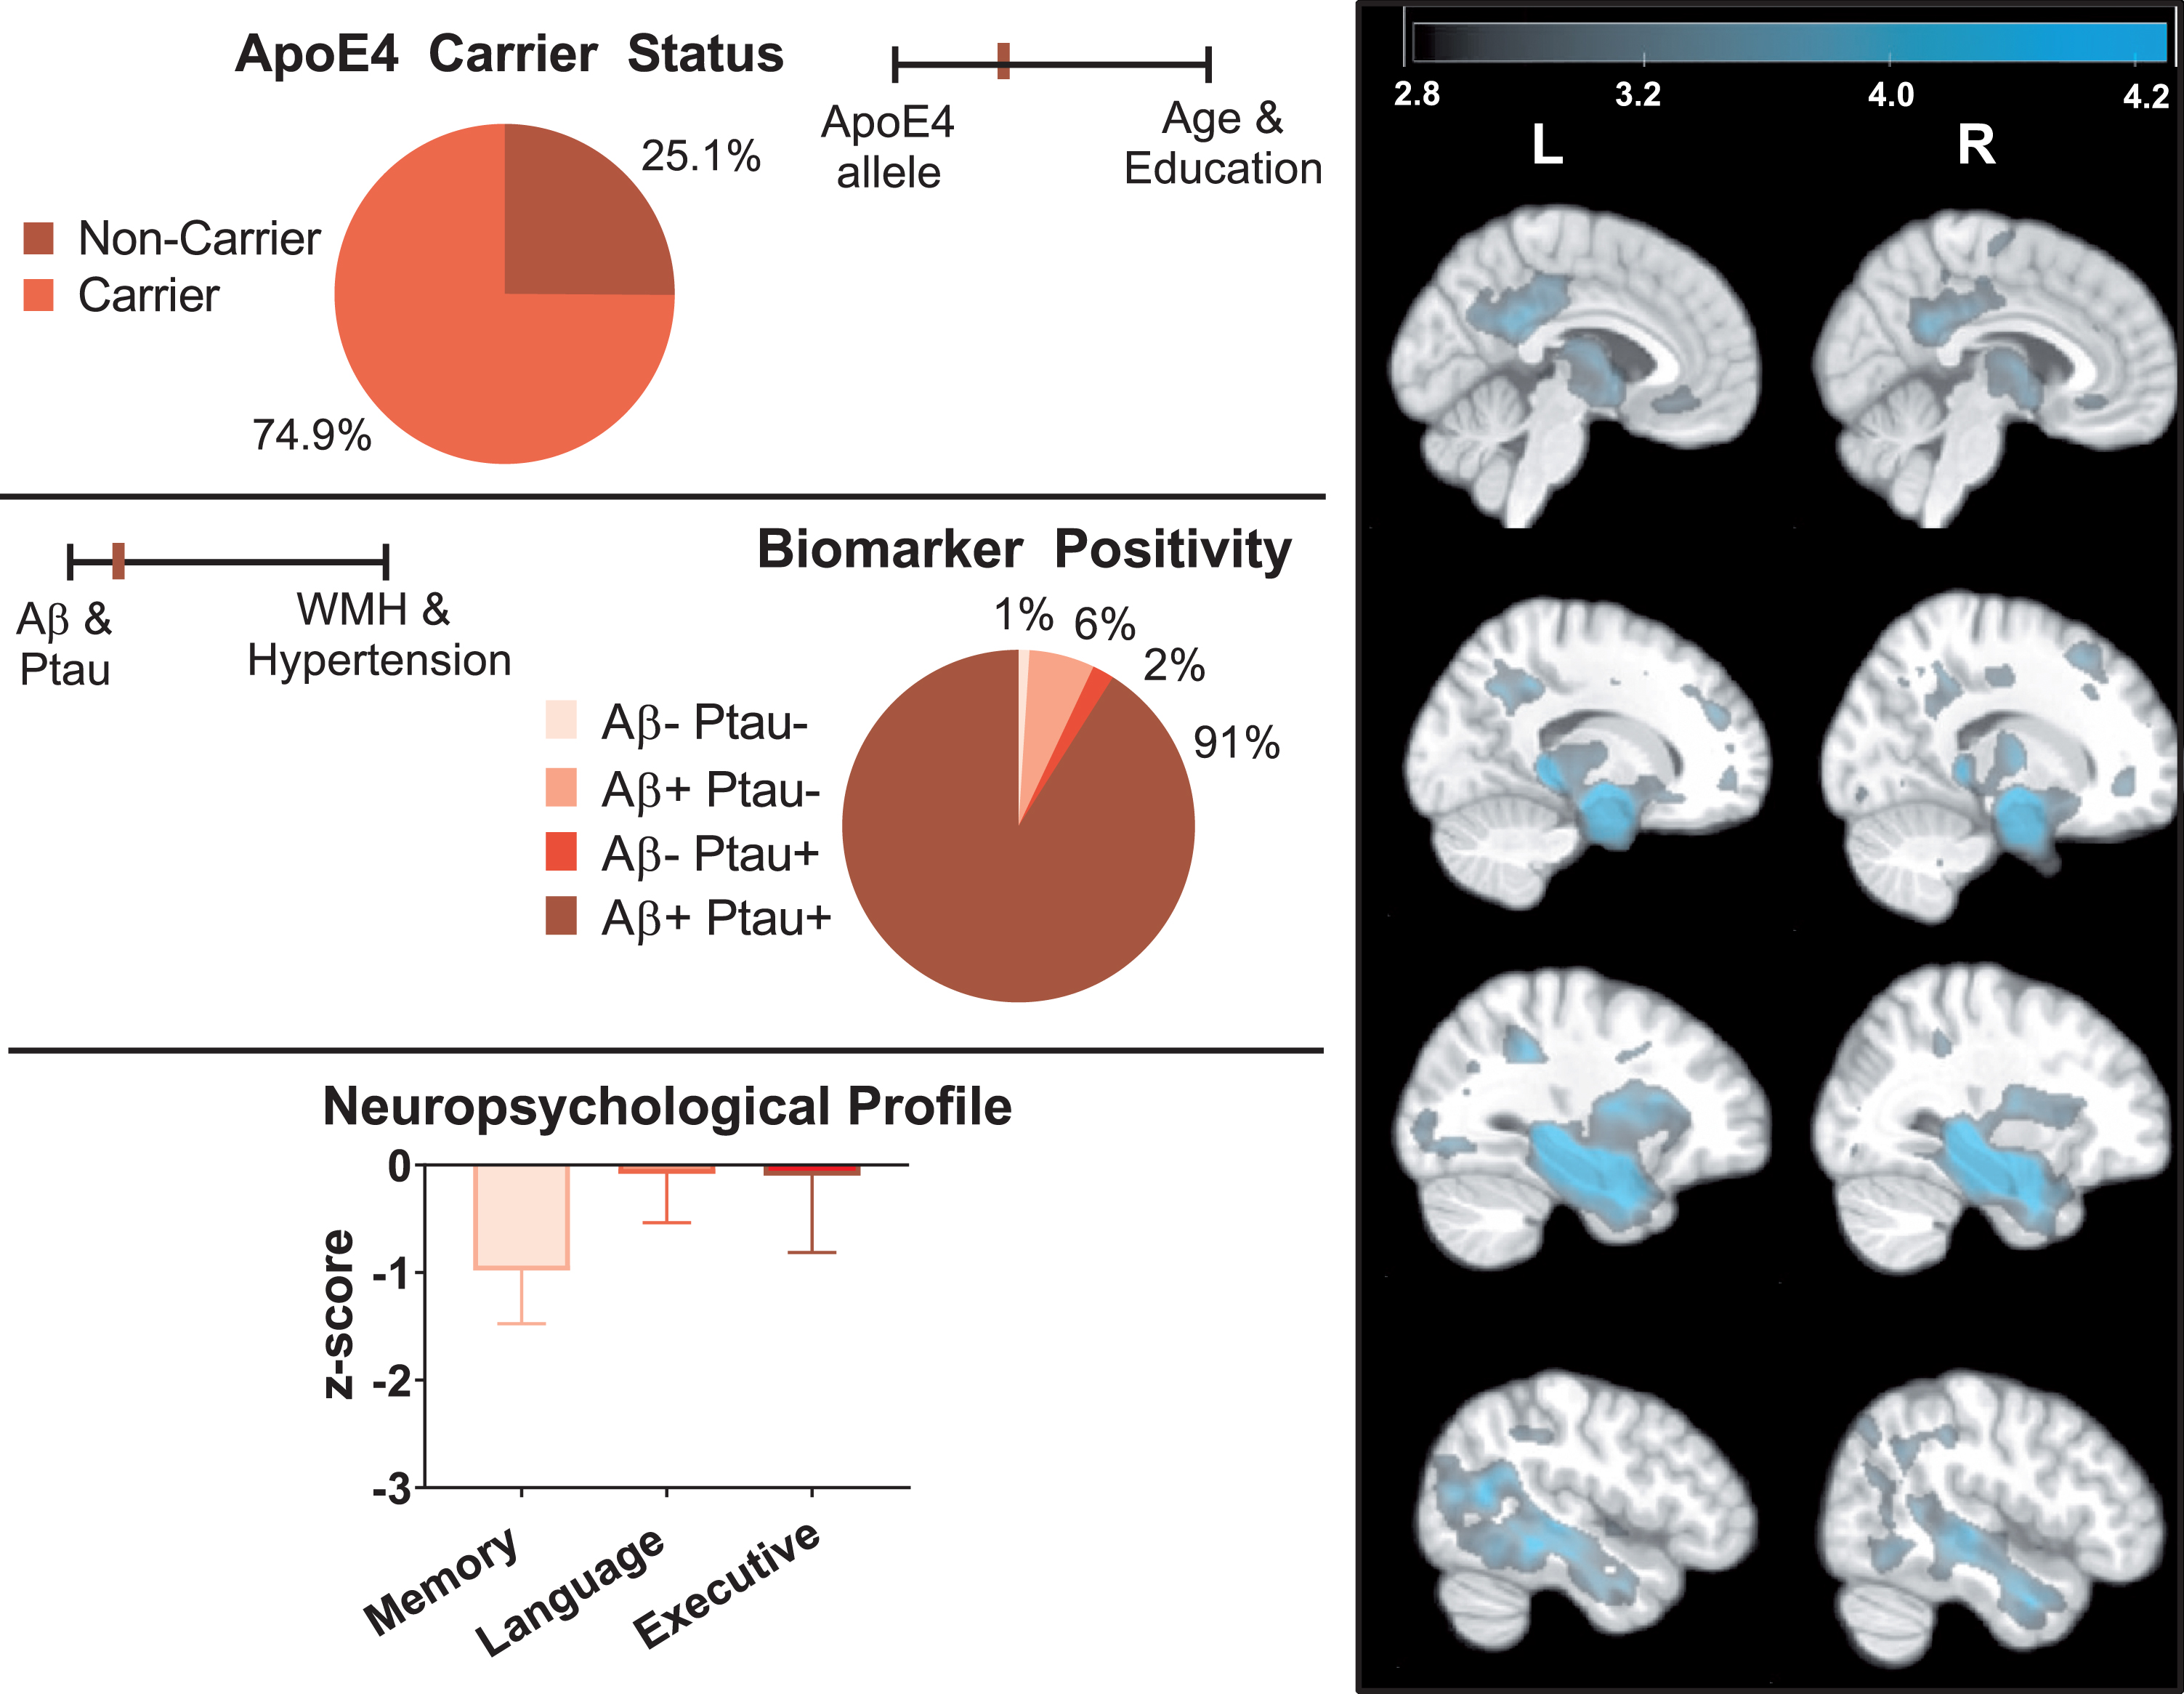
Profile of typical AD. The right panel depicts areas where typical AD exhibited smaller brain regions compared to asymptomatic-normal individuals (cluster level pFWE < 0.05). The color bar represents T-score values. T-maps display results from ANCOVA with age, gender, and TIV included as covariates. The left panel depicts key AD-related genetic, biomarker, and neuropsychological data for the typical AD group.
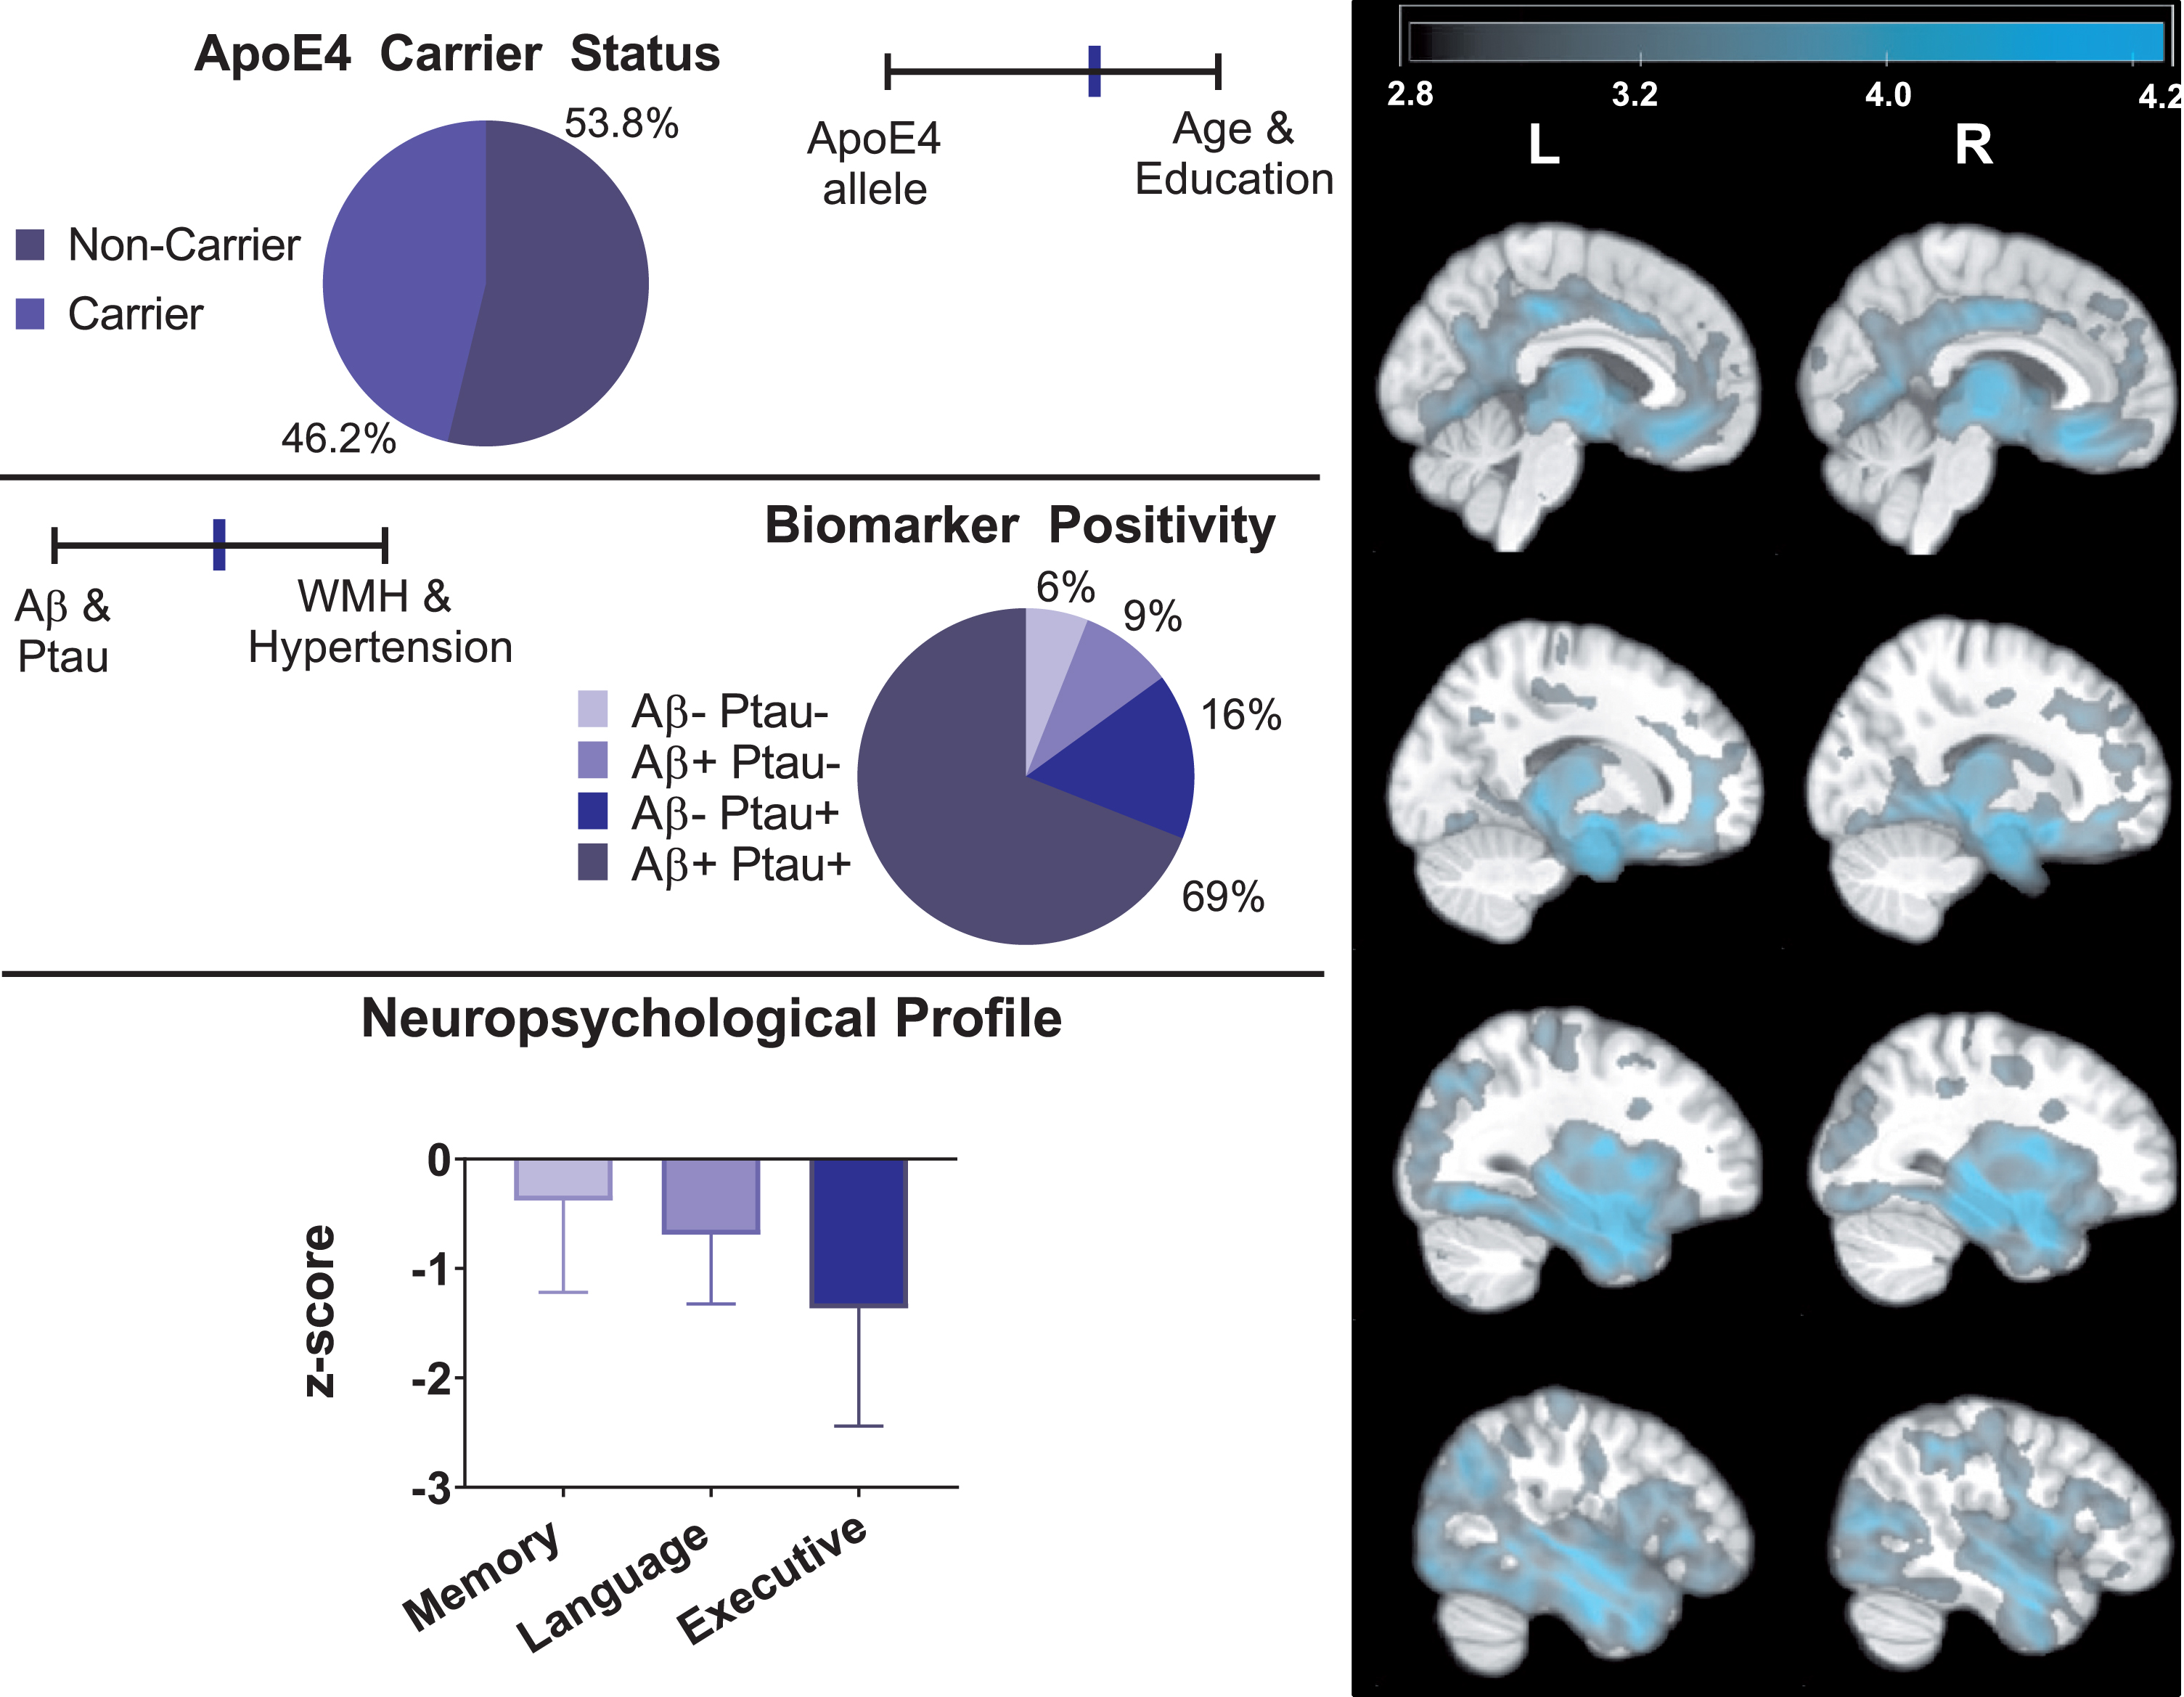
Profile of atypical AD. The right panel depicts areas where atypical AD exhibited smaller brain regions compared to asymptomatic-normal individuals (cluster level pFWE < 0.05). The color bar represents T-score values. T-maps display results from ANCOVA with age, gender, and TIV included as covariates. The left panel depicts key AD-related genetic, biomarker, and neuropsychological data for the atypical AD group.
Validity of cluster-derived AD subtypes
Means and standard deviations for baseline measures are in Table 1 (please see Supplementary Table 1 for comparisons for the subset of subjects included in MRI analyses). Observed raw score cognitive differences between all groups were replicated when compared on age and education adjusted scores. Two discriminant functions were obtained accounting for 69.2% and 30.8% of variance among the three subgroups. The selected measures correctly classified 89.2% of original grouped cases. A leave-one-out cross-validation technique was used, after which the percentage of correctly classified cases was 88.9%.
Summarized mean (standard deviation) raw baseline neuropsychological and biomarker values
As expected, each pairwise comparison between groups (e.g., atypical AD versus typical AD, asymptomatic-normal versus typical AD, asymptomatic-normal versus atypical AD) was statistically significant with p < 0.001 for each comparison. RAVLT, Rey Auditory Verbal Learning Test; CSF, cerebrospinal fluid; AAD, atypical AD; TAD, typical AD; AN, asymptomatic-normal.
Subtype demographics and risk factors
Subject demographics are in Table 2. Apart from systolic blood pressure, all comparisons remained significant with FDR limited to 0.05. With FDR limited to 0.1, asymptomatic-normal individuals exhibited lower systolic blood pressure than atypical AD (
Demographic comparisons
Data are summarized as either Mean (Standard Deviation) or percentage as indicated. Significant differences (p < 0.05) among groups are indicated in bold. AAD, atypical AD; TAD, typical AD; AN, asymptomatic-normal; BMI, body mass index; BP, blood pressure; WML, white matter lesion; ApoE4, apolipoprotein E4 allele. White matter lesion values were log-transformed for analyses.
The groups differed in level of educational attainment (F(2,974) = 6.43, p = 0.002,
Groups differed in baseline diagnosis (χ2[1] = 132.60, p < 0.001), with typical AD more likely to be diagnosed with MCI (90.6%), compared to asymptomatic-normal (49.9%, χ2[1] = 2.61 p < 0.001) and atypical AD (83.3%, χ2[1] = 0.097 p = 0.039). After entering covariates, asymptomatic-normal individuals were still less likely diagnosed with MCI (b = –2.19, Wald χ2[1] = 64.94, p = 0.001), but no difference remained between atypical and typical AD (b = –0.451, Wald χ2[1] = 1.69, p = 0.195).
Groups differed in proportion of ApoE4 carriers (typical AD > atypical AD > asymptomatic-normal: typical versus atypical χ2[1] = 27.55, p < 0.001; asymptomatic-normal versus atypical χ2[1] = 11.68, p = 0.001; asymptomatic-normal versus typical χ2[1] = 118.62, p < 0.001), and all three comparisons remained significant (with p < 0.001) after entering covariates. Asymptomatic-normal individuals had 30.8% carriers, typical AD had 74.9% carriers, and atypical AD had 46.2% carriers
Atypical AD exhibited greater white matter lesion burden than asymptomatic-normal individuals (F(2, 558) = 4.74, p = 0.009,
Subtype stability over time
Subtype stability was determined through analysis of group differences over two years of follow-up. At both follow-up visits, we observed maintenance of distinct neuropsychological profiles among empirically-derived AD groups. Atypical AD performed worse in language and executive functioning than both typical AD (language: p < 0.001; executive functioning: p < 0.001) and asymptomatic-normal (language: p < 0.001; executive functioning: p < 0.001). Atypical AD also performed worse than asymptomatic-normal individuals in memory (p < 0.001). Notably, typical AD performed worse on memory than both atypical AD and asymptomatic-normal groups (p < 0.001) and performed worse in language and executive functioning than asymptomatic-normal individuals (language: p < 0.001; executive functioning: p < 0.001).
Subtype comparisons on biomarker status
Groups differed in biomarker status (Aβ: F(2, 974) = 102.01, p < 0.001,
Consistent with differences in continuous markers, typical AD included more CSF Aβ and p-tau positive individuals (Aβ: 97.9%; p-tau: 93.2%) than atypical AD (Aβ: 77.9%; p-tau: 84.8%) (Aβ: χ2[1] = 33.94 p < 0.001; p-tau: χ2[1] = 5.93 p < 0.013) and asymptomatic-normal individuals (Aβ: 40.2%; p-tau: 68.9%) (Aβ: χ2[1] = 197.26 p < 0.001; p-tau: χ2[1] = 45.75 p < 0.001). Atypical AD had more individuals positive for both biomarkers than the asymptomatic-normal group (χ2[1] = 55.77, p < 0.001). Most (91.6%) of typical AD were positive for both biomarkers, in contrast to significantly lower rates in atypical AD (68.7%) (χ2[1] = 29.11, p < 0.001) and asymptomatic-normal individuals (33.5%) (χ2[1] = 201.43, p < 0.001). While less than 1% of individuals in the typical AD group were negative for both biomarkers, approximately 6% of atypical AD were negative for both biomarkers.
Clinical outcomes
Cox regression revealed greater risk of progression to AD dementia diagnosis for typical AD compared to asymptomatic-normal individuals (p < 0.001), but no difference between typical and atypical AD (p = 0.730). Typical AD was at 4.398 times greater risk of progressing to AD dementia than asymptomatic-normal, and atypical AD was at 4.120 times greater risk (p < 0.001) (Fig. 3). Using conventional clinical criteria for MCI, 17.9% of atypical AD subjects were identified as normal at month 24, compared to 7.1% of typical AD, and 50.9% of asymptomatic-normal individuals (atypical versus typical: χ2[1] = 7.01 p = 0.008; atypical versus asymptomatic-normal χ2[1] = 35.58 p < 0.001; typical versus asymptomatic-normal χ2[1] = 96.99 p < 0.001).

Cox’s regression evaluating progression to AD dementia for each group over multiple time points (measured in months). Compared to atypical and typical AD, the asymptomatic-normal group had significantly less risk of developing AD over more than 5 years. The two AD groups did not differ from one another in risk of progressing to AD diagnosis.
On the CDR, asymptomatic-normal subjects scored better than both typical and atypical AD, (Mean Difference±SE = –1.62±0.01, t(2, 1012.0) = –16.3, p < 0.001) but the AD groups did not differ (Mean Difference±SE = –0.16±0.13, t(2, 981.5) = –1.20, p = 0.230). Atypical AD had more preserved functioning on the FAQ than typical AD (Mean Difference±SE = –1.21±0.47, t(2, 990.4) = –2.58, p = 0.010), and asymptomatic-normal individuals scored better than both AD groups (p < 0.001). Differences between groups on CDR and FAQ measures remained significant with FDR limited to 0.05.
Brain atrophy
Consistent with classical patterns of cerebral atrophy in AD, VBM analysis revealed greater bilateral atrophy in the medial temporal lobe, left precuneus, left angular gyrus, right inferior and superior temporal gyri, for typical AD relative to asymptomatic-normal individuals (p uncorrected < 0.001; p FWE < 0.05). In contrast, atypical AD showed diffuse atrophy extending to limbic, frontal, occipital, and temporal regions compared to both typical AD (p uncorrected < 0.001; p FWE < 0.05) and asymptomatic-normal groups (p uncorrected < 0.001; p FWE < 0.05). Specifically, atypical AD showed greater atrophy than typical AD in the bilateral middle cingulate gyrus, bilateral supplementary motor cortex, left pars opercularis, left prefrontal gyrus, left precentral gyrus, and right occipital gyrus (p uncorrected <0.001; p FWE < 0.05) (Fig. 4). Relative to asymptomatic-normal individuals, atypical AD exhibited greater bilateral atrophy in the amygdala, cingulate gyrus, supramarginal gyrus, and bilateral frontal and posterior regions (e.g., right medial orbital gyrus, occipital fusiform gyrus; left middle frontal gyrus, pars opercularis, postcentral gyrus, angular gyrus, precuneus, middle occipital). Supplementary Tables 2–4 portray significant clusters resulting from VBM analyses with corresponding anatomical regions and FWE corrected p-values for both cluster and peak-level analyses.

VBM t-maps exhibit brain regions where atypical AD exhibited smaller brain volume than typical AD (cluster level pFWE < 0.05). The color bar represents T-score values.
DISCUSSION
Three distinct clinical-pathological subgroups were identifiable by combined neuropsychological and biomarker signatures. Asymptomatic-normal individuals, at the least risk of developing AD, displayed subthreshold biomarker signature, and relatively preserved brain volume and cognitive functioning. Typical AD exhibited AD-consistent biomarker abnormalities, localized medial temporal atrophy, and memory impairment with relatively preserved language and executive functioning. Atypical AD, a substantial portion of our sample (40.9% of AD-risk participants), exhibited disproportionate executive function and language impairment with relatively spared memory function, diffuse brain atrophy pattern, and intermediate biomarker elevation. CSF levels of Aβ and tau may be less salient biomarkers for this group.
The identified subgroups partly corresponded with previously described neuropsychological phenotypes [10]. However, prior studies noted atypical (i.e., “dysexecutive” or “mixed”) groups with commensurate levels of memory impairment and AD biomarker abnormality, and higher rate of AD progression, raising the possibility of “atypical” groups representing advanced disease progression rather than differing typologies [3]. In this study, AD subtypes exhibited longitudinal stability of neuropsychological profile despite equivalent rates of progression and global impairment levels. Therefore, identified groups likely represent distinct subtypes rather than different stages of disease.
Further underscoring the typology versus disease stage hypothesis, the present AD subtypes displayed double-dissociations of both neuropsychological and biomarker profiles. Atypical AD displayed greater executive and language impairment than typical AD, despite less pronounced biomarker abnormality and relative preservation of memory ability. Although atypical AD presentations have been previously published, the prevalence of these variants is estimated to be low. Snowden et al. reported that 5% of 523 patients with AD presented with posterior cortical atrophy, Johnson et al. describe a frontal variant of AD occurring in 3 out of 63 patients with AD, and logopenic aphasia has been similarly reported in small numbers of AD patients [7, 29]. In contrast, the atypical AD group presented here formed a substantial minority, approximately 41%, of individuals at-risk of AD diagnosis. There are also other inconsistencies between previously published subtypes and the atypical group defined here, such as age of onset. While phenotypic variants have been tied to earlier onset of disease and faster rate of decline, in this sample the group with atypical presentation tended to be somewhat older and did not significantly differ in rate of AD diagnosis [30]. There may be a much larger role for atypical presentations of AD requiring far greater elaboration. To underscore this point, a recent study of over 1,000 autopsy brains from older adults observed 230 different combinations of neuropathologies commonly seen in aging [31]. These findings indicate that heterogeneity in AD may be grossly undervalued and is thus deserving of much attention in future research.
Atypical AD was the oldest group. However, age was included as a covariate in all models, and cannot fully explain group differences. Nevertheless, advancing age is linked to atypical neuropsychological and brain atrophy profiles, and challenging diagnoses [32, 33]. Compared to asymptomatic-normal individuals, atypical AD showed greater white matter lesion burden and higher systolic blood pressure, signifying contribution of comorbidity with age-related vascular disease to differential biomarker, neuropsychological and brain atrophy patterns [34]. Evidence suggests soluble Aβ interacts with age-related vascular changes (e.g., cerebral blood flow), contributing to AD pathogenesis and neuronal dysfunction, before observable Aβ aggregates begin to form [35]. Structural differences in Aβ fibrils, which are formed by accumulated soluble Aβ, also exist between AD phenotypes. Different Aβ fibrils exhibit differential neurotoxicity, demonstrating how the interaction between pathology and non-pathologic factors is crucial to understanding disease-related brain changes. Furthermore, a small portion (∼6%) of individuals in the atypical AD group were negative for both AD biomarkers, in contrast to 1% of typical AD. Recently the contribution of non-AD pathologies to cognitive impairment has been called into attention, and biomarkers of neurovascular dysfunction may be more relevant to the atypical AD individuals [36, 37].
Atypical AD also had lower premorbid educational and intellectual attainment, both proposed markers of cognitive reserve. Cognitive reserve may convey resilience in the context of both age-related and AD-related neurocognitive decline due to greater efficiency in use of cognitive resources [38]. Other theories propose that “neural reserve” (e.g., larger brains or greater synaptic densities) promotes resiliency to AD-related brain changes [39]. The apparent dearth of cognitive reserve in atypical AD may partially explain the pattern of neurocognitive decline as we observed equivalent disease progression rates despite lower AD pathological burden. They also exhibited more widespread brain volume differences, possibly due to premorbid differences rather than disease-related atrophy. Future studies examining longitudinal atrophy patterns may clarify the role of neural reserve in AD subtypes.
In contrast to typical AD, only a minority of atypical AD carried the ApoE4 allele. ApoE4 increases AD risk and influences Aβ accumulation and clearance, in turn modifying AD progression [40]. Previous work linking ApoE4 to prominent medial temporal lobe atrophy suggests that genetic effects may be regionally specific. Animal studies reveal that ApoE4 influences memory impairment via functional neurovascular or metabolic changes, independent of neurodegeneration, possibly explaining amnestic differences between the two AD groups [41, 42]. ApoE4 also associates with younger age of onset, consistent with present finding of younger age and higher rate of ApoE4 in typical AD [43]. Some individuals may be less susceptible to ApoE4-specific AD risk. For the current atypical AD individuals with widespread cortical atrophy, alternative contextual risk factors may contribute to dysexecutive and dysnomic presentation, whereas classic AD-related pathological factors of Aβ, tau, and ApoE4 status may not crucially affect disease trajectory [44]. Notably, the prevalence of the ApoE4 allele in the asymptomatic-normal group (30.8% carriers) was higher than estimated prevalence rates for cognitively normal individuals in the general population (10–15%). A large contributing factor to this disparity is likely a characteristic of the ADNI study population, which oversampled for memory impairment and is predominately Caucasian, highly educated, and North American. ApoE4 prevalence has been shown to vary globally, with North American and European populations typically showing greater rates of ApoE4 carriers than Asian, African, and populations in the southern hemisphere [45, 46].
Typical AD showed pronounced atrophy of the medial temporal lobe (e.g., hippocampus and entorhinal cortex), consistent with amnestic profile. The AD groups did not differ in hippocampal volumes. Relative to asymptomatic-normal individuals, atypical AD did not show as pronounced reduction of hippocampal volume as typical AD. However, atypical AD group differed in volumes of the amygdala and other medial temporal structures. Despite important methodological differences across studies, our findings are consistent with previous studies deriving subtypes by pathological differences [2, 47]. We extend prior work by suggesting that the hippocampal sparing pattern may be part of a larger clinical-pathological pattern that includes distinct patterns of cognitive impairment, CSF biomarkers, and genetic risk.
There was a substantial difference between cluster-derived subgroups and ADNI diagnostic criteria, such that more than half (53.5%) of MCI individuals were reclassified into the asymptomatic-normal group. Furthermore, by using cluster analysis to derive the asymptomatic-normal group, we were able to capture all but one individual who reverted from MCI to cognitively normal over follow-up. These results are in line with previous findings that have shown a significant rate of false-positive errors such that a large portion of ADNI subjects diagnosed with MCI perform within normal limits on neuropsychological testing [10, 48]. Our cluster-analysis approach may be one way in which to correct for these diagnostic errors.
Though episodic memory historically typifies AD, meta-analysis of preclinical neuropsychological changes identifies a range of implicated domains, including subtle changes in global cognition, memory, executive function, and language [49–51]. Atypical AD, with relatively spared memory, had similar rate of eventual AD diagnosis, exemplified by comparable clinical ratings of global impairment (CDR). Informants also reported less functional impairment in atypical AD, possibly hindering early evaluation due to unusual and subthreshold presentation of cognitive and biological markers, lower genetic risk, and advanced age [52]. Moreover, pronounced memory impairment may be more debilitating in daily life, noticeable to peers, and likely to drive patients to a specialist. Studies of empirically-derived MCI neuropsychological profiles corroborate cognitive heterogeneity at this stage [4, 53]. Clearly outlined AD subtypes may assist clinicians in earlier identification and treatment of atypical AD.
The present study has both limitations and strengths. The ADNI study recruits and collects data from subjects from over 50 centers across the United States and Canada, and is not representative of the general population, due to exclusion criteria and oversampling of memory impairment. The study is currently in its third phase and many participants have incomplete data. Also, a high percentage of individuals have discontinued from all or key parts of data collection (e.g., lumbar puncture). This suggests that similar studies in more diverse samples would yield greater heterogeneity in clinical-pathological profiles. Furthermore, data on non-Caucasian individuals was limited, preventing meaningful analysis of racial or ethnic differences that likely increase variation [54]. For strengths, combining cognitive and biological markers to classify patient subtypes represents a novel approach, possibly providing superior prognostic and diagnostic value at early disease stages [55, 56]. Longitudinal design allowed examination of subtype stability and progression.
Treatment development to date has been unsuccessful, but unpacking heterogeneity could improve diagnosis and treatment planning. Certain subtypes might be more responsive to treatments based on modifying factors beyond the treatment target (e.g., Aβ). Clinical trials utilizing a comprehensive clinical-pathological profile may disentangle patient-specific heterogeneity and identify subtype-specific treatment responses.
Footnotes
ACKNOWLEDGMENTS
Funding for this study was obtained through NIH grants [R21AG055034, P01AG052350, P50AG00514] and a grant from the Alzheimer’s Association [AA008369].
Statistical analyses conducted by Anna E. Blanken, MA, University of Southern California.
Data collection and sharing for this project were funded by the Alzheimer’s Disease Neuroimaging Initiative (ADNI) ADNI is funded by the National Institute on Aging, the National Institute of Biomedical Imaging and Bioengineering, and through generous contributions from the following: AbbVie, Alzheimer’s Association; Alzheimer’s Drug Discovery Foundation; Araclon Biotech; BioClinica, Inc.; Biogen; Bristol-Myers Squibb Company; CereSpir, Inc.; Cogstate; Eisai Inc.; Elan Pharmaceuticals, Inc.; Eli Lilly and Company; EuroImmun; F. Hoffmann-La Roche Ltd and its affiliated company Genentech, Inc.; Fujirebio; GE Healthcare; IXICO Ltd.; Janssen Alzheimer Immunotherapy Research & Development, LLC.; Johnson & Johnson Pharmaceutical Research & Development LLC.; Lumosity; Lundbeck; Merck & Co., Inc.; Meso Scale Diagnostics, LLC.; NeuroRx Research; Neurotrack Technologies; Novartis Pharmaceuticals Corporation; Pfizer Inc.; Piramal Imaging; Servier; Takeda Pharmaceutical Company; and Transition Therapeutics. The Canadian Institutes of Health Research is providing funds to support ADNI clinical sites in Canada. Private sector contributions are facilitated by the Foundation for the National Institutes of Health (![]() ). The grantee organization is the Northern California Institute for Research and Education, and the study is coordinated by the Alzheimer’s Therapeutic Research Institute at the University of Southern California. ADNI data are disseminated by the Laboratory for Neuro Imaging at the University of Southern California.
). The grantee organization is the Northern California Institute for Research and Education, and the study is coordinated by the Alzheimer’s Therapeutic Research Institute at the University of Southern California. ADNI data are disseminated by the Laboratory for Neuro Imaging at the University of Southern California.