
Abstract
Although previous studies have investigated the effects of the apolipoprotein E (APOE) ɛ4 genotype on the default mode network (DMN) in the Alzheimer’s disease (AD) spectrum, it is still unclear how the APOE genotype regulates the DMN and subsequently affects cognitive decline in the AD spectrum. One hundred sixty-nine subjects with resting-state functional magnetic resonance imaging data and neuropsychological test scores were selected from the Alzheimer’s Disease Neuroimaging Initiative. The main effects and interaction of the APOE genotype and disease status on the DMN were explored. A moderation analysis was performed to investigate the relationship among the APOE genotype, DMN connectivity, and cognition. Additionally, the pair-wised DMN connectivity was used to classify AD spectrum, and the classification accuracy was validated. Compared to APOE ɛ4 non-carriers, APOE ɛ4 carriers showed the opposite trajectory of DMN connectivity across the AD spectrum. Specifically, the strengths in the posterior cingulate cortex (PCC) connecting with the right precuneus, insular, and fusiform area (FFA) were positively correlated with Mini-Mental State Examination (MMSE) scores in APOE ɛ4 non-carriers but not in APOE ɛ4 carriers. Furthermore, PCC-right FFA connectivity could moderate the effects of the APOE genotype on MMSE scores across the disease groups. More importantly, using a receiver operating characteristic analysis, these altered connectivities yielded strong classification powers in a pathological stage-dependent manner in the AD spectrum. These findings first identified the intrinsic DMN connectivity moderating the effect of the APOE genotype on cognition and provided a pathological stage-dependent neuroimaging biomarker for early differentiation of the AD spectrum.
Keywords
INTRODUCTION
Alzheimer’s disease (AD) is a neurodegenerative disorder characterized by a severe cognitive impairment in the elderly. Most new pharmacotherapies in clinical trials to treat AD have failed and have indicated that the time window for AD treatment should be in advance of symptoms occurring in patients with AD. In fact, substantial progress has been made in revealing the pathogenesis of AD, and research interest has moved toward the early stages, including the prodromal and even preclinical stage of AD [1, 2]. The National Institute on Aging–Alzheimer’s Association (NIA–AA) research framework defines AD as a biological process that spans from normal to dementia [3]. Amyloid-β (Aβ) accumulation may begin decades before dementia, and there is already substantial neuronal loss by the early stages of AD [4, 5]. While it is important to encourage of lifestyle modifications and allow medical management at the early stages of AD, disease-modifying treatment that halts or slows progression of the disease remains the ultimate goal. Prevention of dementia by targeting modifiable risk factors and neural reserve capacity could be more cost-effective and efficacious [6, 7]. Mild cognitive impairment (MCI), especially amnestic MCI (aMCI), is more likely to develop into AD, particularly if it displays biomarker evidence of AD [8, 9]. So far, accumulating evidence has divided MCI stages into early MCI (EMCI) and late MCI (LMCI) based on the severity of delayed memory impairment in logical memory, which is often used to detect the characteristics of cognitive decline across the AD spectrum [10–12]. Recently, neuroimaging studies have been widely applied and obtained fruitful findings for understanding the AD spectrum. For example, the default mode network (DMN), including the posterior cingulate cortex (PCC), precuneus, medial prefrontal cortex, inferior parietal lobule, lateral temporal cortices, and hippocampus in structure, is necessary for functional cognitive processing [13–15]. Disrupted connectivity in the DMN is associated with amyloid accumulation and closely linked with the pathology of AD [16]. More recently, abnormal DMN subnetworks have also been reported and suggest that the distinct role of the DMN subsystem with special functional-anatomic connectivity is involved in the pathophysiological profiles of the AD spectrum [17–19]. Also important is the suggestion that the posterior DMN, especially for the PCC as a key hub, could initiate connectivity-based cascading network failures during the AD spectrum [20, 21]. These findings strongly indicate that the DMN may potentially be a biomarker for predicting AD progression. However, little is known about which connectivity within the DMN could predict progression of the AD spectrum. Therefore, the first goal of current study is to investigate the distinct connectivity within the DMN that could represent the progressive biomarker across the AD spectrum.
Hypotheses about the molecular mechanisms of AD includes amyloid cascade, tau pathology, lipid metabolism, innate immunity, inflammation, and endocytosis. One hypothesis of the pathogenic role of apolipoprotein E (APOE) ɛ4 in AD is associated with the reduction of Aβ clearance and cholesterol transport, leading to Aβ aggregation, and subsequently increasing neuronal atrophy and synapse loss [22–24]. The APOE ɛ4 genotype is a major risk factor for developing AD. APOE ɛ4 carriers demonstrate hippocampal atrophy and more damage to episodic memory than APOE ɛ4 non-carriers [25–28]. APOE ɛ4 carriers also show decreased effective connectivity, which reflects the direct causal effects between the PCC and middle temporal gyrus, anterior cingulate cortex, and precuneus in the cognitively intact elderly [29]. Our previous study identified that less disrupted DMN connection in APOE ɛ4 carriers was significantly associated with better episodic memory scores in middle-aged adults [30], and that APOE ɛ4 carriers represented opposite aging trajectories of the DMN in elderly adults [31]. Furthermore, in aMCI patients with APOE ɛ4, the anterior DMN connectivity partially negatively mediates the association between posterior DMN connectivity and episodic memory, and the posterior DMN connectivity also partially negatively mediates the association between anterior DMN connectivity and episodic memory [32]. In addition, Mckenna et al. [33] demonstrated that APOE ɛ4 carriers disrupted the networkcharacteristics of the DMN in EMCI compared to normal aging subjects. Taken together, the APOE ɛ4 genotype is associated with impaired connectivity within the DMN and a cognitive decline in the AD spectrum. However, abnormal connectivity within the DMN and how to moderate the effects of the APOE genotypes on cognitive function has rarely been investigated, and, more importantly, how this abnormal connectivity based on the APOE genotype could classify AD spectrum subjects still remains unknown. The specific objectives of this study, therefore, were to identify the main effects and interaction of the APOE genotype and disease status on the DMN by using the resting-state functionalmagneticresonance(rs-fMRI) approach in the AD spectrum. A moderation analysis was employed to investigate whether the intrinsic DMN connectivity moderates the effects of the APOE genotype on cognitive function across the disease groups. Finally, the altered connectivity within the DMN based on the APOE genotype was also used to classify AD spectrum subjects, and a disease stage-dependent neuroimaging biomarker for the early differentiation of AD spectrum was obtained.
MATERIALS AND METHODS
ADNI database and participants
All data were obtained from the ADNI database (http://adni.loni.usc.edu). The rs-fMRI scans images were baseline enrolment from ADNI-1, ADNI-GO, and ADNI-2. If two rs-fMRI studies were performed on the same day, the first scan was chosen unless it did not meet ADNI rs-fMRI protocol standards or quality control measures. We defined the first available scan for each subject as the baseline scan to be included in this analysis (n = 182 unique baseline scans). Brain lesion (n = 2), uncertain clinical diagnosis (n = 2), and structural image quality control failure (n = 1) were excluded. Eight subjects (2 CN, 2 EMCI, 3 LMCI, and 1 AD) were excluded due to excessive motion (see data preprocessing). APOE genotyping for all participants was performed as previously described [34]. In brief, genomic DNA was extracted from peripheral blood cells. The cells were collected in single EDTA plastic tubes (10 ml) and were sent to the University of Pennsylvania AD Biofluid Bank Laboratory. More detailed information was available in the ADNI-1 Procedures manual. A total of 169 subjects were enrolled in the current study, including 46 cognitive normal (CN), 52 EMCI, 41 LMCI, and 30 patients with AD (Supplementary Fig. 1). Individuals with one or more APOE ɛ4 alleles were classified as APOE ɛ4 carriers (APOE ɛ4+), while subjects with no APOE ɛ4 alleles were classified as APOE ɛ4 non-carriers (APOE ɛ4–). According to the ADNI protocol, the CN subject were verified as free of memory complaints, beyond what one would expect for age. EMCI, LMCI, and AD subjects had a subjective memory concern as reported by the subject, study partner or clinician. The EMCI and LMCI subjects’ Mini-Mental State Examination (MMSE) scores were between 24 and 30, Clinical Dementia Rating (CDR) scores of 0.5. while the AD subjects’ MMSE scores were between 20 and 26, CDR scores of either 0.5 or 1.0 and meet the NINCDS/ADRDA criteria for probable AD [35]. To distinguish between EMCI and LMCI, abnormal memory function was documented by scoring the Logical Memory II subscale (Delayed Paragraph Recall) from the Wechsler Memory Scale-Revised after the education adjusted ranges: EMCI: a) 9–11 for 16 or more years of education; b) 5–9 for 8–15 years of education; c) 3–6 for 0–7 years of education; LMCI: a) ≤8 for 16 or more years of education; b) ≤4 for 8–15 years of education; c) ≤2 for 0–7 years of education. The functional brain MRI data and corresponding clinical data were downloaded before November 24, 2017 from the publicly available ADNI database. All the detailed description of the neuropsychological measure was presented in the Supplementary Material.
Data acquisition
All subjects were scanned on a 3.0-Tesla Philips MRI scanner. rs-fMRI images were obtained using an echo-planar imaging sequence with the following parameters: 140 time points, repetition time (TR) = 3000 ms, echo time (TE) = 30 ms, flip angle = 80°, number of slices = 48, slice thickness = 3.3 mm, spatial resolution = 3×3×3 mm3, acquisition matrix = 64×64, and field of view (FOV) = 240×240 mm. All original image files were available to the general scientific community. T1-weighted images were acquired using a sagittal magnetization prepared rapid gradient echo (MP-RAGE), with data parameters: TR = 6700 ms, TE = 3.1 ms, slice thickness = 1.2 mm, FA = 9° FOV = 250×250 mm, thickness = 1.0 mm, gap = 0 mm, and number of slices = 170.
Data preprocessing
The data preprocessing was performed using the Data Processing Assistant for a Resting-State fMRI (DPARSF, http://www.restfmri.net), which is based on Statistical Parametric Mapping (SPM8, http://www.fil.ion.ucl.ac.uk/spm) and the rs-fMRI Data Analysis Toolkit (REST, http://www.restfmri.net). Data analyses of the groups were conducted with the SPM8 toolkit. Briefly, the first 10 volumes of the scanning session were discarded to allow for T1 equilibration effects. The remaining images were corrected for timing differences and motion effects. No translation or rotation parameters of head motion in any given data set exceeded±3 mm or±3°. The resulting images were spatially normalized to the standard Montreal Neurological Institute (MNI) echo-planar imaging template using the default settings, resampling to 3×3×3 mm3 voxels, and smoothed with a Gaussian kernel of 6×6×6 mm. To further reduce the effects of confounding factors, 6 head motion parameters, as well as global mean signal, white matter signal, and cerebrospinal fluid (CSF) signal, was removed from the data through linear regression. Finally, a bandpass filter was applied to keep only low-frequency fluctuations between 0.01–0.08 Hz.
Voxel-wised DMN functional connectivity (FC) analysis
6 mm-radius sphere centered at the PCC (MNI space, coordination is (0, –53, 26)) served as the seed region [36, 37]. For each subject, the mean time series of the seed region was computed as the reference time course. Then, a Pearson cross-correlation analysis was performed between the seed time course and the time course of the whole-brain voxels. Next, a Fisher’s z-transformation was applied to improve the normality of the correlation coefficients [m = 0.5ln(1 + r)/(1–r)]. In this way, individual DMN FC map was obtained.
Structural image analysis
To avoid the bias of functional connectivity strength due to anatomical variation, the gray matter (GM) volume was considered as an important covariate in the functional connectivity analysis [38, 39]. An optimized voxel-based morphometry analysis was performed using the VBM8 toolbox in SPM8 to calculate the GM volume in all subjects. In brief, the T1-weighted images were segmented to GM, white matter, and CSF, and then the segmented GM was normalized and smoothed as the functional image. The final images were regressed out as covariate of no interest to control the effect of GM volumes on the intrinsic functional connectivity strength.
Statistical analysis
Demographic information and neuropsychological performance
Analysis of variance (ANOVA) and chi-square tests (applied for the comparisons of gender) were used to compare the demographic data. Mixed analysis of covariance (ANCOVA), with the disease and genes as fixed factors, was used to analyze the neuropsychological performances among subjects with statistically significant differences (p < 0.05) after controlling for age, gender, and education, followed by a post hoc test to determine the significance of the specific comparisons (p < 0.05/3 = 0.017, Bonferroni correction). All statistical procedures utilized SPSS 19.0 software (SPSS, Inc., Chicago, IL, USA).
Group-level intrinsic DMN connectivity analysis
To analyze the main effect and interaction between the APOE genotype and disease status on the DMN, a whole-brain voxel-wised ANCOVA was performed with the APOE genotype (ɛ4 carriers and non-carriers) and the disease status (CN, EMCI, LMC, or AD) as the fixed factors after controlling the effects of age, gender, education, and GM volumes. The thresholds were set at p < 0.001, which was determined by Monte Carlo simulation for multiple comparisons after being corrected with the latest 3dClustSim program (cluster level α< 0.05, https://afni.nimh.nih.gov/pub/dist/doc/program_help/3dClustSim.html3dClustSim.html, cluster size ≥30voxels). All the results were projected onto the surface brain template. To quantitatively represent these altered DMN, the averaged m-values (correlation coefficients after Fisher z transformation) in each target region was extracted from the individual DMN and shown with histograms using REST 1.8.
Behavioral significance
To investigate the behavioral significance of the altered DMN connectivity, a linear regression analysis was employed as below [40, 41]:
Mediation and moderation analysis
In this study, the MMSE was included as part of the diagnostic pathway for disease groups and a common comparator for the principal test assessed. To explore the potential relationships among the APOE, the intrinsic DMN FC, and behavior (MMSE), as well as to further examine whether the DMN FC strength could mediate the effects of the APOE genotype on the MMSE across the disease groups, a mediation analysis was performed. This analysis was selected from PROCESS Marco in the SPSS for the mediation analysis (model 4) [42].
A moderation analysis was used to address whether an effect exists and, if so, when, under what circumstances and in what magnitude such effect exists. A simple linear moderation model from PROCESS Marco in SPSS for the moderation analysis (model 1) was employed [43]:
Neuroimaging biomarker for classifying AD spectrum population
Next, these altered regional FC strengths based on the APOE genotype were employed to classify the AD spectrum population, as previously described in publications [45, 46]. The predictive value was estimated with receiver operating characteristic (ROC) curves by calculating the sensitivity, specificity, and area under the curve (AUC). To assess the accuracy of the classification, we used the permutation test to cross-validate theROC results because of the limited sample size in the present study. The error estimate of the permutation test was used to determine whether the observed difference between the sample means is large enough to reject the null hypothesis that the two groups have identical probability distributions. This entire process is repeated 1000 times, thereby yielding an unbiased estimation of the classification error rate. Unless specifically mentioned, the threshold for statistical significance was defined as p < 0.05. It was noted that we selected significant regions as classification features from the same dataset, this result will need to be validated on a novel dataset for significance. The purpose of this ROC analysis was to perform a preliminary proof of concept that a classification may be work.
RESULTS
Demographic information and neuropsychological data
As shown in Table 1, no significant differences were found in age, gender, or education among all the participants (all p > 0.05). The GM volumes were smaller in patients with AD compared to CN, EMCI, and LMCI subjects. A significant main effect of the disease status was shown in the MMSE and Alzheimer’s Disease Assessment Scale-Cognitive Subscale (ADAS-cog) scores. Specifically, compared with CN subjects, LMCI subjects and AD subjects displayed a significant decrease in MMSE scores and a gradually increase in the ADAS-cog scores. Furthermore, AD subjects exhibited significantly higher ADAS-cog scores than that of LMCI subjects. The main effect of the APOE genotype was also shown by the APOE ɛ4 carriers representing lower scores in the MMSE scores than that of APOE ɛ4 non-carriers.
Demographic information and neuropsychological performance
Significant differences were found in MMSE and ADAS-Cog among all groups. p values were obtained by 2×4 ANCOVA (with APOE genotype and disease status) analysis except for gender (χ2 test). a–f) post-hoc analysis (Bonferroni correction) further revealed the source of ANCOVA difference. a) EMCI versus CN; b) LMCI versus CN; c) AD versus CN; d) EMCI versus LMCI; e) EMCI versus AD; f) LMCI versus AD). ɛ4+, APOE ɛ4 carriers; ɛ4-, APOE ɛ4 non-carriers; CN, cognitive normal; EMCI, early mild cognitive impairment; LMCI, late mild cognitive impairment; AD, Alzheimer’s disease; F/M, female/male; GMVs, gray matter volumes; ml, milliliter; MMSE, Mini-Mental State Examination; ADAS-Cog, 13-item Alzheimer’s Disease Assessment Scale-Cognitive subscale.
Main effects of the APOE genotype and disease status on the DMN
The main effect of the APOE genotype on the DMN was primarily located in the bilateral dorsolateral prefrontal cortex (DLPFC), right parahippocampal gyrus (PHG), precentral gyrus (PreCG), left hippocampus and temporal pole (TP), as described in Fig. 1A. Compared with APOE ɛ4 non-carriers, APOE ɛ4 carriers showed significantly weaker intrinsic FC in these regions, as illustrated in Fig. 1B.
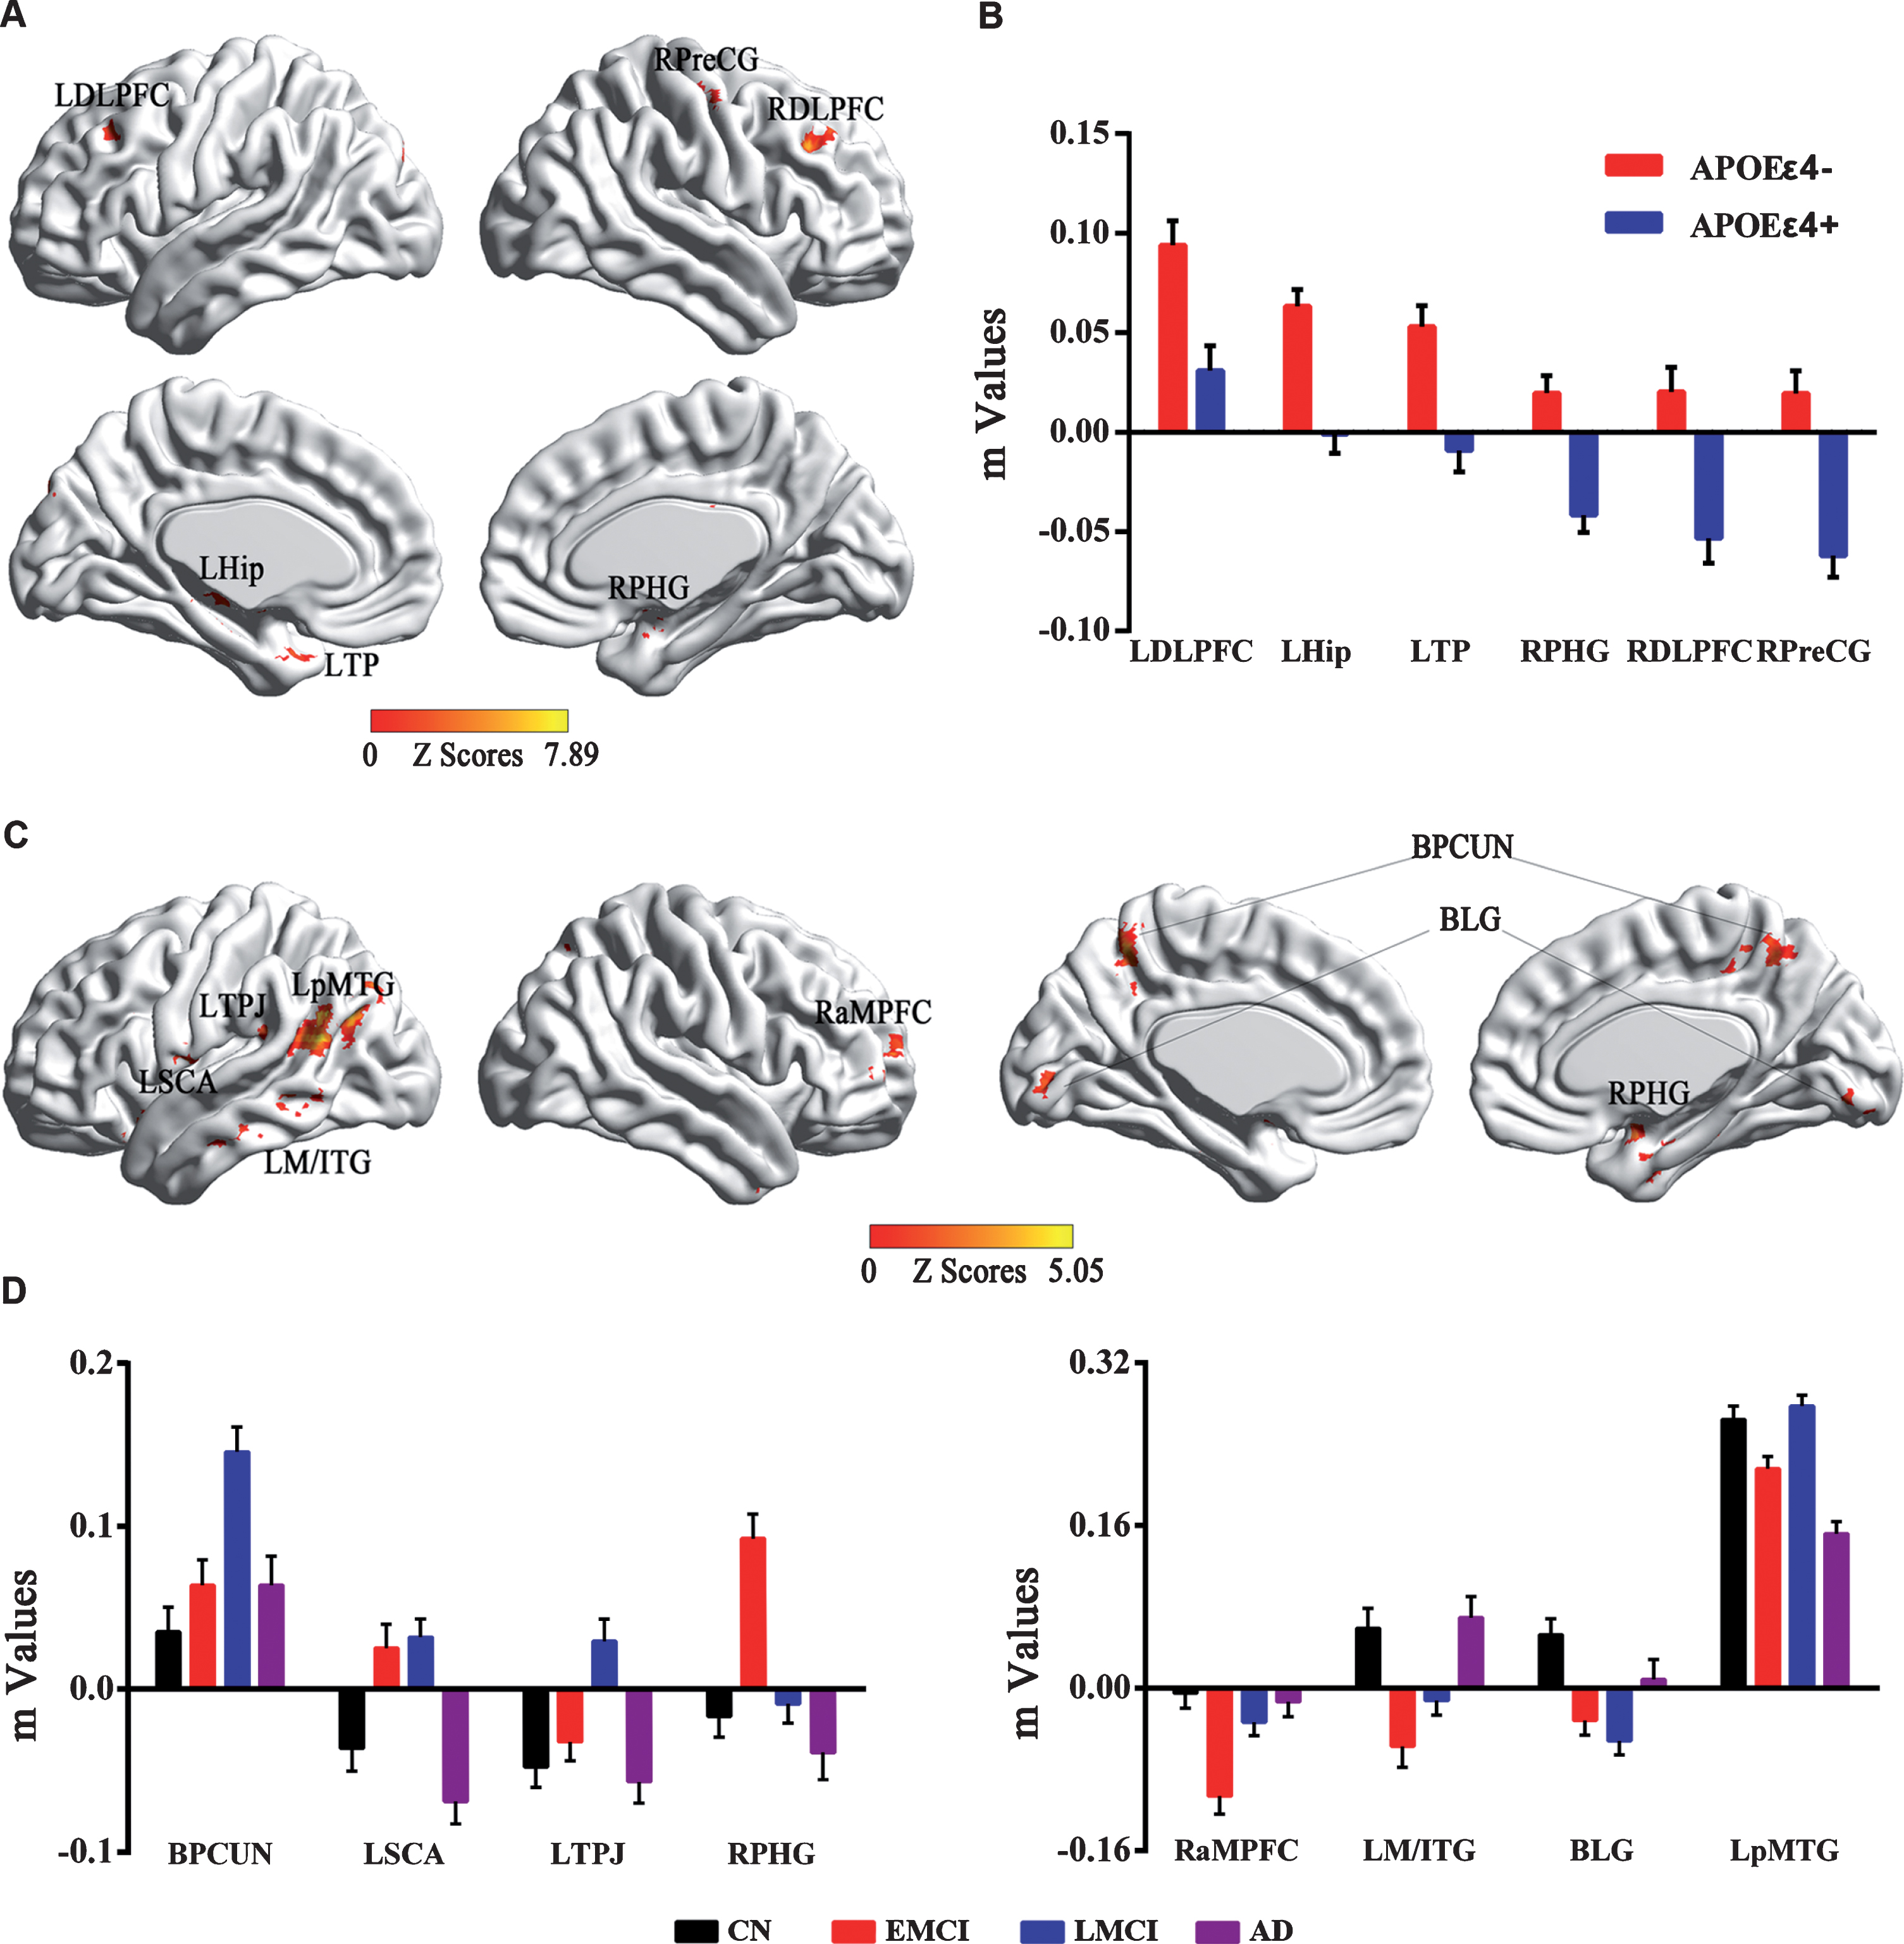
Main effects of APOE genotype and disease status on the DMN across all subjects. A) Brain regions with main effects of APOE genotype revealed that altered DMN FC were primarily located in the bilateral frontal-temporal system in APOE ɛ4 carriers (APOE ɛ4+) compared to APOE ɛ4 non-carriers (APOE ɛ4–). B) Numerical representations of the significant main effect of APOE genotype on the DMN were described using bar charts (m is z value from the cross-correlation coefficient after Fisher’s z transformed, same below). C) Brain regions with main effects of disease status revealed that altered DMN FC were primarily located in the bilateral frontal-parietal system and temporal-occipital system among four groups. D) Numerical representations of main effects of disease status on the DMN among all the groups were illustrated with bar charts. According to the progressive stages of the AD spectrum, the distribution of the DMN FC presented a disturbed pattern with U-shaped and inverted U-shaped trajectories. DMN, default mode network; FC, functional connectivity; LDLPFC, left dorsolateral prefrontal cortex; RDLPFC, right dorsolateral prefrontal cortex; LHip, left hippocampus; LTP, left temporal pole; RPreCG, right precentral gyrus; RPHG, right parahippocampal gyrus; BPCUN, bilateral precuneus; BLG, bilateral lingual gyrus; LSCA, left subcentral area; LpMTG, left posterior middle temporal gyrus; LM/ITG, left middle/inferior temporal gyrus; LTPJ, left temporal-parietal junction; RaMPFC, right anterior medial prefrontal cortex; CN, cognitive normal; EMCI, early mild cognitive impairment; LMCI, late mild cognitive impairment; AD, Alzheimer’s disease.
The main effect of the disease was widely observed in the bilateral precuneus (PCUN) and lingual gyrus (LG), subcentral area (SCA), posterior middle temporal gyrus (pMTG), middle/inferior temporal gyrus (M/ITG), temporal-parietal junction (TPJ), PHG, and anterior medial prefrontal cortex (aMPFC), as shown in Fig. 1C. Interestingly, according to the progressive stages of the AD spectrum, the distribution of the DMN FC presented a disturbed pattern with dynamic and robust changes, especially in the EMCI and LMCI stages. Briefly, the distributed pattern in the bilateral PCUN, left SCA and TPJ, and right PHG seemed more likely to have an inverted U-shaped, while the distribution in the bilateral LG, left MTG, and right aMPFC was more likely to have a U-shape. In addition, the FC strength in the left pMTG represented a distinctive pattern that decreased initially in the EMCI stage, then compensated in the LMCI stage but finally straightforwardly declined in the AD stage compared to that in the CN subjects, as detailed in Fig. 1D.
The neural effects of the APOE genotype×disease interaction were primarily seen in the left MTG, dorsal anterior cingulate cortex (dACC), hippocampus, right fusiform areas (FFA), inferior frontal gyrus (IFG), INS, PCUN, and DLPFC, as seen in Fig. 2A. More importantly, compared to APOE ɛ4 non-carriers, the APOE ɛ4 carriers produced approximately opposite trajectory changes in the DMN across the AD spectrum, especially in the EMCI and LMCI stages. Specifically, the APOE ɛ4 carriers represented increased connectivity in the left MTG, hippocampus, dACC, and right PCUN, as well as decreased connectivity in the right IFG, INS, DLPFC, and FFA from the EMCI to LMCI, while the APOE ɛ4 non-carriers showed a completely inverted mode, as displayed in Fig. 2B.
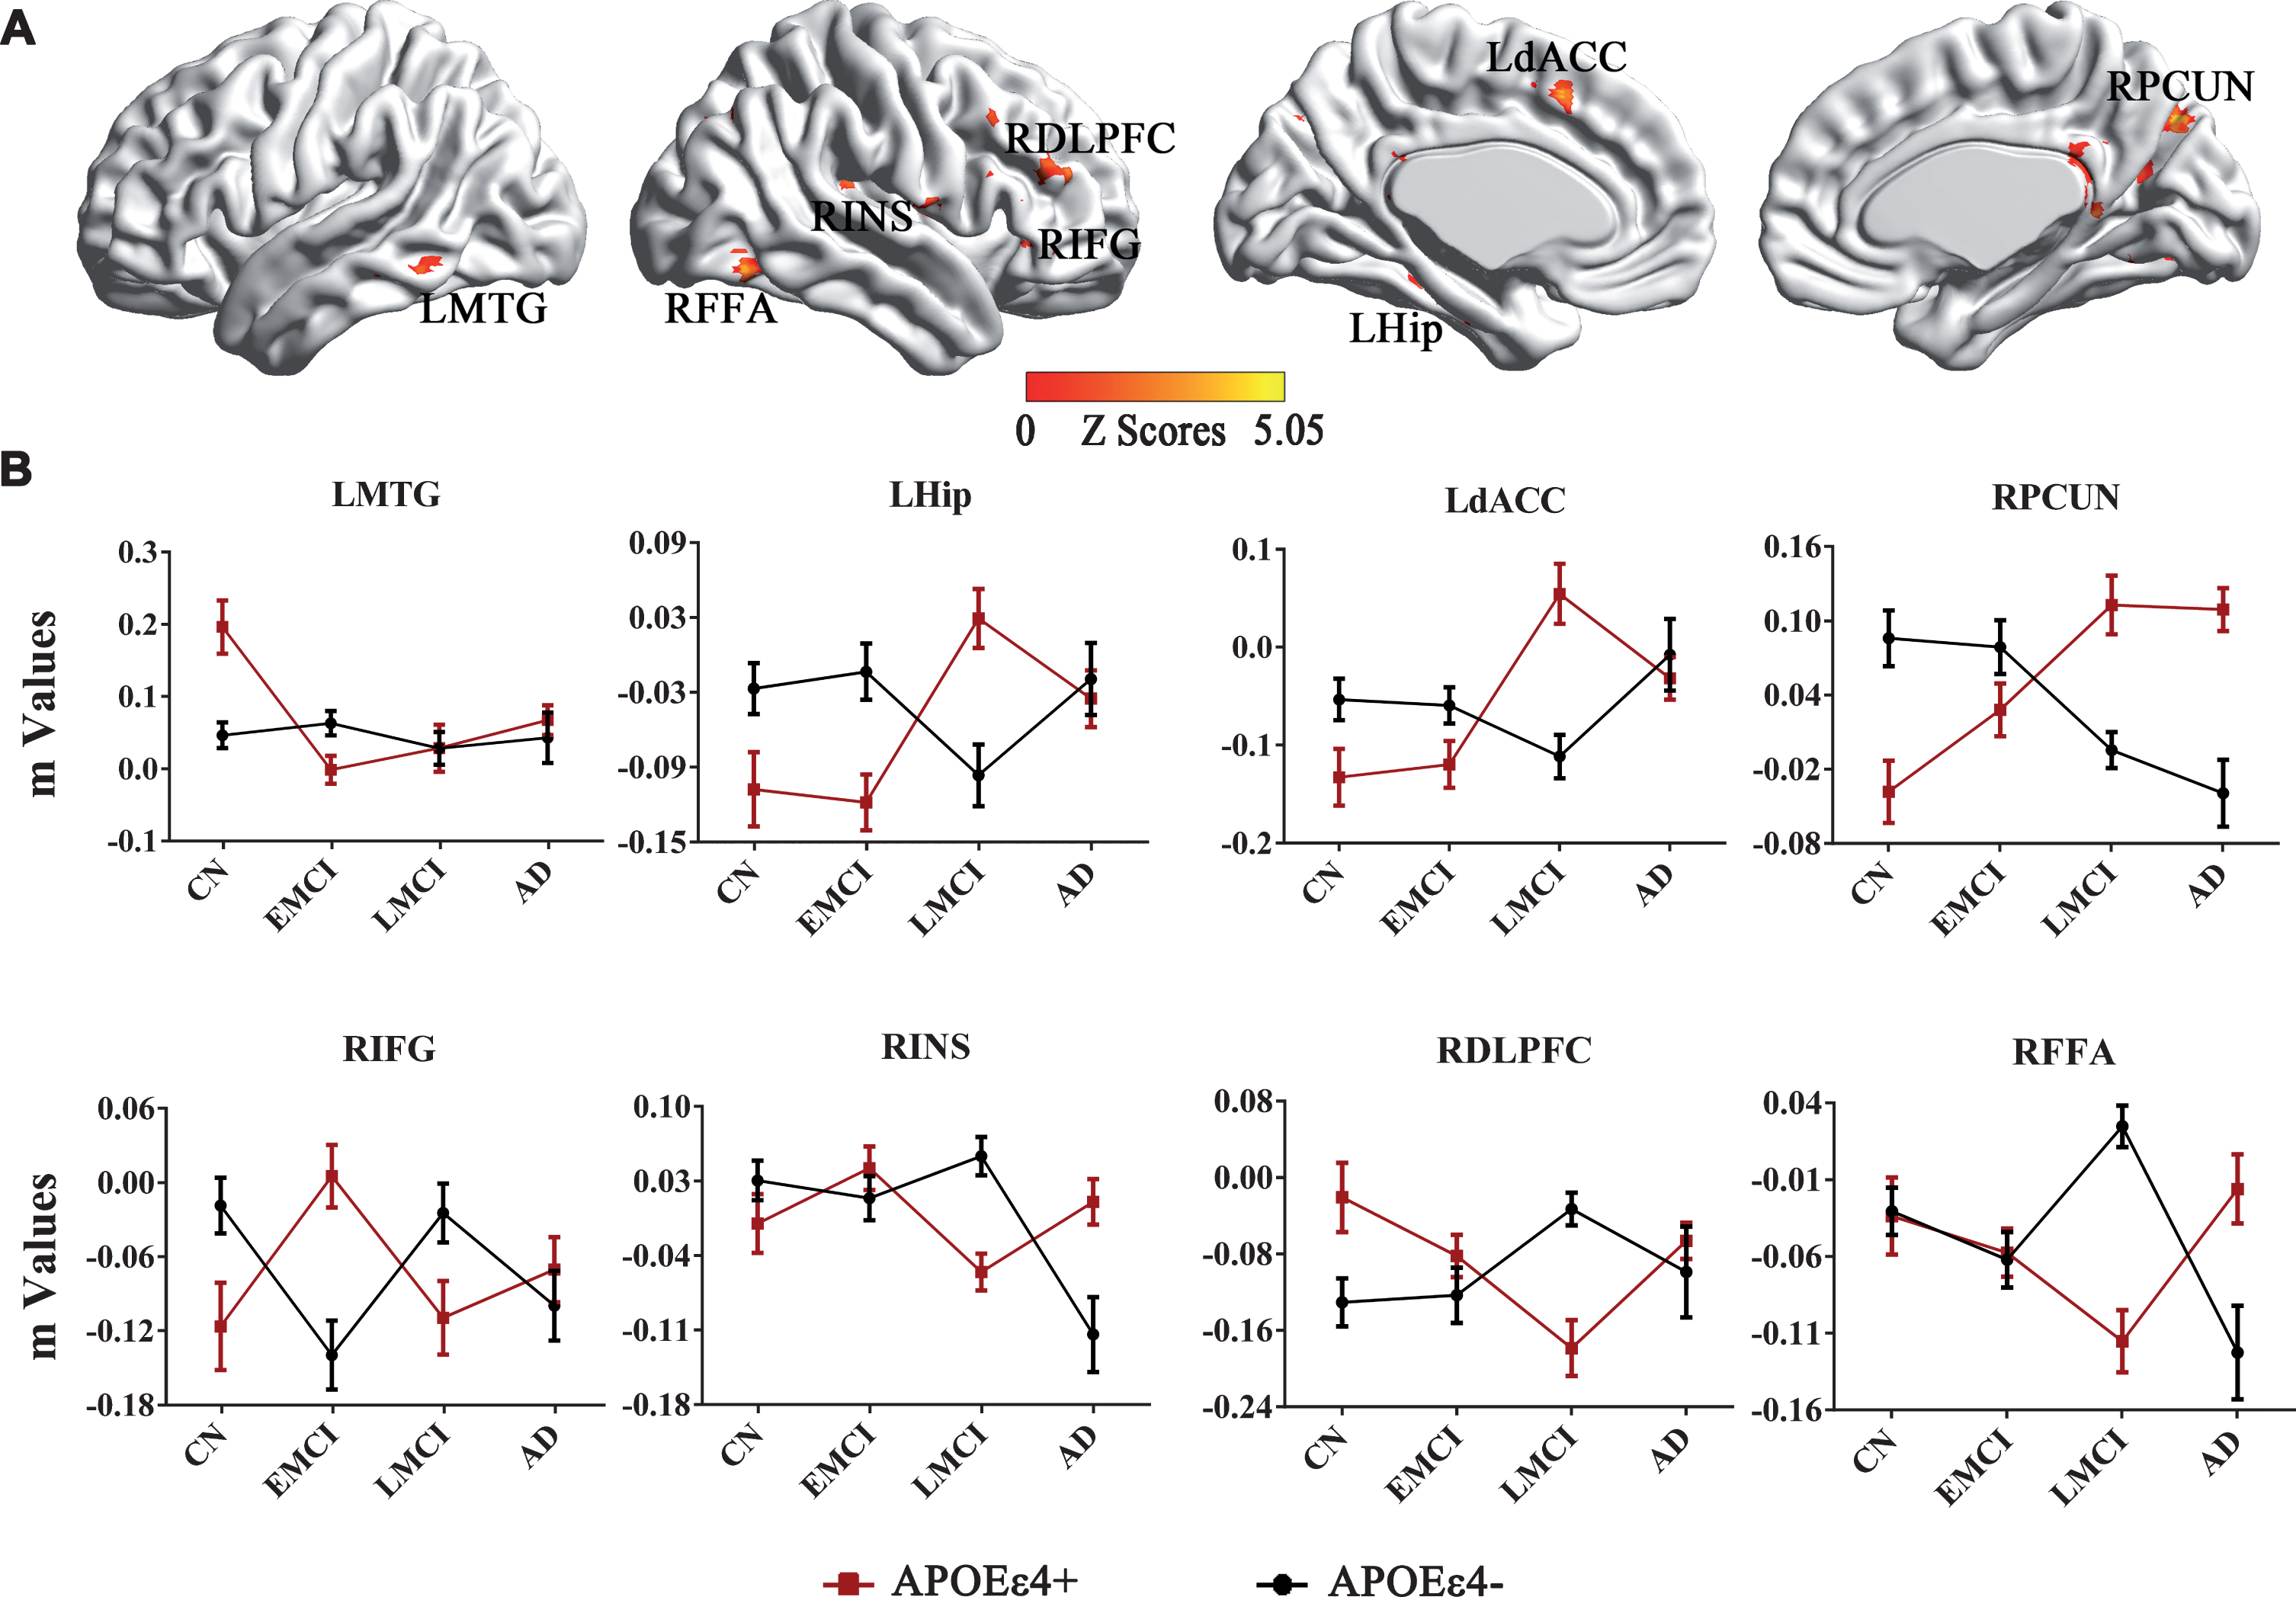
Interactive effects of the APOE genotype and disease status on the DMN across all subjects. A) Brain regions with significant interactions between APOE genotype and disease status on the DMN across all subjects. B) Numerical representations of the significant interactive effects of APOE genotype and disease status on the DMN were illustrated with line charts. Importantly, the trend for changed DMN FC strength is opposite in APOE ɛ4 carriers (APOE ɛ4+) compared to APOE ɛ4 non-carriers (APOE ɛ4–) across the AD spectrum. DMN, default mode network; FC, functional connectivity; LMTG, left middle temporal gyrus; LHip, left hippocampus; LdACC, left dorsal anterior cingulate cortex; RPCUN, right precuneus; RIFG, right inferior frontal gyrus; RINS, right insula; RDLPFC, right dorsolateral prefrontal cortex; RFFA, right fusiform areas; CN, cognitive normal; EMCI, early mild cognitive impairment; LMCI, late mild cognitive impairment; AD, Alzheimer’s disease.
Behavioral significance
As shown in Fig. 3, the regression analysis displayed that the PCC-RPCUN (R2 = 0.082, β= 5.872 [0.613–11.132, 95% CI], t = 2.237, p = 0.029), PCC-RINS (R2 = 0.117, β= 6.523 [1.716–11.330, 95% CI], t = 2.719, p = 0.009) and PCC-RFFA (R2 = 0.077, β= 5.893 [0.421–11.366, 95% CI], t = 2.157, p = 0.035) significantly affected the MMSE scores across the disease groups in the APOE ɛ4 non-carriers. It is interesting that the results were not significant in the APOE ɛ4 carriers.
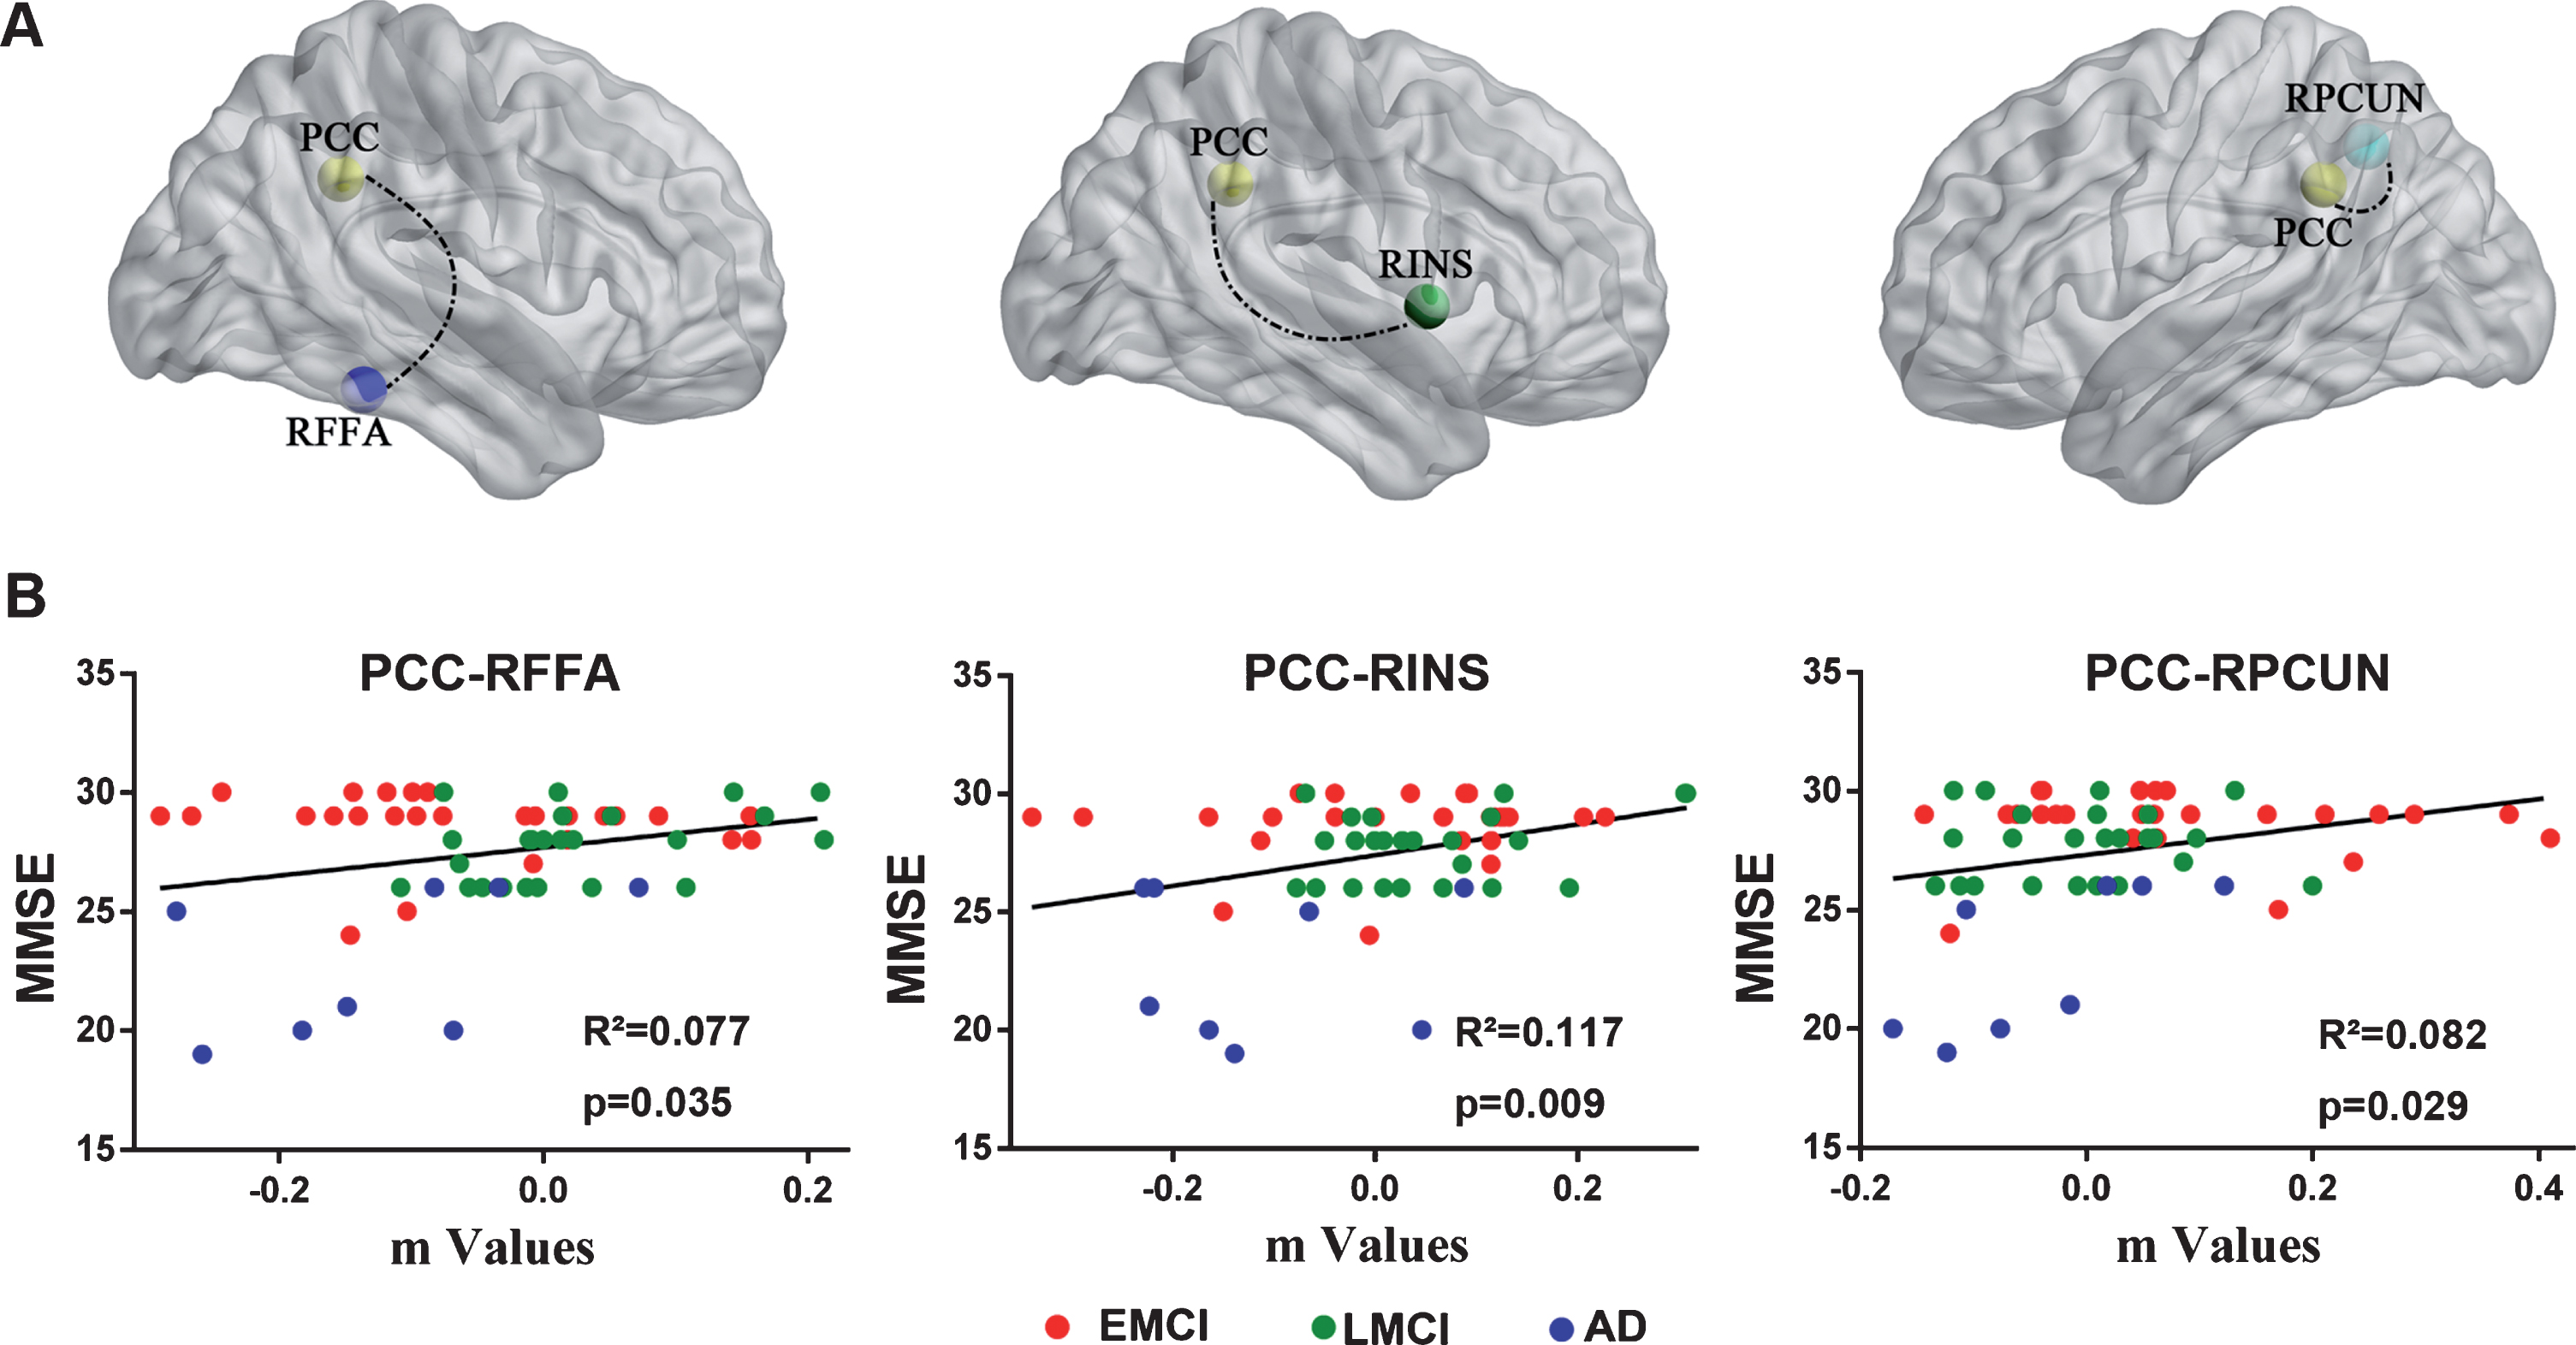
Linear regression analysis identified that altered DMN FC was associated with MMSE scores in the APOE ɛ4 non-carriers but not in the APOE ɛ4 carriers. A) Brain regions with altered FC values between the PCC and RPCUN, RINS, and RFFA were significant factors affect the MMSE scores in the APOE ɛ4 non-carriers. B) Quantitatively illustration of the regression analysis results between PCC connecting with above target regions (m values) and MMSE scores across the disease groups. DMN, default mode network; FC, functional connectivity; MMSE, Mini-Mental State Examination; PCC, posterior cingulate cortex; RPCUN, right precuneus; RINS, right insula; RFFA, right fusiform areas; EMCI, early mild cognitive impairment; LMCI, late mild cognitive impairment; AD, Alzheimer’s disease.
Mediation and moderation analysis
The mediation yielded no significant results, as described in Supplementary Figure 2. The moderation process analysis revealed that PCC-RFFA connectivity significantly moderated the effects of the APOE genotype on the cognitive performance across the disease groups. As seen in Fig. 4A, moderator variable PCC-RFFA connectivity influenced the magnitude of causal effect of APOE genotype on cognitive performance. As depicted in Fig. 4B, an association between two variables (APOE genotype and MMSE) was moderated when its size or sign depends on the third variable (PCC-RFFA connectivity). Specially, the interaction of APOE genotype and PCC-RFFA connectivity affected cognitive performance. Further, the Johnson-Neyman technique was applied to visualize this modulation pattern. As shown in Fig. 4C, we identified a significantly negative relationship of PCC-RFFA moderating the effects of the APOE genotype on the cognitive performance. That is, the APOE genotype produced a statistically significant and negative effect on cognitive performance with an increase in the PCC-RFFA connectivity. More importantly, we also found this modulation effect only existed when the PCC-RFFA value was larger than –0.0823. This result indicates that the PCC-RFFA strength is above this value and the moderating effect is significant.

Moderation process analysis. A) The moderation model with PCC-RFFA connectivity influencing the effect of APOE genotype on MMSE. The vertical arrow indicates the PCC-RFFA connectivity moderating the effect of APOE genotype on MMSE. B) A statistical diagram presents the effect of APOE genotype, PCC-RFFA connectivity, and interaction of APOE genotype with PCC-RFFA connectivity on MMSE. C) Johnson-Neyman method was applied to present the association between the APOE genotype and MMSE.The black continuous lines showed the conditional effects of APOE genotype on MMSE depending on the PCC-RFFA FC values. When the PCC-RFFA FC value is above –0.0823, the conditional effect is statistically significant (p < 0.05). In addition, the dotted lines above and below indicate the corresponding 95% confidence intervals (CI). The gray vertical dashed line identifies the regions of significance, reaching from the lowest score until the value of PCC-RFFA FC to change at which the lower 95% CI of the slope crosses the zero point. FC, functional connectivity; MMSE, Mini-Mental State Examination; PCC, posterior cingulate cortex; RFFA, right fusiform areas.
Stage-dependent neuroimaging biomarker for classifying AD spectrum population
We further demonstrated that DMN FC could be used to establish classification criteria with ROC curves using Fisher’s linear discriminant analysis. As illustrated in Fig. 5, this classification presented a higher sensitivity and specificity dependent on the APOE genotype and disease stage, but not on the entire course of the AD spectrum. For example, APOE ɛ4 non-carriers presented in the AUC are 0.798 [0.680–0.916, 95% CI] and 0.811 [0.687–0.935, 95% CI] for PCC-BPCUN, 0.912 [0.804–1.019, 95% CI] and 0.947 [0.870–1.024, 95% CI] for PCC-LAG, while the APOE ɛ4 carriers presented in the AUC are 0.725 [0.571–0.880, 95% CI] for PCC-LPreCG, 0.762 [0.621–0.904, 95% CI] for PCC-RINS, 0.789 [0.648–0.929, 95% CI] for PCC-RPHG, and 0.797 [0.673–0.921, 95% CI] for PCC-LAG, to discriminate the CN from EMCI, EMCI from LMCI, AD from LMCI, and AD from EMCI, respectively. All AUC values are more than 0.7, suggesting that these variables significantly discriminate the four groups. Additionally, this classifier was cross-validated by the permutation test.
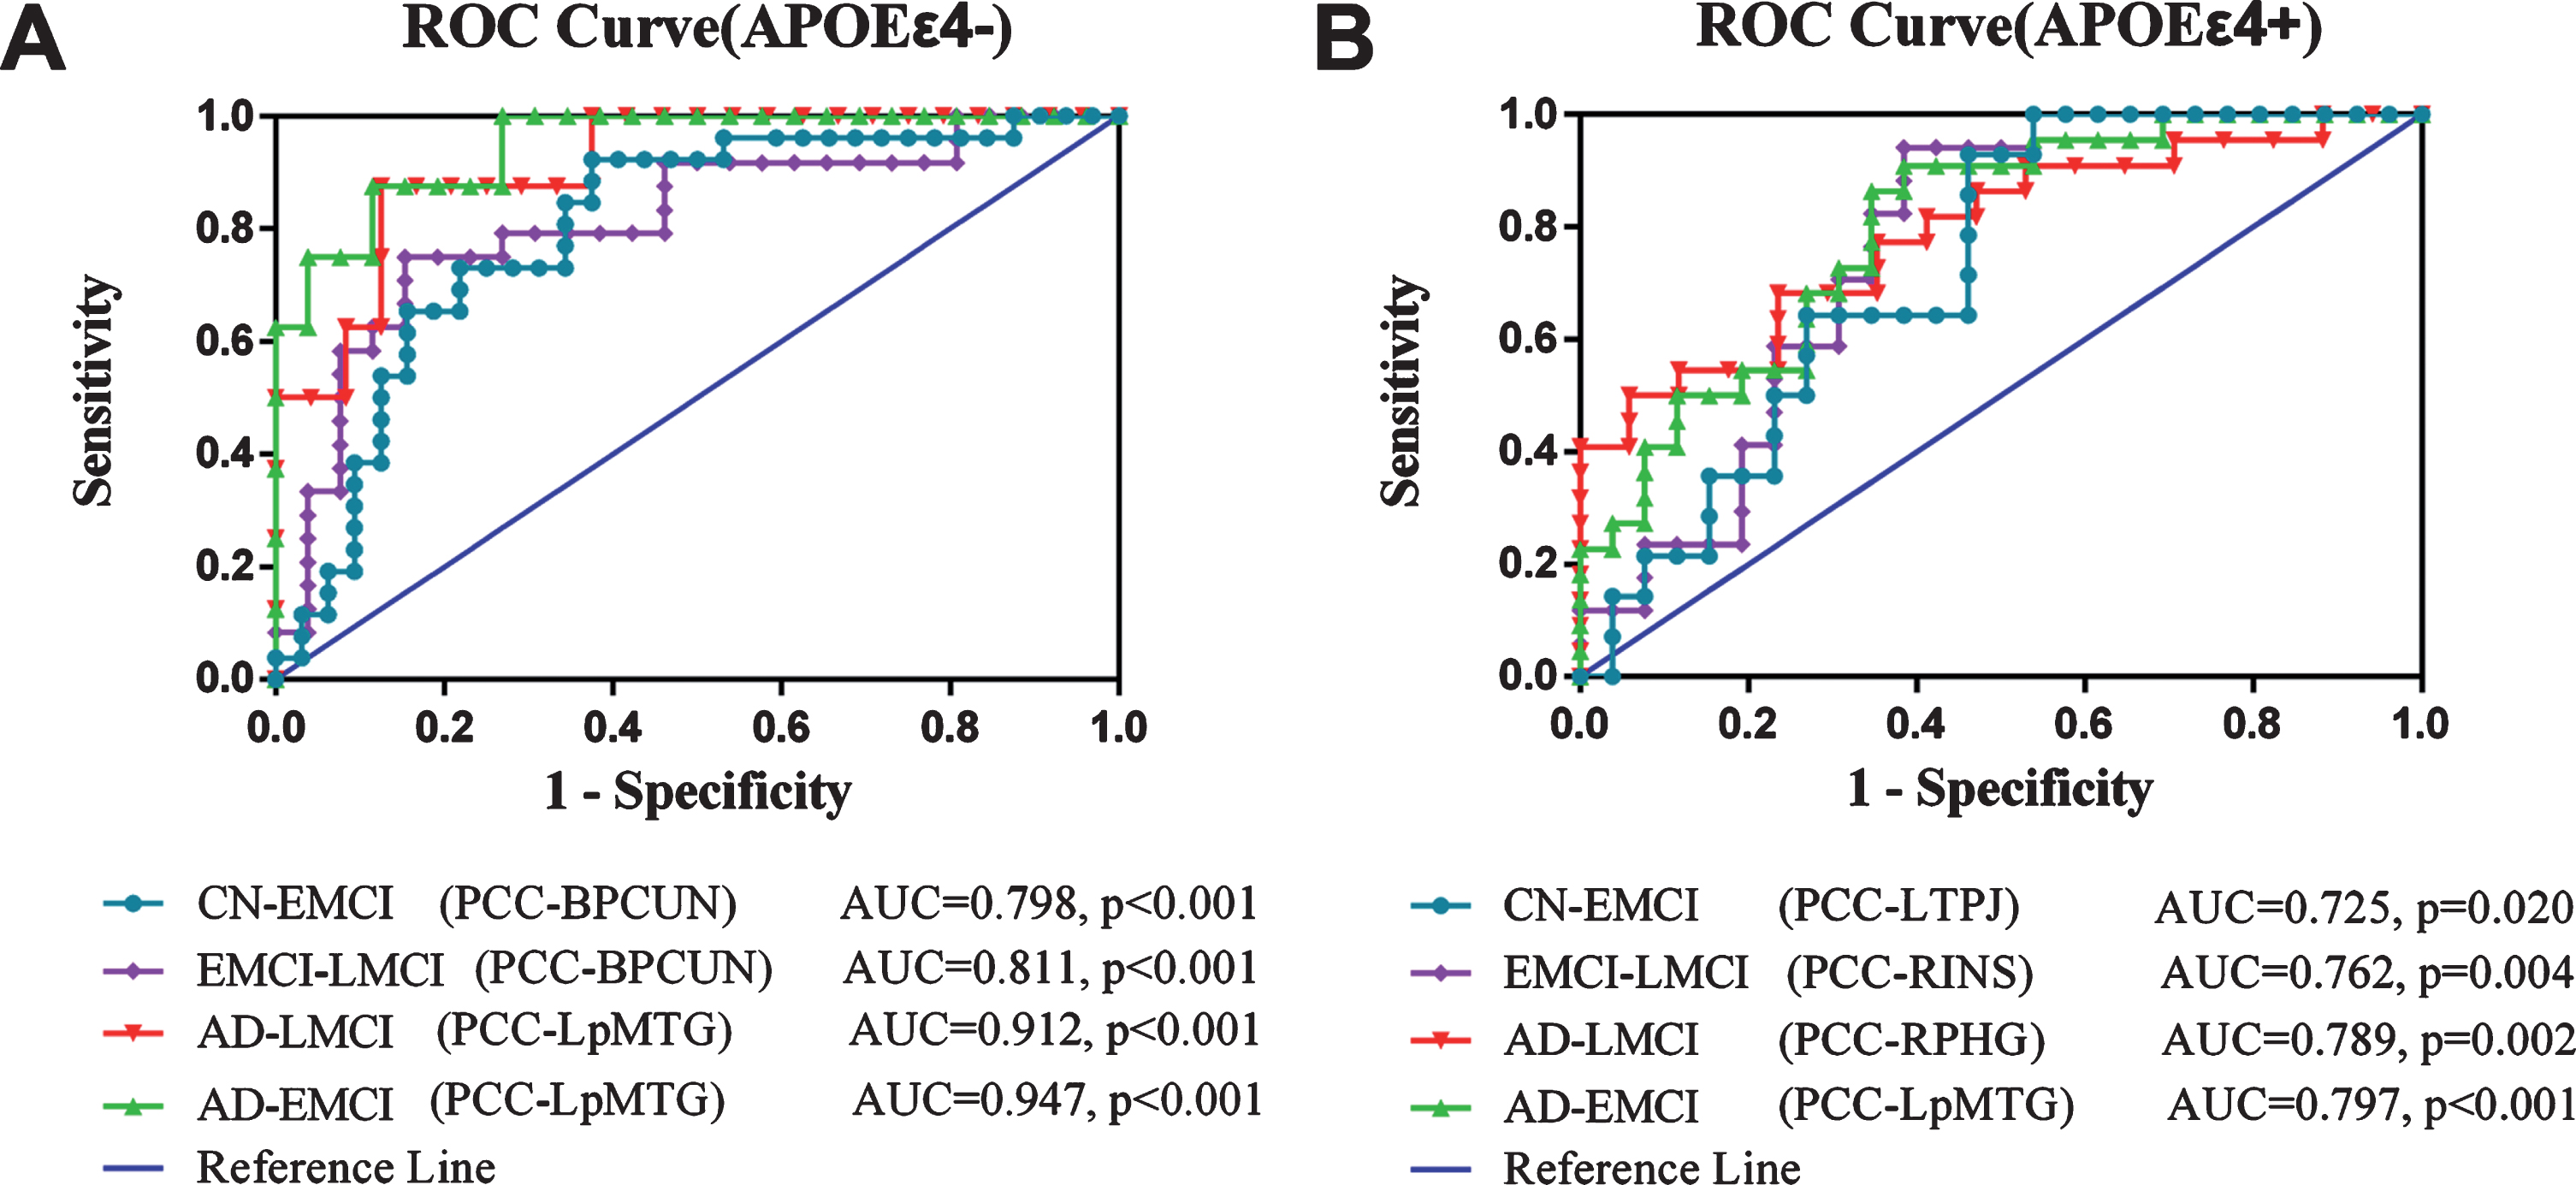
Stage-dependent neuroimaging biomarker for classifying AD spectrum population. A) In APOE ɛ4 non-carriers, the value of FC is a measure of the predictability of the variable in classifying EMCI and CN (AUC value = 0.798,p<0.001 for PCC-BPCUN), EMCI and LMCI (AUC value = 0.811,p<0.001 for PCC-BPCUN), AD and LMCI (AUC value = 0.912, p < 0.001 for PCC-LpMTG), AD and EMCI (AUC value = 0.947, p < 0.001 for PCC-LpMTG). B) In APOE ɛ4 carriers, the value of FC is a measure of the predictability of the variable in classifying EMCI and CN (AUC value = 0.725, p = 0.020 for PCC-LTPJ), EMCI and LMCI (AUC value = 0.762, p = 0.004 for PCC-RINS), AD and LMCI (AUC value = 0.789, p = 0.002 for PCC-RPHG), AD and EMCI (AUC value = 0.797, p < 0.001 for PCC-LpMTG). ROC, receiver operating characteristic; FC, functional connectivity; PCC, posterior cingulate cortex; BPCUN, bilateral precuneus; LpMTG, left posterior middle temporal gyrus; LTPJ, left temporal-parietal junction; RINS, right insula; RPHG, right parahippocampal gyrus; LpMTG, left posterior middle temporal gyrus; AUC, area under curve; CN, cognitive normal; EMCI, early mild cognitive impairment; LMCI, late mild cognitive impairment; AD, Alzheimer’s disease.
DISCUSSION
AD is characterized by both structural and functional disruption connectivity [47]. In this study, we demonstrated the interaction of the APOE genotype and disease status and the divergent trajectory of the DMN pattern in the APOE ɛ4 carriers compared to APOE ɛ4 non-carriers in the AD continuum. This dichotomous pattern indicates that there are discrepant spatial and temporal patterns of progression within these selectively vulnerable brain regions in AD. More importantly, we identified that PCC-RFFA connectivity conditionally moderates the effects of the APOE genotype on cognitive performance. Furthermore, we also determined that these altered DMN FCs could classify the AD spectrum population with good sensitivity and specificity and represent a potential neuroimaging biomarker in the disease stage-dependent manner.
Consistent with previous studies [48, 49], we identified the neural correlates of APOE genotype and disease status on the DMN in the AD spectrum population. These regions were frequently reported as key hubs of DMN with high FC, conveying the effective information processing in function and preferentially associated with Aβ deposition. Thus, these brain areas are vulnerable in patients with AD [20, 50–52]. Growing lines of evidence have suggested that these disrupted DMN connectivities may allow for an early prediction of progression, an assessment of prognosis, and the ability to monitor the efficacy of treatment in patients with AD [53–56]. However, it is notable that during the different stages of AD spectrum, the distributions of altered DMN FCs in the BPCUN, LSCA, LTPJ, and RPHG were more likely to be an inverted U-shape, indicating that the FC strength was initially increased in the MCI stage but decreased towards a CN trend in the AD stage. These changing FC strengths may have a compensatory enhancement in the MCI stage and decompensation in the AD stage [57, 58]. Conversely, the distribution of altered DMN FCs represented a U-shape in the RaMPFC, LMTG, and bilateral LG, indicating that the FC strength was initially decreased in the MCI stage but increased toward a CN trend in the AD stage. These results suggest that the functional network is disrupted, but compensation may occur in the AD phase [59–63]. However, it is interesting that the FC strength in the LpMTG presented different patterns: a decrease in the EMCI stage and an increase in the LMCI stage, but finally declining much more compared to that in the CN subjects. These dichotomous patterns in the distribution of DMN may reflect a stable property of the underlying network architecture and resulting activity fluctuations may convey preferentially vulnerability in the AD spectrum population [52]. Intriguingly, an interactive effect between diseases and the APOE genotype was observed in the frontal-parietal-temporal system, which is often associated with the executive control network and salience network [13, 64]. More importantly, these brain regions have been consistently identified as being involved in AD progression [52, 65]. However, the APOE ɛ4 carriers and APOE ɛ4 non-carriers produced approximately opposite FC changes with PCC to these target regions across the AD spectrum, which might be ascribed to different neural mechanisms involved in AD progression. Specifically, the APOE ɛ4 carriers in the EMCI group showed an increased FC, while the APOE ɛ4 non-carriers showed a decreased connectivity within specific regions such as LMTG, LHip, LdACC, and RPCUN. Similar changes have been reported in MCI patients [66]. The functional disruption of the DMN in patients with AD was initially targeted to the medial temporal lobe and PCC/precuneus and subsequently worsened and extended to the lateral parietal and medial frontal regions with increasing disease severity [18, 67–70]. Recently, the hypothesis of cascading network failure was proposed in the AD spectrum [20, 21]. This model suggests that the PCC, as the first target region, initiates thecontinuous cascade network and then shifts the processing burden to the other backbone regions throughout the AD spectrum. These backbone regions with high connectivity to the posterior DMN are associated with amyloid protein accumulation [71–73]. In addition, the cascading failures network is characterized by local overloading, eventually leading to the entire DMN and systems failing, which precedes structural and functional declines in the AD spectrum [21]. These findings strongly indicate that the stage between EMCI and LMCI was more sensitive and vulnerable in the preclinical patients with AD. The important connectivities within DMN were disrupted likely fromAβ plaque-associated neuronal toxicity. And then, this toxicity usually triggers a cascade of cellular changes, including hyperphosphorylation of tau, oxidative damage, synaptic failure, and inflammation [74–76]. More importantly, we also demonstrated a positive correlation between the altered DMN FC and changes in the MMSE scores across the disease groups. That is, the more increased connectivity in the PCC-RPCUN, PCC-RINS, and PCC-RFFA, the less the MMSE decreased. Although the general trend of the MMSE scores was decreased from EMCI, LMCI to AD, the increased connectivity within PCC-RPCUN, PCC-RINS, and PCC-RFFA was diminished and did not reverse the decrement of MMSE at the individual level, which might also support the compensation theory of AD [77, 78]. It is noted that this correlation was only observed in APOE ɛ4 non-carriers, indicating that the relationship between the general mental status and brain function is tightly coupled in APOE ɛ4 non-carriers but with a loss of functional coupling in the APOE ɛ4 carriers. Ye et al. [79] also found that the increased hippocampal FC was positively correlated with changes in episodic memory test scores in aMCI patients with APOE ɛ4 non-carriers but not in the APOE ɛ4 carriers. These findings highlight that the APOE genotype may modulate the intrinsic effects of brain function at the different levels and divergences in the risk of progressing to AD.
Next, a conditional modulation analysis identified that the DMN FC could moderate the relationship between the APOE genotype and cognitive performance. This result provides a new perspective on the mechanisms that facilitate interactions between the complex genetic risk factors and cognitive impairment. Accumulated evidence has reported the relationship between the APOE genotype and cognitive function in patients with MCI or AD [79–87]. Several studies have revealed that the genotype-behavior relationship was modulated by brain structure and function with mediation analysis. For example, Kerchner et al. [25] found that hippocampal CA1 atrophy might be associated with the APOE ɛ4 allele phenotypic effects on memory function in AD or aMCI patients. Our group found that amygdala FC strength regulated the effects of the APOE genotype and age on cognitive function in aMCI patients [88]. Combined with multiple genetic loci in the dopamine pathway, nucleus accumbens FC mediates the association between multiple genetic loci effects and anxious depression in major depressive disorder patients [89]. Currently, the data revealed that APOE genotype has substantial effect on the MMSE scores and the effect is moderated by intrinsic PCC-RFFA. This suggested that intrinsic DMN activity modulate the effects of APOE genotypes on the behavioral performance. Through a combined resting-state functional and structural MRI study, He et al. [90] found altered low-frequency blood oxygenation level-dependent fluctuations coherence in the FFA in patients with AD. Additionally, both AD and MCI patients represented changes in the FFA functional activation during a visual working memory task compared to normal controls [91]. FFA, as a cortical center, shows co-activation when performing the facial matching task [92, 93] in normal agingand MCI patients. Moreover, considering the pathologic mechanism, Guillozet et al. [94] demonstrated that there were neurofibrillary tangles in the FFA regionin normal agingand MCI patients, and MCI patients produced more neurofibrillary tangles than those in normal control subjects. These studies showed that an FFA lesion in structure and function may preferentially contribute to AD development, especially in visual cognition. Taken together, these findings strongly indicate that intrinsic PCC-RFFA may bridge the relationship between the APOE genotype and complex brain function and construct the gene-brain-behavior mode across the disease groups.
There are some studies that have tried to establish biomarkers to distinguish different stages of the AD spectrum. Penn Biomarker Core have developed a pathological CSF and plasma biomarker signature for mild AD as well as a biomarker that predicts progression from MCI and/or CN to AD [95]. MRI patterns of brain atrophy (quantified by the SPARE-AD index) and ADAS-cog were reported to have a similar predictive value in the progression from MCI to AD, and their combination was better than their individual performance [96]. The combination of SPARE-AD, ADAS-cog, and the APOE genotype provided the highest hazard ratio in predicting the progression from MCI to AD [97]. With a large-scale network analysis based on the rs-fMRI, interconnectivity patterns of the entire brain regions can be used to classify subjects with AD, aMCI, and CN [98]. Here, we verified that altered DMN FC as candidate biomarkers could possibly classify AD and EMCI subjects (AUC = 94.7%) or AD and LMCI subjects (AUC = 91.2%) by detecting PCC-LpMTG connectivity, and classify CN and EMCI (AUC = 79.8%) or EMCI and LMCI (AUC = 81.1%) by measuring the PCC-BPCUN connectivity in APOE ɛ4 non-carriers, while in the APOE ɛ4 carriers the AUC values were more than 0.7. This suggests that the intrinsic connectivity yields a high level of accuracy in discriminating the AD spectrum population, which preferentially depends on the different pathological stage. Notably, no DMN FC could distinguish the four group populations at one time. Thus, the changes in the DMN FC strengths can serve as a neuroimaging biomarker at the preclinical stage to monitor the progression of the disease in a stage-dependent manner. In addition, the sensitivity of the ROC curve in the APOE ɛ4 non-carriers is higher than that of APOE ɛ4 carriers. We postulate that the brain network trajectory in the APOE ɛ4 carriers is obviously disrupted and destructive, and such a trajectory thereby results in less sensitivity at differentiating the pathological stage of AD [33, 99–101]. To date there are no clinically applicable non-invasive biomarker for detecting the early stages of AD spectrum [102, 103]. Positron emission tomography (PET) imaging of amyloid exposes patients to radiation and injection of radioactive agents and the cost is expensive [104, 105]. The limitation of measuring Aβ or tau from CSF or plasma is invasive process of sample collecting. And there is no guarantee of complete specificity and sensitivity for an early diagnosis or differential diagnosis from other dementias [103]. The transitions between stages of AD spectrum are subtle, and individuals may report cognitive decline even if neuropsychological tests do not show any impairment [106]. Given these facts, the diagnostic biomarkers should be easy to measure, preferably non-invasive, and widely available. The shift can be from invasive biomarkers of CSF and PET to blood biomarkers and MRI techniques [107–109]. Our results suggested that apart from generalcognitivefunctioning to be tested,for some patients that are difficult to assess or stagediagnosis, detecting the APOE genotype from patients’ blood samples and neuroimaging biomarkers derived from DMN connectivity data in rs-fMRI could provide objective evidence. The framework for integrating multi-level (APOE genotypes and DMN connectivity) biomarkers may help diagnose the stages of AD spectrum.
The present study has some limitations. First, this study is a cross-sectional design, and follow-up studies should be conducted to determine whether the altered FC identified here could be used as a stable biomarker for predicting AD progression. Second, only 8 APOE ɛ4 non-carriers in patients with AD were recruited, and this fact may limit the general use of the current findings, so more subjects should be enrolled in future studies. Third, previous genetic studies have identified some vulnerable genes that were related to cognitive impairment and affected by the resting-state brain function [110, 111]. Future research should explore the polygenetic effects on brain function by using a multilocus genetic imaging approach. Fourth, we use the significant DMN connectivity from our regression analysis to conduct a classification analysis. And we have found that these data could predict the progression of AD. It should be interpreted with caution because these data come from the same dataset. This is an exploratory classification method and we need to demonstrate this technique on a new dataset in the future study. Finally, it should be noted that this study is limited on the posterior DMN, and future work is necessary to investigate how the APOE genotype regulates anterior DMN or extend to other intrinsic connectivity networks.
Conclusions
We demonstrated different trajectories of DMN FC between APOE ɛ4 carriers and APOE ɛ4 non-carriers on the AD spectrum population. A moderation analysis revealed that intrinsic DMN connectivity could regulate the effects of the APOE genotype on cognitive impairment. Additionally, we propose that the DMN FC strength might be useful as imaging biomarkers for classifying the stages of the AD spectrum. These findings directly reveal the intrinsic effects of the APOE genotype on brain function and might provide novel insights into the mechanisms driving AD progression.
Footnotes
ACKNOWLEDGMENTS
This study was granted funding by the National Natural Science Foundation of China under grant numbers NSFC (81420108012), the National Key Projects for Research and Development Program of China (2016YFC1305800, 2016YFC1305802), the National Natural Science Foundation of China (81871069, 81671256, 81870850), the Key Project for Research and Development Program of Jiangsu Province (BE2018741, BE2015715), and the Nanjing International Joint Research and Development Project (201715013).
Data collection and sharing for this project was funded by the Alzheimer’s Disease
Neuroimaging Initiative (ADNI) (National Institutes of Health Grant U01 AG024904) and DOD ADNI (Department of Defense award number W81XWH-12-2-0012). ADNI is funded by the National Institute on Aging, the National Institute of Biomedical Imaging and Bioengineering, and through generous contributions from the following: AbbVie, Alzheimer’s Association; Alzheimer’s Drug Discovery Foundation; Araclon Biotech; BioClinica, Inc.; Biogen; Bristol-Myers Squibb Company; CereSpir, Inc.; Cogstate; Eisai Inc.; Elan Pharmaceuticals, Inc.; Eli Lilly and Company; EuroImmun; F. Hoffmann-La Roche Ltd and its affiliated company Genentech, Inc.; Fujirebio; GE Healthcare; IXICO Ltd.; Janssen Alzheimer Immunotherapy Research & Development, LLC.; Johnson & Johnson Pharmaceutical Research & Development LLC.; Lumosity; Lundbeck; Merck & Co., Inc.; Meso Scale Diagnostics, LLC.; NeuroRx Research; Neurotrack Technologies; Novartis Pharmaceuticals Corporation; Pfizer Inc.; Piramal Imaging; Servier; Takeda Pharmaceutical Company; and Transition Therapeutics. The Canadian Institutes of Health Research is providing funds to support ADNI clinical sites in Canada. Private sector contributions are facilitated by the Foundation for the National Institutes of Health (![]() ). The grantee organization is the Northern California Institute for Research and Education, and the study is coordinated by the Alzheimer’s Therapeutic Research Institute at the University of Southern California. ADNI data are disseminated by the Laboratory for Neuro Imaging at the University of Southern California.
). The grantee organization is the Northern California Institute for Research and Education, and the study is coordinated by the Alzheimer’s Therapeutic Research Institute at the University of Southern California. ADNI data are disseminated by the Laboratory for Neuro Imaging at the University of Southern California.