
Abstract
Background:
Adults with Down syndrome (DS) are at very high risk for Alzheimer’s disease (AD). Neurofilament light (NF-L) has emerged as a potential blood-based biomarker of neurodegeneration due to AD.
Objective:
To understand the relationship between plasma NF-L with age, brain amyloid, and tau pathology, neurodegeneration as well as cognitive and functional performance.
Methods:
We analyzed imaging data as well as cognitive measures in relation to plasma NF-L in adults with DS, ages 30 to 60 who were enrolled in the Down Syndrome Biomarker Initiative.
Results:
We found significant correlations between NF-L plasma concentrations and amyloid pathology (r = 0.73, p = 0.007, p a = 0.041) and significant inverse correlations with regional glucose metabolism in 5 of 6 regions examined, which were Anterior cingulate (r = –0.55, p = 0.067, p a = 0.067), Posterior cingulate r = –0.90, p < 0.001, p a < 0.001), Lateral Temporal (r = –0.78, p = 0.004, p a = 0.012), Frontal cortex (r = –0.90, p < 0.001, p p a < 0.001), Parietal cortex (r = –0.82, p = 0.002, p a = 0.008), Precuneus (r = –0.73, pa = 0.010, p a = 0.020), and with hippocampal volume (r = –0.52, p = 0.084, p a = 0.084); and an inverse correlation with direct measures of cognition: CAMCOG (r = –0.66 p = 0.022, p a = 0.066) and positive correlation with CANTAB Paired Associates Learning (PAL) error rate (r = 0.68, p = 0.015, p a = 0.060). Finally, we found inverse relationships with informant-based functional measures (r = –0.57, p = 0.059, p a = 0.084) and OMQ-PF (r = –0.74, p = 0.008, p a = 0.041).
Conclusion:
Plasma NF-L is associated with progressive neurodegeneration as well as with declines in cognitive and functional measures in adults with DS.
INTRODUCTION
Nearly all adults with Down syndrome (DS) develop amyloid plaques and neurofibrillary tangles consistent with AD pathology as they reach their forties [1] and represent the world’s largest population genetically predisposed to developing early onset AD [2]. There is a critical need for validated blood-biomarkers of AD to support the diagnosis of AD in DS. Neurofilament light (NF-L) is one of the scaffolding cytoskeleton proteins of myelinated subcortical axons [3, 4] and can now be reliably measured in blood using ultrasensitive single-molecule array (Simoa) technology. Recent work on NF-L has demonstrated potential utility in diagnosis of neurodegeneration due to AD in autosomal dominant AD [5] as well as individuals with DS [6, 7]. In the present study, we aimed to explore the relationship between plasma NF-L levels and AD biomarkers such as amyloid PET, Tau PET, hippocampal volume, and cognitive and functional measures in individuals with DS.
METHODS
Subject selection
Twelve adults diagnosed with DS, age 30–60 years, were enrolled in the Down Syndrome Biomarker Initiative (DSBI), with subject inclusion and exclusion criteria described previously [8]. All had baseline cognitive testing, APOE genotyping, brain MRI, FDG PET, and amyloid PET scans, and nine had tau PET scans (Table 1). All participants provided written informed consent. Ethical approval for this study was obtained from the University of California, San Diego IRB committee.
Characteristics by APOE ɛ4 carriage. Mean (standard deviation) for continuous variables and counts (percentages) for APOE
Volumetric MRI
The MRI protocol included series to assess structural pathology (T2-weighted fluid attenuated inversion recovery, T2*-weighted gradient recalled echo, and diffusion weighted imaging) along with a series modeled on the non-accelerated T1-weighted sequence from ADNI for volumetric processing (3D inversion recovery prepared spoiled gradient recalled imaging; inversion time 500, flip angle 10, 1.25 mm×1.25 mm in-plane resolution, 156 sagittal slices with 1.2 mm spacing). Scanning was performed on a 1.5 Tesla GE Signa HDxt scanner, and a radiologist overread was performed on all scans to identify any clinically significant incidental findings. NeuroQuant image preprocessing and automated segmentation were used to measure brain structure volumes [9]. To minimize multiple comparisons, for analysis, a single measure of medial temporal atrophy that comprises hippocampal volume loss and temporal horn ex-vacuo dilatation, “Hippocampal occupancy (HOC),” was calculated as described previously [9]. This measure is simply H/(H + T), where H is hippocampal volume and T is temporal horn volume. In addition, the MRI for each subject was spatially transformed to a common template using the DARTEL algorithm [10] in the VBM8 toolbox of SPM8 (Wellcome Trust).
Florbetapir F18 PET
Subjects received IV injections of 10 mCi of Florbetapir F18 and after 40 min of uptake, 10 min of emission data were collected by a Siemens EXACT HR+961 PET scanner (CTI, Knoxville, TN, USA) as described previously [11]. The amyloid PET scans were co-registered with their respective MRI scans. A set of pre-defined template volumes of interest (VOIs) including frontal, anterior cingulate, posterior cingulate, precuneus, lateral temporal, parietal cortex, and whole cerebellum as the reference region was transformed using to the native scan of each subject through application of the spatial transformation derived using the coregistered MRI. Cortical regions were masked using the thresholded gray segment of each subject’s co-registered MRI. A cortical average SUVR was calculated as the average of the six target regions divided by the whole cerebellum value. Amyoid status was also examined by visual inspection.
Flortaucapir F18 PET
Tau PET scans were acquired on a Siemens ECAT HR + scanner from 75 to 105 min post tracer injection in six 5 min frames, using 10 mCi (370 MBq) of 18F-AV-1451 and processed as described previously [12]. Tau PET images were smoothed, co-registered to their respective MRI scans, and transformed to template space using the MRI-derived transforms. To evaluate distribution and extent of tau burden, region of interest (ROI) masks representing six tau Braak stages were developed using combinations of the relevant anatomical structures derived by Freesurfer, based upon prior literature [13]. SUVR values were calculated using the Braak stage masks and cerebellar cortex as the reference region, and an eroded white matter reference region for comparison.
FDG PET
FDG PET images were acquired for all DS subjects on the Siemens ECAT Exact HR + scanner according to the ADNI-2 FDG protocol (ADNI-2 PET Technical Procedures Manual, v1.0, 2011), reconstructed, and processed as described previously [11]. After the injection of 5 mCi of 18F-FDG, subjects were kept in a quiet, dimly lit room with eyes and ears unoccluded for 30 min, after which they were placed in the PET scanner. Emission data was acquired in six 5 min frames, followed by a 7 min transmission scan, reconstructed, smoothed, and co-registered to their MRI scans. Regions of interest were mapped to the native FDG scans using the MRI transform. SUVRs were measured for posterior cingulate, precuneus, anterior cingulate, prefrontal cortex, hippocampus, and medial temporal cortex (including hippocampus), referenced to cerebellum and pons.
Cognitive and functional outcome measures
Cambridge Examination for Mental Disorders of Older People with Down’s Syndrome and Others with Intellectual Disabilities (CAMDEX-DS). Cognitive status was measured using the Cambridge Cognitive Examination (CAMCOG), the cognitive section of CAMDEX, a composite index of episodic memory, orientation, language, attention, praxis, and executive function previously validated for use in DS [14].
CANTAB Paired Associated Learning (PAL)
In this task, The subject is shown 2–8 (max) distinct visual patterns, each at one of eight positions inside of an octagon on the screen. The task is to memorize which pattern occurred where. After the memorization stage, each pattern is shown in the center of the screen and the subject has then to touch one of eight possible positions where the pattern first occurred [15].
Observer memory questionnaire-parent form (OMQ-PF)
The OMQ-PF is a 27-item questionnaire designed to ascertain parents’/caregivers perceptions of the subject’s memory function. This questionnaire is comprised of items inquiring about memory function in everyday scenarios [16].
Vineland-II Adaptive Behavior Scale (VABS-II) parent/caregiver interview form
The VABS-II measures personal and social skills such as communication, daily living skills, and socialization and provides a composite score reflecting an individual’s overall function. In addition, the optional maladaptive behavior index could be used. The survey interview form was administered to parents or caregivers using a semi-structured interview format [17]. A higher score indicates better functioning.
Plasma NF-L description
Plasma samples were collected, processed, aliquoted, and frozen at –80°C according to standardized procedures. Plasma NF-L was measured using the ultrasensitive Quanterix SIMOA HD-1 assay using Simoa NF-light® assays and published protocols for DS [5]. All measurements were performed by specially trained personnel in one round of experiments using one reagent lot.
Statistical analysis
Spearman correlations (ρ) and exact p-values were computed for each correlate of interest with plasma NF-L. The p-values are presented with (p a ) and without (p) multiple comparisons adjustment [18]. The adjustment provides control of the family-wise error rate separately for four families of hypotheses: 1) cognition and key imaging summaries, 2) tau PET, 3) FDG PET, and 4) amyloid PET. Each family consists of six tests. Analyses were conducted using R (version 3.5.1; R-project.org).
RESULTS
We measured plasma NF-L levels in the 12 DSBI participants at baseline. We found mean plasma NF-L was 34.98 pg/ml (with a range of 5.79–71.73 pg/ml). Plasma-NF-L levels were compared to brain amyloid measures using florbetapir PET and found to have a statistically significant positive correlation (r = 0.73, p = 0.007, p a = 0.041) (Fig. 1a). Increased levels of plasma NF-L were found to correlate with worse performance on a direct measure of cognition CAMCOG (r = –0.66, p = 0.022, p a = 0.066) (Fig. 1b) and greater errors on CANTAB Paired Associate Learning (0.68, p = 0.015, p a = 0.060) (Fig. 1c). Plasma NF-L levels inversely correlate with functional performance as measured by the Vineland-2 scale (r = –0.57, p = 0.059, p a = 0.084) (Fig. 1d), as well as hippocampal volume (r = –0.52, p = 0.084, p a = 0.084) (Fig. 1e) and scores on informant-based measures of memory functioning OMQ-PF (r = –0.74, p = 0.008, p a = 0.041) (Fig. 1f). Only florbetapir PET and OMQ-PF were significant at the 5% level after adjusting for multiple comparisons in this family of tests.
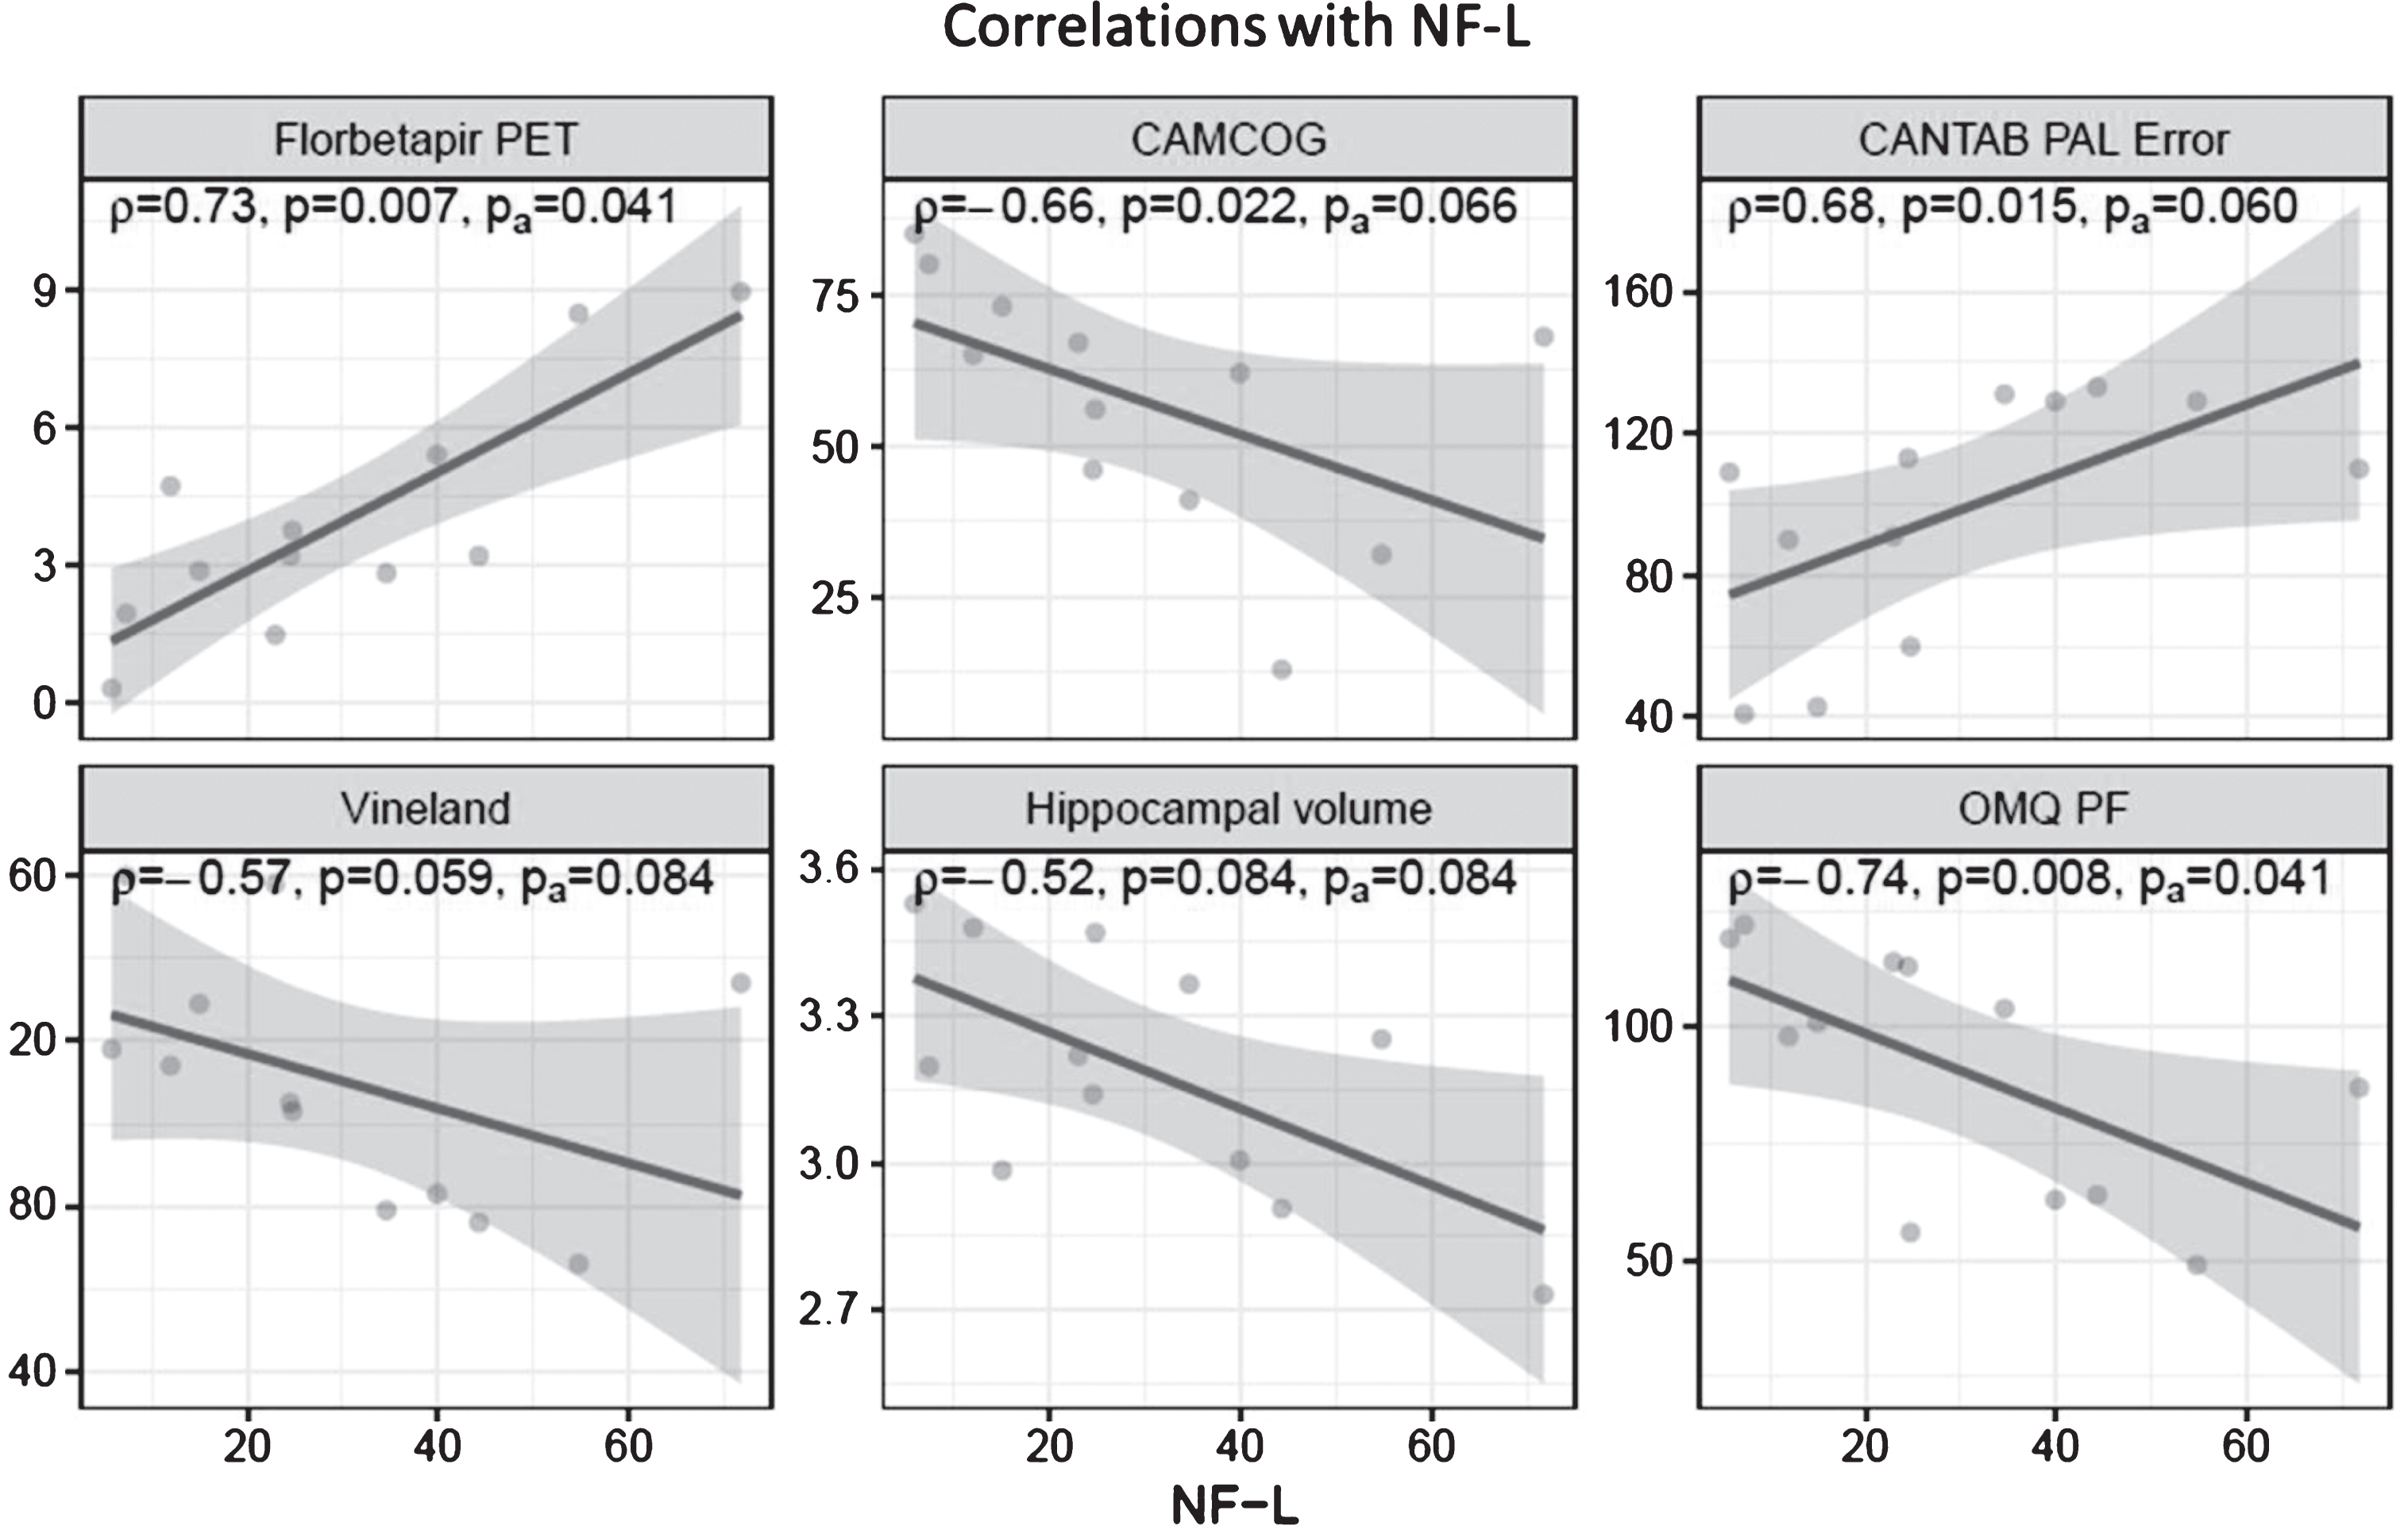
Correlations of Plasma NF-L with a) brain amyloid; b) CAMCOG total score; c) CANTAB PAL Errors; d) Vineland Score; e) Hippocampal volume; f) OMQ-PF score. Plasma NF-L correlates with amyloid burden and error rate on the CANTAB paired associates learning. It inversely correlates with performance on CAMCOG, Vineland-2, hippocampal volume, and observer Memory Questionnaire – parent form (OMQ-PF). Only Spearman correlations with amyloid burden and OMQ-PF retain significance at the 5% level after Hochberg adjustment for multiple comparisons (pa).
We found positive correlations between plasma NF-L and neurofibrillary tangles as measured with flortaucapir PET across Braak stages, but none were significant after multiple comparisons adjusment: Braak I (r = 0.72, p = 0.037, p a = 0.184); Braak II (r = 0.23, p = 0.552, p a = 0.552), Braak III (r = 0.60, p = 0.097, p a = 0.290); Braak IV (r = 0.68, p = 0.050, p a = 0.201); Braak V (r–0.72, p = 0.037, p a = 0.184); Braak VI (r–0.25, p = 0.521, p a = 0.552) (Fig. 2) and inverse correlations with regional cerebral glucose metabolism as measured with FDG PET: Anterior cingulate (r = –0.55, p = 0.067, p a = 0.067). Post cingulate r = –0.90, p < 0.001, p a < 0.001), Lateral Temporal (r = –0.78, p = 0.004, p a = 0.012), Frontal lobe (r = –0.90, p < 0.001, p a < 0.001), Parietal lobe (r = –0.82, p = 0.002, p a = 0.008), Precuneus (r = –0.73, p = 0.010, p a = 0.020). Reference region is cerebellum (Fig. 4). Plasma-NF-L correlates with regional amyloid PET SUVRs: Anterior cingulate gyrus (r = 0.71, p = 0.013, p a = 0.027), Posterior cingulate gyrus (r = 0.85, p < 0.001, p a = 0.002), Lateral temporal lobe (0.85, p≤0.001, p a = 0.002), Frontal lobe (0.71, p = 0.013, p a = 0.027), Lateral parietal lobe (r = 0.62, p = 0.032, p a = 0.032), Precuneus (r = 0.78, p = 0.003, p a = 0.012) (Fig. 3).
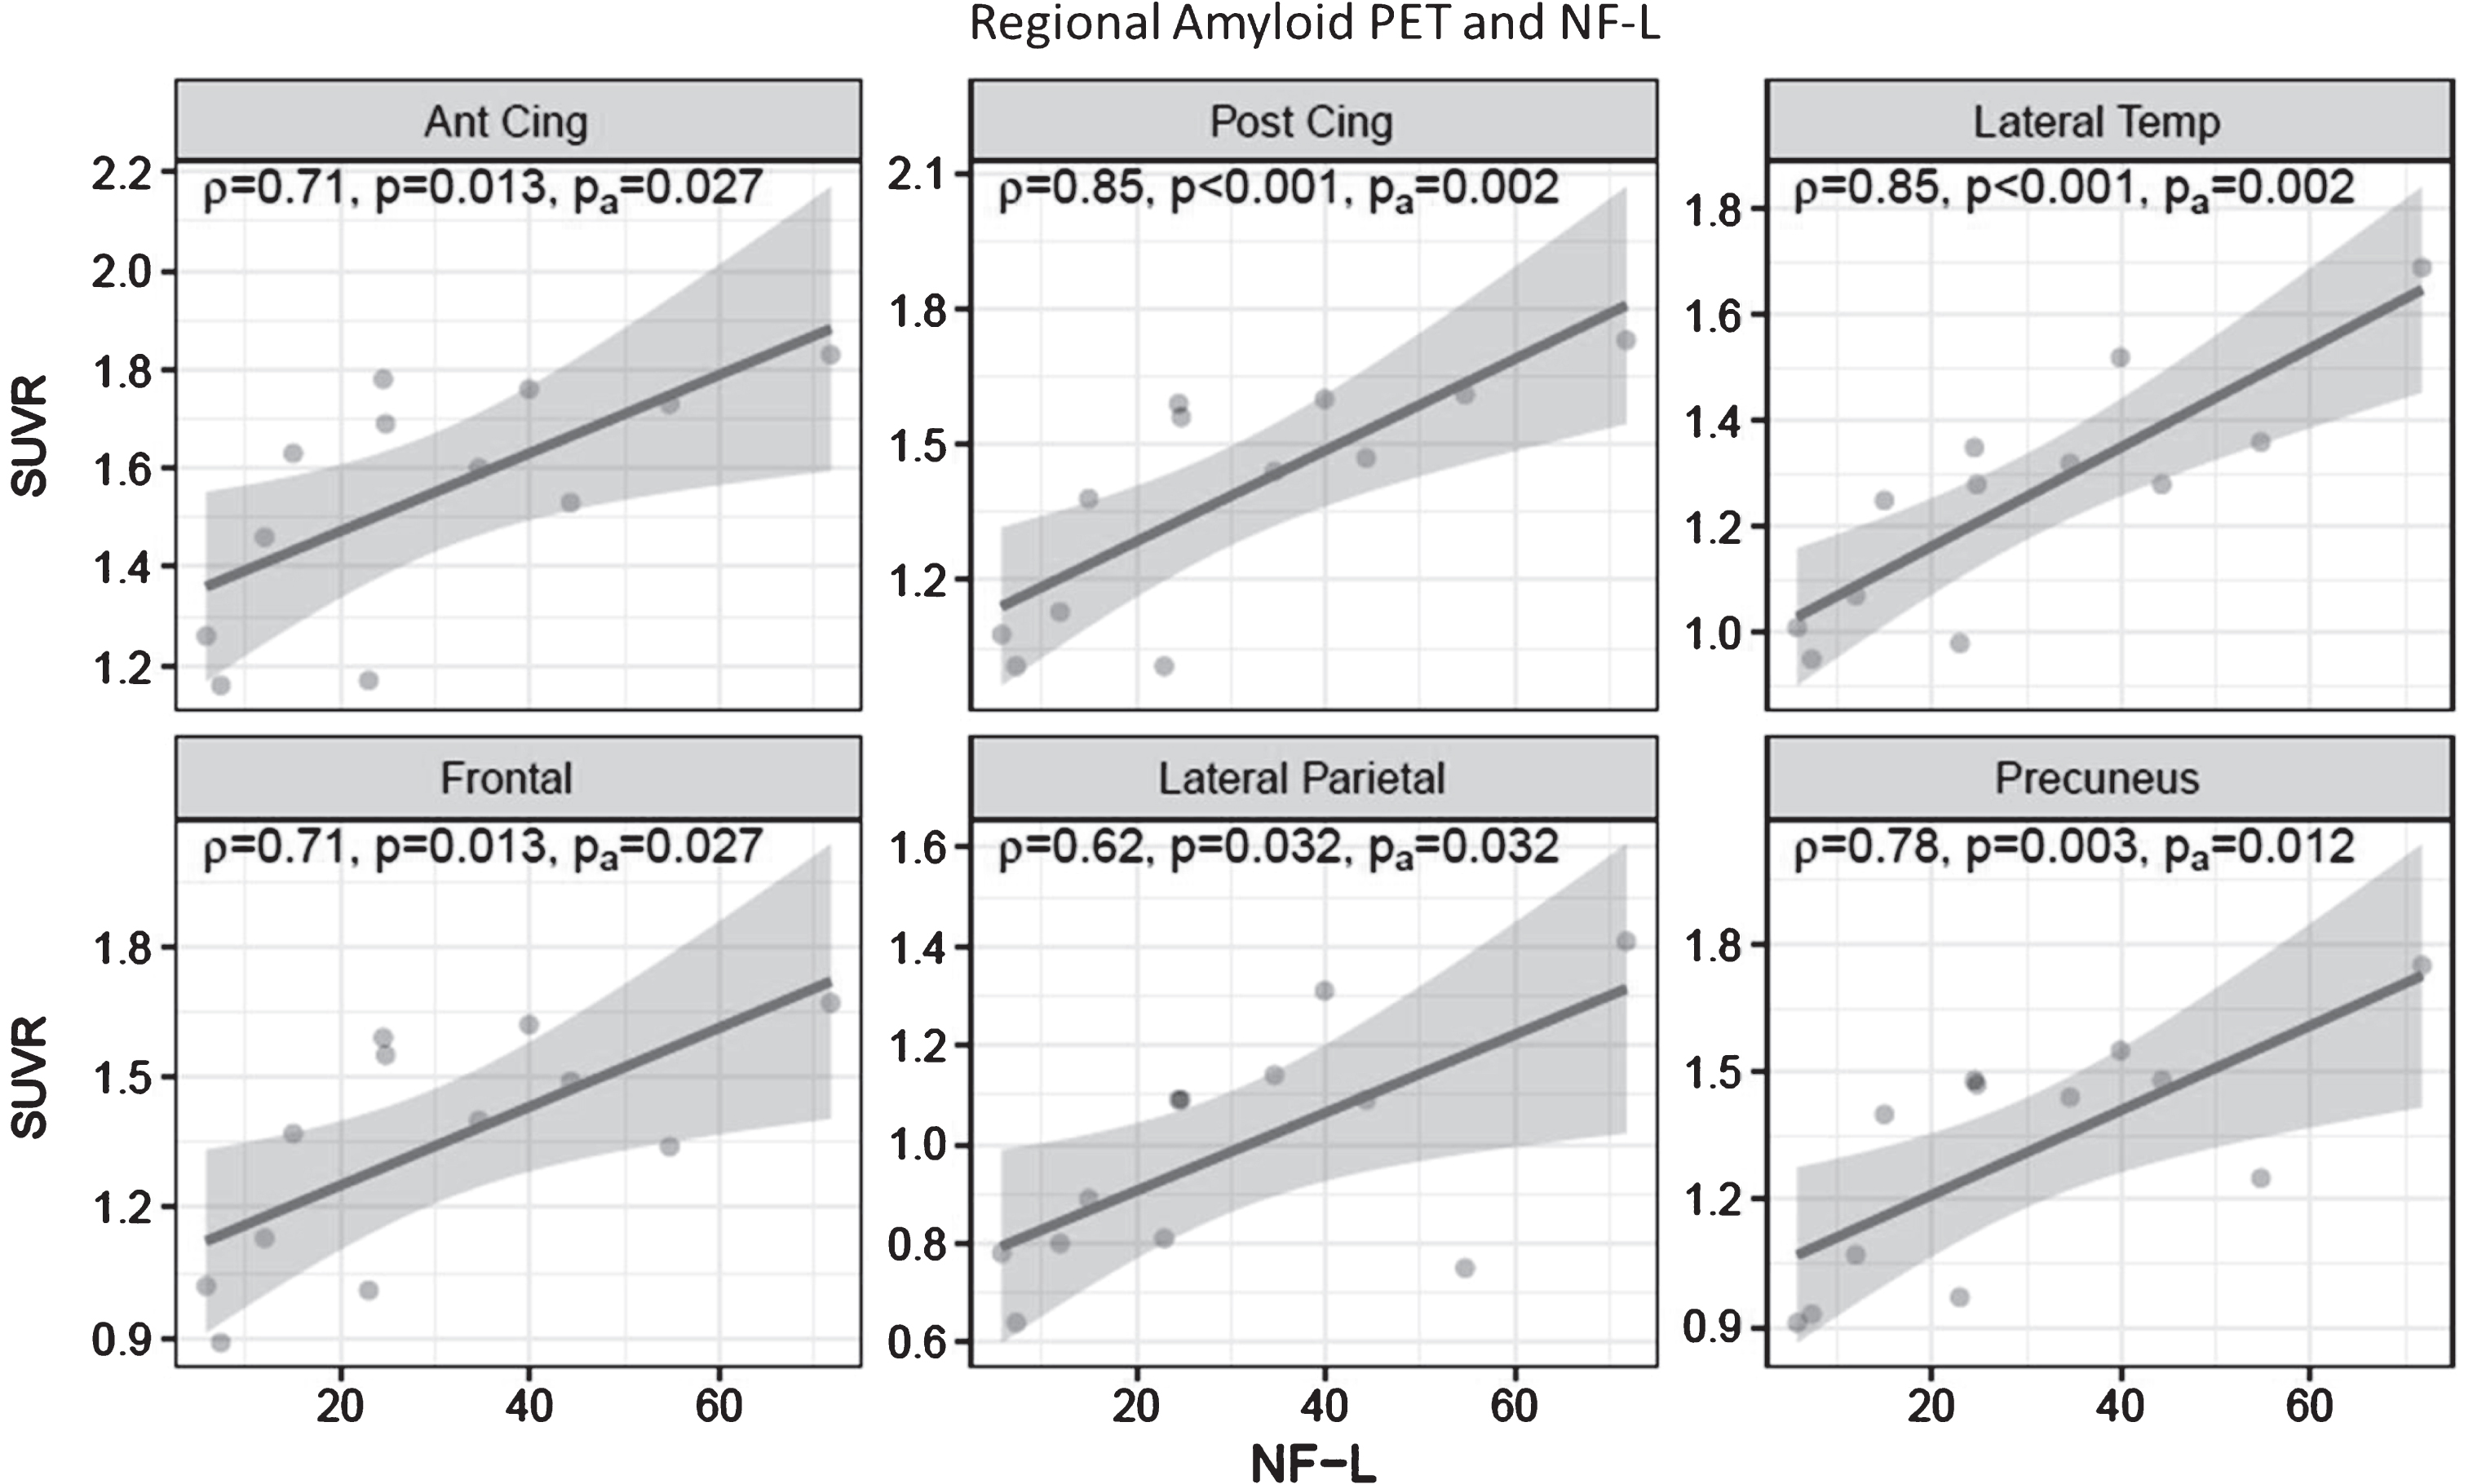
Correlation of Plasma NF-L and Regional Amyloid PET. There is increased regional amyloid associated with increased plasma NF-L levels. All of the Spearman correlations retain significance at the 5% level after Hochberg adjustment for multiple comparisons (pa).

Correlation of Plasma NF-L and tau burden by Braak stage. Plasma NF-L increases with increasing tau pathology. None of the Spearman correlations are significant at the 5% level after Hochberg adjustment for multiple comparisons (pa).

Correlation of Plasma NF-L and Regional FDG PET. There is decreased regional glucose metabolism associated with increased plasma NF-L levels. All of the Spearman correlations, with the exception of anterior cingulate, retain significance at the 5% level after Hochberg adjustment for multiple comparisons (pa).
DISCUSSION
This is the first study to directly show that plasma NF-L levels correlate with standard biomarkers of AD pathology such as amyloid PET, tau PET, hippocampal atrophy and cognitive and functional decline. In terms of neuroimaging biomarkers, we find that plasma NF-L correlates in a statistically significant way with amyloid load (florbetapir PET) as well as with markers of neurodegeneration (regional cerebral glucose metabolism as assessed with FDG PET and hippocampal atrophy). Specifically, in regions that are important to AD pathophysiology (i.e., precuneus and posterior cingulate gyrus), there were statistically significant relationships with plasma NF-L. In addition, with regards to direct measures of cognition, plasma NF-L inversely correlates with CAMCOG score and positively correlates with error rates on Paired Associates Learning (PAL). For informant-based measures, plasma NF-L inversely correlates with Vineland-II score and the Observer Memory Questionnaire – Parent Form (OMQ-PF). Interestingly, NF-L did not correlate as strongly in our sample with tau PET as it did with amyloid PET and FDG PET. One possible explanation for this finding may be that abnormalities in tau may occur much later than amyloid plaque formation and regional hypometabolism in the AD disease continuum in DS.
This study and its findings are considered exploratory due to the small sample size but extend recent findings on NF-L in DS. The mean levels found in this study at ∼34 pg/ml are in range with other studies in DS [5, 6]. Despite the small sample size, the data shows trends that withstand multiple comparison adjustment suggesting that NF-L has the potential to identify evidence of neurodegeneration due to AD in DS. Indeed, others have reported correlations with clinical status and diagnosis of dementia. One weakness of this study is that the data presented are cross sectional. Longitudinal data is being analyzed and will be presented in subsequent reports. In addition, given the small sample size, we could not adjust for premorbid level of intellectual disability although it should be noted that none of the participants reached profound disability.Nonetheless, it remains to be further clarified to what extent elevated NF-L levels are due to DS per se, as opposed to being due to AD-related neurodegeneration.If these findings with NF-L are further validated using a larger study population, this biomarker could be of tremendous value in tracking disease progression related to AD in DS.
DISCLOSURE STATEMENT
Authors’ disclosures available online (https://www.j-alz.com/manuscript-disclosures/19-0322r1).
Footnotes
ACKNOWLEDGMENTS
We would like to thank Ana Lukic and Randolph Andrews for their assistance in image processing.