



Abstract
Background:
Stroke is a major cause of cognitive impairment and dementia. However, the underlying mechanisms beyond post-stroke cognitive impairment (PSCI) are not fully explained to date.
Objective:
We studied the contribution of vascular pathology measures to PSCI, separate from and in conjunction with pathologic markers associated with Alzheimer’s disease (AD).
Methods:
Data from 397 cognitively intact ischemic stroke patients were available. All patients underwent 3T MRI and evaluated for white matter hyperintensity volume (WMHV) and integrity, ischemic lesions, small vessel disease (SVD) markers and grey matter (GM), hippocampal and cerebrospinal fluid (CSF) volumes. Comprehensive cognitive tests were performed on admission and after two years. We used multiple regression to evaluate the contributions of vascular pathology measures (Framingham risk score, WMHV, and existence of SVD) and AD-associated markers (apolipoprotein E4 status and hippocampal volume).
Results:
During two years follow-up, 80 participants (20.2%) developed PSCI. Low GM and cortex volume and high WMHV and CSF volume, but not the new lesion volume, predicted the development of PSCI in a dose-dependent relationship (p = 0.001). Vascular related imaging markers and risk factors predicted PSCI better than AD related markers (p < 0.001).
Conclusions:
Brain structural measures, including total GM volume, WMHV, and CSF volume were independently associated with PSCI and may serve as early biomarkers for risk prediction. In our sample, vascular pathology measures contributed significantly better to PSCI prediction than markers associated with AD. The newly detected ischemic lesion has not emerged as biomarker for PSCI risk, thus maybe a part of the ongoing vascular pathology.
INTRODUCTION
Cerebrovascular disease is the second most frequent cause of dementia [1]. About 20% of patients suffering from stroke will develop dementia, and a much larger undetermined portion will develop mild cognitive impairment (MCI) [2, 3]. However, the underlying mechanisms beyond post-stroke cognitive impairment (PSCI) are not fully explained to date.
Although in some cases the cognitive impairment appears adjacent to the ischemic event, directly connecting the acute ischemic to the cognitive impairment, in others, the cognitive impairment develops months or even years after the event [4]. The question remains whether the ischemic event is a marker of ongoing cerebrovascular disease progressing to vascular dementia, or whether the cognitive impairment is a consequence of other neurodegenerative processes, unrelated to the ischemic event. A double hit mechanism may also be suggested [4].
The aim of this study was to contribute to the understanding of PSCI mechanism by evaluating the contribution of vascular pathology, separate from and in conjunction with Alzheimer’s disease (AD) related measures.
METHODS
Study population
Participants were enrolled from the Tel-Aviv Brain Acute Stroke Cohort (TABASCO) [5], which included 575 consecutive patients with mild to moderate first-ever acute ischemic stroke or transient ischemic attack (TIA). The present analysis included all patients who underwent MRI acquisition during admission and completed follow-up cognitive assessment two years after. MRI scans were acquired during admission within 7 days of stroke onset, unless patients were contraindicated or unable to perform the examination.
Volumetric analysis of brain structures
Volumetric analysis was performed on a 3D T1-WI axial fast SPGR sequence using the FreeSurfer V5.1 image analysis suite, well documented and freely available software (http://surfer.nmr.mgh.harvard.edu/) [6–8] with careful manual correction. Based on the automated segmentation, we extracted the volumes of interest: hippocampus, thalamus, global gray matter (GM), global white matter (WM), white matter hyperintensity volume (WMHV), ventricular cerebrospinal fluid (CSF) volume, and total intracranial volume. Quantification of total brain volume (TBV) was performed using the freely available Functional MRI of the Brain Software Library (http://fsl.fmrib.ox.ac.uk/fsl/fslwiki/) [9].
Cortical thickness measurement
Reconstruction of the cortical surfaces and measurement of cortical thickness for each lobe were performed using the FreeSurfer toolkit (version 5.1). This method of estimating the thickness of the cortex has been validated histologically [10] and by manual measurement on MRI sections [11, 12]. As previously described, the pial surface of each hemisphere was computed by deforming the tessellated WM surface outward toward the GM-CSF boundary. The distance between the WM surface and pial surface yields an estimate of cortical thickness at each vertex [7, 13]. Cortical thickness estimates are obtained as follows. For each point on the gray/white surface, the shortest distance to the pial surface is first computed. Next, for each point on the pial surface, the shortest distance to the gray/white is identified, and the cortical thickness at that location is set to the average of these two values.
Ischemic infarct identification
The identification of the ischemic lesion was previously described in Kliper et al. [14]. Briefly, ischemic lesions were defined as cortical, sub-cortical, or subtentorial infarcts according to their anatomical locations based on structural MRI images. Cortical infarcts were defined as any infarct that includes the cortex; subtentorial infarcts were defined as cerebellar or brainstem infarctions.
DTI analysis and tissue segmentation
Calculation of the DTI maps and tissue segmentation into ischemic lesions, WMHV, and normal-appearing white matter (NAWM), were performed as previously described by Kliper et al. [14]. The analyses were based on multi-modal view with an in-house semi-automatic method [15] based on the FMRIB Software Library (FSL, http://www.fmrib.ox.ac.uk/fsl/) and SPM5 software (www.fil.ion.ucl.ac.uk/spm/software/spm5). Four different DTI maps were calculated: fractional anisotropy (FA), mean diffusivity (MD), axial and radial diffusivities (Da and Dr). Next, volumes (in mm3) of both ischemic lesions and WMHV were calculated across the whole brain. Mean FA, MD, Dr, and Da values were calculated for WML and NAWM tissue clusters. All segmentation results were visually inspected and manually corrected.
Small vessel disease (SVD) markers
All MRI scans were fully evaluated for SVD radiological markers according to the STRIVE protocol [16]. Images were rated by three raters (EA, JM, and EK) who were blinded to the clinical outcome [17]. SVD markers included: 1) White matter hyperintensities (WMH) were graded using Fazekas score [18, 19]; 2) Old lacunar infarcts were defined as sharply demarcated hypointense lesions sized between 3 mm and 15 mm in diameter on T1-weighted images with corresponding hypointense lesions with hyperintense rim on T2 dark fluid [16]; 3) Cerebral microbleeds (CMB) were defined as round hypointense lesions on SWI with a diameter <10 mm. In order to rule out CMB mimics, other sequences including DWI and T1 were evaluated. CMBs were divided to lobar and deep [16, 20]; 4) Enlarged perivascular spaces were defined as smooth margin, round, oval or linear-shaped lesions, sized up to 3 mm, with signal intensity equal to CSF on T2-weighted images. Enlarged perivascular spaces at the level of the basal ganglia as well as at the level of centrum semiovale in the most involved hemisphere were counted [16, 21].
Baseline and follow-up cognitive assessments
Patients underwent a baseline neuropsychological assessment including the Montreal Cognitive Assessment (MoCA) [22] and the NeuroTrax computerized cognitive testing (NeuroTrax Corp., Bellaire, TX) [23] during their first days of hospitalization post stroke. These comprehensive neuropsychological evaluations were again conducted 24 months after the stroke. A Global Cognitive Score was computed as the average of the six index scores (memory, executive functions, visuospatial perception, verbal function, attention, and motor skills). Data for each outcome parameter of the NeuroTrax battery were normalized according to stratifications of age (50 to 70 years, >70 years) and education (≤12 years, >12 years) to give a distribution with a mean of 100 and a standard deviation of 15 (i.e., an IQ-style scale).
Criteria for cognitive impairment
Patients with cognitive decline were diagnosed as having either MCI or dementia. In order to diagnose MCI, the modified Petersen criteria [24] was applied: the subject had to be impaired (≥1.5 SD) on at least 1 cognitive domain compared with age and education matched published norms on the NeuroTrax computerized cognitive testing, as previously described [25, 26], to have no impairment of basic functional activities, and to not fulfill the DSM IV-TR criteria for dementia.
Participants with suspected cognitive impairment were referred to an experienced cognitive neurologist (ADK) for assessment. Included were patients who could not complete the MoCA or whose NeuroTrax or MoCA tests had fallen by >1.5 SD in follow-up examinations, those with subjective cognitive complaints or who were suspected by a senior neurologist of having cognitive impairment.
Assessments were further reviewed by a consensus forum to determine whether the participant had dementia or MCI. The forum included the assessor, three senior neurologists specializing in memory disorders and a neuropsychologist.
Vascular risk factors
Vascular risk factors were assessed according to the Framingham Stroke Risk Profile (FSRP) score [27]. FSRP is based on the following risk factors: age, systolic blood pressure, antihypertensive medication, diabetes, cigarette smoking, history of cardiovascular disease, atrial fibrillation, and left ventricular hypertrophy as determined by ECG. As ECG data were not available, and since FSRP is purely additive in nature, the left ventricular hypertrophy was removed from the present analysis. Vascular risk factor data was recorded as described in Ben Assayag et al. [5] and for each patient the FSRP score was calculated.
Statistical analysis
Baseline characteristic and risk factors are presented as means and standard deviations for continuous variables and as frequencies and percentages for categorical variables. Chi-square tests and independent t-tests were performed to compare demographic data and risk factors, for categorical and continuous variables, respectively. Multivariate analysis for prediction of cognitive outcome two years post-stroke was performed by logistic regression model, and odds ratios with 95% confidence intervals were calculated. The analyses included independent variables/covariates that were statistically significant in the univariate analyses. Model suitability to the events rates observed was evaluated by the Hosmer-Lemeshow statistics at baseline. We used multivariable Cox regression to examine the associations of MRI and cognitive measures with incidence of cognitive impairment two years post-stroke. Independent variables were defined as continuous or dichotomous. Brain MRI measures were divided into cohort-specific quartiles, and the most abnormal quartiles (for GM, hippocampal, and cortical volume, this is the bottom quartile and for WMHV and CSF the top quartile) were compared with the rest. The models were adjusted for independent variables/covariates that were statistically significant in the univariate analyses: age, years of education, and stroke severity (NIHSS at admission). We ran Cox-proportional hazards models relating the number of identified predictor variables for stroke to risk of PSCI and illustrate these using cumulative hazard function. We used a multistage multiple regression approach to evaluate the contributions of vascular pathology measures or pathologic changes/measures known as associated with AD to cognitive performance. The independent variables were the Framingham risk score and neuroimaging measures of vascular pathology (WMHV, lacunes, and CMB) and pathologic changes/measures known as associated with AD (apolipoprotein E4 (APOE4) status and hippocampal volume). The baseline stage of the model included demographic variables: sex, age, and educational level. In the second stage, we evaluated whether each measure considered separately, was associated with cognition. In the third stage, we evaluated the joint and independent effects of pathologic markers by adding all to the baseline demographic model. This approach was adopted to describe the effects of each type of pathologic change when considered alone, then to investigate their independent contributions when considered together. Finally, receiver operating characteristic (ROC) curves with corresponding areas under the curves (AUCs; neutral value 0.50 = risk prediction by pure chance) and 95% CIs were constructed for the vascular versus AD-related measures. Significant difference between AUC for the vascular versus AD-related measures was tested using χ2 test. A 2-tailed α level of 0.05 was used to determine statistical significance. Analyses were performed using SPSS software version 25.0. (SPSS Inc. Headquarters, 233 S. Wacker Drive, 11th floor Chicago, Illinois 60606, USA).
RESULTS
Study population
A total of 575 consecutive eligible cognitive intact patients who were admitted to the Department of Emergency Medicine at Tel-Aviv Medical Center between April 1, 2008 to December 1, 2014, within 72 h from onset of symptoms of TIA or stroke were initially evaluated. Of these, cognitive assessments at baseline and 2 years later were available for 507 subjects. Brain MRI scans at baseline were available for 397 of the subjects who had cognitive data, and these were included in the final analysis. The mean age was 66.9±9.7 years; 56.9% were male.
Stroke etiologies according to the TOAST criteria [28] were as follows: 207 lacunar stroke (52.2%), 49 cardioembolic stroke (12.3%), 40 large-artery atherosclerotic stroke (10%), 101 stroke of other or undetermined etiology (25.5%). Table 1 lists the demographic information, neuroimaging characteristics, and average cognitive scores for the cohort.
Demographics of intact and impaired patients’ groups
Entries are mean (SD) or n and %, as indicated. IQR, interquartile range; NIHSS, National Institutes of Health Stroke Scale; GDS, Geriatric Depression Score; MoCA, Montreal Cognitive Assessment; MRI, magnetic resonance imaging; CSF, cerebrospinal fluid; WMHV, white matter hyperintensity volume; NAWM, normal-appearing white matter; FA, fractional anisotropy; MD, mean diffusivity; Dr, radial diffusivity; Da, axial diffusivity.
Association of brain MR imaging measurements with specific cognitive domains
Table 2 summarizes the association of MR imaging brain volume measurements with specific cognitive domains as measured by the NeuroTrax computerized cognitive testing battery. All associations adjusted for age, sex, education, and NIHSS at admission. The domains most strongly correlated with individual brain structural measures were executive function and attention. Memory had a significant interaction with frontal cortex thickness only. The WM and GM volumes and WM microstructural integrity measures (reflected as FA and MD) were associated with executive function, attention and the global cognitive score, while hippocampal volume was only associated with the global cognitive score.
Magnetic resonance imaging brain volumes and association with domain-specific cognitive scores 24 months post-stroke, adjusted for age, sex, years of education and NIHSS at admission
NIHSS, National Institutes of Health Stroke Scale; ICV, intracranial volume; WM, white matter; GM, gray matter; CSF, cerebrospinal fluid; WMH, white matter hyperintensity; NAWM, normal-appearing white matter; FA, fractional anisotropy; MD, mean diffusivity.
Predictors of post-stroke cognitive impairment (PSCI)
During the two years follow-up period, most patients improved their global cognitive function from admission to 24 months (208, 52.4%), while 109 (27.5%) retained the same cognitive results and 80 participants developed clinically significant cognitive impairment (20.1%). Of these, 9 patients (2.3%) developed dementia and 71 patients (17.9%) developed MCI. Univariate and multivariate predictors for cognitive impairment are shown in Table 3. In this sample of stroke patients, MRI measures that predicted future PSCI were: TBV, GM, WMH, hippocampal, cortex, and CSF volume, as well as WM microstructural integrity and lobar microbleeds on MRI. However, only low GM and frontal cortex volume, high WMHV, and high CSF volumes remain strong predictors following adjustment for age, sex, education, and NIHSS at admission and doubled the risk to develop PSCI two years from the index event (HR, 2.55; 95% CI, 1.16–5.59, HR, 2.65; 95% CI, 1.15–6.11 and HR, 3.06; 95% CI, 1.45–4.9, respectively) (Table 3). There was a dose-dependent relationship between the number of MRI indicators and the risk of developing PSCI (p = 0.001) (Fig. 1). The new ischemic lesion volume did not predict development of PSCI, nor did the location (anatomical region or side) of the new lesion.
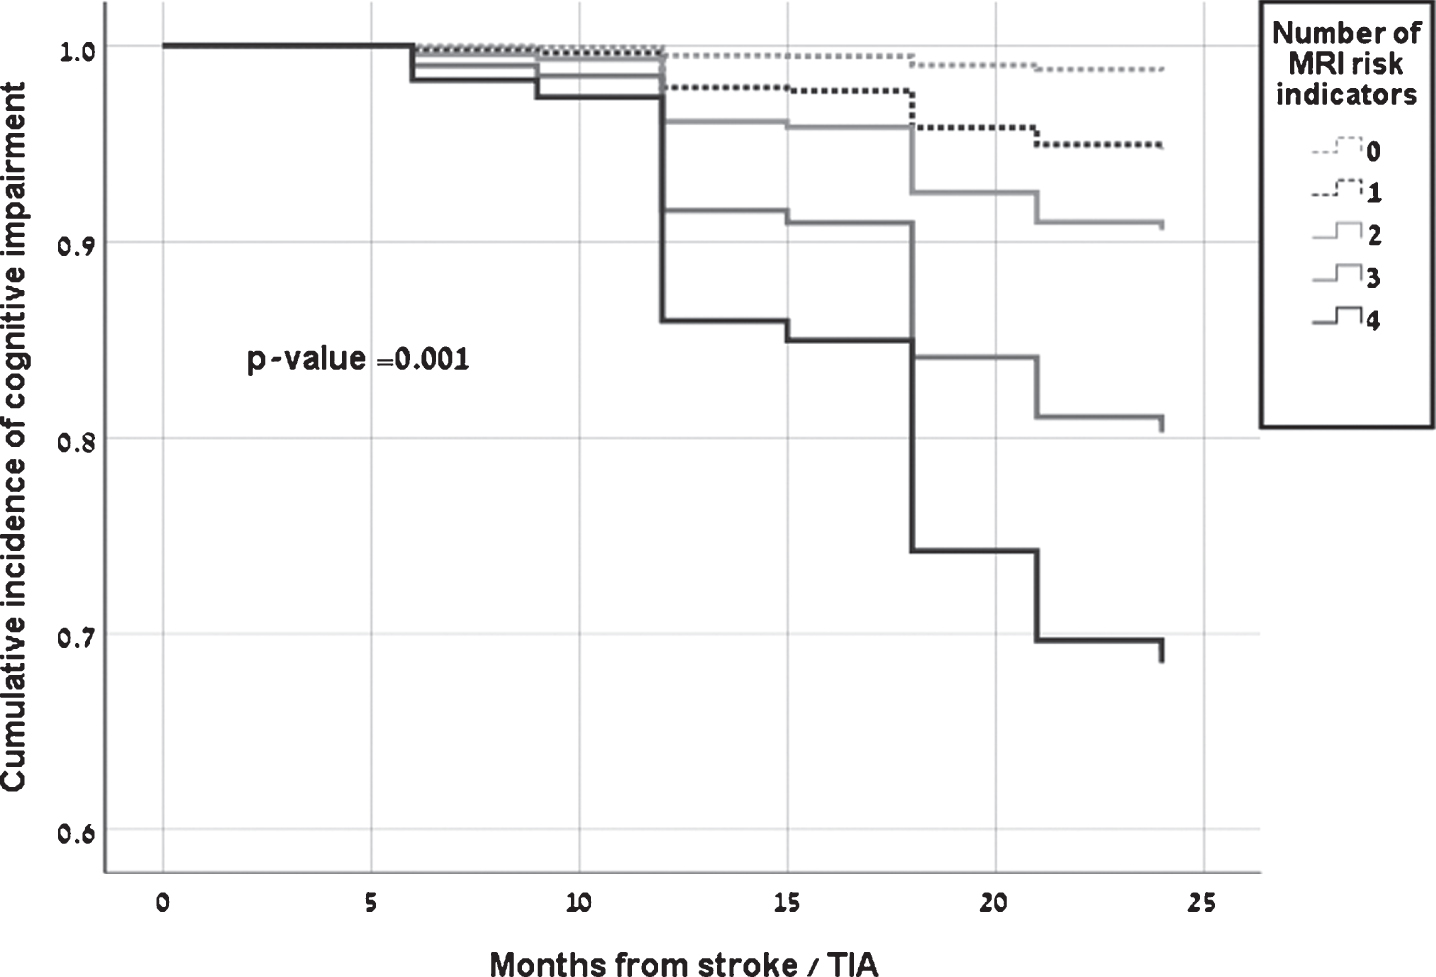
Cumulative incidence of post-stroke cognitive impairment based on age, and education-adjusted Cox models by number of neuroimaging indicators: bottom GM volume quartile, bottom frontal cortex volume quartile, top WMHV quartile and top CSFV quartile. GM, gray matter; WMHV, white matter hyperintensity volume; CSFV, cerebrospinal fluid volume; TIA, transient ischemic attack.
Hazard Ratios (95% CI) for cognitive status within 24 months from stroke with quartiles of MRI measures (bottom versus others for Gray, Hippocampal and Frontal cortex volumes, as well as White matter FA, and top versus others for White matter hyperintensity and Cerebrospinal fluid volume)
CI, confidence interval; MRI, magnetic resonance imaging; NIHSS, National Institutes of Health Stroke Scale. Significant results are shown in bold (p < 0.05). †Model B: adjusted for age, education, and NIHSS at admission.
As for non-imaging parameters, vascular risk factor represented by the Framingham risk score were found to be associated with the development of PSCI (HR, 2.3; 95% CI, 1.06–5.02). APOE4 status was not associated with PSCI development (Table 4).
Hazard Ratios (95% CI) for cognitive status within 24 months from stroke with vascular pathology measures and parameters known as associated with AD
CI, confidence interval; AD, Alzheimer’s disease; APOE ɛ4, apolipoprotein E4. Significant results are shown in bold (p < 0.05). †Model B: adjusted for age, education, and NIHSS at admission.
In order to explore the contribution of vascular pathology-related markers versus separate from and in conjunction with AD-related markers, we employed multivariate logistic regression model including both vascular markers (Framingham risk score for stroke, WMHV, lacunes, and CMB) and AD associate markers (APOE4 status and hippocampal volume), along with known confounders related to cognitive performance (age, education).
Figure 2 shows the receiver operating characteristic (ROC) curve for vascular pathology markers and AD-associated markers in prediction of PSCI. Vascular related markers had discriminative power to predict PSCI (AUC, 0.67 (95% CI: 0.56–0.78)), while AD related markers did not (AUC, 0.58 (95% CI: 0.45–0.67)). The AUC for vascular pathology measures was significantly higher than the AUC for parameters known as associated with AD (p < 0.001). Combining both measures together (AD and vascular markers) had slightly less discriminative power to predict PSCI than vascular related markers alone (AUC, 0.66 (95% CI: 0.55–0.77)). In addition, to explore whether the association between vascular pathology and risk of PSCI was not only dependent on subjects with very high vascular morbidities, we used a sensitivity analysis, excluding subjects with Framingham risk score >18 (n = 30) and found similar findings.
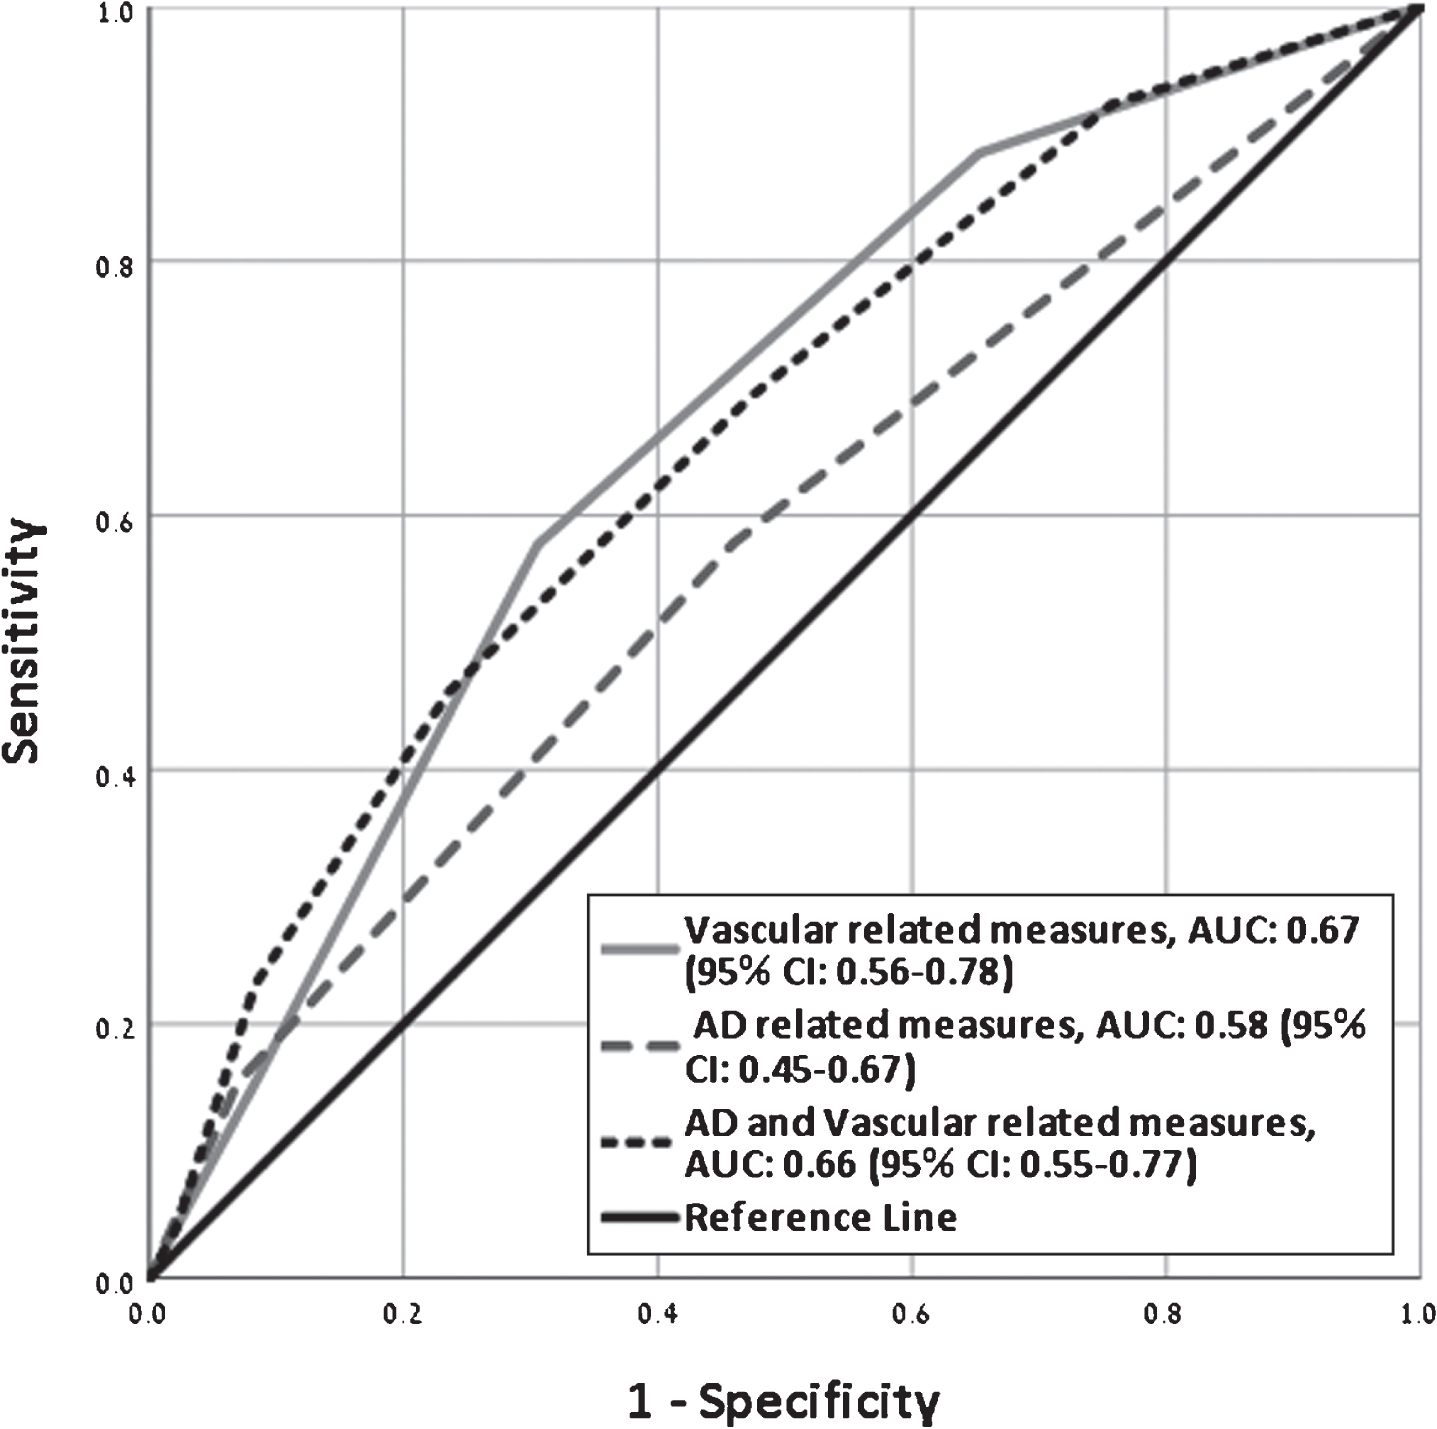
Receiver operating characteristic curves showing performance of vascular pathology measures and parameters known as associated with AD for predicting 2-year risk of post- stroke cognitive impairment. CI, confidence interval; AUC, area under the curve; AD, Alzheimer’s disease.
DISCUSSION
PSCI is a common and significant cause of disability and impaired quality of life. This study examined a wide spectrum of MRI markers, in order to shed more light on PSCI etiology—whether PSCI is a result of the vascular disease or rather secondary to an ongoing neurodegenerative disease unrelated to the acute event. Of course, the acute ischemic event may trigger or accelerate neurodegenerative processes. Various MRI markers were found to be associated with PSCI; however, after adjustments, only low GM, frontal cortex volume, high WMHV, and high CSF volume remained strong predictors.
The association between low GM, cortex volume, and high CSF volume to PSCI is not surprising. These markers represent brain damage secondary to various processes, and therefore the association to cognitive state does not support specific mechanisms. These findings along with the association of other markers prior to adjustment (lobar microbleeds, hippocampal volume, temporal and occipital cortex thickness) may imply that PSCI is a result of mixed pathologies. The cumulative model (Fig. 1) demonstrates the increased risk for PSCI by the number of markers involved, strengthens this hypothesis and emphasizes the dramatic influence of combined pathologies on the risk for PSCI.
The strong association found between WMHV and PSCI is an important finding supporting vascular processes to have a key role in PSCI. Similar findings were previously described [29]. Lobar microbleeds were also associated with the cognitive state, possibly as a marker for cerebral amyloid angiopathy contribution. Nevertheless, this association was lost after adjustments. It should be noted that other cerebral small vessel disease markers were not found to be associated with PSCI in this study. Previous studies have demonstrated conflicting results examining the association between SVD markers and cognition. As SVD measures in neuroimaging constitute indirect markers, their sensitivity and specificity to estimate SVD contribution may not be sufficient, and they most probably do not represent the total burden of SVD. Future studies including pathological correlations or use of high definition 7T MRI may reflect the true burden of SVD and its contribution to PSCI. In order to further establish vascular processes contribution to PSCI, we evaluated the combined effect of vascular imaging markers and risk factor, which showed powerful prediction effect. In contrast, both ApoE4 and hippocampal volume were not significantly associated with PSCI in our cohort. Thus, it seems that although various pathologies contribute to PSCI, the vascular disease is the more significant underlying pathology.
Although our data show that vascular disease is a major contributor to PSCI, the acute lesion itself does not have a direct effect. The acute ischemic event is probably a marker representing the ongoing ischemic pathology, leading to high ischemic burden and PSCI. There is no doubt that acute ischemic stroke may facilitate cognitive impairment. However, as some patients in our cohort demonstrated progression of cognitive performances over a 2-year period, it is unlikely that the acute event is the cause for PSCI, and indeed no association was found. This is also supported by the lack of association between lesion location or volume and PSCI. Acute cognitive impairment may be a result of massive ischemic event or of stroke in specific (strategic) locations [30, 31]. However, our cohort included only mild to moderate stroke survivors. As for the possible thalamic-induced cognitive impairment, such effect was not demonstrated in our cohort, is probably a rare cause for PSCI, and has an immediate and not progressive effect.
This study strengths include the prospective cohort, repetitive extensive cognitive evaluations, and the vast range of MRI markers examined. Study limitations include the lack of follow-up imaging, the inclusion of only patients with mild clinical stroke manifestations and the missing of neuroimaging data for 110 patients (of note, these patients had similar incidence of PSCI, 19.2%, compared to those who had brain MRI scans at baseline, 20.2%).
Conclusion
Our findings show that PSCI is a result of mixed damage mechanisms, but point out that ongoing ischemic vascular processes are the main mechanism beyond PSCI. This emphasizes the importance of maximal treatment of cardiovascular risk factors and ischemic stroke prevention, also in order to prevent the high burden of morbidity caused by PSCI.
Footnotes
ACKNOWLEDGMENTS
This study is supported by grants RAG11482 from the American Federation for Aging Research, grant 2011344 From the U.S.- Israel Bi-national Science Foundation and grant AARG-16-442861 from the Alzheimer’s Association. These funding agencies had no role in the conduct and publication of this study.
