
Abstract
The intracellular deposition of amyloid-β (Aβ) peptides has been described in the brains of both Alzheimer’s disease (AD) patients and animal models. A correlation between the intracellular amyloid burden and neurodegeneration has recently been reported in a triple-transgenic AD (3xTg-AD) murine model. In the present study, we assessed the effect of scFv-h3D6, an anti-Aβ single-chain variable fragment (scFv) derived from the antibody bapineuzumab, on amyloid pathology in 5-month-old 3xTg-AD female mice, focusing on intracellular Aβ clearance, neuronal survival, and functional abilities. We also examined neuroinflammation and the histology of peripheral organ samples to detect any adverse effects. A single intraperitoneal injection of scFv-h3D6 dramatically reduced intracellular Aβ burden in the deep layers of the cerebral cortex, pyramidal cells layer of the hippocampus, and basolateral amygdalar nucleus. The treatment prevented neuronal loss in the hippocampus and amygdala, while neither astrogliosis nor microgliosis was induced. Instead, an increase in the size of the white pulp after the treatment indicated that the spleen could be involved in the clearance mechanism. Although the treatment did not ameliorate behavioral and psychological symptoms of dementia-like symptoms, the results of cognitive testing pointed to a noticeable improvement in spatial memory. These findings indicated that the mechanism underlying the therapeutic effect of scFv-h3D6 was the clearance of intracellular Aβ, with subsequent prevention of neuronal loss and amelioration of cognitive disabilities. The treatment was safe in terms of neuroinflammation and kidney and liver function, whereas some effects on the spleen were observed.
INTRODUCTION
Alzheimer’s disease (AD) is the most common form of dementia worldwide [1]. It is characterized by cognitive decline and memory impairment, as well as emotional and behavioral alterations [2]. The amyloid cascade hypothesis states that the accumulation of amyloid-β (Aβ) peptides is the triggering event in the pathology of AD [3]. Such accumulation can be the result of Aβ overproduction, as is the case of familial AD, or impaired clearance as commonly occurs in the sporadic form of the disease [4].
Intracellular deposition of Aβ peptides has been described in the brains of AD patients, as well as in several amyloid-β protein precursor (AβPP) transgenic mice, prior to extracellular accumulation of Aβ peptides [5]. According to a number of studies, transgenic models of AD do not reproduce the pathology observed in humans, with these studies finding that the extent of neuronal loss was lower or even null in the models [6–9]. However, a recent in-depth analysis of neuronal vulnerability in a triple-transgenic mouse model of AD (3xTg-AD), which exhibits both Aβ- and tau-dependent pathology with a regional and temporal involvement homologous to that seen in humans [10, 11], provided evidence of a strong correlation between intracellular amyloid pathology and neurodegeneration in neuronal populations implicated in the early stages of AD [12].
Although amyloid plaques were once widely thought to be directly related to neurotoxicity in AD, research has shown that soluble oligomeric forms are the most toxic species and that they are better correlated with cognitive decline [13]. Several monoclonal antibodies (mAbs) have been developed for targeting Aβ-oligomeric species [14]. Bapineuzumab was the first mAb to reach phase III clinical trials, but it was discontinued in 2012 due to adverse effects [15]. The use of single-chain variable fragments (scFv), in which the VH and VL domains are fused by a peptidic linker, has been proposed as a strategy to avoid these adverse effects, which are thought to be induced by the Fc portion of the mAbs via FcγR-dependent activation of microglia [16]. The anti-Aβ single-chain antibody fragment scFv-h3D6 is derived from bapineuzumab, and therefore it is directed against the five N-terminal residues of Aβ and recognizes all the aggregation states of the peptide (monomers, oligomers, and fibrils). Interestingly, scFv-h3D6 has been shown to be a potential tool as a treatment for AD. It prevented Aβ-induced cytotoxicity in SH-SY5Y neuroblastoma cell cultures by withdrawing Aβ oligomers from the amyloid pathway to a non-toxic, worm-like (WL) pathway [17]. The WL pathway is characterized by curved and short fibrils, which, in vitro, grow following a nucleation-independent polymerization process. In addition, a single intraperitoneal (i.p.) injection of scFv-h3D6 to 3xTg-AD mice ameliorated the first hallmarks of AD. This treatment decreased Aβ oligomer burden, restored concentrations of apolipoprotein E and apolipoprotein J, protected deep cerebellar nuclei macroneurons from death, and ameliorated various cognitive traits in the 3xTg-AD mouse model [18, 19].
The main aim of the present study was to examine the efficiency of scFv-h3D6 in reducing the intracellular Aβ burden and its subsequent effects on cell survival of neuronal populations previously shown to be affected by AD in 5-month-old 3xTg-AD female mice [12]. A second aim was to investigate the safety of scFv-h3D6 treatment in terms of neuroinflammation and histology of various peripheral organs. In addition, we performed a functional assessment of behavioral and psychological symptoms of dementia (BPSD)-like symptoms, as well as cognitive impairment.
MATERIALS AND METHODS
ScFv-h3D6 production
The scFv-h3D6 was recombinantly expressed in Escherichia coli Origami 2 (DE3)/pETtrx-1a and purified as previously described [17]. In brief, Trx-tag was removed from the precursor construct by Tobacco Etch Virus (TEV) proteolysis after refolding by dilution, and then scFv-h3D6 was purified by cationic exchange chromatography (Resource S column; GE Healthcare, Chicago, IL, USA). Lipopolysaccharides, the major endotoxins of gram-negative bacteria, were detached from the protein using Detoxi-gel endotoxin removing columns (ThermoFisher Scientific, Waltham, MA, USA).
Animals
The 3xTg-AD model, which harbors PS1M146V, APP Swe and tauP301L transgenes, was initially engineered at the University of California, Irvine [10]. The 3xTg-AD colony and corresponding non-transgenic (NTg) mice (B6129SF2) were purchased from the Jackson Laboratory (Bar Harbor, ME, USA) and established by our group in the Servei d’Estabulari at the Universitat Autònoma de Barcelona (UAB). Female mice were selected because they exhibit a greater Aβ burden and larger behavioral deficits than age-matched male mice [20]. Furthermore, in contrast to male mice, female mice maintain the original phenotypic traits described [21].
The animals were maintained under standard laboratory conditions (a temperature of 22±2°C and relative humidity of 55±5%, a 12-h light:dark cycle starting at 08:00 a.m., with food and water provided ad libitum). The animals were randomized when allocated to the different groups and the experimenters blinded with respect to genotype and treatment. Behavioral test were performed between 11:00 a.m. and 04:00 p.m.
All the experiments were approved by the UAB Animal Research Committee and the Government of Catalonia, and conducted in accordance with the legislation for the protection of animals used for scientific purposes (directive 2010/63/EU, RD 53/2013).
Experimental design
The upper panel in Fig. 1 shows the experimental design, which comprises three cohorts. Results from cohort 1 and 3 are partially published because we first concentrated on a deep characterization of the 3xTg-AD mouse model at the cellular level and its comparison with the corresponding NTg genetic background [12], and kept the results of the effect of scFv-h3D6 unpublished until they were completed (this work). These cohorts were different because behavioral and cognitive testing spans a longer time period than the 5 days (d) post-injection (p.i.) we previously used in other studies (i.e., [18, 22]) and in this work for histological and biochemical characterizations. Since the aim of the current work was to study not only the efficiency but also the safety of the treatment with scFv-h3D6, we added an additional cohort (cohort 2) allowing the extraction of blood and peripheral organs, as well as obtaining brain samples for studying the inflammatory response to the treatment. In addition, and because we already knew that scFv-h3D6 treatment to NTg mice does not produce any effect at the behavioral and cognitive levels [18], cohort 3 did not contain the treated NTg group but just the untreated NTg group as a reference for non-pathological conditions.

Experimental design. Upper panel: Cohorts used in the study. Cohort 1 was used for histological analyses and Cohort 2 was used for safety-related studies (cerebral hemispheres were separately processed for histology and for biochemistry). Experimental groups: untreated non-transgenic mice (NTg/–); treated non-transgenic mice (NTg/+); untreated 3xTg-AD mice (3xTg/–); treated 3xTg-AD mice (3xTg/+). Cohort 3 was used for behavioral and cognitive evaluation. Experimental groups: NTg/–, 3xTg/–, and 3xTg/+. No behavioral tests were performed with the NTg/+ group because we already published that there are not differences between treated and untreated NTg mice [18]. Lower panel: Main details of behavioral and cognitive testing. A) Corner test. The yellow square highlights one of the 4 zones considered for the corner visits. B) Open-field test. The yellow square determines the limit between the peripheral and central zones. C) Novel object recognition test. The same arena than for the open-field test was used. Objects are shown in yellow. D) Morris Water Maze paradigm. The platform is shown as a yellow circle and the arrow represents the entry point at the final probe.
Four experimental groups were used for the histological and biochemical analyses: untreated non-transgenic mice (NTg/–), treated NTg mice (NTg/+), untreated triple-transgenic mice (3xTg/–), and treated 3xTg mice (3xTg/+). Five-month-old 3xTg-AD female mice and corresponding age- and sex-matched NTg mice were treated with a single i.p. dose of 100μg of scFv-h3D6 (approximately 3.3 mg/kg) or vehicle (PBS-buffer, pH 7.4). The injected volume was 200μl.
Statistical differences were evaluated using the non-parametric Mann-Whitney U-test by comparing NTg/–versus 3xTg/–to determine differences between genotypes, by comparing NTg/–versus NTg/+ and 3xTg/–versus 3xTg/+ to assess the effect of the treatment in each of the genotypes, and by comparing NTg/–versus 3xTg/+ to evaluate whether the treatment recovered the non-pathological values. A p-value lower than 0.05 was considered statistically significant. Values are expressed as medians with interquartile ranges. The percentage of improvement (i.e., a reduction in 6E10-immunereactive [6E10-ir] cells and an increase in neuronal density) in the treated 3xTg-AD samples were calculated from the means of the corresponding groups.
The results of statistical tests presented in cohorts containing less than 10 animals per group should be considered as exploratory and may gain to be replicated in confirmatory studies including a higher number of animals per group.
Sample collection and processing
Amyloid pathology and neuronal depletion were determined from cohort 1 (Fig. 1, upper panel). Specifically, 5 days after the administration (the time period used in our previous studies [18, 22]), the animals were anesthetized by an i.p. injection of ketamine-xylazine mixture (87.5-12.5 mg/kg body weight, respectively, in saline solution) and transcardially perfused with 4% paraformaldehyde (Sigma-Aldrich, St. Louis, MO, USA). The brains were removed from the skulls, rinsed in cold PBS, and processed for histology (focused on intraneuronal amyloid pathology and neuronal depletion).
Safety-related parameters were determined from cohort 2 (Fig. 1, upper panel). Specifically, 5 days after the administration, the animals were anesthetized by isoflurane 1% inhalation. First, blood was collected by cardiac puncture and supplemented with a complete proteases inhibitor cocktail (Roche, Basel, Switzerland) and 1 mM EDTA to prevent degradation of proteins and coagulation. The samples were centrifuged at 20,230× g for 10 min at 4°C. The supernatant was recovered while taking care to avoid contamination from the interphase (white blood cells and platelets) and centrifuged again. Finally, the supernatant was recovered and stored at –80°C as blood plasma until use (transaminases levels). Just after collecting the blood, the animal brains were removed from the skulls, rinsed in cold PBS, and both cerebral hemispheres were separately processed for histology (focused on microglia and astroglia activation) and biochemical analyses from protein extracts (Aβ and TNF-α). Then, the spleen, liver, and kidneys were dissected and processed for histology (cytoarchitecture).
For histology, all of the samples were rapidly immersed in 4% paraformaldehyde for 36 h at 4°C and then embedded in paraffin following standard protocols in our laboratory. The brains were serially sectioned in the coronal plane (10-μm thick), mounted on SuperfrostTM Plus Microscope Slides (ThermoFisher Scientific), and stored at room temperature (RT) until use. A similar procedure was used for the processing of the spleen, liver, and kidneys.
For biochemical determinations from brain protein extracts, the dissected areas were weighed and mechanically disaggregated in cold homogenization buffer (TBS, pH 7.6, supplemented with a Roche protease inhibitor cocktail and 1 mM EDTA) in a tissue homogenizer (Sigma-Aldrich). After a brief sonication step (1 cycle of 35 s, at 35% duty cycle, and output 4 in a Dynatech Sonic Dismembrator ARTEK 300; BioLogics INC., Manassas, VI, USA), the samples were centrifuged at 100,000× g for 1 h at 4°C, and the collected supernatant was labeled as the soluble fraction. Subsequently, the insoluble pellet was dissolved to the same volume and re-homogenized in cold TBS-1% Triton X-100 solution supplemented with protease inhibitors and centrifuged again. The supernatant was labeled as the insoluble fraction.
Histological analyses
Histochemistry
Histological sections from the spleen, liver, and kidneys were deparaffinized in xylene, hydrated in decreasing concentrations of ethanol solutions, and extensively washed in distilled water. Hematoxylin-eosin or cresyl violet staining was carried out to evaluate the tissue cytoarchitecture. Masson trichrome staining was used to detect the presence of fibrosis. Lipid droplets were observed in the hepatic tissue from 3xTg-AD mice, and subsequently verified on cryo-preserved samples by Sudan III staining. The periodic-acid Schiff (PAS) method was used to stain the renal tissue.
Immunohistochemistry
The brain sections were deparaffinized as for histochemistry and endogen peroxidase activity was blocked by placing the slides in 3% H2O2 in methanol for 10 min. Antigen retrieval was performed by incubation in 0.01 M sodium citrate buffer, pH 6.0, supplemented with 0.05% Tween-20, for 20 min at 95–100°C in a water bath. After some minutes of cooling at RT, unspecific binding sites were blocked using 5% BSA in PBS containing 0.1% Tween-20 and 5% normal goat serum, at RT for 1 h. The slides were then incubated overnight at 4°C with the corresponding primary antibody (rabbit polyclonal anti-glial fibrillary acidic protein [GFAP], 1:500, DAKO, Glostrup, Denmark; and rabbit polyclonal anti-ionized calcium binding adaptor molecule 1 [Iba1], 1:500, Wako Pure Chemical Industries, Osaka, Japan), and revealed by 3-3’ Diaminobenzidine (DAB, Sigma-Aldrich) after incubation with its specific goat secondary antibody at 1:250 dilution (Rabbit ExtrAvidin Peroxidase Staining Kit antibody, Sigma-Aldrich; and anti-rabbit IgG BA-1000, Vector Laboratories, Burlingame, CA, USA). All the antibodies used in this study are listed in Table 1. Finally, the sections were extensively washed, dehydrated, immersed in xylene, and cover-slipped in distyrene, plasticizer, and xylene (DPX) mounting medium.
Primary and secondary antibodies used for immunohistology
Dilution, commercial source, and catalogue number for all the antibodies used in this work are shown. 11:500 for immunohistochemistry, 1:250 for immunofluorescence. 21:100 for anti-neurofilament H immunodetection.
Immunofluorescence
Once hydrated, the brain sections were pre-treated by immersion in 70% formic acid at RT for 10 min (Aβ and neuronal nuclear antigen [NeuN] immunodetections) or incubation in 0.01 M sodium citrate buffer, pH 6.0, supplemented with 0.05% Tween-20, at 95–100°C for 20 min in a water bath (neurofilament H [NFH] and GFAP). The samples were then rinsed again in PBS and blocked with 5% BSA (Sigma-Aldrich), 5% normal goat serum (Sigma-Aldrich), and 0.05% Tween-20 (Sigma-Aldrich) in PBS, at RT for 1 h. After the blocking step, the slides were incubated with the primary antibodies (mouse anti-Aβ 6E10 mAb, 1:100, Covance Signet, Princeton, NJ, USA; rabbit polyclonal anti-NFH, 1:100, Merck-Millipore, Billerica, MA, USA; rabbit polyclonal anti-NeuN, 1:200, Merck-Millipore, Billerica, MA, USA; and GFAP, 1:200, DAKO) at 4°C overnight (except for anti-NFH, which was incubated for 48 h). After extensive rinses in PBS, the primary antibodies were detected using the corresponding species-directed fluorophore-conjugated secondary antibodies (goat anti-mouse IgG, Cy3 conjugated and anti-rabbit IgG, FITC conjugated, Chemicon, Merck-Millipore) at RT for 1 h. Detailed information on the antibodies is provided in Table 1. Finally, the sections were cover-slipped with 4,6-diamidino-2-phenylindole (DAPI) (Sigma-Aldrich) diluted in antifade Vectashield mounting medium (Vector Laboratories, Burlingame, CA, USA) for nuclei staining (8μg/mL). The primary antibody was omitted in the negative controls.
Image capture, processing, and quantification
Images were captured using a Zeiss Axiophot microscope and a ProgRes C10 plus camera (Jenoptik, Jena, Germany) with an objective Plan-Neofluar lens from 2.5× to 63×. The light source was a halogen lamp or a fluorescent one, depending on the required visualization.
Brain sections were examined in the range of coordinates between Figure 43 (interaural 2.34 mm and Bregma –1.46 mm) and Figure 48 (interaural 1.74 mm and Bregma –2.06 mm) as described earlier [23]. All the histological analyses were replicated using 2–4 sections per animal (sections 40μm apart). The fluorescence intensity was quantified by using Image J software (v. 1.43 u, NIH, Bethesda, MD, USA). In brief, the intracellular 6E10 signal was measured individually in each cell by manually delimiting somas in the neocortex and amygdala or in the entire cellular layer in the hippocampus. The intensity of GFAP-immunofluorescence was measured in the entire image. The area immunostained by anti-GFAP or anti-Iba1 was quantified by DAB staining by converting the images to a binary format once the background was subtracted. The proportions of Aβ-containing cells were calculated by counting the total number of 6E10-ir cells in each image in relation to the total number of cells in the same image (expressed as percentages). The total number of cells in each population was counted in the entire area of each section, and the areas occupied by these populations were measured. Quantifications were normalized by dividing the number of cells by the corresponding area. The results were expressed as cellular density (cells/mm2).
The figures were assembled in Adobe Photoshop (version 7.0, Adobe Inc., San Jose, CA, USA).
Biochemical analyses
Aβ42 quantification
The levels of Aβ42 in the soluble and insoluble fractions of the cortex were determined using a commercial enzyme-linked immunosorbent assay (ELISA), according to the manufacturer’s protocols (kit Aβ42; Invitrogen, Waltham, MA, USA). The data obtained were normalized by the total amount of protein in each extract, as measured by a BCA assay (Pierce; ThermoFisher Scientific).
Quantification of tumor necrosis factor-alpha (TNF-α)
The levels of TNF-α in the hippocampal soluble extracts were determined using a commercial ELISA (DuoSet kit; R&D Systems, Minneapolis, MN, USA). Absorbance was measured in a Multilabel reader Victor3 (Perkin Elmer, Turku, Finland). As a wavelength correction was not available, readings at 540 nm were subtracted from readings at 450 nm. Next, the data obtained were normalized using the total amount of protein in each extract, as measured by performing the BCA assay.
Measurements of aspartate transaminase (AST) and alanine transaminase (ALT)
The plasma concentration of AST and ALT were determined using a commercial enzyme-coupled colorimetric assay kit (Roche Diagnostics). Absorbance was measured in a Cobas c501/6000 analyzer (Roche Diagnostics). The values were normalized by the total amount of protein, as measured using a Pierce BCA Protein Assay Kit in a Multilabel reader Victor3 (Perkin Elmer) at 562 nm.
Behavioral and cognitive testing
Behavioral and cognitive testing was performed with cohort 3 (Fig. 1, upper panel). Results obtained from these tests are partially published because we first concentrated on a deep characterization of the 3xTg-AD mouse model and its comparison with the corresponding NTg genetic background [12], but all three groups were assayed simultaneously. BPSD-like symptoms were appraised in a corner test (CT) and open-field test (OFT). Recognition memory was evaluated by the specificity of the exploratory activity in a novel object recognition test (NORT), and spatial long-term memory was evaluated by the final probe stage after 5 days of training in a Morris Water Maze (MWM). All the tests were temporally sequenced on the basis of the degree of stress in each test, with the most stressful ones at the end (see Fig. 1). The CT and OFT were performed 1-day post-treatment. To test whether the effects of the treatment had increased over time, both tests were replicated 5-days post-treatment using another cohort of animals (not shown in Fig. 1, results were the same as 1-day post-treatment and are shown in Supplementary Table 1). Cognition was assessed for 8 days (NORT, 2-days post-treatment, and MWM, 3-9-days post-treatment).
All the tests were recorded using a digital USB camera (The Imaging Source; Munich, Germany) and video-tracking was processed using ANY-maze software (v. 5.14; Stoelting Europe, Dublin, Ireland). Rearings, self-groomings, and defecations in the CT and OFT were manually quantified, as well as the number of visits and time visiting the objects in the NORT. All the materials involved in the behavioral tests were cleaned thoroughly between trials to ensure the absence of olfactory cues.
The lower panel in Fig. 1 shows the main details on how the tests were performed.
Corner test
Mice were placed in a standard home-cage (Makrolon, 22×22×14,5 cm) for 30 s. Neophobia to the new home-cage was evaluated by considering the horizontal activity (number of corner visits and latency to the first corner visit) and vertical activity (number of rearings and latency to the first rearing).
Open-field test
Mice were placed in an arena (white polyethylene, 42×42×50 cm) for 15 min. Anxious-like behavior was measured by horizontal activity (entries to the center, total distance travelled, distance travelled in the center, distance travelled in the periphery, and the corresponding ratio between these virtual zones, center and periphery), vertical activity (number of rearings and latency of the first rearing), and other emotional behaviors (self-groomings, latency of the first self-grooming, and number of defecations).
Novel object recognition test
NORT was performed in the same arena where the OFT was assessed the previous day, and habituation phase was considered not necessary. Mice were familiarized to two identic objects (A and A’) for 5 min in the familiarization phase. Then, mice were exposed to one of the familiar objects (A) and a novel object (B) for 5 min in the recognition phase. The interval time between familiarization and recognition phases was 15 min to allow evaluation of short-term recognition memory [24]. Exploratory behavior was assessed by the number of total explorations, time exploring, and distance travelled. The preference of the animal to explore the familiar or the novel object was considered to determine recognition memory. Specifically, discrimination index (DI) showed differences in the accumulated time exploring both objects, and it was calculated as (B–A)/(B+A). DI can vary between –1, when the familiar object is the preference, and +1, when the novel object is the preference [25].
Morris water maze test
The MWM paradigm evaluates the ability to find a hidden platform (Ø, 11 cm) in a pool (Ø, 120 cm) full of opaque white water, stained with non-toxic tempera. First, mice performed 4 initial trials, in which the platform was highlighted with a colored flag to contrast with the white water and walls (day 1, highlighted platform stage). Then, mice were trained for 5 consecutive days (days 2–6, acquisition stage), following 4 trials per day, with an inter-trial time period of 10 min. In this phase, mice should reach the platform after getting oriented by proximal and distal cues. When mice were not able to arrive to the platform by themselves in 60 s, they were manually guided to it. Each trial started from a different point, and the sequence of trials varied every day. Finally, mice were tested for 60 s of navigation in absence of the platform (day 7, final probe stage). In this case, the starting point was the more distant point to the usual platform location. To prevent hypothermia, mice were located under a heating lamp every time they were removed from the water.
Distance travelled, number of entries to the platform area, latency of the first entry (all three parameters considered in the first segment of the test, 0–30 s), and the pathway efficiency were measured in the final probe. In order to define the pattern followed by the mice, distance travelled was considered in different virtual concentric circles drawn around the platform. Four zones were separately considered: the platform zone, the zone next to the platform area (zone 1), the middle zone (Z2), and external zone (Z3). Distance values for each of the zones were normalized by the area.
RESULTS
The scFv-h3D6 treatment reduced the intracellular Aβ burden
The effect of scFv-h3D6 on the amyloid burden was first assessed by quantifying the amount of Aβ42 in protein extracts from the cortex. As shown in Fig. 2A-B, the amount of Aβ42 in the insoluble fraction was higher than in the soluble fraction; therefore, it can be assumed that it was higher in the intracellular compartment than in the extracellular compartment. Interestingly, scFv-h3D6 treatment was effective in both fractions.

Proportion of 6E10-ir cells is reduced by a single i.p. dose of scFv-h3D6. A) Aβ quantification in protein extracts from the soluble fraction of the cortex, and (B) from the insoluble fraction of the cortex. C-F) Percentage of 6E10-ir cells; at the cortical deep layers V and VI (L5-6) (C), pyramidal cell layer (PCL) from the region III of the Cornus Ammonis (CA3) in the hippocampus (D), and basolateral amygdalar (BLA) nucleus (E) from untreated non-transgenic mice (NTg/–), treated non-transgenic mice (NTg/+), untreated 3xTg-AD mice (3xTg/–); treated 3xTg-AD mice (3xTg/+). Proportions are expressed as medians in box plots, and whiskers represent minimum and maximum values. Statistical differences were assessed with the non-parametric U-test. *significant differences with p≤0.05. The reduction in the proportion of 6E10-ir cells by the treatment is expressed as a percentage (F), and was quantified by considering mean values from the 3xTg/–as the maximum (or pathologic ones) and the NTg/–mice as the minimum (or non-pathologic ones). The significantly increased percentage of 6E10-ir cells in the 3xTg/–is reduced after scFv-h3D6 treatment, reaching significant recovery of the values for the most affected neuron populations, the cortical and amygdalar ones.
The proportion of 6E10-ir cells was determined in the following areas: deep cortical layers V and VI (L5-6), pyramidal cell layer (PCL) in region III of the Cornus Ammonis (CA3) in the hippocampus, and basolateral amygdalar (BLA) nucleus. Figure 2C-F shows the overall values obtained (expressed as medians within box plots) and the statistical analysis performed using the non-parametric Mann-Whitney U-test, as well as the reduction in 6E10-ir cells post-treatment (calculated from the means and expressed as percentages) in each population. In the deep cortical layers of the 3xTg-AD mice, the median value for the percentage of 6E10-ir cells was 78% for the untreated animals and 14% for the scFv-h3D6-treated animals (Fig. 2C). This represents a reduction in 6E10-ir cells of 70% after the treatment (Fig. 2F). The statistical comparison between the untreated and treated 3xTg-AD mice reached significant values (U-value = 0, p = 0.0286), whereas the differences between the treated 3xTg-AD and the NTg mice were not significant. This finding indicated that the scFv-h3D6 treatment reduced the intracellular Aβ burden in the deep cortical layers. In the PCL of hippocampal region III (CA3) of the untreated 3xTg-AD mice, the proportion of 6E10-ir cells was 12% (Fig. 2D). Despite this value was small and significant differences were not reached, the treatment decreased it to 4%, with 65% of the cells in this area of the hippocampus protected after the treatment (Fig. 2F). In the BLA nuclei of the 3xTg-AD mice, 100% of the neurons were 6E10-ir and the treatment significantly reduced this value to 47% (U-value = 0, p = 0.0286) (Fig. 2E), with 56% of the cells protected after the treatment (Fig. 2F). The treated 3xTg-AD mice did not statistically differ from the NTg mice. This finding supported the strong effect of scFv-h3D6 treatment on the recovery of intracellular amyloid pathology in the BLA nucleus.
To estimate the intracellular Aβ burden in each neuronal population, the 6E10-immunofluorescence intensity per cell was measured. Representative images from each experimental group are shown in Fig. 3, in addition to the quantifications and results of the statistical analysis. Significantly higher 6E10-immunofluorescence intensity was detected in neurons in the deep cortical layers of the 3xTg-AD mice as compared with that in the NTg mice (21.2 and 4.6 relative fluorescence units [r.f.u.] as median values, respectively, U-value = 0, p = 0.0286). Interestingly, values from the treated 3xTg-AD mice (6.7 r.f.u.) were significantly reduced in comparison to the untreated 3xTg-AD mice (U-value = 0, p = 0.0286) and did not statistically differ from the NTg mice. This finding indicated that the intracellular signal intensity decreased to non-pathological levels after treatment (Fig. 3A).
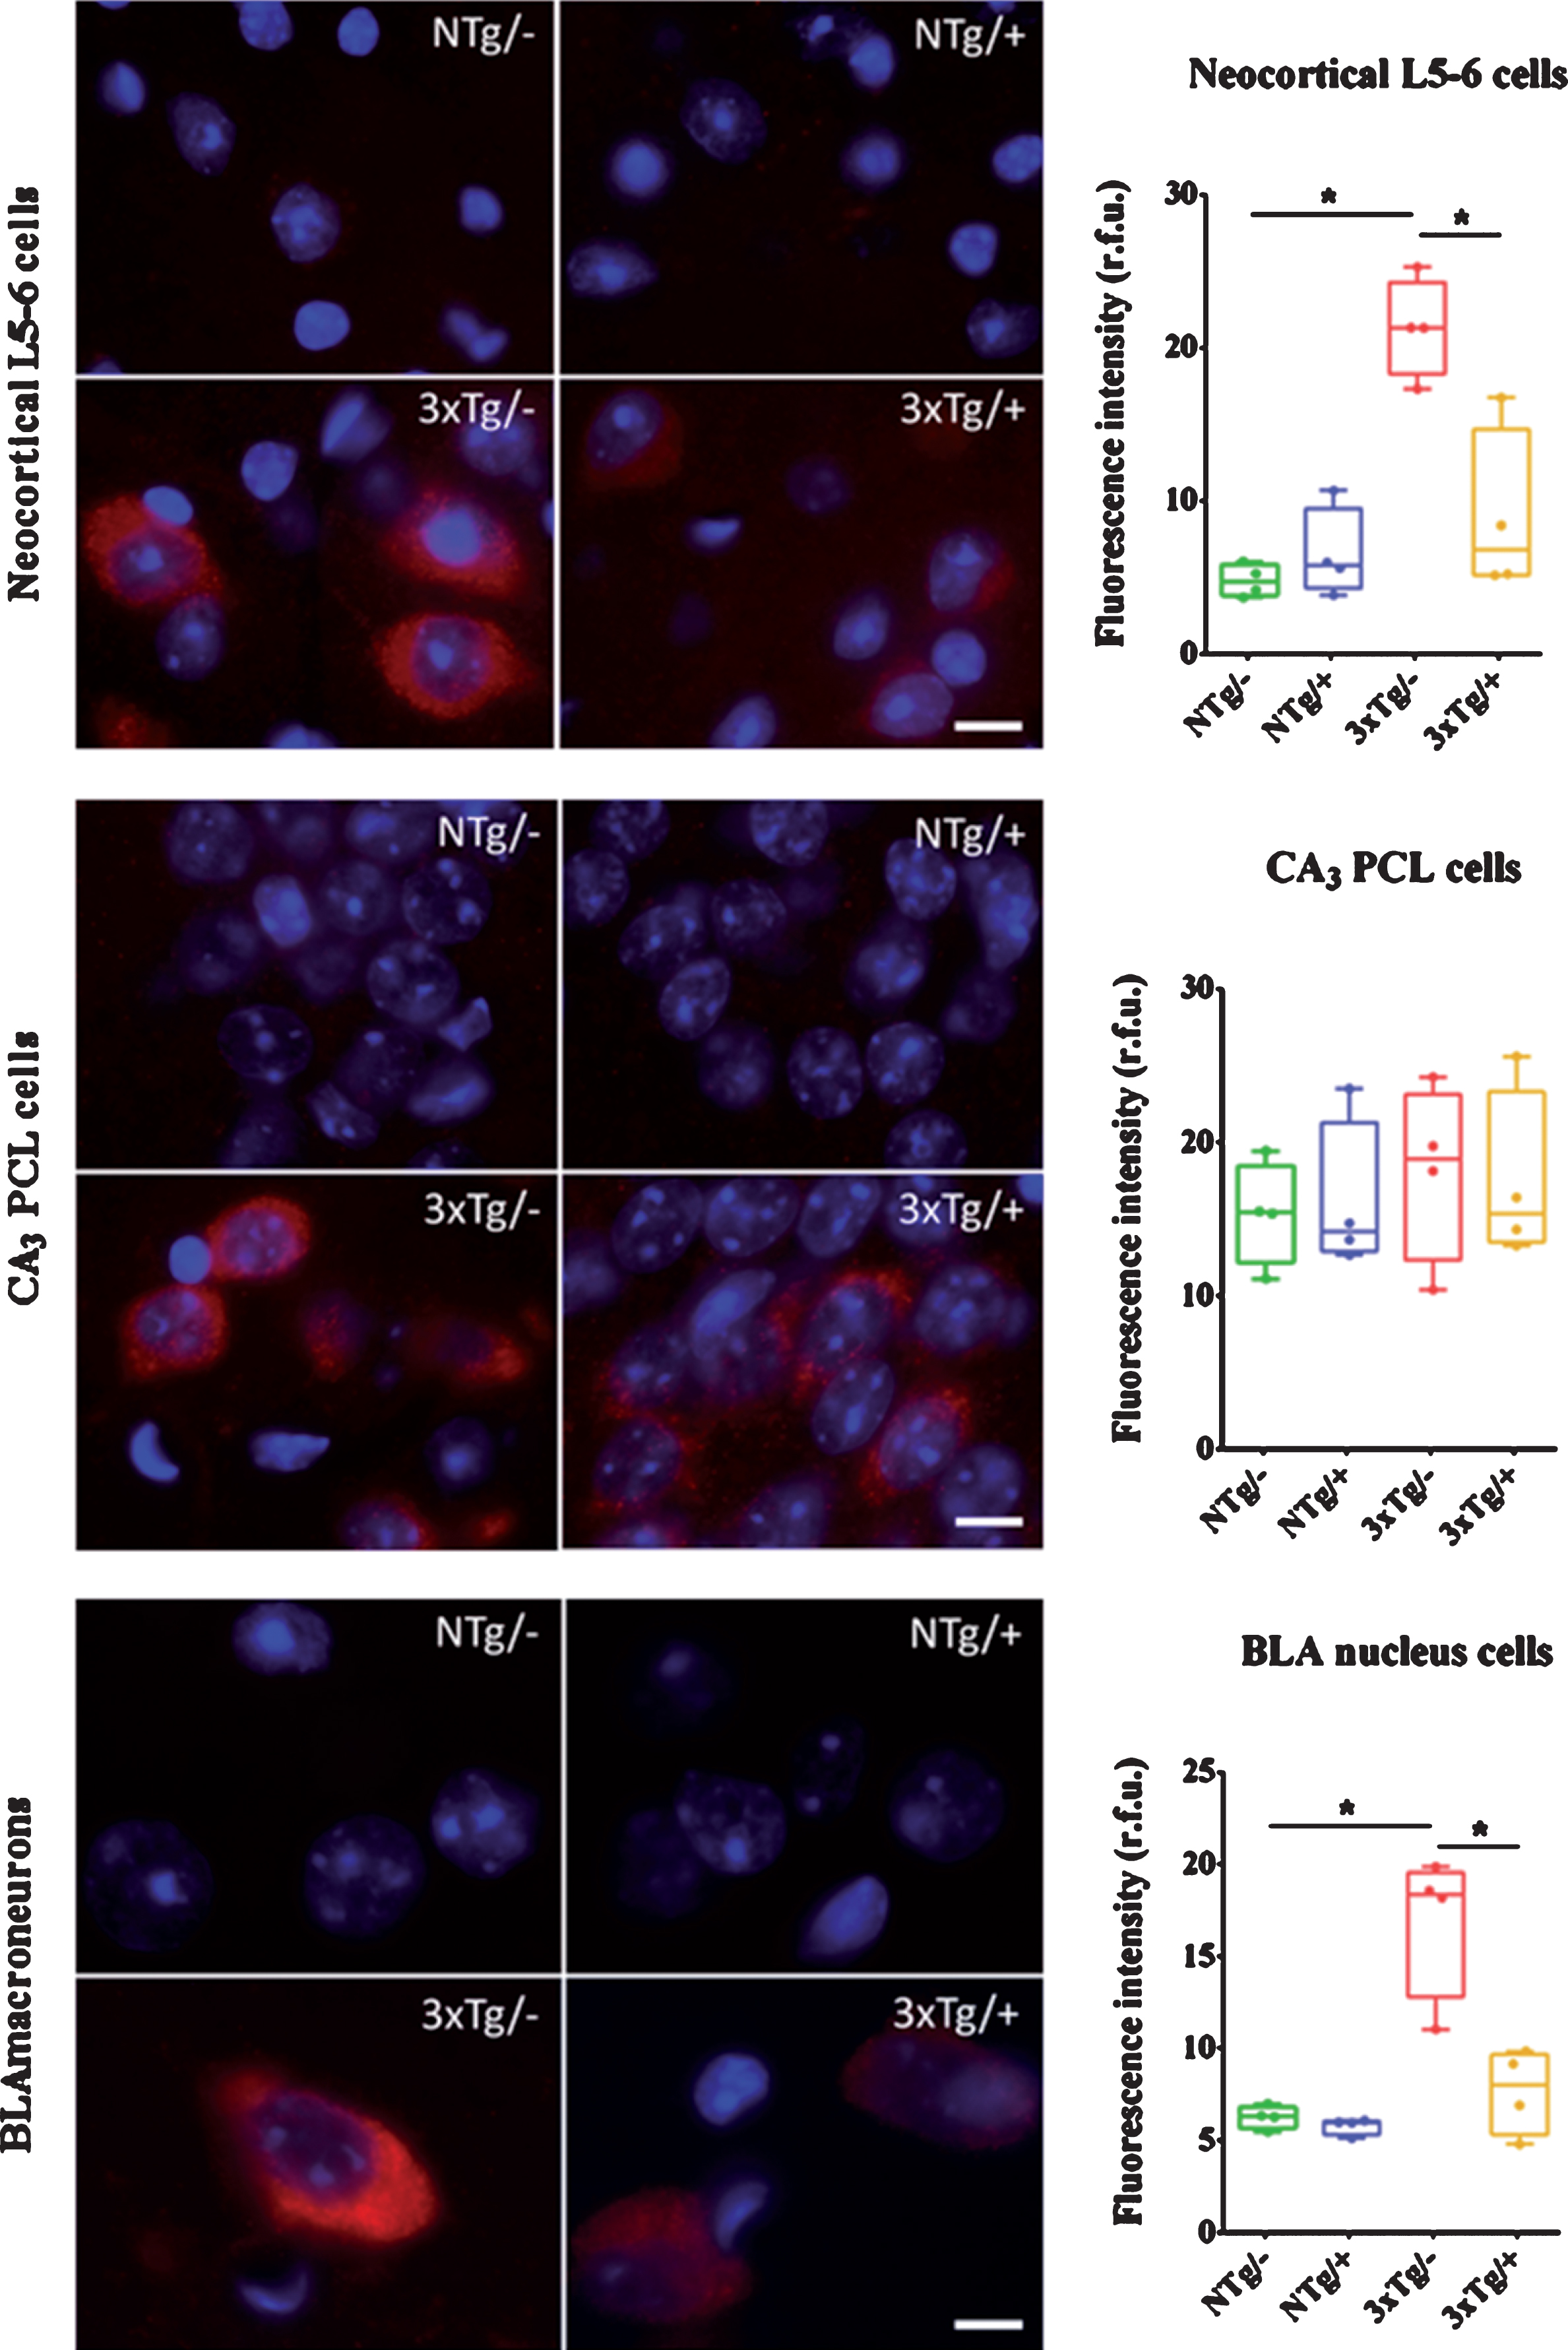
Intracellular 6E10-immunoreactivty decreases after scFv-h3D6 treatment. Representative images and quantifications of the intracellular 6E10-fluorescent signal within the large neurons from the deep layers V and VI of the cerebral cortex (L5-6) (A), cells from the pyramidal cells layer (PCL) at the region III of the Cornus Ammonis (CA3) in the hippocampus (B), and macroneurons from the basolateral amygdalar (BLA) nucleus (C). NTg/–, untreated non-transgenic mice; NTg/+, treated non-transgenic mice; 3xTg/–, untreated 3xTg-AD mice; 3xTg/+, treated 3xTg-AD mice. In red, 6E10-immunoreactivity; in blue, DAPI staining. Scale bars, 10μm. Intensities are expressed as medians in box plots and whiskers represent minimum and maximum values. Statistical differences were assessed with the non-parametric U-test. *significant differences with p≤0.05. Intracellular 6E10-ir signal was higher in all three analyzed populations from the 3xTg/- mice, being the cortical and amygdalar neurons the ones reaching significant differences compared to the NTg/–mice. All the increased intensities decreased to non-pathological levels after the treatment, reaching significance in those populations in which the 3xTg/–mice presented an evident increment.
In the hippocampus, the intracellular Aβ burden could not be measured in individual cells of the PCL because of their stacked disposition. Therefore, the intensity of the signal was measured in the entire CA3 PCL area. There was a slight increase in the Aβ signal in the hippocampus of the 3xTg-AD mice as compared with that in the NTg mice, but the finding was not statistically significant (18.9 and 15.4 r.f.u., respectively, Fig. 3B). It was likely that the signal intensity of that small percentage of Aβ-containing cells in the CA3 PCL (12%) became weakened when considering the entire layer. In common with the observations in the cortex, the fluorescence intensity of BLA macroneurons in the 3xTg-AD mice was significantly higher than that of BLA macroneurons in the NTg mice (18.3 and 6.3 r.f.u., respectively, U-value = 0, p = 0.0286). The values in the treated 3xTg-AD group (8.0 r.f.u.) were significantly different to those in the untreated mice (U-value = 0, p = 0.0286) and there was no statistically significant difference in the fluorescence intensity values in the treated 3xTg-AD group versus those in the NTg mice (Fig. 3C). These results pointed to the recovery of the non-pathological levels of fluorescence intensity after the treatment.
As a wide range of intensities was detected within each neuronal population, the cells were classified into five groups corresponding to increasing levels of 6E10 signal intensity. Interestingly, the effect of the treatment was evident in both cortical and amygdalar populations, where it promoted a noticeable reduction in the percentage of cells with higher levels of Aβ burden (Fig. 4). Given the stacked disposition of neurons through the PCL, the intracellular fluorescence signal could not be measured in individual hippocampal neurons. In addition, the low proportion of 6E10-ir cells precluded quantification.

Treatment with scFv-h3D6 reduces the proportion of neurons showing higher levels of 6E10-fluorescent signal. Large neurons from the cortical deep layers V and VI (L5-6) (A) and macroneurons from the basolateral amygdalar (BLA) nucleus (B) were classified in different grades of intracellular 6E10-signal intensities, from 1 (similar to the endogenous signal) to 5 (the highest value measured). NTg/–, untreated non-transgenic mice; NTg/+, treated non-transgenic mice; 3xTg/–, untreated 3xTg-AD mice; 3xTg/+, treated 3xTg-AD mice. Proportions of cells in each grade of intensity were expressed as percentages and represented as the corresponding means in the bars plots. The distribution pattern is modified by the treatment in both neuron populations, resulting in the reduction of the proportion of cells showing the highest grades of 6E10-signal and an increase in the ones presenting the endogenous intensity.
In summary, there were no significant differences in any of the parameters measured in the NTg mice treated with scFv-h3D6 versus those in the untreated mice. In the 3xTg-AD mice, the treatment promoted a reduction in intracellular Aβ, in terms of both the proportion of 6E10-ir cells and the amount of intracellular Aβ. Therefore, these findings indicate that a single i.p. injection of scFv-h3D6 efficiently reduced the intracellular amyloid burden.
The scFv-h3D6 treatment prevented neuronal loss
The number of cells in each neuronal population was counted in anatomically matched sections, divided by the corresponding area, and expressed as cell density (cells/mm2). Figure 5 shows the densities and the corresponding statistical analysis, as well as the extent of the preservation of densities with the treatment (calculated from means and expressed as percentages). In the cerebral cortex, the density of NFH-ir cells in the deep layers was similar in both untreated and treated 3xTg-AD mice, with a median of 14.8 cells/mm2 (Fig. 5A). Therefore, the treatment was not effective in preserving the cell density in the cortex of this murine model (Fig. 5D).

ScFv-h3D6 protects from neuron depletion. Cell density (cells/mm2) was quantified in NFH-ir cells from the deep layers V and VI (L5-6) in the cerebral cortex (A), cells from the pyramidal cell layer (PCL) at the region III of the Cornus Ammonis (CA3) in the hippocampus (B), and macroneurons from the basolateral amygdalar (BLA) nucleus (C). Densities are expressed as medians in box plots and whiskers represent maximum and minimum values. NTg/–, untreated non-transgenic mice; NTg/+, treated non-transgenic mice; 3xTg/–, untreated 3xTg-AD mice; 3xTg/+, treated 3xTg-AD mice. Statistical differences were assessed with the non-parametric U-test. #indicates 0.05≤p≤0.1, *significant differences with p≤0.05. The % of cell density preserved by the treatment (D) was quantified by considering mean values from the 3xTg/–as the minimum (or pathologic ones) and the NTg/–mice as the maximum (or non-pathologic ones). ScFv-h3D6 treatment significantly protected the hippocampal and amygdalar analyzed populations from neuron depletion. Images of the NFH-ir cells from the cortical deep layers, and NeuN-ir cells from the PCL in the CA3 and the BLA nucleus are represented in (E). Cell markers (NFH in the cortex and NeuN in the hippocampus and amygdala), in green. DAPI, in blue.
By contrast, scFv-h3D6 prevented neuronal depletion in the CA3 PCL region of the hippocampus, with an averaged preservation of 108%. The median value of 3,153 cells/mm2 in the treated 3xTg-AD mice pointed to the protective effect of the treatment when compared with that in the other groups (2,790 cells/mm2 in the untreated 3xTg-AD group, and 3,107 cells/mm2 in the NTg mice). Statistically, the treated 3xTg-AD mice significantly differed from the untreated mice (U-value = 0, p = 0.0286) and were far from achieving differences to the NTg mice. This finding supported the recovery of the non-pathological values by the treatment in the hippocampus (Fig. 5B and D).
The protective effect of scFv-h3D6 was also evident in the BLA nucleus, in which the cell densities were 757 cells/mm2 in the untreated 3xTg-AD mice and 1,192 cells/mm2 in the treated mice, a value close to the 1,294 cells/mm2 quantified in the untreated NTg group (Fig. 5C). Thus, the treatment resulted in 79% of cell density preservation (Fig. 5D). Furthermore, the untreated and treated 3xTg-AD mice presented statistically differences (U-value = 0, p = 0.0286) (Fig. 5C), but no significance was reached when comparing the treated 3xTg-AD to the NTg mice, pointing once more to the recovery of the non-pathological values.
Figure 5E shows representative images of the different cell populations studied (NFH-ir cells from the cortical deep layers, and NeuN-ir cells from the PCL in the CA3 and the BLA nucleus).
In summary, there were no significant differences in the neuronal density in the untreated and treated NTg mice. In contrast, in the 3xTg-AD mice, the treatment prevented neuronal loss in the amygdala and hippocampus, but not in the cortex.
The scFv-h3D6 treatment did not induce any detectable adverse responses
To detect potential adverse effects of the scFv-h3D6 treatment, we assessed neuroinflammation and the histology of peripheral organs post-treatment. In terms of astrocyte morphology, there were no noticeable differences among the groups (Fig. 6A). Comparison of the proportion of the GFAP-ir area and signal intensity among the experimental groups also revealed no significant differences (Fig. 6B). Immunostaining of hippocampal microglia showed no differences in microglia morphology among the groups (Fig. 6A). Neither the proportion of the Iba1-ir area nor the microglia density showed significant differences (Fig. 6B).
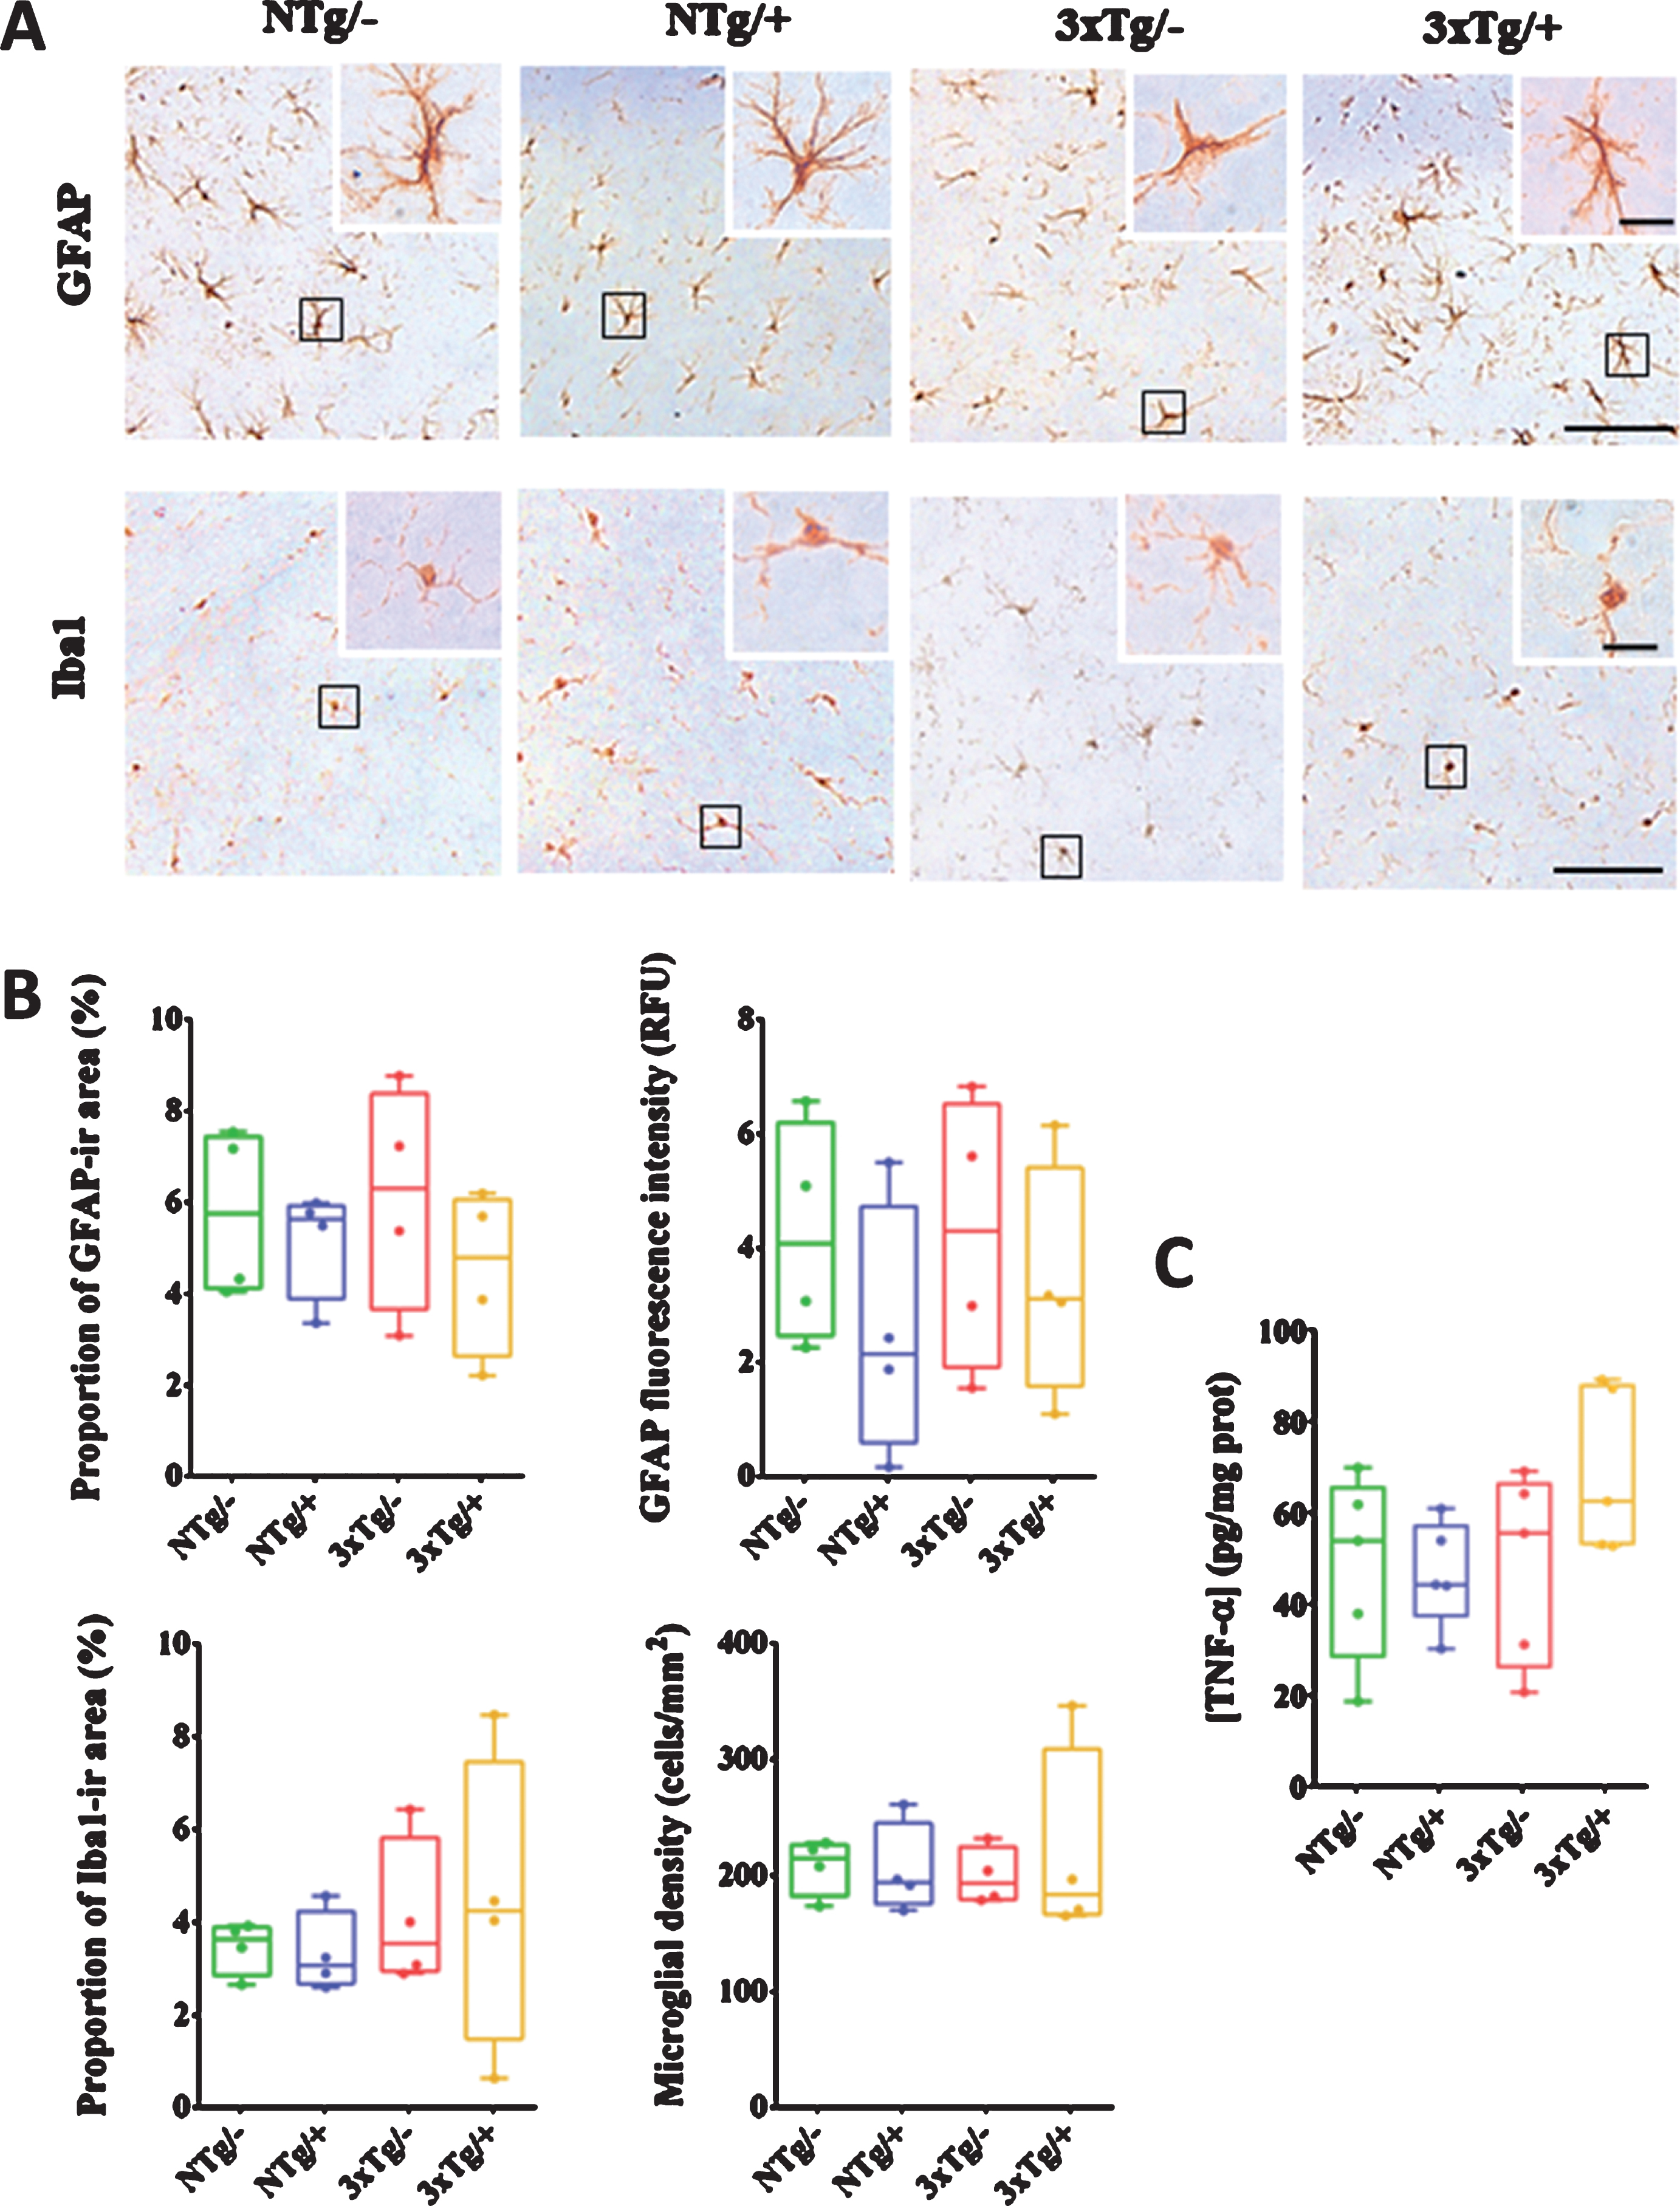
ScFv-h3D6 does not produce any neuroinflammatory response. GFAP (glial acidic fibrillary protein, as astroglia marker) and Iba1 (ionized calcium binding adaptor molecule 1, as microglia marker) immunodetection in the hippocampus (A). Squared cells from the images are higher-magnified to properly appreciate cellular morphology. Scale bars, 50μm (10μm in higher-magnified images). Histological quantification of astroglia (as proportion of GFAP-ir area and fluorescence intensity) and microglia (as proportion of Iba1-ir area and microglial cell density) are represented in (B). Levels of TNF-α (tumor necrosis factor-alpha) in hippocampal soluble extracts (C). NTg/–, untreated non-transgenic mice; NTg/+, treated non-transgenic mice; 3xTg/–, untreated 3xTg-AD mice; 3xTg/+, treated 3xTg-AD mice. Values are expressed as medians in box plots and whiskers represent maximum and minimum values. No statistical differences were found (U-test) among experimental groups in any of the analyzed parameters.
Quantification of the levels of TNF-α in hippocampal extracellular extracts revealed slightly higher levels in the treated 3xTg-AD mice as compared with that in the other experimental groups (Fig. 6C). However, the difference was statistically non-significant.
To shed light on the peripheral response to the treatment, histological features of the spleen, liver, and kidney were assessed, and the levels of transaminases were determined (Table 2). Briefly, the 3xTg-AD mice exhibited a tendency to increase the splenic size (U-value = 3, p = 0.0556), and a significantly higher ratio red/white pulp (U-value = 1, p = 0.0317), indicative of hypertrophy of the red pulp. Interestingly, splenomegaly was evident in the treated 3xTg-AD group (U-value = 0, p = 0.0079) in comparison to untreated 3xTg-AD mice and NTg mice. Furthermore, the ratio red/white pulp in the treated 3xTg-AD mice decreased until reaching the non-pathological levels, which provided evidence of an increase in the proportion of the white pulp post-treatment. Fibrosis and alterations in the cytoarchitecture of the spleen were not observed in any of the groups.
Peripheral response of the scFv-h3D6 treatment
Spleen, liver, and kidneys were histologically analyzed, and the levels of plasma transaminases determined. The quantified parameters are detailed in the left column. NTg/–, untreated non-transgenic mice; NTg/+, treated non-transgenic mice; 3xTg/–, untreated 3xTg-AD mice; 3xTg/+, treated 3xTg-AD mice. In qualitative analysis, Correct means a correct distribution of cellular types in the cellular layers of the organ; Negative means that specific dyes did not react. Values are expressed as medians with interquartile ranges. Statistical differences were assessed with the non-parametric U-test. #indicates 0.05≤p≤0.1, *significant differences with p≤0.05 and **p≤0.01, Acompared to the NTg/–mice, Bto the 3xTg/–mice.
In terms of the hepatic tissue, lipid droplets indicative of steatosis were observed throughout the liver parenchyma of the 3xTg-AD mice (Fig. 7). The observed steatosis could be related to the increase detected in the levels of AST or ALT transaminases. Although the increase in the levels of these transaminases was non-significant, it was partially solved by the treatment. Fibrosis and alterations in the cytoarchitecture of the liver were not observed in any of the groups.
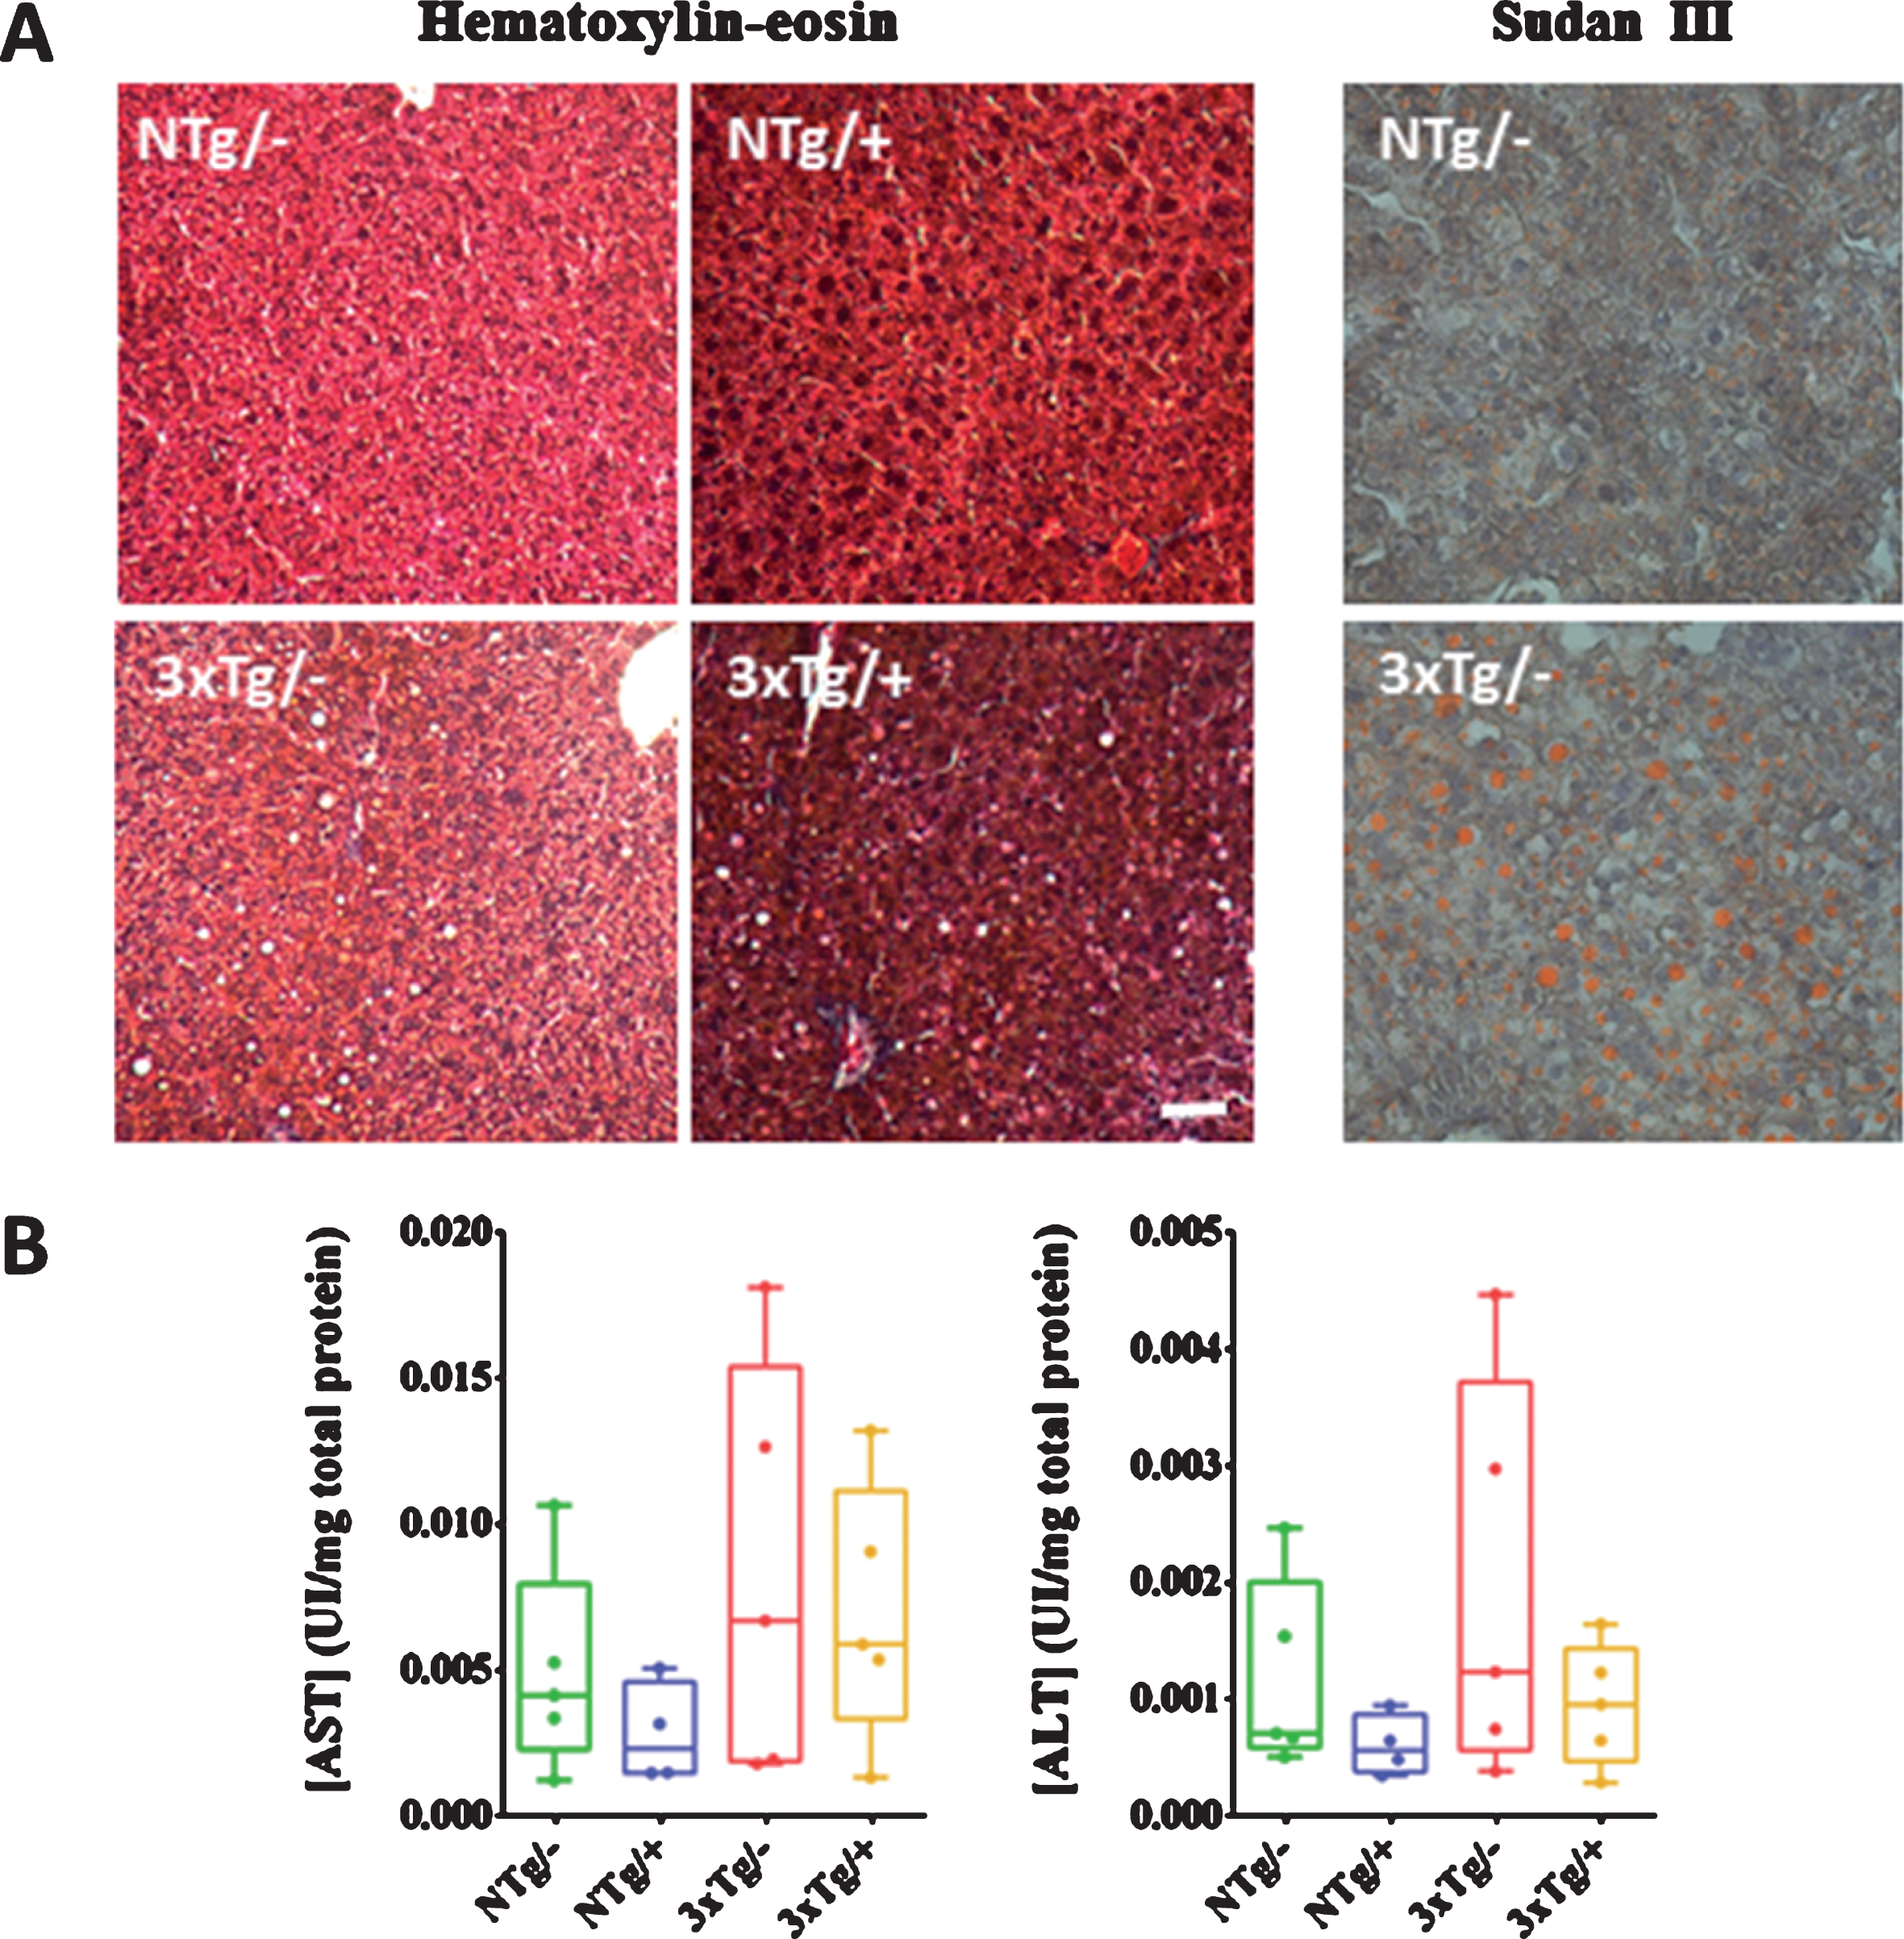
Non-alcoholic steatosis in 5-mo-old 3xTg female mice and hepatic function. Lipid droplets were observed by the hematoxylin-eosin staining in the hepatic tissue from the 3xTg mice, and confirmed by Sudan III staining of cryopreserved sections (A). Scale bar, 50μm. Plasma levels of AST and ALT are represented as markers of the hepatic function (B). No significant differences were found (U-test) among groups. NTg/–, untreated non-transgenic mice; NTg/+, treated non-transgenic mice; 3xTg/–, untreated 3xTg-AD mice; 3xTg/+, treated 3xTg-AD mice. Values are represented as medians within box plots and whiskers represent maximum and minimum values.
Finally, no alterations were detected in the cytoarchitecture, nor glomerular density, area, and Bowman capsule in the kidney. Likewise, functional impairment of the basal lamina was not observed, as the sections subjected to PAS staining appeared normal [26].
Effects of the scFv-h3D6 treatment on behavioral and cognitive impairments
As shown in Table 3, analysis of BPSD-like symptoms in the CT and OFT 1-day post-treatment revealed no significant differences in the untreated and treated 3xTg-AD mice in horizontal and vertical activities or in other emotional behaviors studied. This finding points to a lack of efficacy of the treatment to reverse anxious-like behavior in this murine model. The performance of a new cohort of mice (not shown in Fig. 1) in the behavioral tests (CT and OFT) was assessed 5-days post-scFv-h3D6 treatment and no significant differences were neither found (Supplementary Table 1).
BPSD-like symptoms in the CT and OFT 1 day after the treatment
The effect of scFv-h3D6 was assessed in terms of neophobia, exploration, and other emotional behaviors using the corner test (CT) and the open-field test (OFT). The analyzed parameters are detailed in the left column. NTg/–, untreated non-transgenic mice; 3xTg/–, untreated 3xTg-AD mice; 3xTg/+, treated 3xTg-AD mice. Values are expressed as medians with interquartile ranges. Statistical differences were assessed with the non-parametric U-test. #indicates 0.05≤p≤0.1, *significant differences with p≤0.05, **p≤0.01, ***p ≤ 0.001, and ****p ≤ 0.0001 compared to the NTg/–mice; no differences to the 3xTg/–mice were found. aData are already published and are shown for comparative purposes [12].
The results obtained in the NORT, performed 2-days post-treatment, are detailed in Table 4 and summarized in Fig. 8. The exploratory activity was evaluated by the total distance traveled in the arena, as well as the total time spent exploring the objects and the total number of visits (Fig. 8A). The exploratory activity of the 3xTg-AD mice was reduced, and the treatment had no effect on it, supporting the results obtained in the CT and OFT. Concerning recognition memory, the treated 3xTg-AD mice remained close to the novel object for a longer period than the untreated mice, as observed in a representative heat map (Fig. 8B). However, the discrimination indexes, which were calculated from the total time spent exploring each object and number of visits to each object, presented no significant differences between both 3xTg-AD groups (Fig. 8B).
Novel object recognition test
Exploration- and recognition-related parameters analyzed by the novel object recognition test (NORT) in both familiarization (AA’) and recognition (AB) stages are detailed in the left column. NTg/–, untreated non-transgenic mice; 3xTg/–, untreated 3xTg-AD mice; 3xTg/+, treated 3xTg-AD mice. Values are expressed as medians with interquartile ranges. Statistical differences were assessed with the non-parametric U-test. #indicates 0.05≤p≤0.1, *significant differences with p≤0.05, **p≤0.01, ***p≤0.001, and ****p≤0.0001 compared to the NTg/–mice; no differences to the 3xTg/–mice were found. a Data are already published and are shown for comparative purposes [12].
In the MWM paradigm, cognitive improvements were evident in the treated 3xTg-AD mice (Fig. 9). As shown by visual representations of the pathway pattern followed during the final probe, the treated 3xTg-AD mice swam in a more platform-directed way as compared with that of the untreated mice, which followed a random pattern (Fig. 9A). The number of entries to the platform area, latency of the first entry (both considered in the first segment of the test, 0–30 s), as well as the path efficiency, presented a tendency to ameliorate with the treatment (Fig. 9B). Differences between the untreated and treated 3xTg-AD mice were not significant but showed a trend in the latency to reach the platform area (U-value = 26.5, p = 0.0623). Specifically, the treated 3xTg-AD mice took a median time of 13.5 s to arrive at the platform area, whereas the untreated 3xTg-AD mice and NTg mice took 30 s and 13 s, respectively.

NORT performance of young 3xTg-AD female mice is barely improved 2 days after scFv-h3D6 administration. A) Untreated 3xTg-AD mice (3xTg/–) performed impaired exploratory activity compared to the non-transgenic mice (NTg/–), and it was not reversed by the treatment (3xTg/+). Track plots represent the pathway followed by the head of one representative animal of each experimental condition in the recognition stage (AB) of the NORT. The total distance traveled (m), total time exploring the objects (s), and number of explorations (n) are also represented as the quantifiable parameters of exploratory behavior. B) Heat maps show the average localization of all the animals from each experimental group during the recognition stage (AB). Colored scale, at the bottom of the panel. Discrimination indexes (DI) were calculated from the time spent visiting each object (the familiar object A, a circle, and the novel object B, a rectangle), as well as the number of visits to each one. Values are expressed as medians in box plots and whiskers represent maximum and minimum values. Statistical differences were assessed with the non-parametric U-test. *significant differences with p≤0.05, **p≤0.01, ***p≤0.001, and ****p≤0.0001. Despite the impaired exploratory activity of the 3xTg-AD mice, the tendency of the treated 3xTg-AD mice to cautiously stay near the novel object points to a potential improvement in recognition memory.
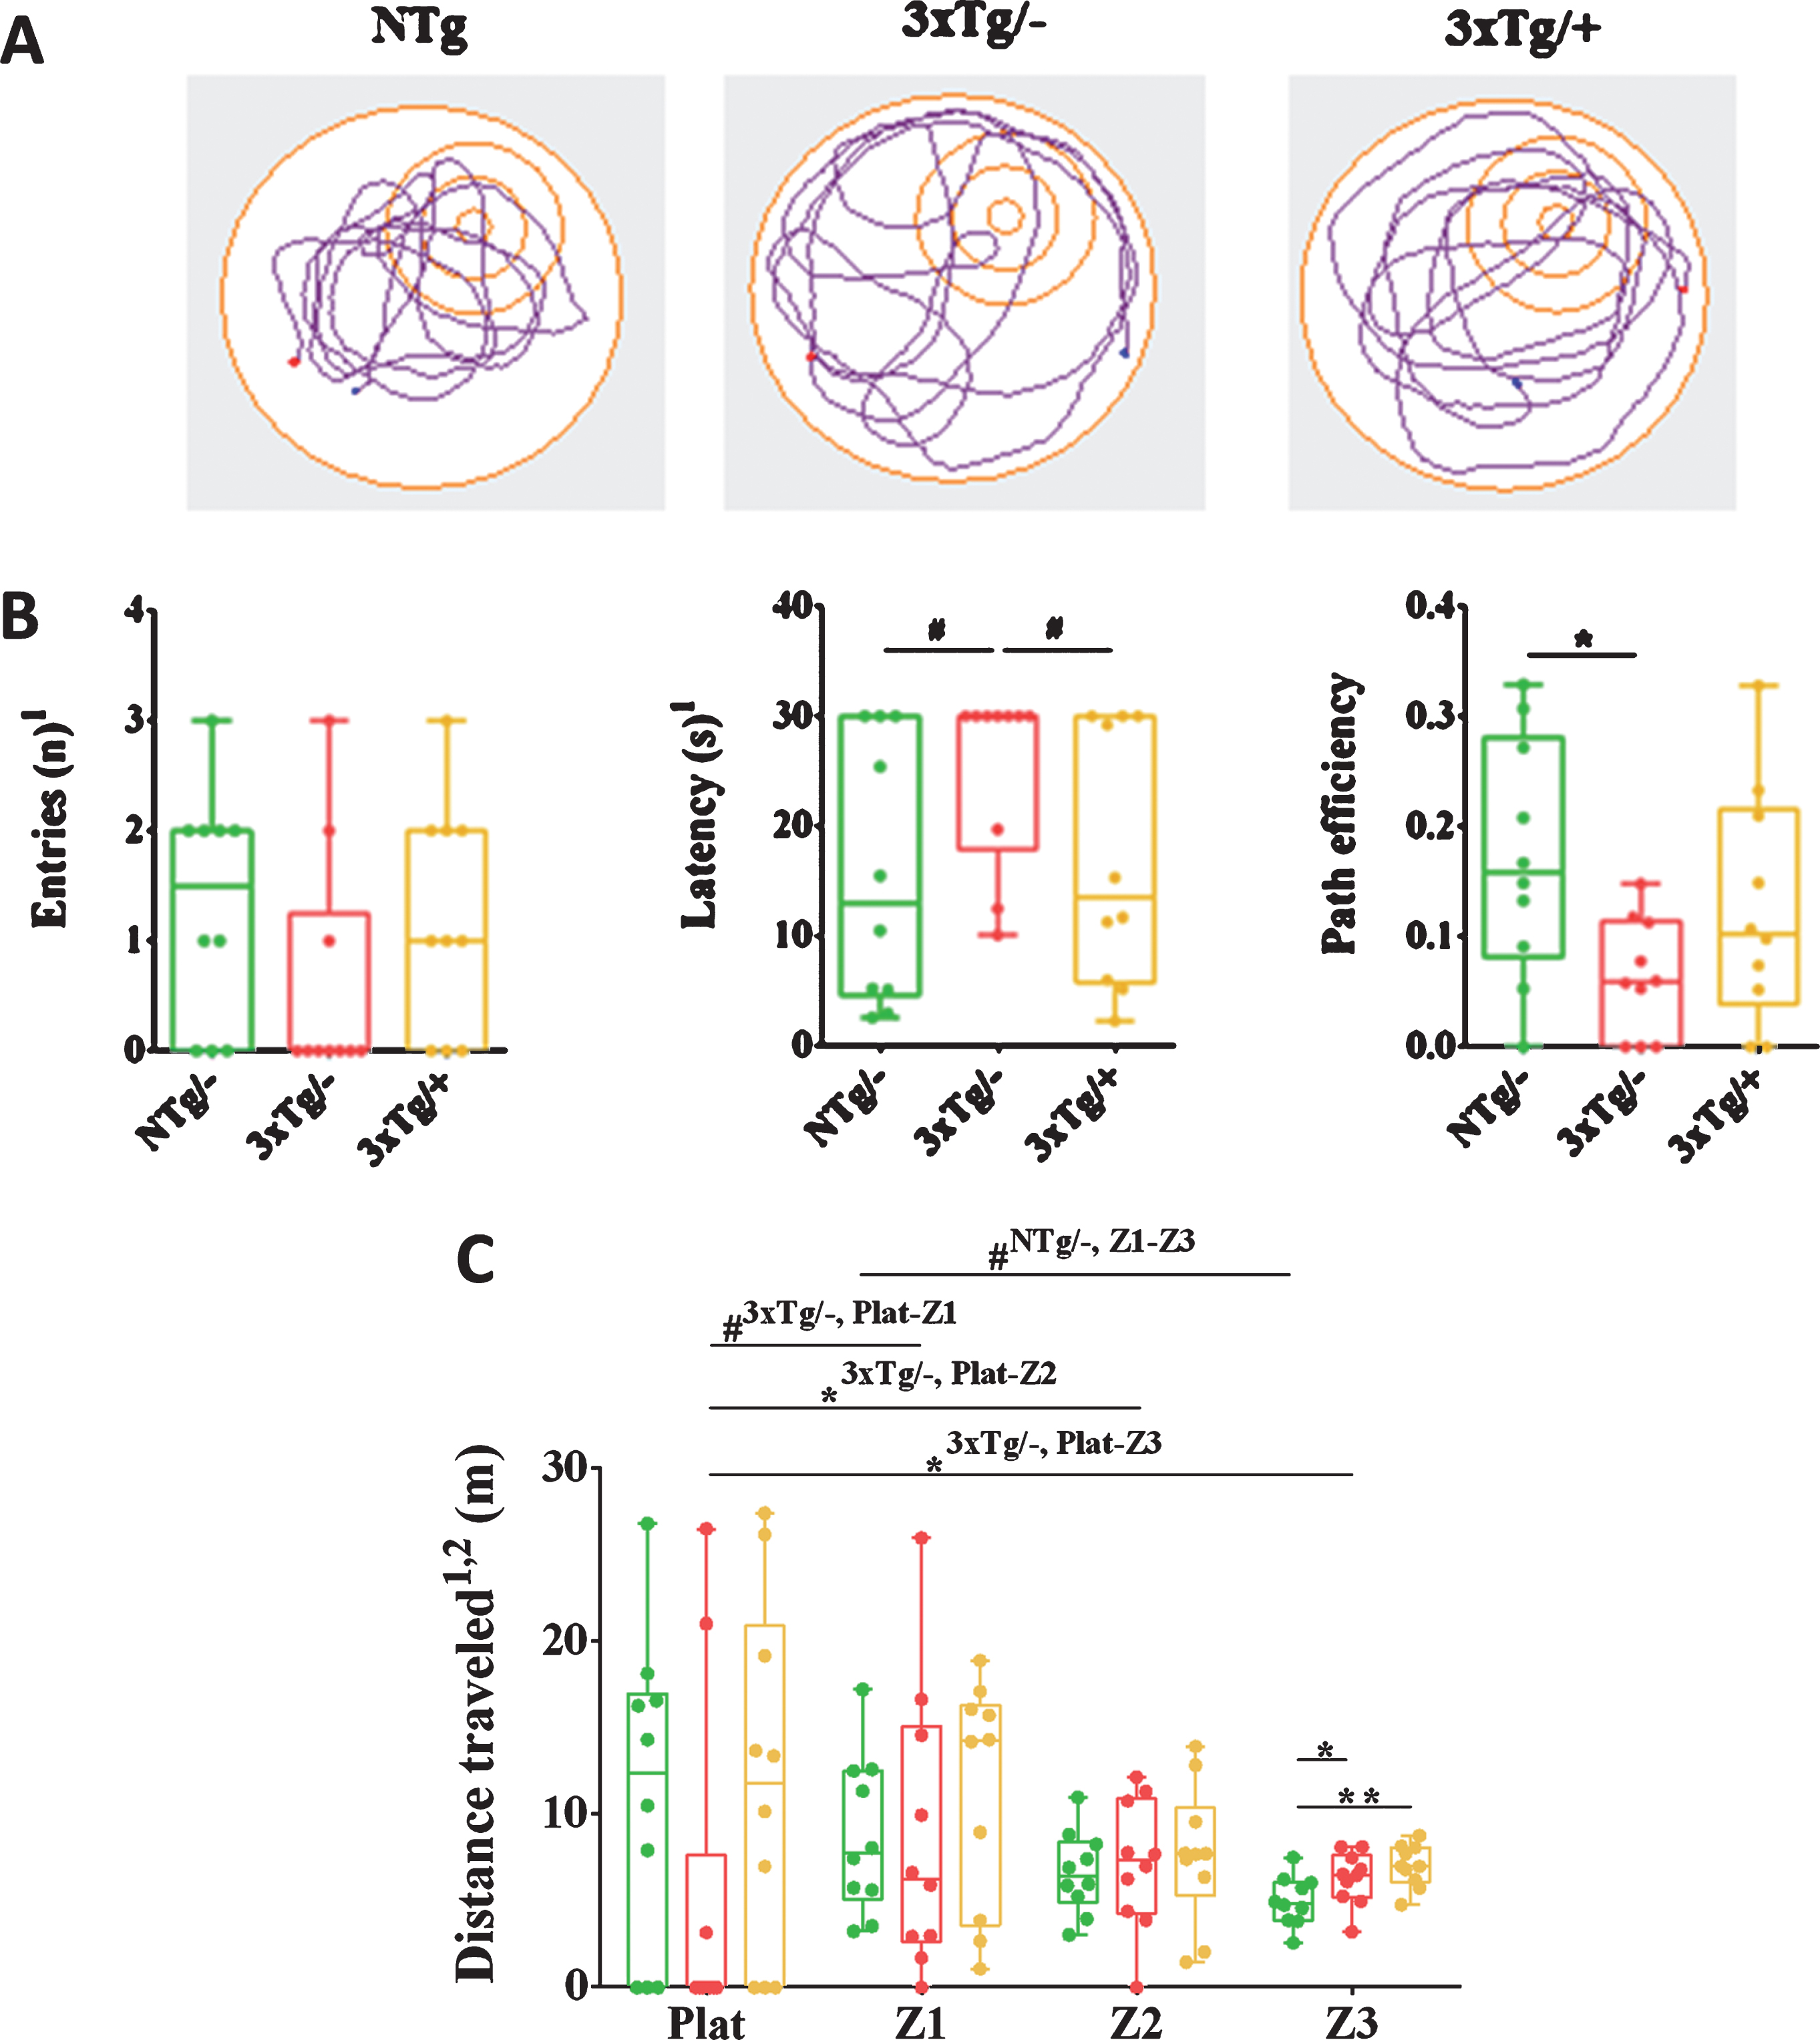
Spatial memory is ameliorated after scFv-h3D6 treatment. A) Track plots show the pathway followed to the platform with the example of one animal from each experimental group in the final probe of the MWM paradigm. B) Entries to the platform zone (n), latency of the first one (s), and path efficiency to the platform are expressed as medians in box plots and whiskers represent maximum and minimum values (n = 10). C) Comparison of the distance traveled (m) across virtual zones concentric to the platform, also acquired in the final probe of the MWM. 1parameters considered on the first segment of the test, 0–30 s. 2correspond to the distance per zone and are normalized to the areas occupied by each zone. Values are expressed as medians in box plots and whiskers represent maximum and minimum values. Statistical differences were assessed with the non-parametric U-test. #indicates 0.05≤p≤0.1, *significant differences with p≤0.05, NTg/–, untreated non-transgenic mice; 3xTg/–, untreated 3xTg-AD mice; 3xTg/+, treated 3xTg-AD mice. All the parameters analyzed tend to recover the non-pathological values after the treatment, with some of them reaching statistical significance.
Furthermore, virtual concentric circles were drawn around the platform to obtain four zones: the platform zone, the zone next to the platform area (zone 1), the middle zone (Z2), and external zone (Z3). Distance traveled in each of the zones was normalized by the area and considered to define the pattern followed by the animals during the final probe. Interestingly, the untreated 3xTg-AD mice followed a random pattern whereas the treated animals followed an ordered platform-directed pattern, which was similar to that followed by the NTg mice (platform area and the first zone around the platform were the most visited, followed by the middle zone and external zone) (Fig. 8C).
In summary, as shown by the CT and OFT performances, the treatment was not able to preclude the BPSD-like symptoms already described in 3xTg-AD 5-month-old female mice. However, the evident improvement in spatial memory, as shown by the performance in the MWM, demonstrated the capability of the treatment to improve AD pathology.
DISCUSSION
Therapies used today to treat AD patients are focused on ameliorating impairments in cholinergic or glutamatergic systems [27]. Therefore, the treatment is palliative and do not modify the disease progression. Given the central role of the Aβ peptide in neurodegeneration, Aβ-immunotherapy has emerged as a promising strategy for AD [28, 29]. Several full-length mAbs, such as bapineuzumab, solanezumab, gantenerumab, and aducanumab, have reached phase III of clinical trials (https://clinicaltrials.org). Bapineuzumab was the first mAb to show efficiency as a treatment for AD, but serious adverse effects, such as vasogenic edema and microhemorrhage, forced the discontinuation of clinical trials [15]. As these severe effects are thought to be related to the Fc fraction via FcγR-dependent activation of the microglia, the use of scFv fragments may constitute a safer therapeutic strategy than the use of full-length mAbs [16].
Efficiency of the scFv-h3D6 treatment
We previously showed that scFv-h3D6 treatment prevented Aβ-induced cytotoxicity in SH-SY5Y neuroblastoma cell cultures [17] and that it decreased Aβ oligomers in the cortex of 5-month-old 3xTg-AD female mice, in addition to having other beneficial effects [18, 19]. Importantly, these oligomers corresponded to trimers, hexamers, nonamers, and dodecamers, as assessed by a western blot with the 6E10 mAb, and they are the species on which the three-dimensional structure of Aβ40 amyloid fibrils is based [30, 31]. Therefore, the use of the 6E10 mAb in the 3xTg-AD murine model enables the detection of the Aβ peptide. Nevertheless, there is controversy in the literature about the specificity of this extensively used mAb [32]. Although the 6E10 mAb is directed against the N-terminus of Aβ (residues 3–10), it also detects full-length AβPP and CTFβ [33]. Intraneuronal accumulation of the Aβ peptide in the 3xTg-AD mouse model using the 6E10 mAb was first described by Oddo et al. [11]. However, in a later study on 3xTg-AD mice, the presence of intraneuronal AβPP rather than Aβ was claimed [34]. This article was retracted by the editors in 2015 because of evidence of data misrepresentation. Today, it is accepted that the 6E10 mAb can be used to detect the Aβ peptide [35–38].
In the 3xTg-AD mouse model, we recently found evidence of a correlation between intracellular amyloid pathology, as quantified by 6E10 immunoreactivity, and neurodegeneration in neuronal populations affected in the early stages of AD [12]. In this work, using an ELISA with a mAb directed against Aβ42, which recognizes different epitopes than 6E10 or scFv-h3D6, we demonstrated that the amount of Aβ decreased after the treatment, especially in the insoluble fraction. Intracellular Aβ accumulation is an early event in the formation of amyloid plaques and evidence exists that neurons that accumulate intraneuronal amyloid, degenerate, die, and give rise to neuritic plaques that affect neighbor cells [39].
The main aim of the present study was the assessment of the efficiency of scFv-h3D6 treatment on neuronal populations affected in the early stages of AD. The results revealed that the proportions of 6E10-ir neurons in the cerebral cortex, hippocampus, and amygdala of the treated 3xTg-AD mice were lower than those in the same regions in the untreated mice. A post-treatment reduction in the intracellular Aβ burden was also evident in the cortical and amygdalar populations, where Aβ levels were similar to those in the NTg mice. However, no significant differences were seen in the hippocampus. The latter may be explained by the relatively low hippocampal amyloid levels in young 3xTg-AD mice. As mentioned earlier, it could also be due to weakening of the signal intensity due to the stacked disposition of a small number of Aβ-containing cells in the CA3 PCL. Furthermore, cellular densities in the treated 3xTg-AD mice were higher than those in the untreated mice. Specifically, cellular densities in the treated 3xTg-AD mice were similar to those in the NTg mice in the hippocampus and amygdala, but not in the deep cortical layers. The latter was likely due to this area being the suspected area of origin of AD [10, 11], as well as to the considerable extent of cell death seen in 5-month-old mice. However, we cannot rule out whether the anti-NFH mAb used, which is suited for detecting neurons with a complex cytoskeletal structure [40], was specific for the detection of pyramidal neurons in deep cortical layers. Taking these caveats into consideration, a single i.p. dose of scFv-h3D6 conferred a dramatic improvement, both in terms of the reduction in the amyloid burden and neuronal preservation.
In the present study, neuronal preservation was detected 5d after a single dose of scFv-h3D6. However, further studies are needed to conclusively decipher whether the cell depletion observed in the 3xTg-AD mice corresponds to a neuronal death-related event or impaired neurogenesis, as both processes have been described in various transgenic models of AD, including the 3xTg-AD mice [8, 41–44]. The neuronal preservation mediated by the scFv-h3D6 treatment could be interpreted in terms of cell loss because: (1) neurogenesis has been demonstrated only in the hippocampus, and (2) it is evident that scFv-h3D6 precludes Aβ peptide-induced neuronal death in neuroblastoma cell cultures [17, 45].
The present study also suggested cognitive improvements, thereby pointing to functional effects of the treatment. The MWM test provided evidence of the recovery of spatial memory. However, the treatment did not prevent the anxious-like behaviors in the 3xTg-AD mice. The latter may be explained by the extent of intracellular amyloid pathology in the amygdala. Intraneuronal Aβ accumulation in this region has already been reported to enhance fear and anxiety in AD transgenic mice [46]. Our results shown that the amygdala was the most affected region in 3xTg-AD mice and still remained as the region with the highest proportion of Aβ-containing cells after the treatment. These data are consistent with the findings of a similar study, which reported that immunotherapy ameliorated hippocampal-dependent tasks but not amygdalar-dependent ones. As well, the treatment was able to clear intraneuronal Aβ from the cortex and hippocampus but not from the amygdala [47]. The poor effects of immunotherapy on the amygdalar amyloid pathology may be related to the timeline of appearance of AD-like pathology in different brain areas, being the amygdala one of the first regions involved in the disease [12, 48].
Insight into the safety of the scFv-h3D6 treatment
One of the main drawbacks of immunotherapy is neuroinflammation [49]. Differences in neuroinflammatory responses pose a problem in the translation of preclinical animal trials to human trials, as demonstrated previously in clinical trials [50, 51]. An evident inflammatory response (by increased levels of pro-inflammatory cytokines IL-1β and TNF-α) and microglial activation (by the increased microglial expression of CD11B and CD68) occurred when 3D6, the murine version of bapineuzumab, was tested in 18-mo-old Tg2576 mice, an AβPP-transgenic model, by injecting a single-dose of 2μg into the hippocampus [49]. Interestingly scFv-h3D6 did not induce the activation of the astroglia or microglia, neither significantly increased the levels of the pro-inflammatory TNF-α.
The 3xTg-AD mice showed splenomegaly, as previously reported [52], being concretely the red pulp the enlarged portion. Interestingly, this concurs with a recent publication by Brubaker et al., which supports the complement-dependent erythrocyte-mediated clearance of circulating immune complexes (known as immune adherence [53, 54]), applying it to the peripheral Aβ clearance [55]. The authors emphasize the role of erythrocytes in the capture of complement-opsonized Aβ peptide and the subsequent hepatic degradation via Kupffer cells in healthy organisms, and the impairment of this pathway in AD. Immune adherence has been considered to occur by the complement receptor 1 (CR1), which is uniquely present in primates, and to be significantly limited in sub-primates, whose erythrocytes express other complement receptors such as Crry [56]. However, our findings suggest a potential overload on the red pulp of the 3xTg-AD mice, were erythrocytes could be dealing with the overproduction of the Aβ peptide. Because this is concomitant with an increase in the size of the white pulp in the treated 3xTg-AD animals, it is tentative to suggest a relationship, which must further be investigated, between the peripheral complement interactions with the Aβ peptide and Aβ-immunotherapy, enhancing not only the erythrocyte capture of Aβ forming immune complexes (Aβ/scFv-h3D6 complex in this case), but also macrophages activation [57].
On the other hand, steatosis was detected in the liver of 3xTg-AD female mice, and this could be related with the increase in the values of AST or ALT transaminases also observed in this work, which, although were non-significantly different, were partially reverted by the treatment. These effects have been reported in the literature for rats on high fat diet-induced steatosis [58]. To our knowledge, this is the first description of the fatty liver pathology in this model, which paves the way to future studies.
As a general conclusion, we have proven that a single i.p. dose of 100μg of scFv-h3D6 dramatically reduces intracellular amyloid pathology, with the subsequent preservation of cell density and amelioration of cognitive disabilities. The treatment resulted safe in terms of neuroinflammation and kidneys and liver function, while the spleen could be involved in the clearance mechanism of the Aβ/scFv-h3D6 complex.
Footnotes
ACKNOWLEDGMENTS
This work was supported by the Instituto de Salud Carlos III [FIS-PI113-01330], Generalitat de Catalunya [2014-PROD00032] & Ministerio de Economía, Industria y Competitividad (MINECO, Spain) [SAF2017-89613], all three co-funded by FEDER. PIF-UAB student grants (GEC and LMG) & MAEC-AECI fellowship (GRH). The authors acknowledge Dr. J.L. Sánchez-Quesada from the Cardiovascular Biochemistry Group at the Research Institute of the Hospital de Sant Pau (Barcelona) for plasma determinations, Dr. Jaume Ferrer for advice with behavioral testing, and the Servei d’Estadística at the UAB for advice on data treatment.