
Abstract
Hyperphosphorylated tau is one of the key characteristics of Alzheimer’s disease (AD), and tau pathology correlates with cognitive impairment in AD better than amyloid-β (Aβ) pathology. Thus, a complete understanding of the relevant factors involved in tau phosphorylation is important for AD treatment. APOE ɛ4, the strongest genetic risk factor for AD, was found to be involved in tau pathology in frontotemporal dementia. This result indicated that apolipoprotein E (ApoE) may also participate in tau phosphorylation in AD. In the present study, we injected Aβ oligomer (AβO) into the lateral ventricles of wild-type (WT) mice and apoE-/- mice to test the process of tau phosphorylation in the acute phase. We found that the phosphorylated tau and phosphokinase levels were higher in WT mice than in apoE-/- mice. These phenomena were also confirmed in vitro. ApoE ɛ4-treated apoE-/- neurons exhibited more phosphorylated tau than ApoE ɛ2- and ApoE ɛ3-treated neurons. We also found that AβO induced more serious inflammation in WT mice and in ApoE-positive cultured neurons. Anti-inflammatory treatment reduced the phosphorylated tau level induced by AβOs in ApoE-positive neurons. These results suggest that ApoE may facilitate the phosphorylation of tau induced by AβO via inflammation.
INTRODUCTION
Alzheimer’s disease (AD) is the most common progressive neurodegenerative disease that causes dementia. AD is characterized by deposits of amyloid-β (Aβ) in senile plaques and intracellular neurofibrillary tangles composed of hyperphosphorylated tau [1]. The accumulation of Aβ oligomer (AβO), which can cause tau hyperphosphorylation and neuroinflammation, is now thought to be the trigger event that induces AD [2]. However, apart from the fact that only a few AD cases are caused by the redundant generation of Aβ due to mutations in the APP, PS1, and PS2 genes, the specific mechanism of AD is still unclear, especially the mechanism of late-onset sporadic Alzheimer’s disease (sAD) [3].
The APOE ɛ4 gene is the strongest risk gene for sAD discovered so far, and people with two copies of the APOE ɛ4 allele have a >8-fold increased risk of developing AD compared with people with the most common APOE ɛ3/ɛ3 genotype [4]. This genomic association promoted a series of studies on the pathological role of ApoE in AD. ApoE can bind to Aβ, and the ApoE-Aβ complex can be taken up by glial cells via ApoE receptors or transported across the blood-brain barrier for additional clearance under normal conditions [5]. However, the ability of ApoE ɛ4 to transport and clear Aβ is naturally defective [6]. Furthermore, the combination of ApoE and Aβ can also facilitate the aggregation of Aβ into oligomers [7, 8], and ApoE was also found to facilitate the deposition of Aβ in AD [9]. ApoE, especially the APOE ɛ4 allele, has been indicated to promote the transcription of APP and the generation of Aβ in neurons [10].
However, some evidence suggests that ApoE can also influence tauopathy independently of Aβ. ApoE was found to be associated with tau and phosphorylated tau (p-tau) in the cerebrospinal fluid (CSF) after correcting for the effect of ApoE on the amyloid-β 1–42 (Aβ1-42) levels [11]. The frequency of the APOE ɛ4 allele in people with frontotemporal dementia (FTD), which is characterized by tauopathy without Aβ, was significantly higher than that in people without FTD [12]. Neuronal expression of human ApoE in vivo results in tau hyperphosphorylation (E4>E3), and ApoE also aggravates tauopathy in a P301S tauopathy mouse model (E4>E3≈E2>EKO) [13]. These results suggested that ApoE may also be involved in the tau pathological process in AD. To test the effect of ApoE on the process of tau phosphorylation in AD, we treated mice and cultured neurons with AβO under ApoE-positive and ApoE-negative conditions. In the present study, we found that apoE-/- mice showed less p-tau than wild-type (WT) mice. The absence of ApoE preserved neuronal integrity and resulted in decreased p-tau in AD-like cell models. Moreover, the absence of ApoE also decreased phosphokinase expression and neuroinflammation both in vivo and in vitro.
MATERIALS AND METHODS
Ethics statement
All experimental procedures were performed according to the rules in the “Guidelines for the Care and Use of Mammals in Neuroscience and Behavioral Research”. The study protocol was approved by the Ethics Committee of Institutional Animal Care and Research Advisory Committee of Shandong University, Jinan, Shandong. Every effort was made to minimize the number of animals used and their suffering.
AβO preparation
AβO were generated as described previously [14]. One milligram of human synthetic Aβ1-42 lyophilized powder (Thermo Fisher, USA) was suspended in dimethyl sulfoxide (DMSO) to a concentration of 5 mM and sonicated for 10 min. The DMSO-Aβ1-42 solution was further diluted to a concentration of 100 μM with sterile, cold phosphate-buffered saline (PBS) containing 0.05% sodium dodecyl sulfate (SDS). The DMSO-Aβ1-42 solution was incubated for 24 h at 4°C to induce aggregation. The peptide solution was further diluted with PBS to 50 μM and incubated for another 2 weeks at 4°C to increase aggregation. Oligomer preparations were centrifuged at 13,000 rpm for 10 min at 4°C prior to use. All of these procedures were performed under sterile conditions.
Animals
Three-month-old apoE-/- mice with a C57BL/6 background and WT C57BL/6J animals were obtained from Vital River Laboratory (China) and raised in Shandong Provincial Hospital Animal House. The mice were housed in individually ventilated cages on a 12 h light–dark cycle at 21–23°C and 40–60% humidity. Mice were allowed free access to an irradiated diet and sterilized water.
Intracerebroventricular (i.c.v.) injection of AβO
Three-month-old apoE-/- and WT male mice were used in our research. Mice from each genotype were randomly divided into a control (saline-DMSO-treated) group (n = 6) and an AβO-treated group (n = 6). The animals were intraperitoneally anesthetized with a 5% chloral hydrate solution at a dose of 0.1 ml/10 g. After disinfecting the skin with alcohol, the scalp was shaved to expose the skull, and cannulae were implanted into a lateral ventricle (coordinates for the cannula tip from bregma: ML = 1 mm; AP = 0.5 mm; DV = 2.4 mm). Two microliters of a 10 μM solution of AβO or normal saline (containing an equal concentration of DMSO) was injected gradually (1 μL/min) once every other day for a total of three times. Mice were sacrificed 20, 30, or 40 days after the first injection.
Protein extractions
Ice-cold Tris-buffered saline (TBS) consisting of 20 mM Tris-HCl, 150 mM NaCl (pH 7.4), 1% Triton X-100, 2% SDS, 1 mM phenylmethylsulfonyl fluoride (PMSF), a protease inhibitor cocktail (Roche, Germany), and phosphatase inhibitor cocktail A (Beyotime, China) was added to the frozen hemisphere (excluding the cerebellum), which was then homogenized using a mechanical Dounce homogenizer and centrifuged for 30 min at 13,000×g. The extracts were frozen within 1-2 min of collection and stored at –80°C.
Primary cell cultures
Neuronal culture
Cerebral hemispheres isolated from 16-day-old WT and apoE-/- mouse embryos were digested with 2.5% trypsin (Thermo Fisher, USA) for 30 min, and the reaction was stopped with DMEM/F-12 (Thermo Fisher, USA) with 10% fetal bovine serum (FBS) (Thermo Fisher, Australia). Cortices were repeatedly pipetted up and down to achieve a homogeneous tissue suspension. The obtained cells were filtered with a 70 μm cell strainer and plated on poly-L-lysine (Sigma-Aldrich, USA)-coated coverslips in 35-mm dishes at a density of 1*105 cells/dish or in 6-well cell culture clusters at a density of 1.5*106 cells/cm2. After a 4 h culture with DMEM/F-12 + 10% FBS, the medium was replaced with neurobasal medium supplemented with 2% B27 (Thermo Fisher, USA) and 0.5 mM GlutaMAX-I (Thermo Fisher, USA). Ara-C (Sigma-Aldrich, USA) was added to the culture medium at a concentration of 5 μM within the first 48 h to kill the glial cells. The cultures were maintained for 14 days for further experiments.
Astrocyte cultures
Cortices isolated from neonatal WT or apoE-/- mice (1-to 2-day-old) were mechanically dissociated. The method used to homogenize the cortices was the same as that used to homogenize neuronal cultures. The obtained cells were plated on poly-L-lysine-coated flasks in DMEM/F-12 with 10% FBS. After 14 days, oligodendrocytes and microglia were removed from the mixed glial cultures by a differential shaking and adhesion procedure. The astrocytes were collected from the flasks by trypsinization. The cells were plated in 100 mm dishes (106 cells/dish). To reduce microglial growth, the culture medium was changed every second day.
Astrocytes were cultured for at least 1 month before carrying out experiments.
Preparation of astrocyte-conditioned medium (ACM)
Astrocytes were normally cultured in DMEM/F12 with 10% FBS ordinarily. Then, the DMEM was completely removed, and the dish was washed 3 times with PBS 48 h before AβO treatment. Astrocytes continued to be cultured in neurobasal medium with 2% B27 and 0.5 mM GlutaMAX-I for 48 h to provide ACM suitable for neurons.
AβO stimulation, recombinant ApoE, and sulforaphane (SFN) treatment
ApoE-/- neurons cultured with half fresh neuronal medium and half apoE-/- ACM were considered the apoE-/- ACM group. ApoE-/- neuron cultures with half fresh neuronal medium and half WT ACM were considered the WT ACM group. Prepared AβO were added to the two groups at a concentration of 3 μM, and the groups were cultured for 48 h to analogue the AD-like pathological process. The two groups of neurons with the same concentration of DMSO were considered the control groups. ApoE-/- neurons without any treatment were used as blank controls. WT neurons treated with or without AβO were used as positive controls. Recombinant ApoE ɛ2, ApoE ɛ3, and ApoE ɛ4 (Peprotech, Britain) (10 μg/ ml) were added to the neurons in the AβO-stimulated apoE-/- ACM group to evaluate their influence on tau phosphorylation. SFN (100 mg) (Abcam, USA) was diluted with DMSO to a concentration of 1 mM and was further diluted with PBS to 0.01 mM as the working solution. Cultured neurons were treated with SFN at a concentration of 0.1 μM 30 min before AβO stimulation. The other groups were treated with equivalent concentrations of DMSO to control for the influence of DMSO on SFN and AβO.
Cell viability assay
MTT was used to examine cell viability. Following the stimulation mentioned above, cells in 96-well plates were incubated with 10 μl of MTT (5 mg/ml, Sigma-Aldrich, USA) in serum-free medium at 37°C for 4 h. The supernatant was removed and replaced with 100 μl of DMSO (Sigma-Aldrich, USA) to dissolve the insoluble formazan crystals. The optical density (OD) was measured with a microplate reader (Tecan, Switzerland) at 570 nm. Data are represented as MTT reductions relative to the control. Neuron cytotoxicity was evaluated using lactate dehydrogenase (LDH) cytotoxicity assay kit (Beyotime, China) according to the manufacturer’s instructions. After the collection of the medium, the remaining cells were lysed in 0.9% (w/v) Triton X-100, and the LDH contents of the medium and lysed cells were measured to determine the total LDH content. The OD was measured at 490 nm. The amount of LDH released from the cells was calculated as the percentage of the total LDH level in each sample. The experiments were independently repeated six times.
Immunocytochemistry
Primary neuron cultures on coverslips were washed with PBS and then fixed with 4% paraformaldehyde for 30 min at room temperature. The neurons were then washed with PBS three times and permeabilized with 0.3% Triton X-100 for 30 min. After blocking with 10% serum for 1 h, the cells were incubated with anti-MAP2 antibodies overnight at 4°C followed by incubation with Alexa Fluor-conjugated secondary antibodies (Thermo Scientific, USA) for 1 h at room temperature. Nuclei were stained with the fluorescent dye 4′, 6-diamidino-2-phenylindole (DAPI) (Thermo Scientific, USA). Finally, the cells were mounted onto slides, and the stained sections were examined with a Leica fluorescence microscope. Using exactly the same settings, the images from the three independent cultures were captured with a 20× objective on a Leica microscope. We used ImageJ software to measure the area of MAP-2 and to trace the longest length of each neuronal process.
Cell lysates
After the removal of the cell culture medium, 100 μl of ice-cold lysis buffer (20 mM Tris pH 7.5, 0.5% Triton X-100, 0.5% deoxycholic acid, 150 mM NaCl, 10 mM EDTA, and 30 mM NaPyroP) and protease inhibitor (Roche) were added to the dish. The lysed cells were collected using a cell lifter (Costar), transferred to Eppendorf tubes, incubated on ice for 30 min and centrifuged (30 min, 4°C, 12,000×g). The supernatants were stored at –80°C until use.
ELISA
The levels of tumor necrosis factor α (TNF-α) and interleukin-1 beta (IL-1β) were determined using ELISA kits (Thermo Fisher, USA) according to the manufacturer’s instructions.
Western blot analysis
The protein concentrations of the samples were determined using a BCA protein assay kit (Thermo Scientific, USA). Samples were loaded resolved on SDS/PAGE gels, and the separated proteins were transferred to nitrocellulose membranes. The membranes were blocked in a solution of 5% fat-free milk for 30 min at 20°C and incubated overnight at 4°C with one of the following primary antibodies: rabbit polyclonal antibodies against ApoE (1:1,000, PA5-78803, Thermo Fisher), IL-1β (1:1,000, ab9722, Abcam), and TNF-α (1:1,000, ab9722, Abcam); rabbit monoclonal antibodies against p-tau at Ser-202 (1:1,000, #96628, CST), GSK-3β (1:2000, ab32391, Abcam), p-Ser9-GSK-3β (1:1,000, ab75814, Abcam), and CDK5 (1:500, ab40773, Abcam); and mouse monoclonal antibodies against total tau (1:250, ab80579, Abcam), p-tau at Thr-181 (1:500, 5H9L11, Thermo Fisher), and β-actin (1:1,000, sc-81178, Santa Cruz, CA, USA). Primary antibody incubation was followed by incubation at 37°C for 1 h with an HRP-labeled secondary antibody and subsequent visualization using enhanced chemiluminescence reagents (Millipore, USA). The membranes were scanned (Millipore, USA), and the ODs were determined using ImageJ software (v1.46; National Institutes of Health). For the analysis, the band density was normalized to that of β-actin.
Statistical analysis
The results are presented as the mean±SEM and analyzed by SPSS 20.0 for Windows (SPSS, Inc., Chicago, IL, USA). Statistical comparisons between two groups were tested using Student’s t-test or the Mann-Whitney u test, as applicable. The comparisons among groups were tested using one-way ANOVA followed by Bonferroni’s post hoc comparison, and trend analysis was performed when necessary. p < 0.05 was considered significant.
RESULTS
P-tau and ApoE increased with time in WT mice after AβO injection
We first tested the changes in p-tau in saline-DMSO-treated WT mice at different times in our experiments, and we found no significant changes at 20 days, 30 days, or 40 days (one-way ANOVA, F = 0.032, p > 0.05; Supplementary Figure 1). In contrast, p-tau (Thr181 and Ser202) increased significantly in the treated group 20 days after AβO injection compared with that in the control group (t-test, Thr181: t = –7.254, p < 0.01; Ser202: t = –9.158, p < 0.01; Fig. 1A–C). Moreover, p-tau also significantly increased over time (one-way ANOVA, Thr181: F = 28.549; Ser202: F = 147.33, p < 0.01; Fig. 1A–C). The p-tau content on day 40 after the injection was nearly 1.5 times that on day 20 (t-test, Thr181: t = –3.842, p < 0.01, Ser202: t = –9.618, p < 0.01; Fig. 1A–C). The protein expression of t-tau did not change significantly during the 40 days (one-way ANOVA, F = 0.078, p > 0.05; Fig. 1A, D). We also found that the content of ApoE in the brain increased significantly after AβO injection (one-way ANOVA, F = 43.127, p < 0.01; Fig. 1E). The content of ApoE on day 40 was also almost twice that of ApoE on day 20 (t-test, t = –7.205, p < 0.01; Fig. 1E, F). These results suggested that the expression of the two proteins is consistent with the pathological changes induced by AβO.

P-tau and ApoE increased consistently with time in WT mice after AβO injection (A–F). Western blot analyses of p-tau (Thr181), p-tau (Ser202), and t-tau in WT brain homogenates at different times after AβO injection (A). The band intensities were quantified and normalized to the band intensity of β-actin (B, C, D). Western blot analyses of ApoE in WT brain homogenates at different times after AβO injection (E). The band intensities were quantified and normalized to the band intensity of β-actin (F). Data are expressed as the mean±SEM (n = 6/group). *p < 0.05, **p < 0.01; NS, no significant difference.
AβO induced more p-tau in WT mice than in apoE-/- mice
We then measured the content of p-tau in WT mice and apoE-/- mice. We found that both WT and apoE-/- mice showed increased p-tau after AβO injection (t-test, Thr181: wt versus wt + AβO, t = –9.899, p < 0.01; apoE-/- versus apoE-/- + AβO, t = –16.191, p < 0.01; Ser202: wt versus wt + AβO, t = –7.283, p < 0.01; apoE-/- versus apoE-/- + AβO, t = –8.457, p < 0.01; Fig. 2A–C). However, the WT mice injected with AβO showed slightly more p-tau than the apoE-/- mice injected with AβO at 40 days (t-test, Thr181: t = 2.422, p < 0.05; Ser202: t = 2.903, p < 0.05; Fig. 2A–C). The t-tau levels did not differ among the four groups (one-way ANOVA, F = 0.745, p > 0.05; Fig. 2A, D). GSK-3β and CDK5 are two major phosphokinases. We then tested the expression of the two kinases at 40 days in the four groups. p-Ser9-GSK3β is the inactivated form of GSK-3β, and we found that the ratio of p-Ser9-GSK3β/GSK-3β decreased significantly after AβO injection in both WT mice and apoE-/- mice (t-test, wt versus wt + AβO, t = 26.105, p < 0.01; apoE-/- versus apoE-/- + AβO, t = 20.891, p < 0.01; Fig. 2E, F). The ratio of p-Ser9-GSK3β/GSK-3β decreased significantly in WT mice after AβO injection compared with in apoE-/- mice (t-test, t = –17.617, p < 0.01; Fig. 2E, F). The expression of CDK5 increased significantly after AβO injection in both WT mice and apoE-/- mice (t-test, wt versus wt + AβO, t = –15.259, p < 0.01; apoE-/- versus apoE-/- + AβO, t = –12.839, p < 0.01; Fig. 2E, G); the tendency was much more pronounced in WT mice than in apoE-/- mice (t-test, t = 4.933, p < 0.05; Fig. 2E, G). Phosphokinase expression can be influenced by neuroinflammation; thus, we then tested the contents of IL-1β and TNF-α in the mouse brain. We found that AβO induced apparent neuroinflammation in both WT mice and apoE-/- mice (t-test, IL-1β: wt versus wt + AβO, t = –14.677, p < 0.01; apoE-/- versus apoE-/- + AβO, t = –14.230, p < 0.01, TNF-α: wt versus wt + AβO, t = –18.797, p < 0.01; apoE-/- versus apoE-/- + AβO, t = –9.206, p < 0.01; Fig. 2H-G). Additionally, the AβO-stimulated WT mice exhibited a more severe neuroinflammatory response than the apoE-/- mice (t-test, IL-1β: t = 9.334, p < 0.01, TNF-α: t = 2.534, p < 0.05; Fig. 2H-G).
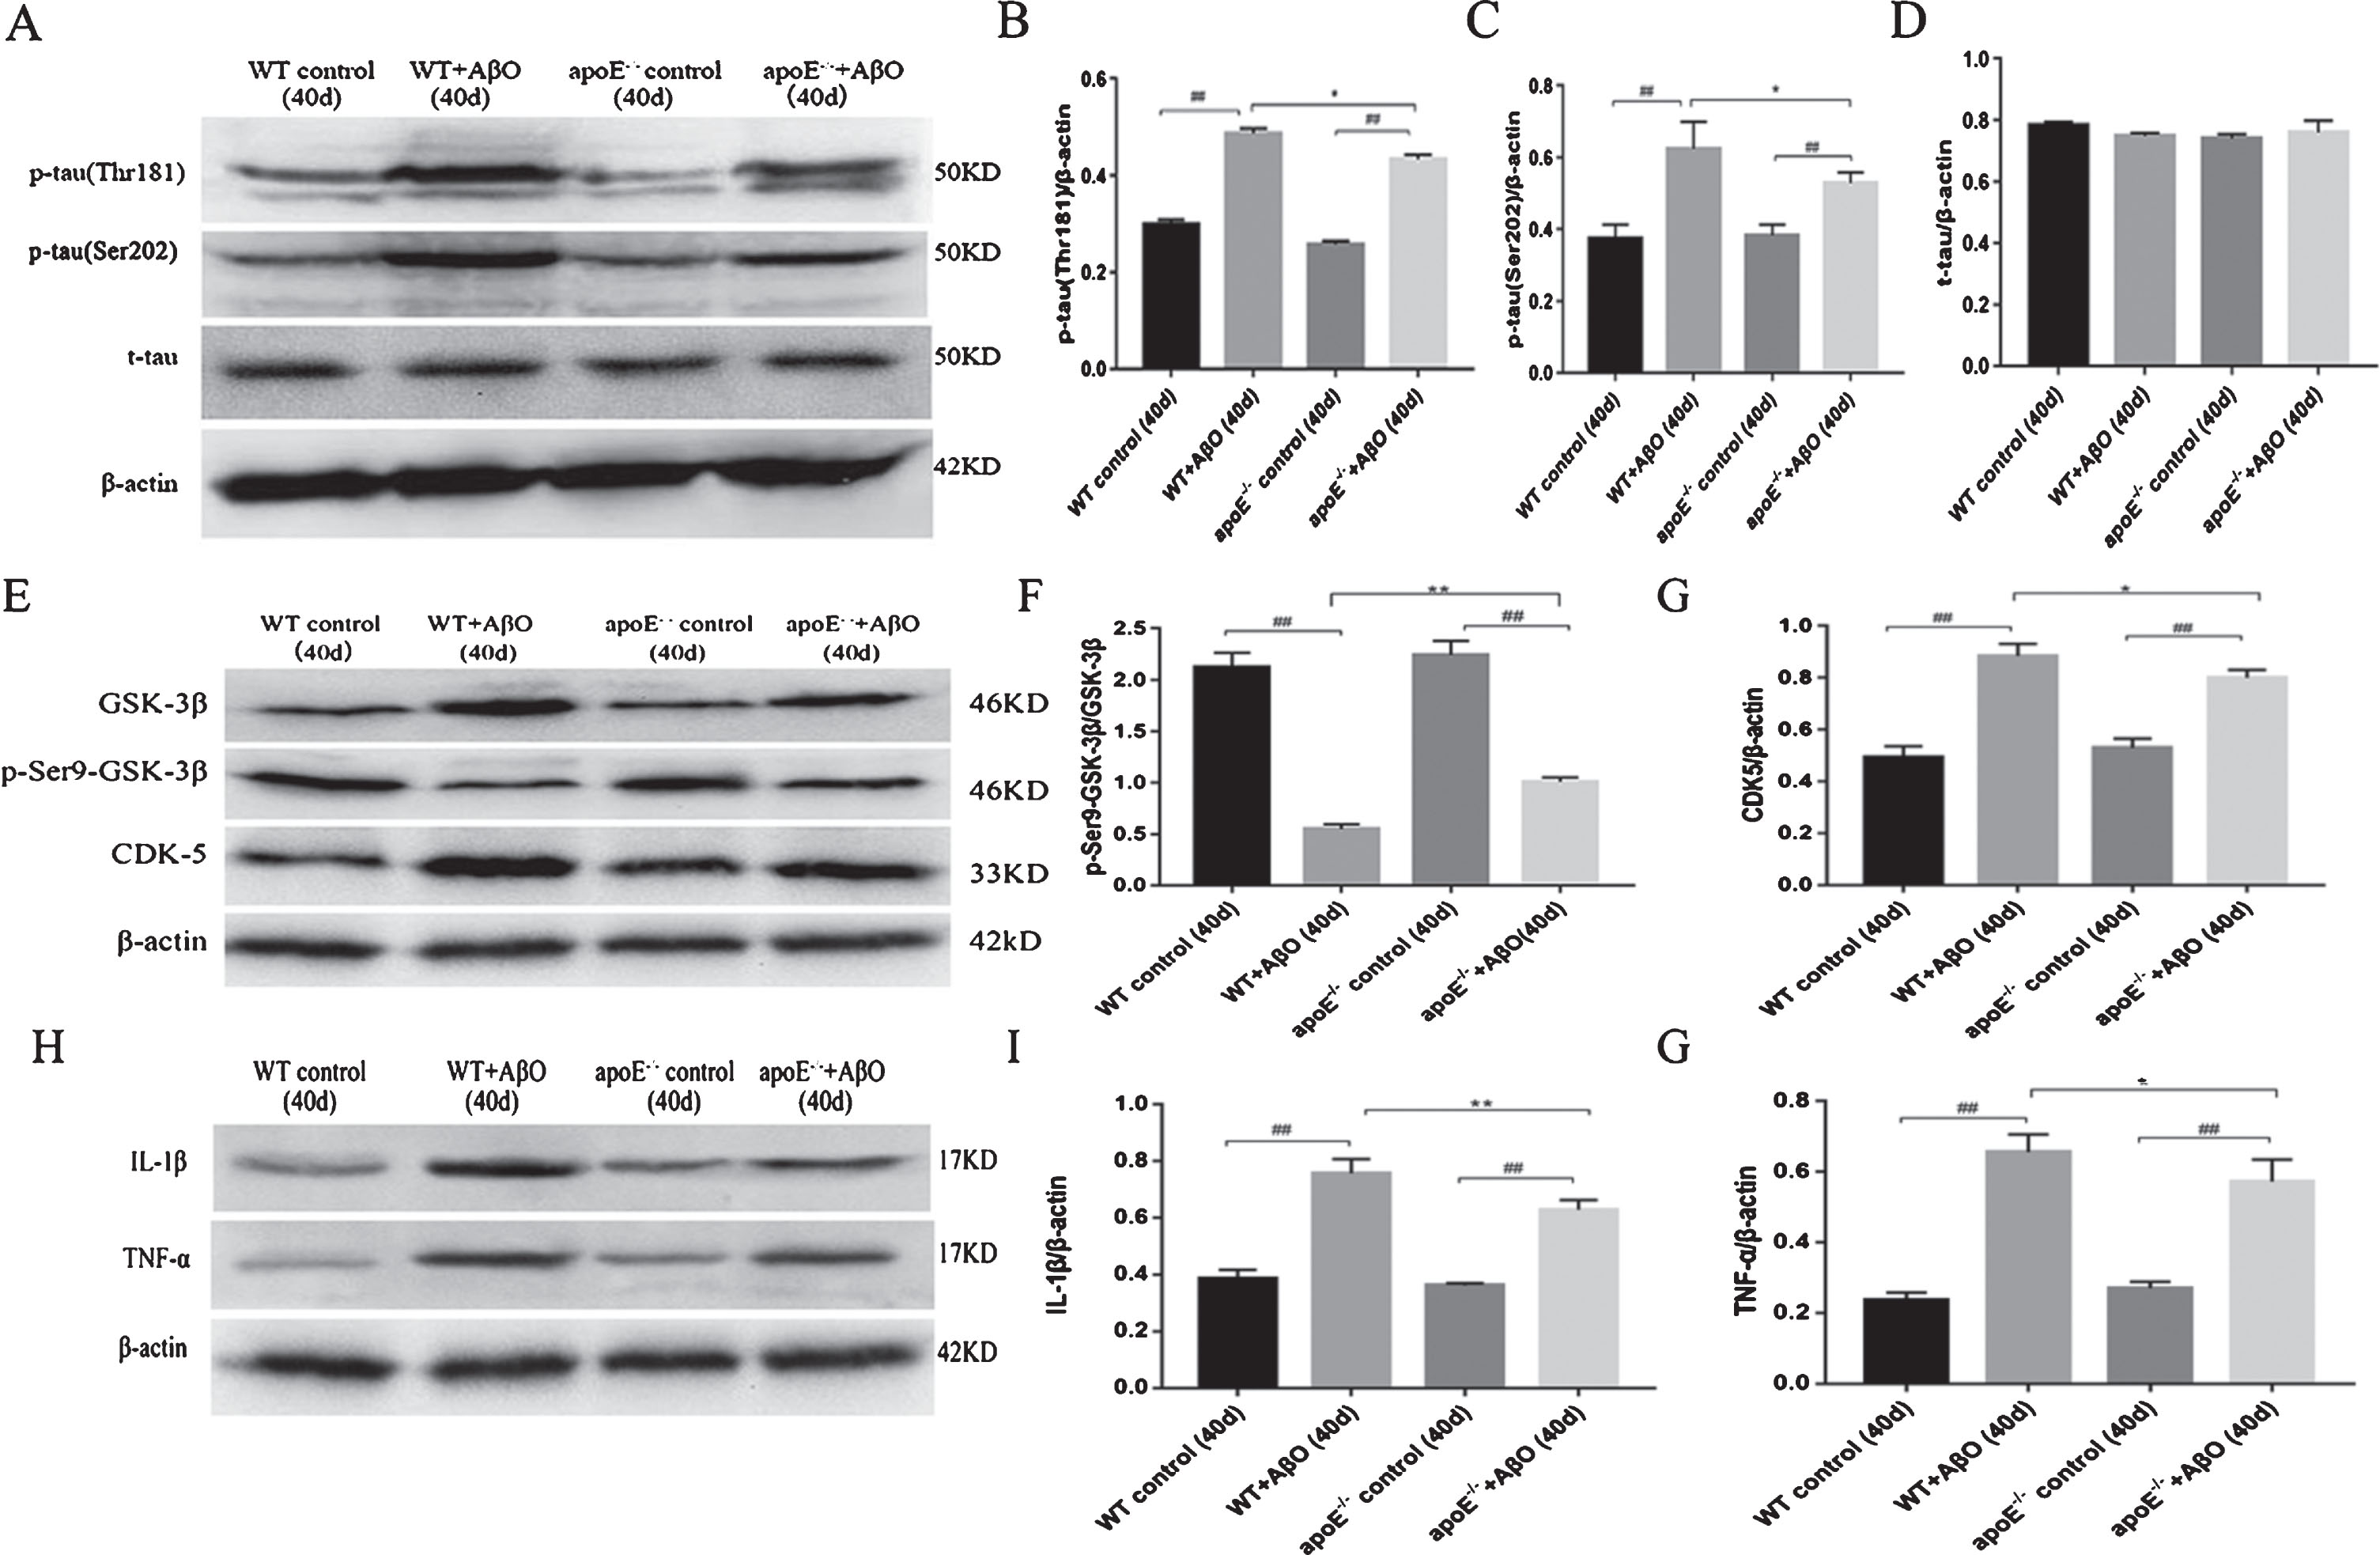
ApoE influences the processes of tau phosphorylation and inflammation induced by AβO in vivo at 40 days (A–G). Western blot analyses of p-tau (Thr181), p-tau (Ser202), and t-tau in brain homogenates at 40 days (A). The band intensities were quantified and normalized to the band intensity of β-actin (B, C, D). Western blot analyses of GSK-3β, p-Ser9-GSK-3β, and CDK5 in brain homogenates at 40 days (E). The band intensities of GSK-3β and p-Ser9-GSK-3β were quantified, and the p-Ser9-GSK-3β: GSK-3β ratio was calculated (F). The band intensity of CDK5 was quantified and normalized to the band intensity of β-actin (G). Western blotting for IL-1β and TNF-α in brain homogenates at 40 days (H). The band intensities were quantified and normalized to the band intensity of β-actin (I, G). Data are expressed as the mean±SEM (n = 6/group); # #p < 0.01 versus the control groups; *p < 0.05, **p < 0.01 versus the WT + AβO group.
The absence of ApoE preserved neuronal integrity after AβO stimulation in vitro
We further tested the effect of ApoE on AβO-induced pathological processes in cultured primary neurons. We treated apoE-/- neurons with apoE-/- ACM or WT ACM to observe the effect of ApoE. As shown in Fig. 3A-B, compared with the corresponding control neurons without AβO treatment, apoE-/- neurons treated with AβO displayed significantly decreased viability (t-test, apoE-/- neuron + apoE-/- ACM + AβO versus apoE-/- neuron + apoE-/- ACM control group, t = 42.983, p < 0.01; apoE-/- neuron + WT ACM + AβO versus apoE-/- neuron + WT ACM control group, t = 29.429, p < 0.01; Fig. 3A), and LDH release from apoE-/- neurons increased significantly after AβO stimulation compared with the corresponding control neurons (t-test, apoE-/- neuron + apoE-/- ACM + AβO versus apoE-/- neuron + apoE-/- ACM control group, t = –36.708, p < 0.01; apoE-/- neuron + WT ACM + AβO versus apoE-/- neuron + WT ACM control group, t = –47.82, p < 0.01; Fig. 3B). However, the apoE-/- neurons treated with apoE-/- ACM showed more cell viability and less LDH release after AβO stimulation than the apoE-/- neurons treated with WT ACM and the WT neurons treated with WT ACM (one-way ANOVA, MTT: F = 15.545, p < 0.05; LDH: F = 21.087; p < 0.01; Fig. 3A, B). We then stained neurons with anti-MAP2 antibodies to observe the morphological changes among the different groups. We found that neurons with either apoE-/- ACM or WT ACM were severely damaged after culture with AβO for 48 h. The neurons exhibited dissolved axons, decreased fluorescence intensities and unclear outlines (Fig. 3C). When comparing the apoE-/- neuron + apoE-/- ACM + AβO group with the apoE-/- neuron + WT ACM + AβO group and the WT neuron + WT ACM + AβO group, the apoE-/- neuron + apoE-/- ACM + AβO group neurons remained more morphologically intact than did the other two groups (Fig. 3C). The longest dendrite length was slightly longer in the apoE-/- neuron + apoE-/- ACM + AβO group than in the other AβO-stimulated groups (one-way ANOVA, F = 10.055, p < 0.05; Fig. 3D). The area covered by MAP2 immunoreactivity was better conserved in the apoE-/- neuron + apoE-/- ACM + AβO group than in the ApoE-positive neurons treated with AβO group (one-way ANOVA, F = 4.399, p < 0.05; Fig. 3E). These results indicate that ApoE is involved in AβO-induced neuronal toxicity.
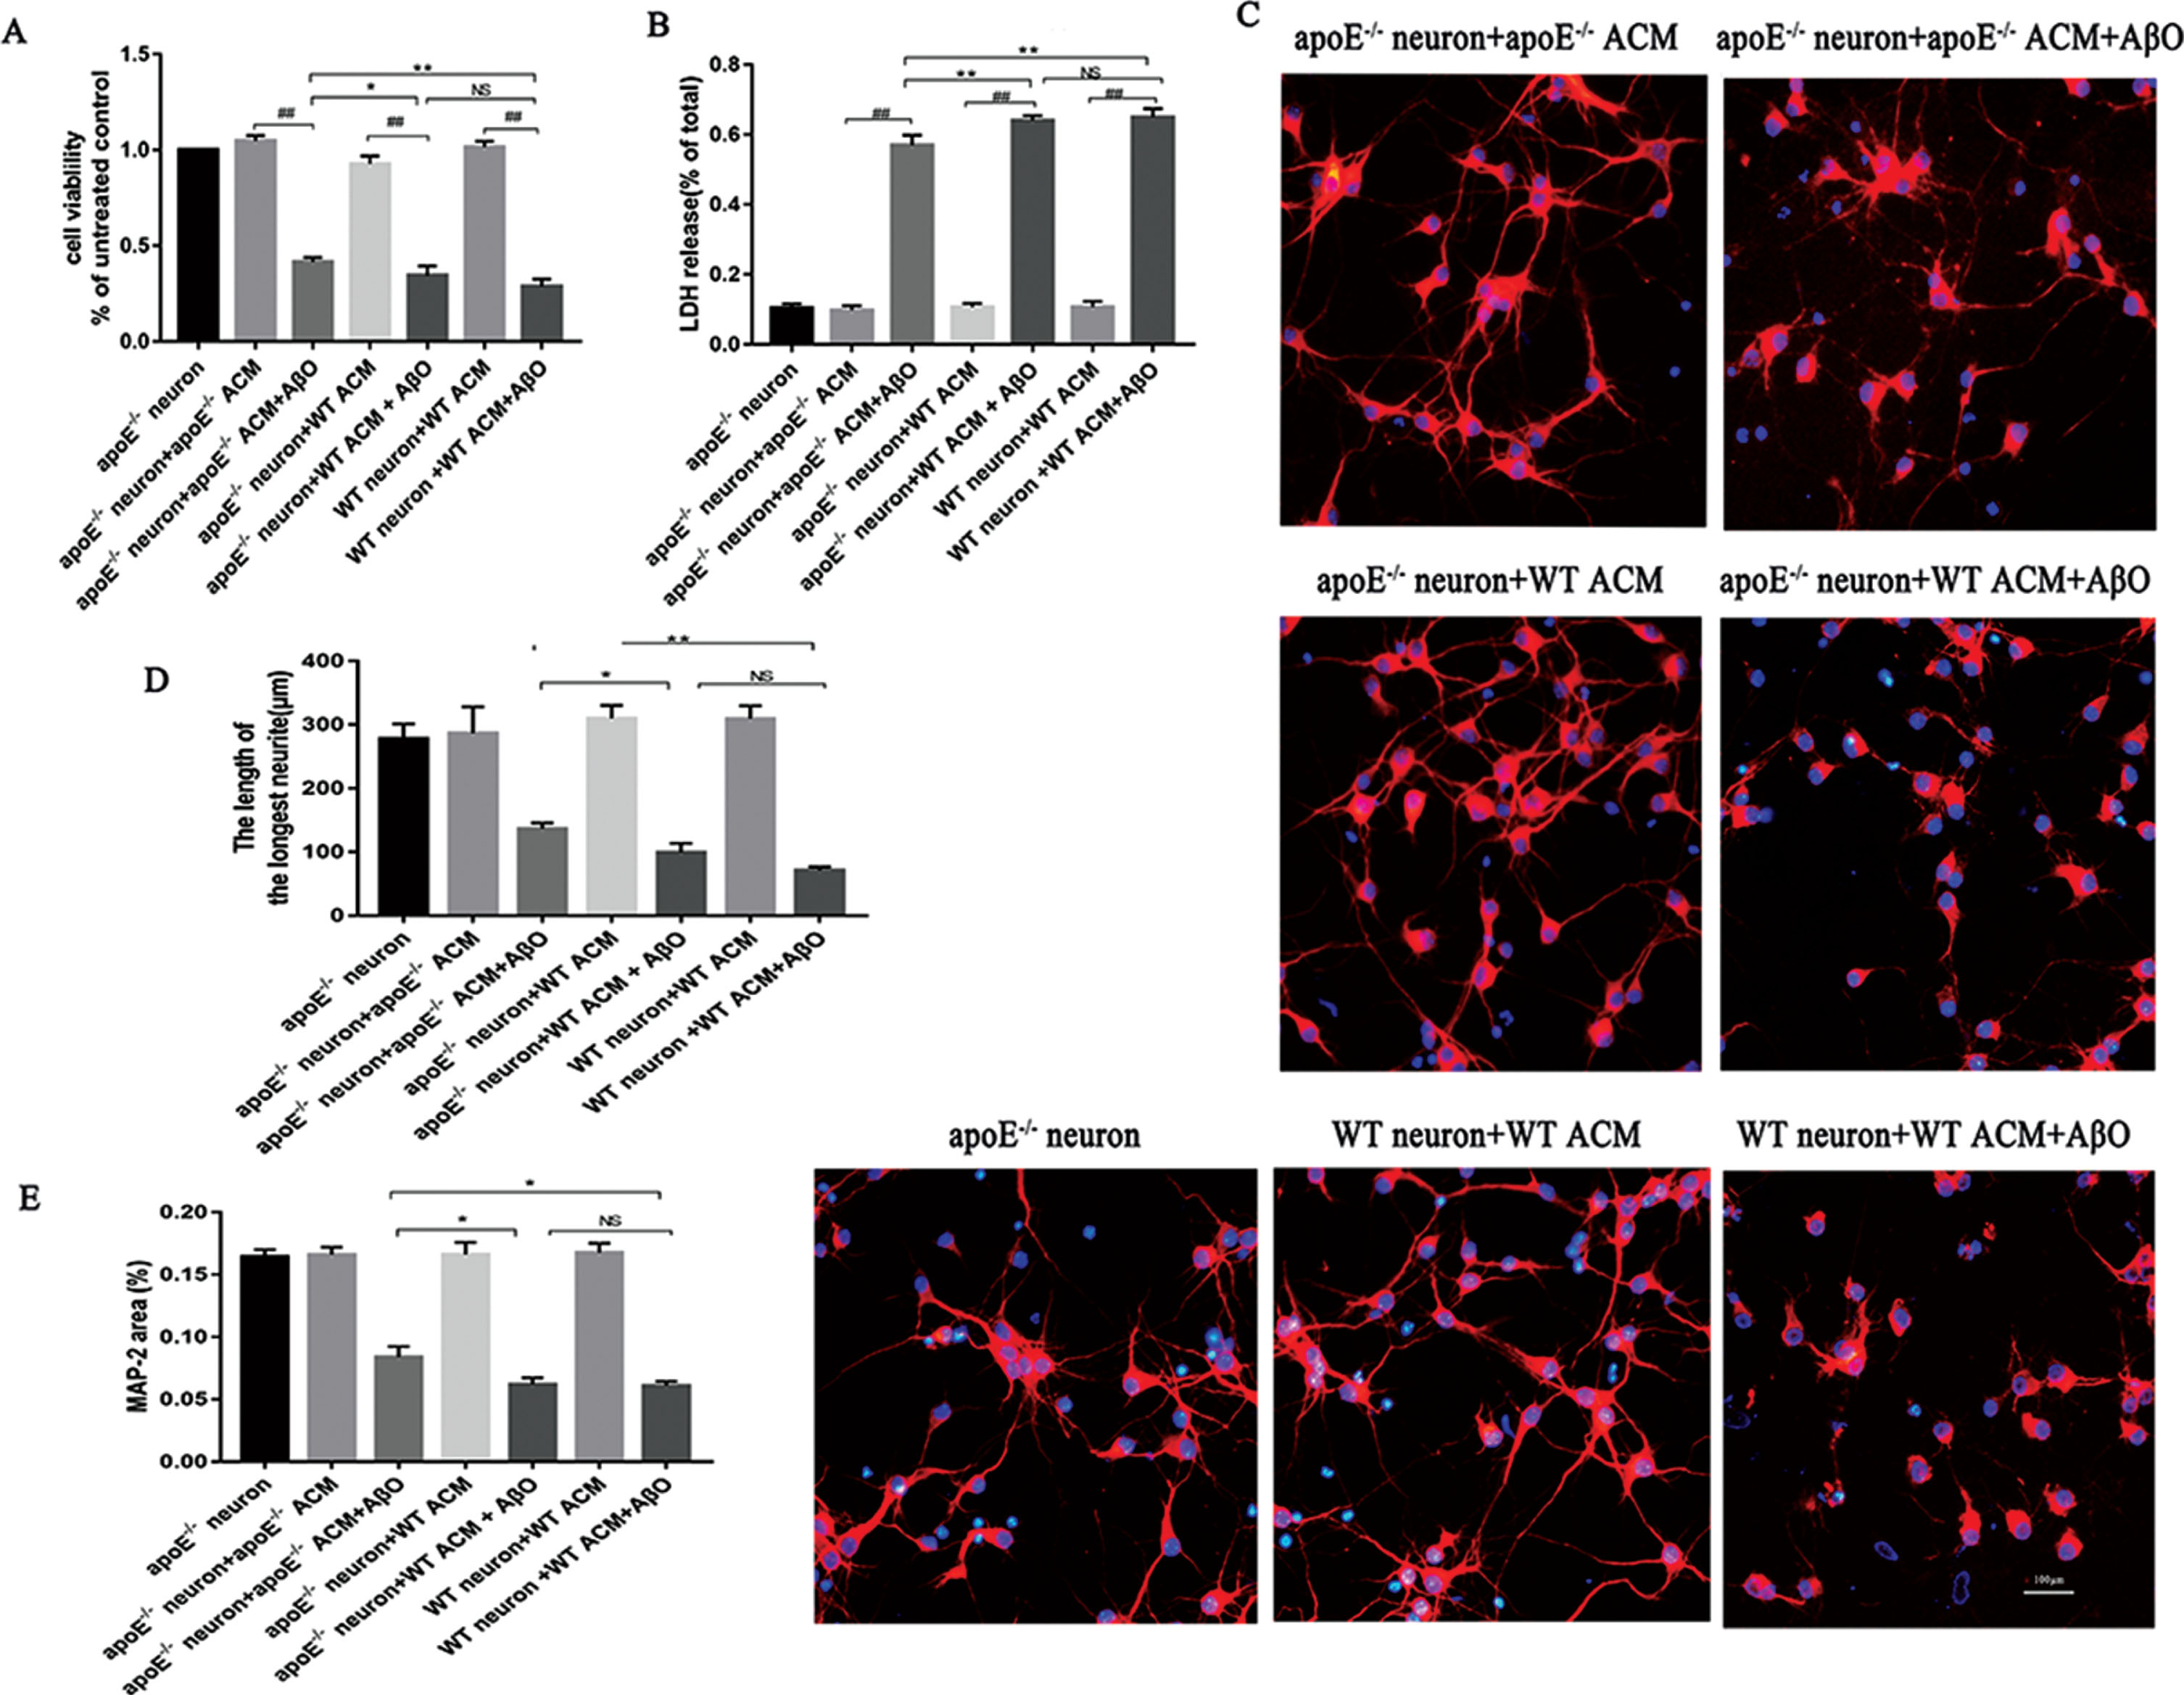
ApoE is involved in the process of AβO-induced neuronal injury in vitro. Fourteen-day-old cultured neurons were used for further research. AβO-stimulated groups were treated with AβO at a concentration of 3 μm. All groups were cultured for 48 h after different treatments. Cell viability is presented as a percentage of the untreated control (apoE-/- neuron group), and LDH release is presented as a percentage of the total (A, B). Each value represents the mean±SEM of six independent experiments. To observe the neuronal morphology, the different groups of neurons were stained with anti-MAP2 antibodies (red) (C). The lengths of the longest neuronal dendrites were analyzed (D). Quantification of neuron area covered by MAP2 immunoreactivity for different groups of neurons (E). Each value represents the mean±SEM of three independent experiments; scale bar: 100 μm; *p < 0.05, **p < 0.01. NS, no significant difference. # #p < 0.01, AβO treated neurons versus the corresponding control groups.
The absence of ApoE led to decreased p-tau after AβO stimulation in vitro
T-tau and p-tau (Thr181 and Ser202) were also measured in the different groups in vitro. As shown in Fig. 4A and B, the content of p-tau (Thr181 and Ser202) increased markedly in all groups of neurons after AβO stimulation (one-way ANOVA, Thr181: F = 77.413, p < 0.01; Ser202: F = 448.387, p < 0.01; Fig. 4A–C); we then compared the content of p-tau among all the AβO-stimulated groups and found that the content of p-tau in the apoE-/- neuron + apoE-/- ACM + AβO group was less than that in the ApoE-positive group (one-way ANOVA, Thr181: F = 5.160, p < 0.05; Ser202: F = 15.271, p < 0.01; Fig. 4A–C). This phenomenon indicated that ApoE was also involved in the phosphorylation of tau after AβO stimulation in vitro. We also observed that the contents of IL-1β and TNF-α in the ApoE-negative groups were less than those in the ApoE-positive groups after AβO stimulation (one-way ANOVA, IL-1β: F = 10.571, p < 0.01; TNF-α: F = 7.547, p < 0.01; Fig. 4D-E).
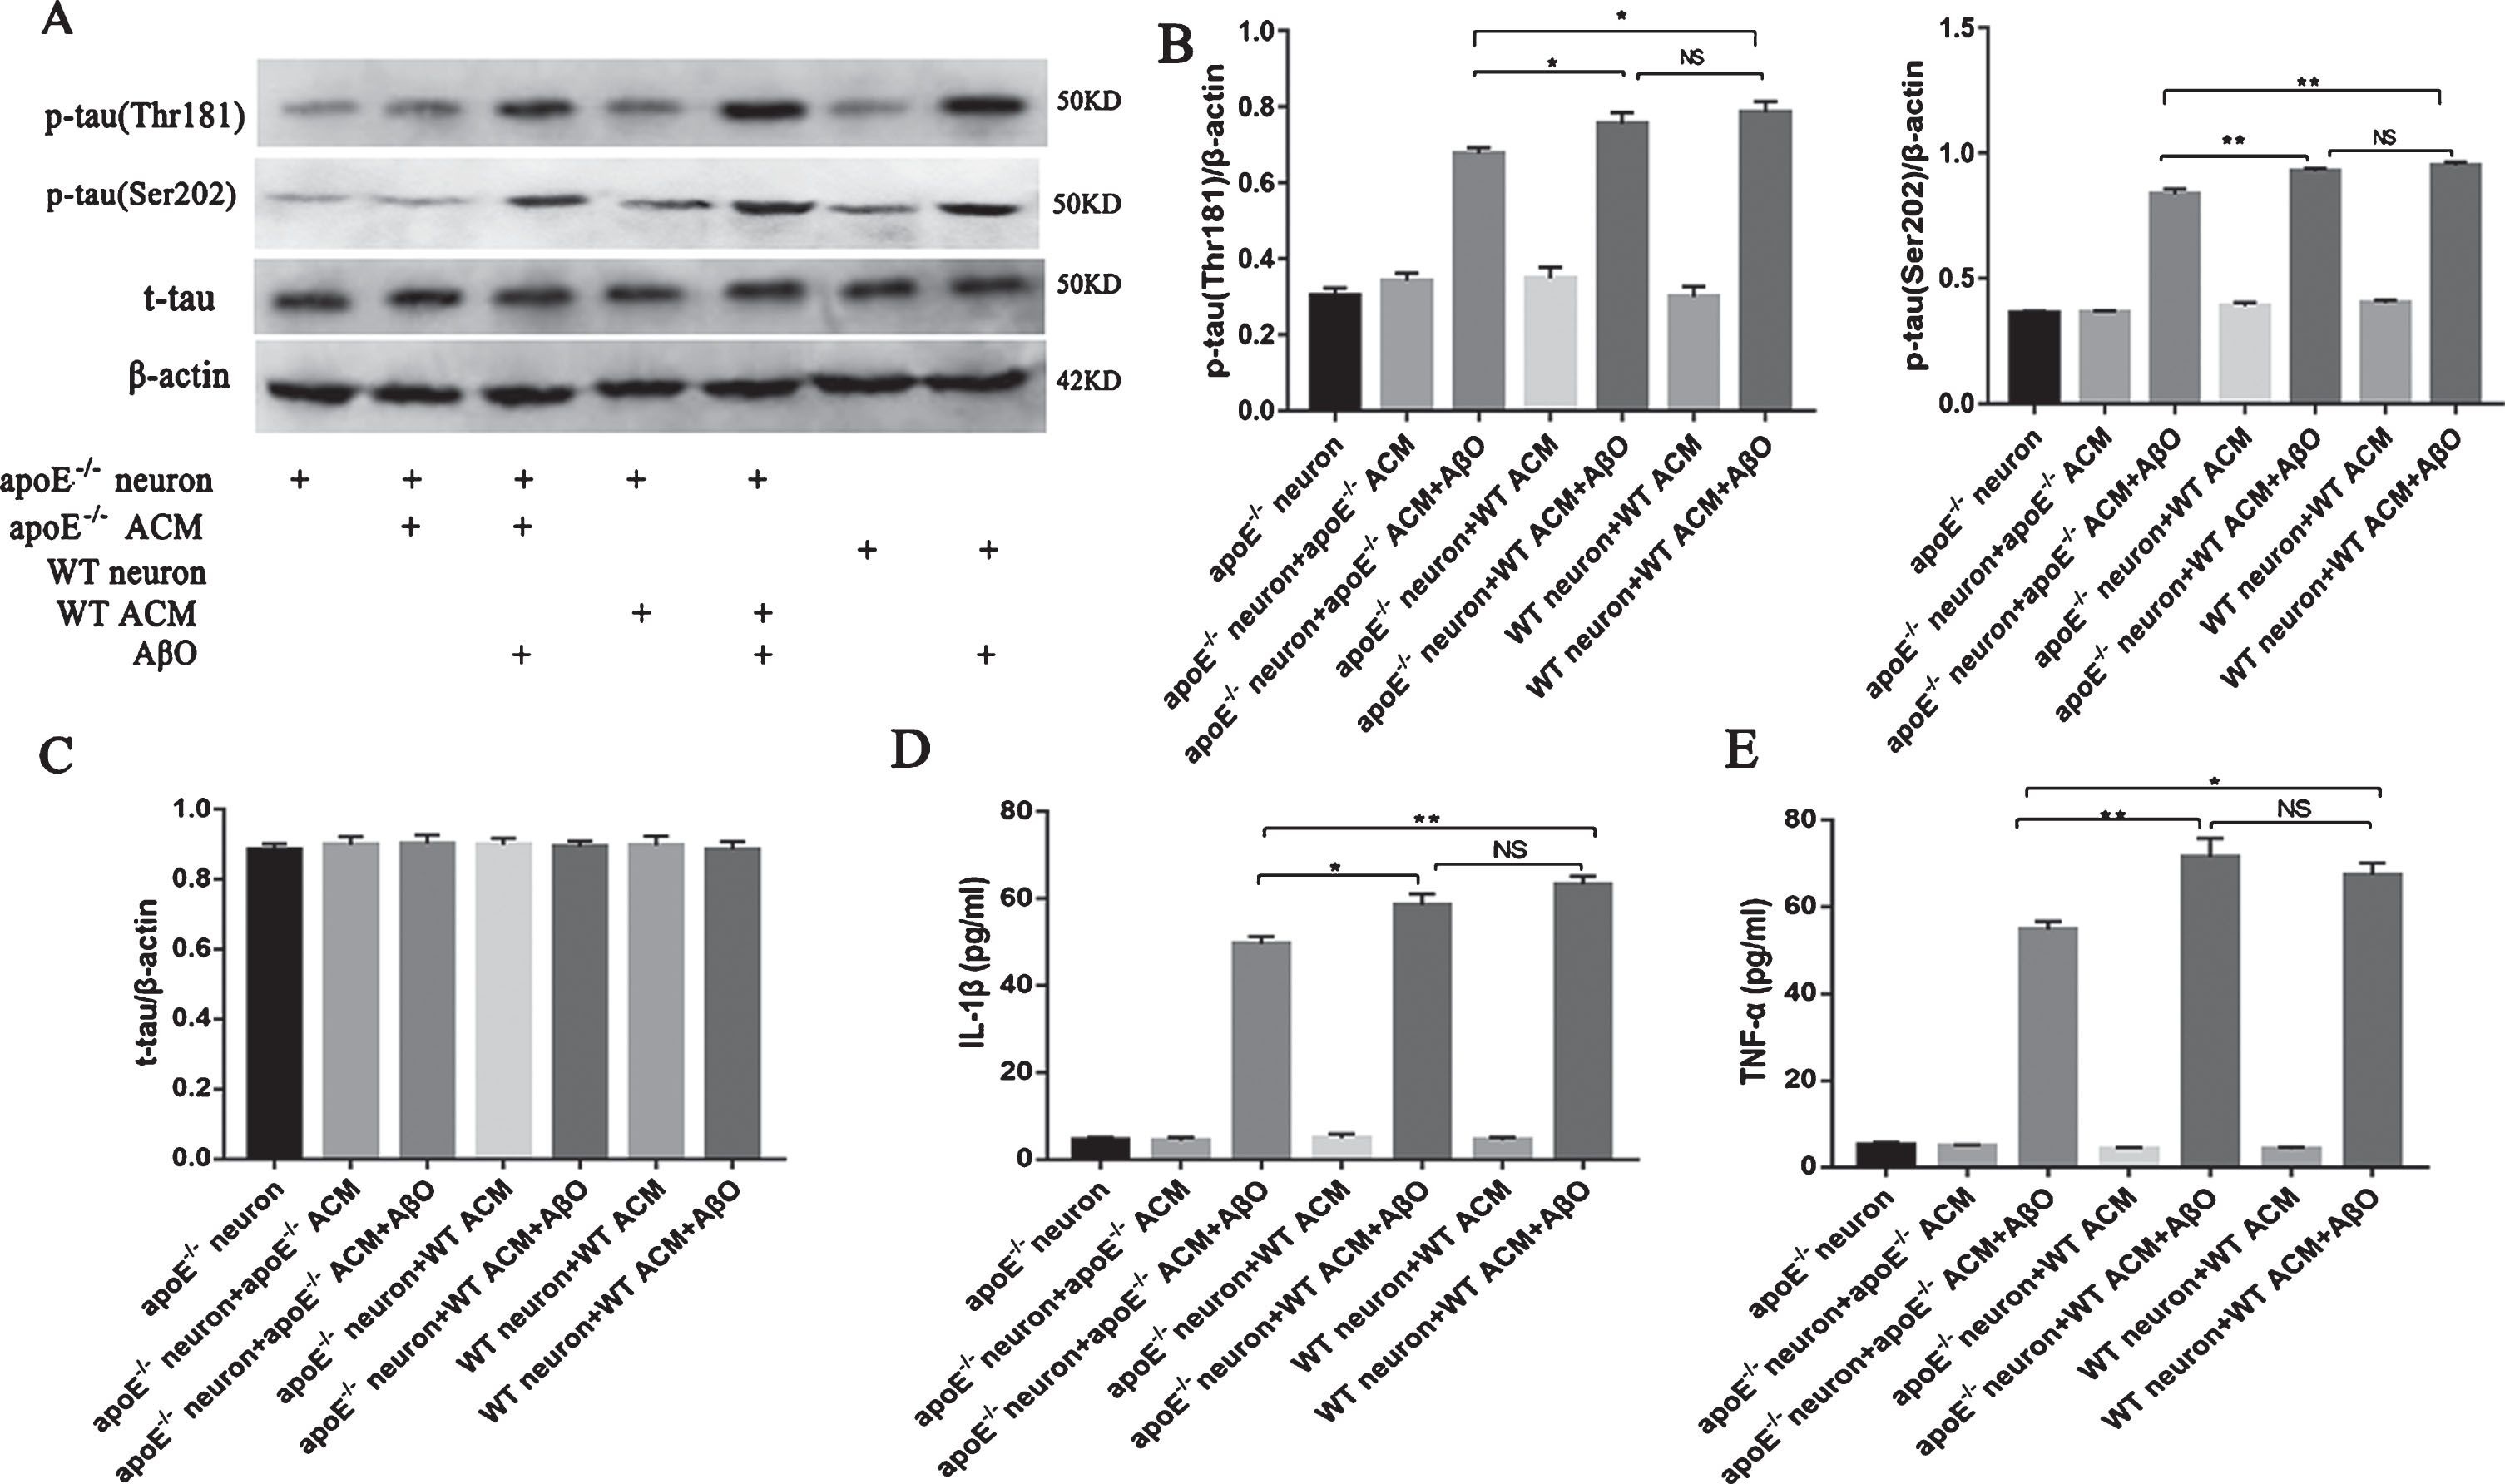
ApoE facilitated the phosphorylation of tau induced by AβO in vitro (A–F). Neurons were cultured with different treatments for 48 h, and western blot analyses of p-tau (Thr181), p-tau (Ser202), and t-tau in all groups of cultured neurons were performed (A). The band intensities were quantified and normalized to the band intensity of β-actin (B, C, D). IL-1β (D) and TNF-α (E) in neuronal cell culture supernatant were assessed using ELISA. Each value represents the mean±SEM of three independent experiments; *p < 0.05, **p < 0.01. NS, no significant difference.
ApoE genotypes differentially regulate AβO-induced tau phosphorylation in vitro
APOEɛ4 was recognized as a gene associated with a marked risk for late-onset AD. Therefore, we tested whether the different ApoE genotypes influenced tau phosphorylation in our experiments. We treated cultured apoE-/- neurons with recombinant human ApoE ɛ2, ApoE ɛ3, and ApoE ɛ4 under AβO stimulation. We compared the p-tau contents among the three different isoform-treated groups and found that the ApoE ɛ4-treated group showed the greatest increase in p-tau (one-way ANOVA, Thr181: F = 35.980, p < 0.01; Ser202: F = 48.598, p < 0.01; Fig. 5A–C), while there were no significant differences between the ApoE ɛ2- and ApoE ɛ3-treated groups (post hoc test, Thr181: p > 0.05; Ser202: p > 0.05; Fig. 5A–C). The expression levels of phosphokinase among the different ApoE isoform-treated groups were also different. The ratio of p-Ser9-GSK3β/GSK3β decreased the most in the ApoE ɛ4-treated group (one-way ANOVA, F = 91.980, p < 0.01; Fig. 5E, F) compared with in the other two isoform-treated groups. The content of CDK5 also increased the most in the ApoE ɛ4-treated group compared with in the other two isoform-treated groups (one-way ANOVA, F = 61.475, p < 0.01; Fig. 5E, G). The contents of these phosphokinases did not differ between the ApoE ɛ2 and ApoE ɛ3 groups (post hoc test, p-Ser9-GSK3β/GSK3β ratio: p > 0.05; CDK5: p > 0.05; Fig. 5E–G). Moreover, the contents of IL-1β and TNF-α in the supernatant of ApoE ɛ4-treated cells were the highest among the three isoform-treated groups (one-way ANOVA, IL-1β: F = 7.304, p < 0.01; TNF-α: F = 6.74, p < 0.01; Fig. 5H-I).
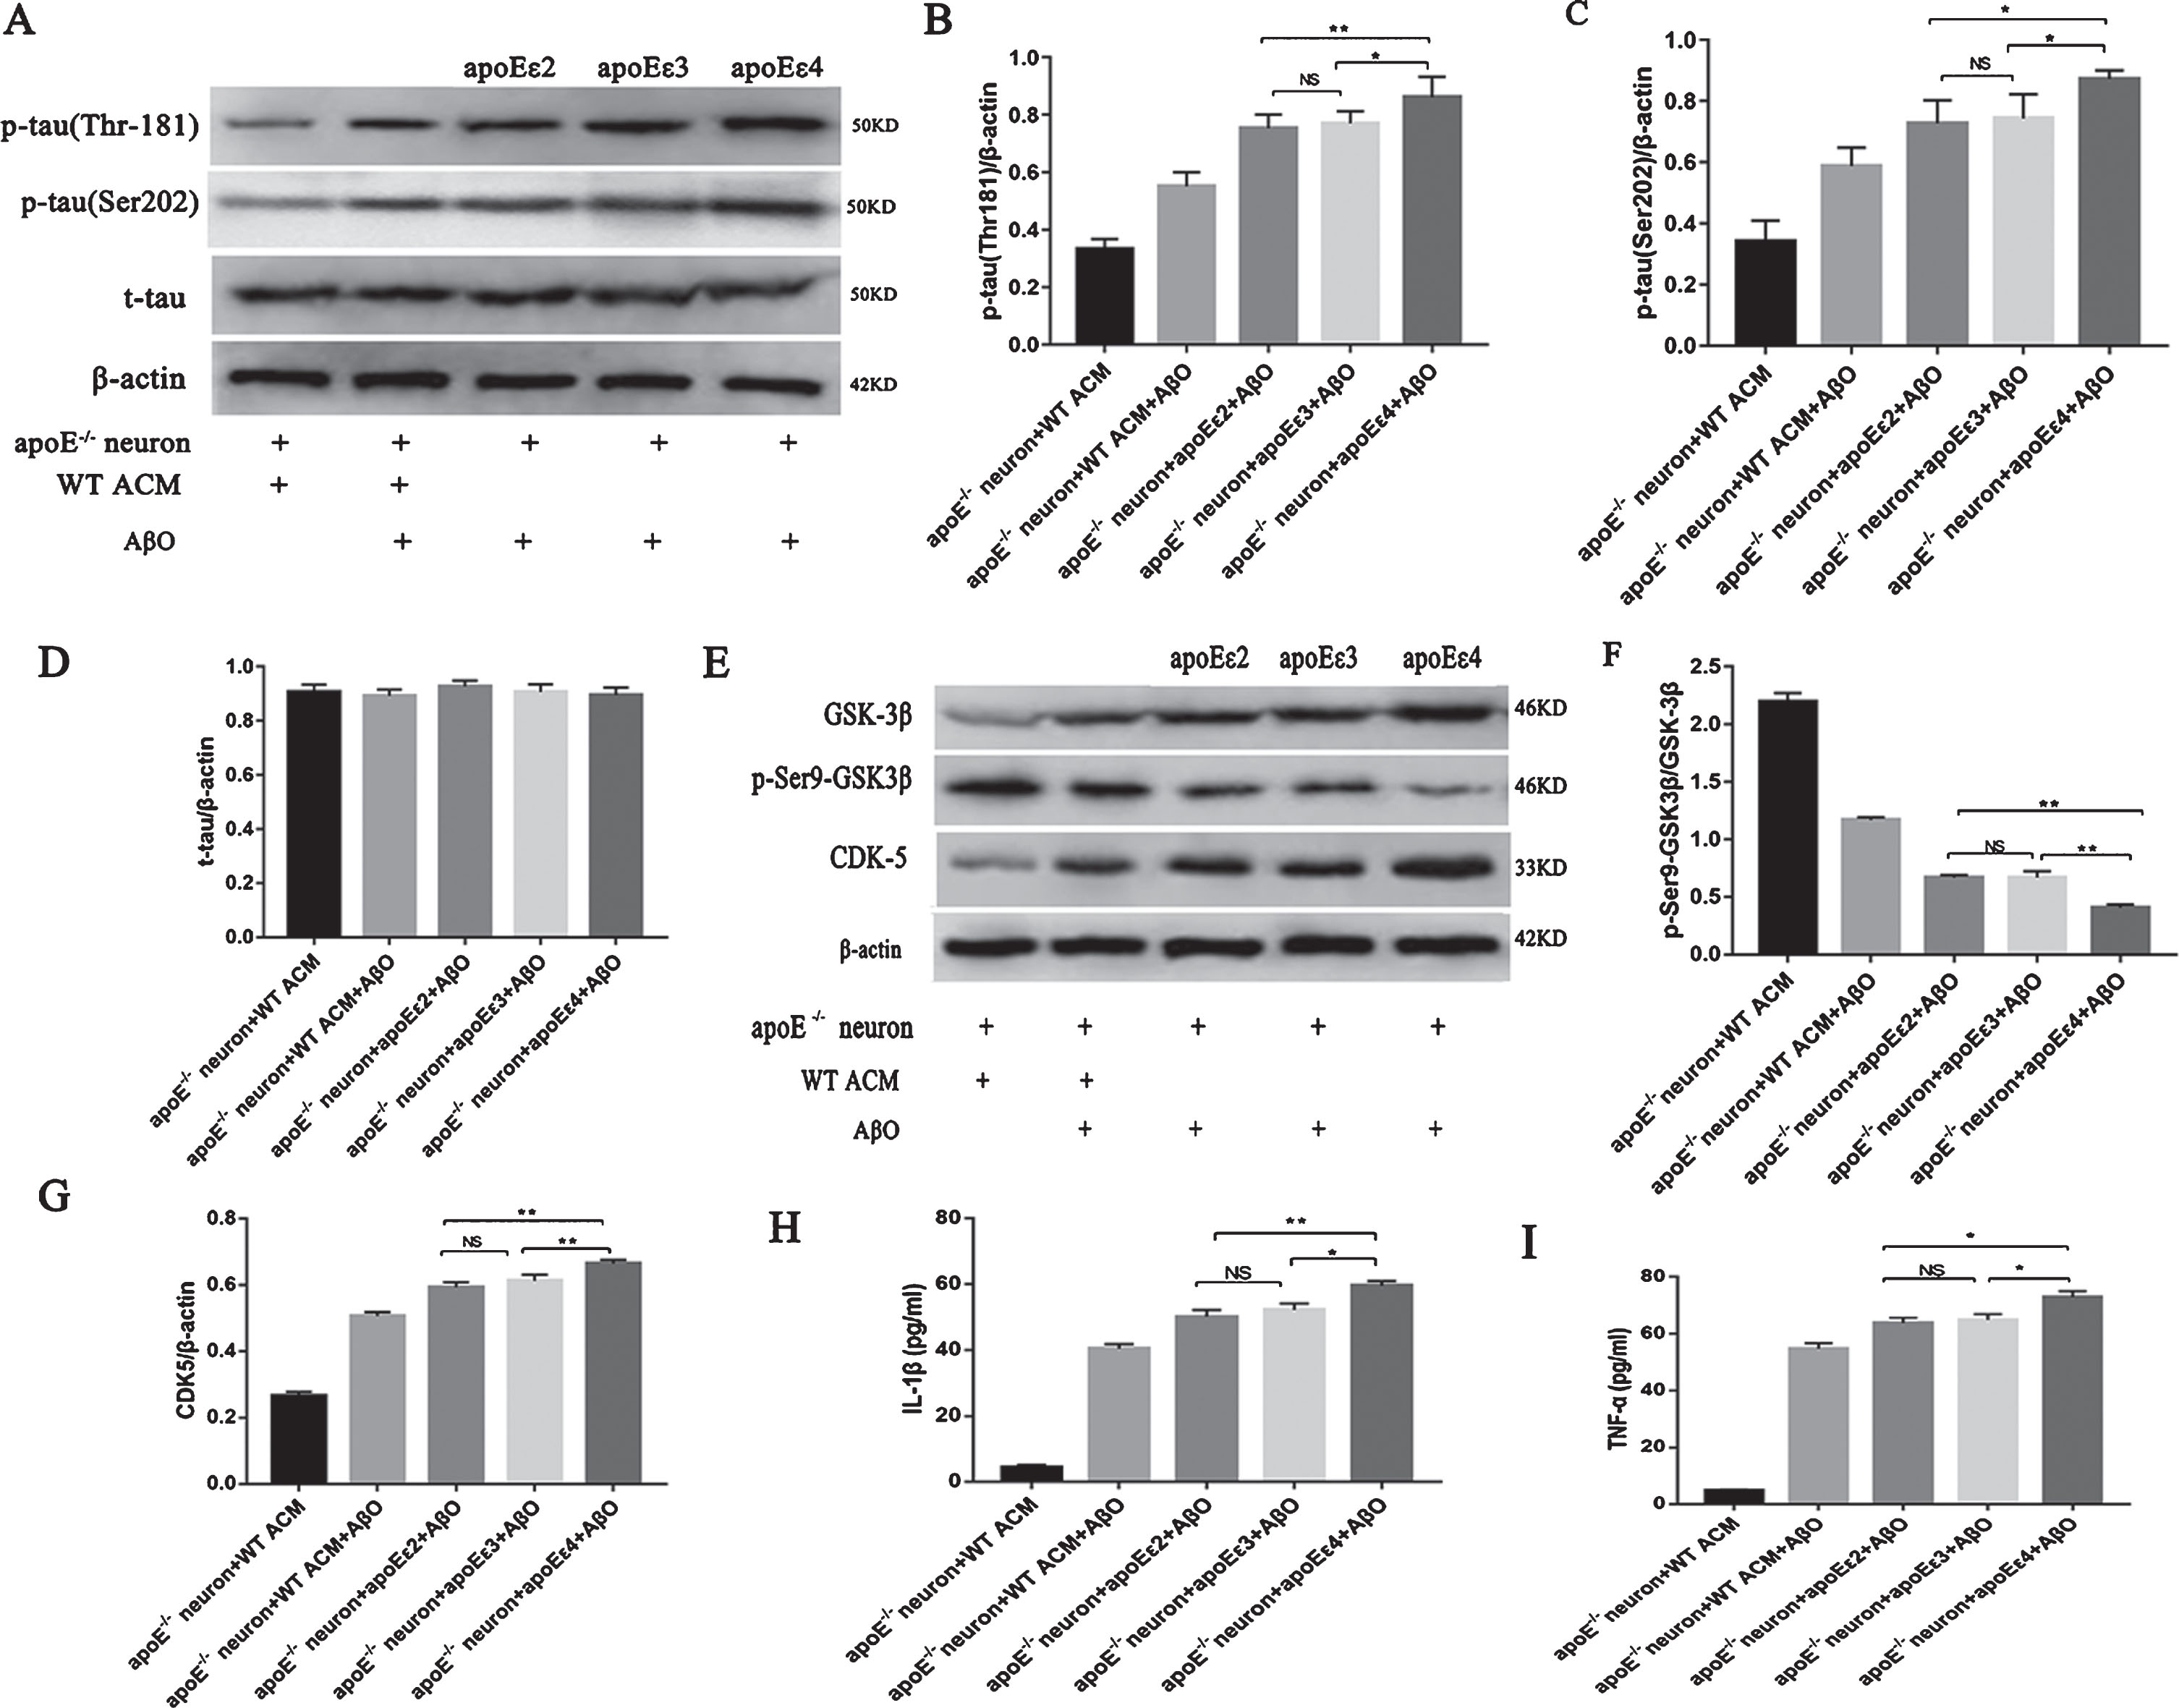
ApoE genotypes differentially regulated the process of AβO-induced tau phosphorylation (A–I). Western blotting for p-tau (Thr181), p-tau (Ser202), and t-tau in cultured neurons treated with different ApoE isoforms (A). The band intensities were quantified and normalized to the band intensity of β-actin (B–D). Western blot analyses of GSK3β, p-Ser9-GSK3β, and CDK5 in neurons cultured with different ApoE isoforms (E). The band intensities were quantitated and normalized to the band intensity of β-actin (F, G). IL-1β (H) and TNF-α (I) in neuronal cell culture supernatant were assessed using ELISA. Each value represents the mean±SEM of three independent experiments; *p < 0.05, **p < 0.01 versus the ApoE ɛ4 group. NS, no significant difference.
Anti-inflammatory treatment reduced ApoE-mediated tau phosphorylation in cultured neurons
We noticed that the presence of the ApoE protein was accompanied by increased levels of neuroinflammation after AβO stimulation. We then treated WT ACM-treated apoE-/- neurons with SFN before AβO stimulation to test the change in p-tau after the inhibition of inflammation. As shown in Fig. 6A–C, the p-tau content in the apoE-/- neuron + WT ACM + AβO group was significantly higher than that in the apoE-/- neuron + apoE-/- ACM + AβO group (t-test, Thr181: t = –4.358, p < 0.01; Ser202: t = –4.342 p < 0.01; Fig. 6A–C). When pretreated with SFN, the p-tau content in the apoE-/- neuron + WT ACM + AβO + SFN group decreased significantly (t-test, Thr181: t = 2.332, p < 0.05; Ser202: t = 3.342 p < 0.01; Fig. 6A–C). Additionally, the SFN pretreatment group showed decreased IL-1β and TNF-α contents in the culture medium compared with the apoE-/- neuron + WT ACM + AβO group (t-test, IL-1β: t = 2.734, p < 0.05; TNF-α: F = 2.378, p < 0.05; Fig. 6E-F).

Anti-inflammatory treatment reduced the p-tau content mediated by ApoE in vitro. ApoE-/- neurons cultured with WT ACM were treated with 0.1 μm SFN 30 min before AβO stimulation. Western blot analyses of p-tau (Thr181), p-tau (Ser202), and t-tau in cultured neurons (A). The band intensities were quantified and normalized to the band intensity of β-actin (B–D). IL-1β (E) and TNF-α (F) in neuronal cell culture supernatant were assessed using ELISA. *p < 0.05, **p < 0.01. NS, no significant difference.
DISCUSSION
ApoE has been known to be associated with AD for decades. The results showing that ApoE is involved in tauopathy indicated that ApoE may also participate in the phosphorylation of tau in AD in a manner that is dependent or independent of Aβ. In our present study, we injected AβO into WT mice and apoE-/- mice for 40 days to investigate the AD-like process. We found that compared with WT mice, apoE-/- mice showed decreased levels of p-tau, and the contents of phosphokinase and inflammatory factors were also decreased. The same results were also found in cultured apoE-/- neurons treated with ApoE-positive ACM or ApoE-negative ACM. We also found that the content of p-tau was significantly increased by ApoE ɛ4 treatment compared with ApoE ɛ2 or ApoE ɛ3 treatment after stimulation by AβO in vitro. Anti-inflammatory treatment significantly decreased the content of p-tau in ApoE-positive cultured neurons, suggesting that neuroinflammation may mediate ApoE and tau phosphorylation in AD.
Aβ aggregation was observed to induce tau hyperphosphorylation in vivo and in vitro [15, 16]. Based on this evidence, the lateral ventricle injection of Aβ aggregates in mice has long been used to model AD pathological processes [17]. Here, we used a modified protocol to prepare AβO, and this protocol can produce more medium molecular weight oligomers, such as nonamers (40 kDa) and dodecamers (56 kDa) [14], which were confirmed to be the AD-inducing toxins [18]. Three lateral ventricle injections of nonamers and dodecamers in rats for 40 days were also used to produce AD models in one of our previous studies [8]. The result that p-tau significantly increased with time after AβO injection in our present study was consistent with the results of previous studies. We also observed that ApoE expression increased with time in vivo, and this effect may be the result of glia cells activation and proliferation [8], as ApoE is mainly produced by astrocytes and microglia in the central nervous system (CNS) [19].
ApoE is the most abundant cholesterol transporter in the CNS. Moreover, ApoE can also combine with Aβ and transport Aβ to glial cells or across the blood-brain barrier for further clearance [20]. Therefore, we propose that ApoE is a beneficial transporter that promotes Aβ clearance in healthy people. However, ApoE is also associated with Aβ toxicity in AD [21]. How ApoE became harmful over time remains unclear. However, its receptors, such as low-density lipoprotein receptor-related protein 1 (LRP1), in the hippocampi of mild cognitive impairment subjects were significantly decreased or lost function compared with the receptors in the hippocampi of control subjects [22, 23]. We hypothesize that perhaps the increased expression of ApoE was the glial response to try to transport more Aβ, but the decreased ApoE receptors led to the accumulation of Aβ-bound ApoE, and this combination facilitated the aggregation of Aβ [8]. Therefore, in our present study, the ApoE-induced increase in p-tau in vivo and in vitro may be partly because the presence of ApoE exacerbates the toxicity of Aβ. One study found that the association of APOE ɛ4 with PHF-tau tangles was stronger in Aβ-positive participants than in Aβ-negative participants [24]. This result supports our conjecture.
Furthermore, ApoE was also found to have the opposite effect on tauopathy under normal conditions and under pathological conditions. Hoe et al. found that ApoE could decrease the tau kinase and p-tau levels in primary neurons due to interactions with LDLR under normal conditions [25]. In contrast, both ApoE ɛ2 and ApoE ɛ4 have been confirmed to facilitate tauopathy under pathological conditions [26, 27], and these effects are consistent with our research. As mentioned above, the exact reason for this opposite effect is unknown; perhaps the reduction or dysfunction of LDLR also disturbed the normal function of ApoE in the tau phosphorylation process. ApoE was also found to combine with tau in vitro [28], but whether this combination can facilitate the aggregation and spread of tau still needs further research.
The phosphorylation of tau depends on the expression and activity of phosphokinases. GSK-3β and CDK5 are the most familiar phosphokinase involved in AD, and AβO can activate GSK-3β and CDK5 to catalyze the phosphorylation of tau [29, 30]. In addition to AβO, inflammation was also demonstrated to aggravate the activation and expression of phosphokinases independently of Aβ [31]. In our study, we also observed that the expression of GSK-3β and CDK5 increased significantly and that neuroinflammation increased after stimulation with AβO in vivo and in vitro. We hypothesized that AβO stimulation and the subsequent neuroinflammation increased the expression of GSK-3β and CDK5 and finally led to the hyperphosphorylation of tau.
In our study, the absence of ApoE resulted in decreased p-tau and phosphokinase accompanied by decreased inflammation after AβO stimulation. We hypothesize that the absence of ApoE decreased inflammation to decrease tauopathy in our AD models. The involvement of ApoE in inflammation has been well defined. In AD, neuroinflammation is primarily mediated by CNS-resident microglia. The deletion of ApoE in AD animal models resulted in fewer activated microglia [32]. C1q-ApoE complex was demonstrated as a common player that impacts brain inflammation [33]; ApoE can also interact with TREM2 to regulate the phenotypic switch of neurodegenerative microglia [34]. Furthermore, recent research found that ApoE can strongly stimulate the phosphorylation of Akt and Src in neurons in addition to ERK [35], and these signaling pathways are involved in inflammation. Therefore, we hypothesized that ApoE also facilitated the inflammatory reaction of neurons to AβO in our experiments, leading to more neuronal death in vitro. SFN is an isothiocyanate compound that can inhibit inflammation by STAT-1 dephosphorylation or JNK/AP-1/NF-κB pathway inhibition in addition to activating the Nrf2 pathway [36]. In our study, we used SFN to decrease the content of p-tau in ApoE-positive neurons, indirectly corroborating the view that ApoE may be involved in tauopathy via inflammation.
Although ApoE is widely involved in various pathological processes in AD, different isoforms show quite different characteristics. Human ApoE ɛ2, ApoE ɛ3, and ApoE ɛ4 differ from each another at one or two amino acid residue at position 112 and 118, these differences result in defective lipid transport by ApoE ɛ4. The expression of ApoE ɛ4 was also lower than that of the other two types [37]. Moreover, ApoE ɛ4 was found to be defective in the clearance of Aβ [38], and it could promote Aβ aggregation into toxic oligomers. ApoE ɛ4 was also found to mediate most inflammatory reactions in a manner that was dependent or independent of Aβ [39]. In our study, we treated apoE-/- neurons with the three different ApoE isoforms, and ApoE ɛ4 treatment resulted in the most serious inflammation, which was consistent with the results of other studies. We hypothesize that the more serious inflammation led to increased phosphokinase expression and eventually led to the most significant increase in p-tau.
CONCLUSION
In summary, our results reveal that the existence of ApoE in AD models can facilitate the phosphorylation of tau, and this process may be mediated by inflammation. However, it remains unclear how the ApoE protein becomes harmful and promotes the progression of AD with important physiological roles. The answer to this question may supply another method for AD therapy in addition to describing the effect of ApoE.
Footnotes
ACKNOWLEDGMENTS
This work was funded in part by grants from the National Key R&D Program of China (grant no.: 2017YFC1310100), the National Natural Science Foundation of China (grant nos.: 81772448 and 81861138008), and the Key R&D Program of Shandong Province (grant no.: 2016ZDJS07A11).