
Abstract
Background:
Clinicopathological studies have demonstrated that the neuropsychological profiles and outcomes are different between two dementia subtypes, namely Alzheimer’s disease (AD) and Lewy bodies-related disease.
Objective:
We investigated the neural correlates of cognitive dysfunction in patients with AD-related cognitive impairment (ADCI) and those with Lewy bodies-related cognitive impairment (LBCI).
Methods:
We enrolled 216 ADCI patients, 183 LBCI patients, and 30 controls. Cortical thickness and diffusion tensor imaging analyses were performed to correlate gray matter and white matter (WM) abnormalities to cognitive composite scores for memory, visuospatial, and attention/executive domains in the ADCI spectrum (ADCI patients and controls) and the LBCI spectrum (LBCI patients and controls) separately.
Results:
Memory dysfunction correlated with cortical thinning and increased mean diffusivity in the AD-prone regions, particularly the medial temporal region, in ADCI. Meanwhile, it only correlated with increased mean diffusivity in the WM adjacent to the anteromedial temporal, insula, and basal frontal cortices in LBCI. Visuospatial dysfunction correlated with cortical thinning in posterior brain regions in ADCI, while it correlated with decreased fractional anisotropy in the corpus callosum and widespread WM regions in LBCI. Attention/executive dysfunction correlated with cortical thinning and WM abnormalities in widespread brain regions in both disease spectra; however, ADCI had more prominent correlation with cortical thickness and LBCI did with fractional anisotropy values.
Conclusions:
Our study demonstrated that ADCI and LBCI have different neural correlates with respect to cognitive dysfunction. Cortical thinning had greater effects on cognitive dysfunction in the ADCI, while WM disruption did in the LBCI.
INTRODUCTION
Alzheimer’s disease (AD) and Lewy bodies (LB)-related disease are the two most common neurodegenerative disorders leading to cognitive decline [1]. Clinicopathological studies have demonstrated that the neuropsychological profiles and outcomes are different between the two dementia subtypes [2, 3]. In addition, several neuroimaging studies have reported the differences in the topography of cortical thinning and white matter (WM) abnormalities between patients with AD and LB-related pathologies [4], suggesting that WM degeneration may occur secondary to gray matter (GM) pathology in AD, but may precede GM atrophy in LB-related disease (LBD) [5]. These findings imply the fundamental differences in the pathomechanisms between patients with AD-related cognitive impairment (ADCI) and those with LB-related cognitive impairment (LBCI).
Although several previous studies have explored the neural correlates of cognitive dysfunction in ADCI [6–9] and LBCI [10, 11], the effects of cortical thinning and WM abnormalities on cognition have not been comparatively evaluated in both disease groups simultaneously. Although AD and LB-related pathologies frequently co-occur in cognitively impaired patients [1], clinical diagnosis of mixed underlying pathologies is challenging because of the clinical overlap between the two diseases and the low sensitivity of clinical LBD diagnosis. In this study, we investigated the correlations of cognitive composite scores for memory, visuospatial, and attention/executive domains with structural brain changes, including regional cortical thickness and WM abnormalities on diffusion tensor images (DTI), in ADCI and LBCI simultaneously. We hypothesized that the two disease groups have different neural correlates for cognitive dysfunction. Specifically, cortical thinning would correlate more closely with cognitive composite scores than WM disruption in ADCI, while the opposite would be the case in LBCI. Comparatively elucidating structural brain changes associated with specific domains of cognitive deficit in ADCI and LBCI groups could give useful information allowing the accurate diagnoses of both diseases, especially for LBCI, the clinical diagnosis of which has low sensitivity.
METHODS
Subjects
We consecutively recruited 539 subjects who visited the memory clinic and movement disorders clinic at Severance Hospital, Yonsei University Health System from January 2014 to July 2017 (Fig. 1). All patients underwent a neurologic examination, a detailed neuropsychological test (i.e., the Seoul Neuropsychological Screening Battery [SNSB] [12]), and brain magnetic resonance imaging (MRI) at baseline. Additional imaging modalities (18F-Fluorodeoxyglucose [18F-FDG] positron emission tomography [PET], 18F-Florbetaben [18F-FBB] PET, and 18F-fluorinated N-3-fluoropropyl-2-beta-carboxymethoxy-3-beta-(4-iodophenyl) nortropane [18F-FP-CIT] PET) were performed if needed to ensure clinical diagnostic accuracy. These subjects comprised 216 with ADCI (63 with probable AD dementia, 76 with amnestic mild cognitive impairment [MCI], and 77 with subjective cognitive decline [SCD]), 183 with LBCI (48 with dementia, 73 with MCI, and 62 with SCD), 36 with mixed ADCI and LBCI pathologies (i.e., patients with an imaging-supported diagnosis of both ADCI and LBCI; 26 with dementia, 9 with MCI, and 1 with SCD), 57 with vascular cognitive impairment (VCI; 18 with dementia, 29 with MCI, and 10 with SCD), 17 with other or undetermined etiologies (8 with dementia, 9 with MCI, and 1 with SCD), and 30 healthy controls.
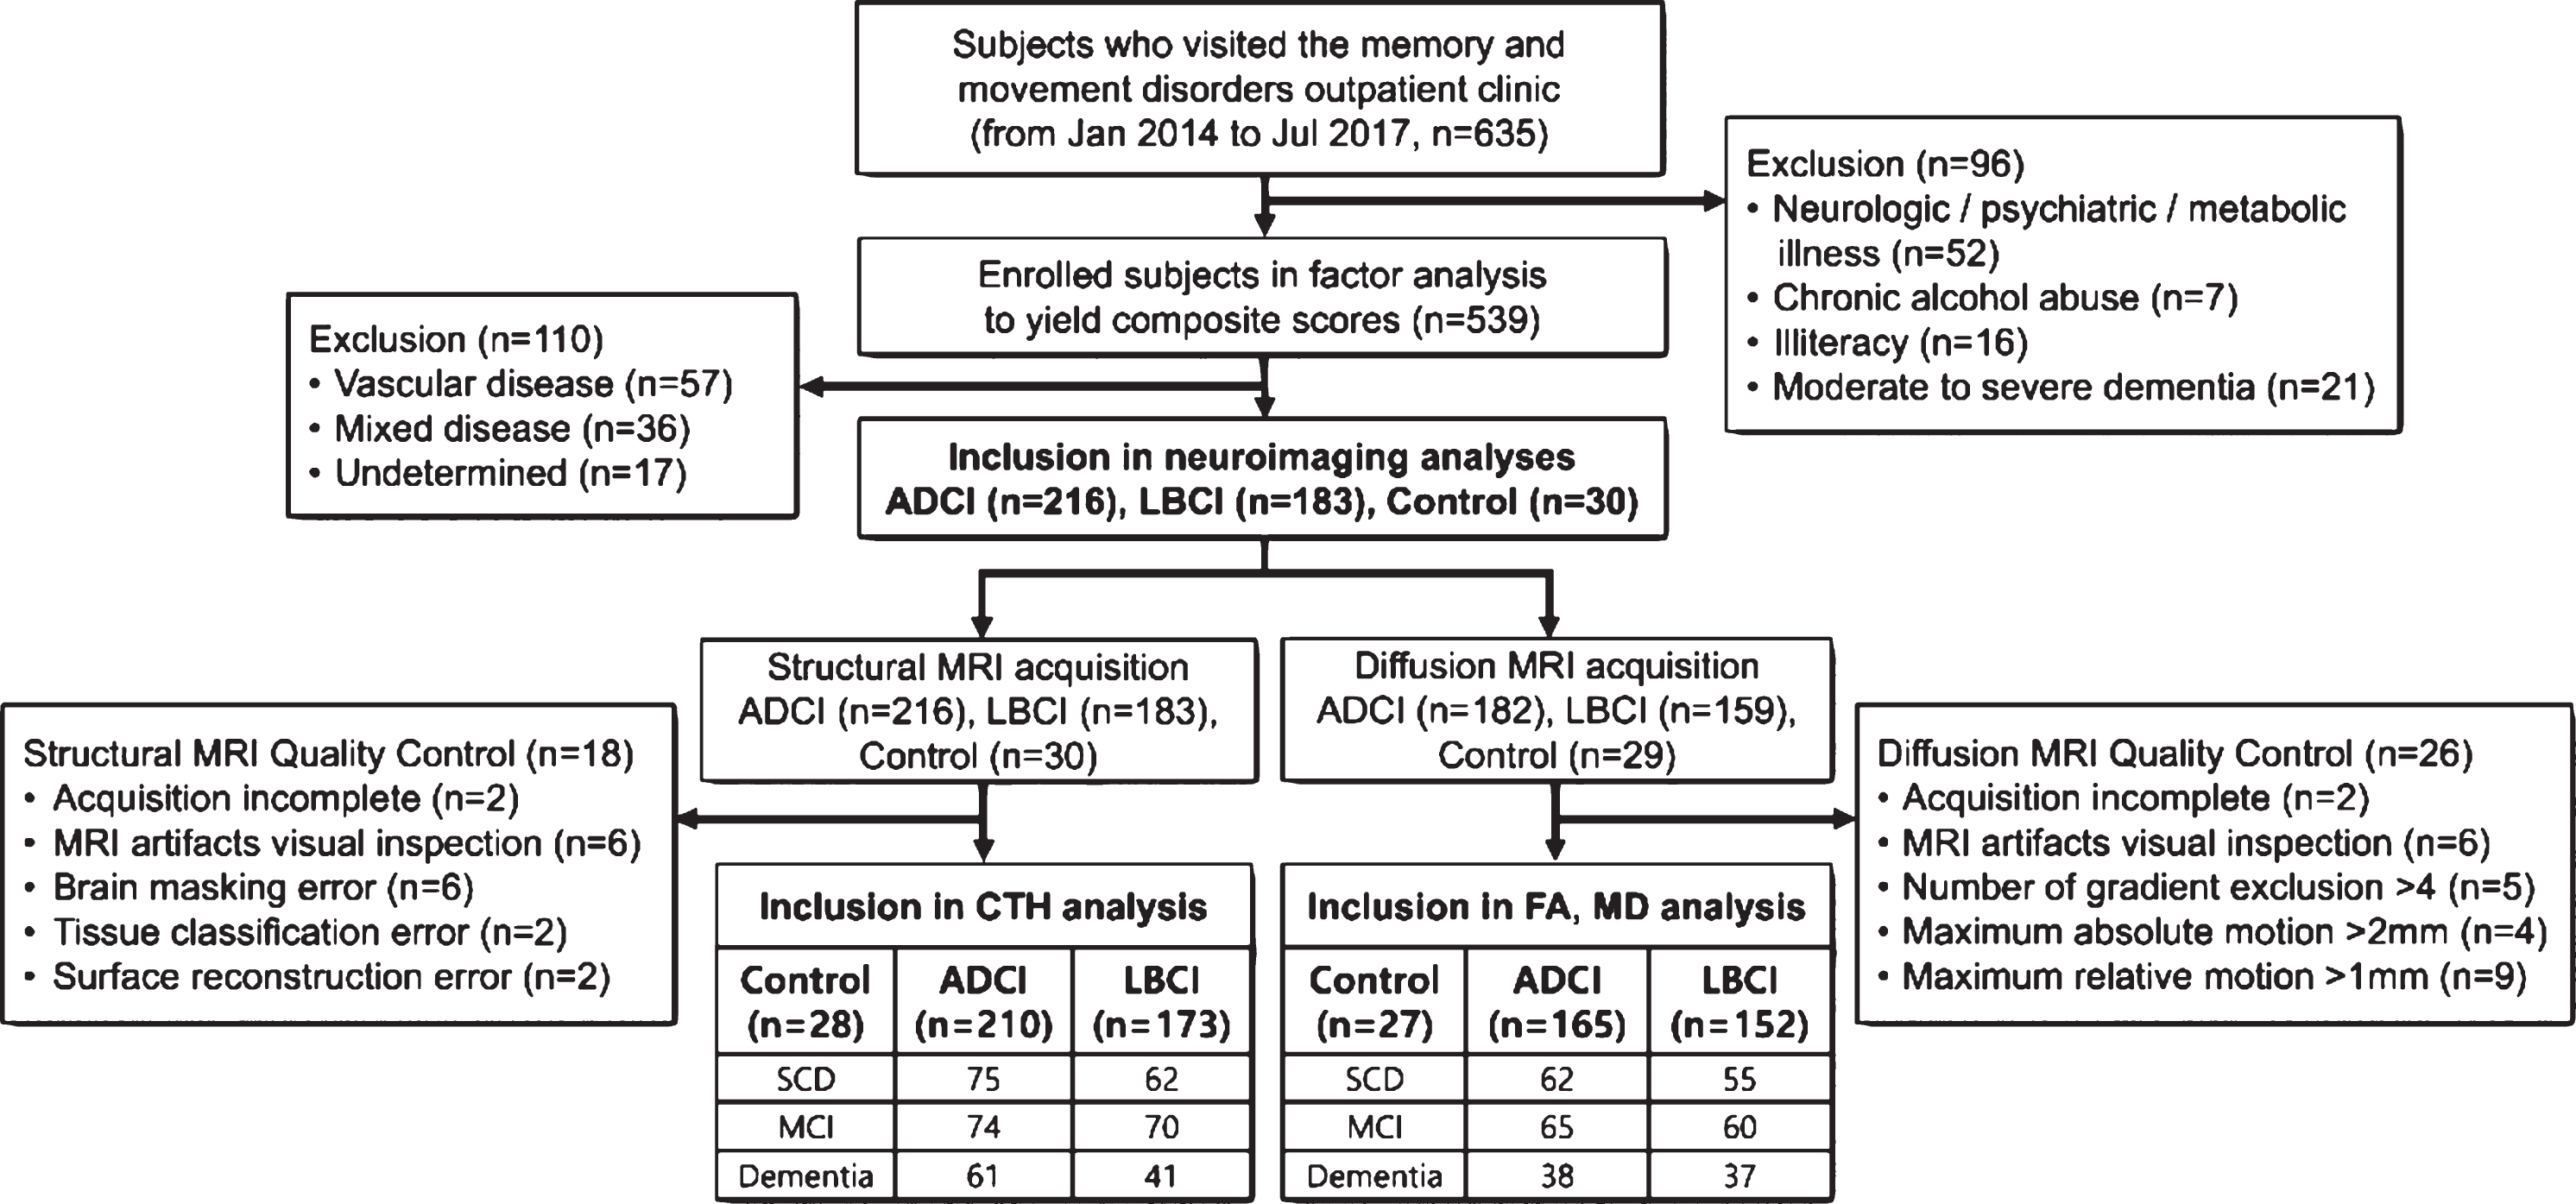
Flow diagram of participants and enrollment.
ADCI and LBCI were diagnosed as described in our previous work (see Supplementary Methods and Supplementary Figure 1) [13, 14]. In detail, the distinction between ADCI and LBCI was based on thorough neurological examination for parkinsonism and interview for clinical symptoms suggesting LBD, including cognitive fluctuation, visual hallucination, and prominent rapid eye movement sleep behavior disorder. ADCI included SCD-AD, MCI-AD, and AD dementia. If subjects complained of subject memory problems but had a normal neuropsychological profile and no clinical symptom of LBD, they were classified into the SCD-AD group. All AD dementia patients met the clinical criteria for probable AD dementia [15], and all MCI-AD patients met the clinical criteria for MCI due to AD [16] from the National Institute on Ageing-Alzheimer’s Association workgroups guidelines for AD. Fifty (66%) of 76 MCI-AD patients and 28 (44%) of 63 AD dementia patients were identified to have significant cerebral amyloid-β deposition on 18F-FBB PET scans.
LBCI included Parkinson’s disease (PD) and dementia with Lewy bodies (DLB), and clinical diagnosis of PD (n = 154) and DLB (n = 29) were based on the United Kingdom PD Brain Bank diagnostic criteria [17] and 2017 revised criteria for DLB [18], respectively. If subjects exhibited significant parkinsonism on neurological examination and complained of subjective cognitive problems but had a normal neuropsychological test results, they were classified into the SCD-LB group. Patients were diagnosed with PD with MCI if they fulfilled the level II PD-MCI criteria according to Movement Disorder Society Task Force guidelines [19]. PD with dementia (PDD) was diagnosed according to the clinical criteria of probable PDD [20] with evidence of abnormalities in the activities of daily living (ADL), judged both clinically and on an instrumental ADL scale [21, 22]. Patients with MCI stage of DLB were defined as those with MCI meeting probable DLB criteria except for the presence of dementia [23]. All patients with LBCI performed 18F-FP-CIT PET scan and showed abnormal dopamine transporter availability in the posterior putamen.
Based on clinical features and neurological examination, patients who were suspected to have mixed AD and LBD pathologies performed both 18F-FBB PET and 18F-FP-CIT PET scans, and 36 patients were confirmed to have the mixed disease. VCI was diagnosed according to the criteria proposed by the American Heart Association/American Stroke Association (AHA/ASA) scientific statement [24]. The study was conducted in accordance with the declaration of Helsinki, and was approved by the Yonsei University Severance Hospital institutional review board. The need for informed consent was waived because of the retrospective nature of the study.
Neuropsychological assessment
All subjects underwent a detailed neuropsychological test, i.e., the SNSB [25]. Among scorable tests of the SNSB, age- and education-specific z-scores for following 14 items were investigated including the backward digit span, the Korean version of the Boston Naming Test (K-BNT), Rey Complex Figure Test (RCFT) copy, copying time item of RCFT, the immediate recall, delayed recall and recognition items of Seoul Verbal Learning Test (SVLT) and RCFT, Controlled Oral Word Association Test (COWAT) animal, COWAT supermarket, COWAT phonemic, and Stroop color reading tests.
Measurement of white matter hyperintensities
A visual rating scale of white matter hyperintensities (WMH) on brain MRI was based on the modified Fazekas criteria [26]: Periventricular WMH were classified as P1 (cap and band < 5 mm), P2 (5 mm≤cap or band < 10 mm), and P3 (10 mm≤cap or band), and deep WMH were classified as D1 (maximum diameter of deep WM lesion < 10 mm), D2 (10 mm≤lesion<25 mm), and D3 (≥25 mm). Then, we classified the subjects into three groups according to the severity of WMH: the minimal ischemia group (D1P1 and D1P2), the moderate ischemia group (D1P3, D2P1, D2P2, and D2P3), and the severe ischemia group (D3P1, D3P2, and D3P3) [27].
MRI processing for cortical thickness and DTI analyses
We performed cortical thickness and DTI analyses as described in our previous study [13]. The T1-weighted MRI was processed using the CIVET pipeline (http://mcin.ca/civet) to measure cortical thickness. We also processed DTI using the FMRIB Software Library (FSL, http://www.fmrib.ox.ac.uk/fsl), and created the fractional anisotropy (FA) and mean diffusivity (MD) maps. Detailed methods of image quality control, cortical thickness measurement, and DTI processing are described in the Supplementary Methods.
Statistical analysis
Baseline demographic and clinical data were evaluated using independent t-tests, analyses of covariance, and chi-square tests, as appropriate. To reduce the redundancy of tests and the possibility of overrepresenting a single domain of cognitive function [28], factor analyses were conducted based on the 14 scorable subtests of the SNSB using the principal components method of factor extraction and a varimax rotation. After excluding subjects with current or past neurologic/psychiatric/metabolic illness (n = 52), chronic alcohol abuse (n = 7), illiteracy (n = 16), and moderate to severe dementia (Clinical Dementia Rating [CDR]≥2; n = 21), 539 subjects were selected for the factor analysis. The factor analysis suggested that three factors accounted for 66.7% of the variance among the subjects’ cognitive performance. The component score coefficients were then used to calculate the composite scores of three cognitive function factors of each subject. The statistical analyses were performed with SPSS software (version 23.0; IBM Corp., Armonk, NY, USA), and results with a two-tailed p < 0.05 were considered statistically significant.
To investigate the correlation of cognitive composite scores with the structural brain changes of regional cortical thickness and WM abnormalities in the ADCI spectrum and LBCI spectrum separately, cortical thickness and DTI analyses were performed using the SurfStat toolbox for Matlab [29]. For these analyses, we included the cases with SCD in both disease spectra and control subjects to find a better correlation between neuroimaging measures and cognitive performance, and to find neural correlates of cognitive dysfunction encompassing from normal aging to dementia. As the main purpose of this study was to comparatively evaluate the neural correlates of cognitive dysfunction in ADCI and LBCI, but it was not to reveal the independent and interaction effects of AD and LBD on brain structural changes, cases with mixed pathologies and VCI were excluded in the neuroimaging analyses. We used general linear models for regional cortical thickness, FA, and MD, using the cognitive composite scores as predictors after controlling for age, sex, years of education, the presence of diabetes mellitus, and periventricular WMH. Among vascular risk factors, diabetes mellitus and periventricular WMH were selected because they were associated with cognitive composite scores, while other factors were not (Supplementary Methods). To test whether the effects of regional cortical thickness and WM abnormalities on cognitive composite scores were significantly different between ADCI and LBCI, additional general linear models were performed adding interaction terms for the diagnosis with cognitive composite scores as predictors in all patients with ADCI and LBCI. The intracranial volume was added as a covariate in all cortical thickness analyses. Positive effects were tested in the cortical thickness and FA analysis while negative effects were tested in the MD analysis. p-values from all image analyses were corrected using the false discovery rate (FDR) approach. T-scores and significant regions (FDR-corrected) were mapped on the Montreal Neurologic Institute standard surface template for the cortical thickness analyses and the FMRIB58_FA_1mm template for the DTI analyses. The brain images were displayed in neurological convention.
RESULTS
Factor analysis for cognitive composite scores
The factor analysis yielded three cognitive function factors with eigenvalues > 1.0 that explained 66.7% of the variance of the subjects’ cognitive performance. Table 1 shows the factor loadings of the neuropsychological subtests for each factor. Six subtests that constitute the memory function test (the immediate recall, delayed recall and recognition items of the SVLT and RCFT) loaded heavily on factor 1. Two subtests related to visuospatial function (RCFT copy and copy time) loaded heavily on factor 2. The other six subtests of attention/working memory (backward digit span), language function (K-BNT), and frontal/executive function (COWAT animal, COWAT supermarket, COWAT phonemic, and Stroop color reading) loaded heavily on factor 3. Thus, the three cognitive function factors were regarded to represent the cognitive domains of memory function, visuospatial, and attention/executive function, respectively. The component score coefficients were then used to calculate the composite scores of the three cognitive function factors of each subject. Detailed methods for calculating the composite score of each cognitive domain are described in the Supplementary Methods and Supplementary Table 1.
Factor analyses for three cognitive composite scores
Data are results of factor analyses conducted based on the 14 scorable subtests of the SNSB using the principal components method of factor extraction and a varimax rotation. Factor 1 represents the cognitive domain of memory function, while factors 2 and 3 represent the cognitive domains of visuospatial function and attention/executive function, respectively. The factor loadings were used to calculate the composite scores of three cognitive function factors of each subject. RCFT, the Rey Complex Figure Test; SVLT, the Seoul Verbal Learning Test; COWAT, the Controlled Oral Word Association Test; K-BNT, Korean version of the Boston Naming Test.
Demographic and clinical characteristics of patients with ADCI and LBCI
The demographic and clinical characteristics of patients with ADCI and LBCI are listed in Table 2. There was no significant difference in age, years of education, or vascular risk factors between the ADCI and LBCI groups, while female patients were more common in the ADCI group than the LBCI group. The scores for the Korean version of the Mini-Mental State Examination (K-MMSE) and the proportion of cognitive status did not differ between the two groups. Compared to the LBCI group, the ADCI group had a lower composite score for the memory domain (ADCI versus LBCI = –0.24±1.14 versus 0.26±0.81, p < 0.001), a higher composite score for the attention/executive domain (ADCI versus LBCI = 0.16±0.93 versus –0.16±1.08, p = 0.003), and a comparable composite score for the visuospatial domain (ADCI versus LBCI = –0.04±1.06 versus 0.09±0.92, p > 0.999). The cognitive composite scores according to the cognitive status in the ADCI and LBCI groups are also presented in Supplementary Table 2.
Demographic characteristics of patients with Alzheimer’s disease- and Lewy bodies-related cognitive impairment
Values are expressed as mean±standard deviation or number (percentage). p values are results of analyses of variance, independent t-tests, and chi-square tests as appropriate. ADCI, Alzheimer’s disease-related cognitive impairment; LBCI, Lewy bodies-related cognitive impairment; K-MMSE, the Korean version the Mini-Mental State Examination; WMH, white matter hyperintensities; SCD, subjective cognitive decline; MCI, mild cognitive impairment. aResults of comparisons between ADCI and LBCI. bResults of comparisons among control, ADCI, and LBCI groups.
Correlation of cognitive composite scores with regional cortical thickness
Regarding the ADCI spectrum, the memory composite score positively correlated with cortical thickness in the brain regions typically affected in AD including the bilateral medial temporal, lateral temporo-parietal, and posterior cingulate cortices, as well as the basal frontal, superior frontal, and occipital cortices. The visuospatial composite score positively correlated with cortical thickness mainly in posterior brain regions including the posterior temporal and parieto-occipital cortices, in addition to the bilateral dorsolateral prefrontal and right insular cortices. The attention/executive composite score positively correlated with cortical thickness in the widespread cortical regions mainly involving brain regions typically affected in AD including the bilateral medial temporal, lateral temporal, temporo-parietal, and posterior cingulate cortices, in addition to the medial, basal, and dorsolateral prefrontal cortices (Fig. 2A).
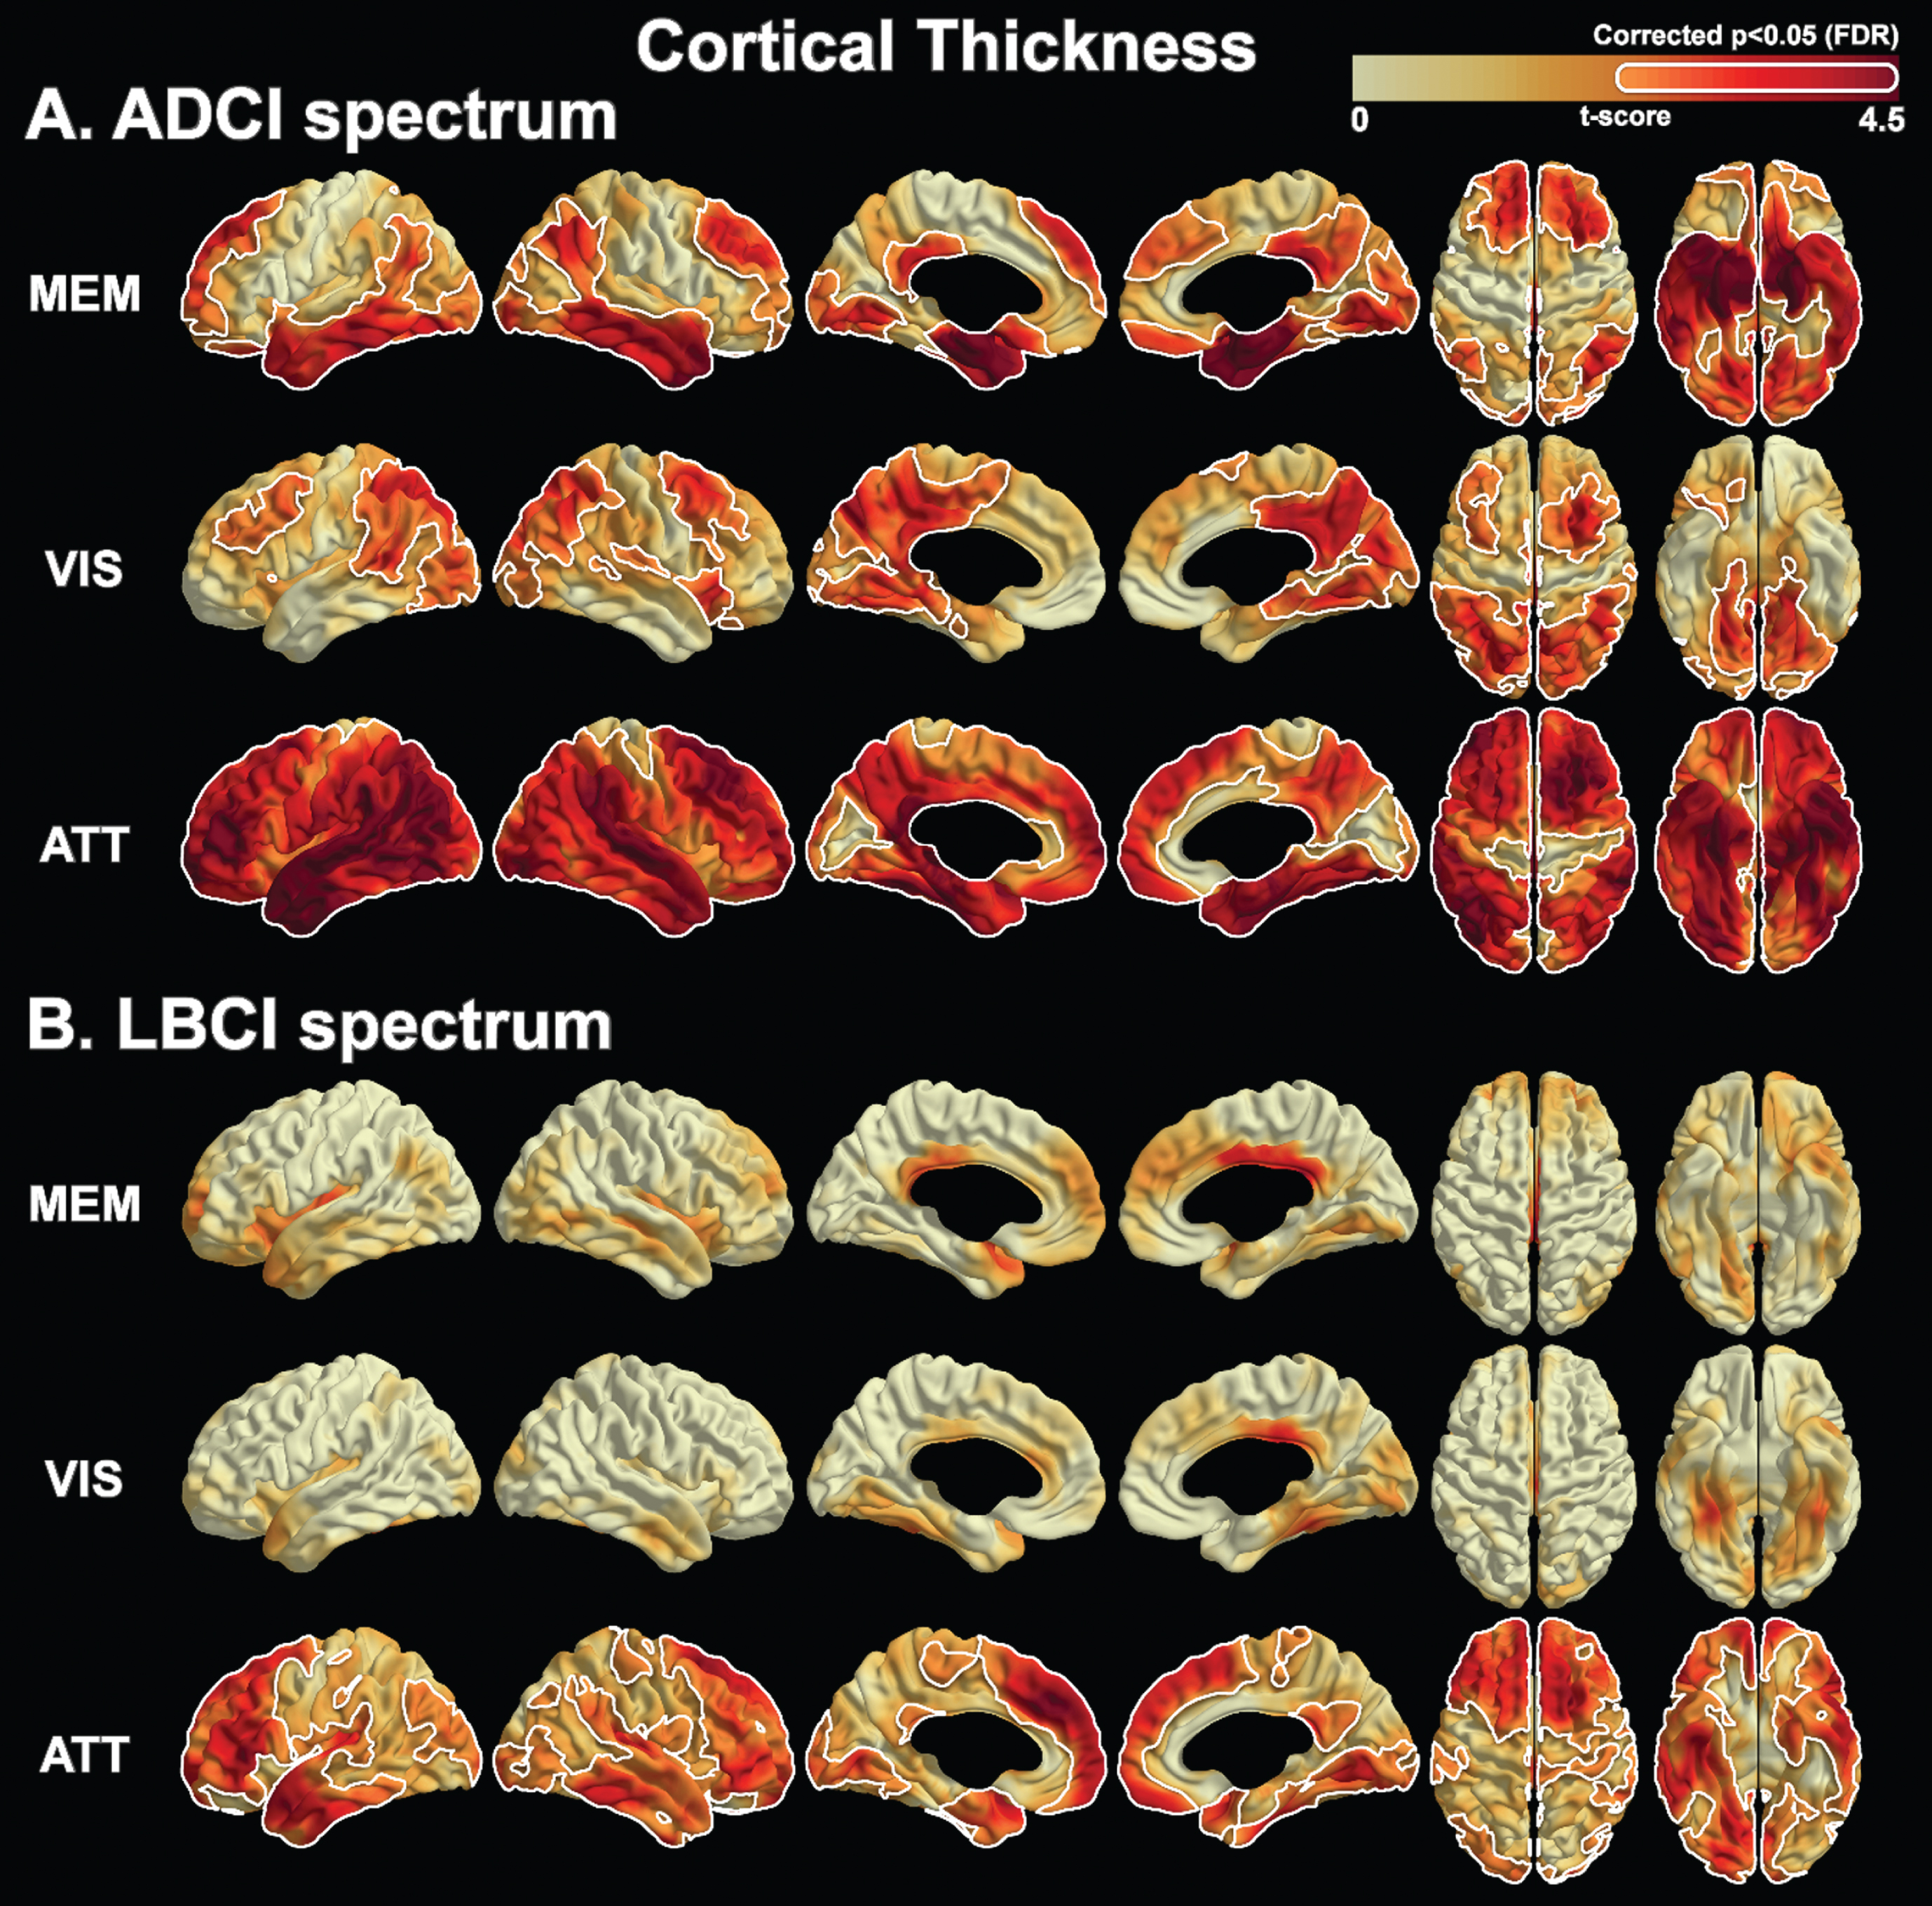
Regional cortical thickness associated with cognitive composite scores in patients with Alzheimer’s disease-related and Lewy bodies-related cognitive impairment. Results are based on a general linear model using the composite score of each cognitive function factor as a predictor and controlling for age, sex, years of education, intracranial volume, periventricular white matter hyperintensities, and presence of diabetes mellitus. The FDR method was used to correct for multiple comparisons. The color scale indicates t-values in the statistical analysis. The areas bounded by the white line indicate brain regions where the cognitive composite scores are significantly associated with the cortical thickness. The maps shown at z = –30, –20, –10, 0, 20, 40. ADCI, Alzheimer’s disease-related cognitive impairment; LBCI, Lewy bodies-related cognitive impairment; MEM, memory function domain; VIS, visuospatial function domain; ATT, attention/executive function domain; FDR, false discovery rate.
Regarding the LBCI spectrum, the memory composite score and visuospatial composite score did not correlate with regional cortical thickness. In contrast, the attention/executive score positively correlated with cortical thickness across widespread brain regions including the bilateral dorsolateral, medial, and basal prefrontal cortices, in addition to the bilateral anterior temporal, antero-medial temporal, left medial temporal, bilateral posterior cingulate, and bilateral occipital cortices (Fig. 2B).
Correlation of cognitive composite scores with diffusion tensor image markers
In patients on the ADCI spectrum, the memory composite score positively correlated with FA values in the fornix and WM adjacent to the bilateral medial temporal, cingulum, medial frontal, and basal frontal cortices, and negatively correlated with MD values in the WM adjacent to the temporo-parietal, medial temporal, basal frontal, and occipital cortices. The visuospatial composite score did not correlate with any DTI markers in patients on the ADCI spectrum. The attention/executive composite score positively correlated with FA values and negatively correlated with MD values across widespread brain regions (Fig. 3A).

Diffusion tensor markers associated with cognitive composite scores in patients with Alzheimer’s disease-related and Lewy bodies-related cognitive impairment. Results are based on a general linear model using the composite score of each cognitive function factor as a predictor and controlling for age, sex, years of education, periventricular white matter hyperintensities, and presence of diabetes mellitus. The FDR method was used to correct for multiple comparisons. The color scale indicates t-values in the statistical analysis. The areas bounded by the white line indicate brain regions where the cognitive composite scores are significantly associated with the diffusion tensor markers. ADCI, Alzheimer’s disease-related cognitive impairment; LBCI, Lewy bodies-related cognitive impairment; MEM, memory function domain; VIS, visuospatial function domain; ATT, attention/executive function domain; FDR, false discovery rate.
In patients on the LBCI spectrum, the memory composite score did not correlate with FA values, but negatively correlated with MD values in the bilateral corona radiata and WM adjacent to the anterior temporal and basal frontal cortices. The visuospatial composite score positively correlated with FA values in the widespread WM regions, including the corpus callosum and WM adjacent to the posterior cingulate cortex, and negatively correlated with MD values in the WM adjacent to the bilateral superior frontal cortices. The attention/executive composite score positively correlated with FA values and negatively correlated with MD values across widespread brain regions (Fig. 3B).
Interaction effects of group-by-composite scores
To test whether the correlations of structural brain changes with cognitive composite scores differ by the disease group (i.e., ADCI versus LBCI), further general linear models were analyzed, adding interaction terms for the diagnosis with cognitive composite scores as predictors. There was a significant interaction effect of the diagnosis and memory composite score on regional cortical thickness. The degree of positive correlation of the memory composite score and cortical thickness in the bilateral medial temporal cortices and left parietal cortex was higher in the ADCI group than in the LBCI group (Supplementary Figure 2). The degree of correlations between other brain structural changes and cognitive composite scores were not different between the two disease groups.
DISCUSSION
The present study investigated the neural correlates of cognitive dysfunction in patients with ADCI and LBCI. The major findings of our study were as follows. First, cortical thinning correlated with overall cognitive dysfunction in patients on the ADCI spectrum, while DTI changes showed the same relationship in patients on the LBCI spectrum. Second, memory dysfunction correlated with cortical thinning in the GM regions typically affected in AD, increased MD in the adjacent WM regions, and decreased FA in the WM connecting these GM regions in patients on the ADCI spectrum. Meanwhile, in patients on the LBCI spectrum, it correlated with increased MD in the WM adjacent to the bilateral anteromedial temporal, basal frontal, and insular cortices. Third, visuospatial dysfunction correlated with cortical thinning in the bilateral dorsolateral prefrontal, occipitoparietal, and posterior temporal cortices in patients on the ADCI spectrum, while in patients on the LBCI spectrum, it correlated with decreased FA in the corpus callosum and widespread WM regions and increased MD in WM adjacent to the bilateral anteromedial prefrontal cortices. Fourth, attention/executive dysfunction was associated with cortical thinning and WM changes across widespread areas in patients on either ADCI or LBCI spectrum. Taken together, our results suggest that GM atrophy in AD-prone regions and Wallerian WM degeneration could lead to overall cognitive dysfunction in ADCI, while heterogeneous WM degeneration could lead to region-specific cognitive dysfunction in LBCI.
Different neural correlates between the ADCI and LBCI spectra
Our first major finding is that GM degeneration was more important than WM degeneration for cognitive dysfunction in the ADCI spectrum, while the opposite was the case in the LBCI spectrum. Previous studies have shown that cerebral tau deposition correlates well with GM atrophy [30, 31], which in turn correlates with cognitive dysfunction in AD patients [6, 9]. However, WM degeneration in the posterior cingulum [32, 33] and medial temporal region [34] and its correlation with cognitive deficit were also reported in ADCI patients. To the best of our knowledge, our study is the first to compare the degree of cognitive correlation with GM and WM degeneration simultaneously in ADCI, and our results support the general concept that the cortical atrophy is well correlated with the clinical features of AD [35, 36]. On the contrary, WM degeneration was related to the overall cognitive dysfunction in LBCI in our study. Several previous studies have consistently reported WM degeneration across the full spectrum of cognitive statuses in LBCI [37–39]. Actually, Hattori et al. [5] demonstrated that extensive WM abnormalities were found in both MCI and dementia in PD, whereas GM atrophy was only evident in PDD, suggesting that WM abnormalities might precede GM atrophy and underlie cognitive impairment in LBD. These findings could be related to previous observations that aggregates of α-synuclein predominantly accumulate in axon in LBD [40, 41]. Blocked axonal transport caused by α-synuclein accumulation [42, 43], which precedes neuronal loss [43, 44], could be reflected in the predominant correlation between DTI markers and cognitive dysfunction in our LBCI patients.
Memory composite scores
Our second major finding is that both the ADCI and LBCI spectra had different neural correlate for memory dysfunction. Our results concerning the ADCI spectrum are consistent with previous studies that showed memory dysfunction correlated with cortical thinning [6, 9] and higher MD [45, 46] in the WM adjacent to these GM regions in AD patients. In addition, memory dysfunction in ADCI was associated with decreased FA values in the WM fiber tracts connecting the cortical associative areas (e.g., fornix and posterior cingulum which constitute the main limbic pathway) [4, 47], suggesting that these WM alterations would be secondary to neuronal loss (i.e., Wallerian degeneration) [48]. The significant interaction effect of cortical thinning on the memory composite score in the bilateral medial temporal and left lateral parietal cortices (Supplementary Figure 2) further emphasizes the importance of cortical thinning in these brain regions as a major contributor to memory dysfunction in ADCI patients.
On the other hand, in patients with LBCI, the memory composite scores negatively correlated with MD values in the WM adjacent to the anteromedial temporal, insula, and basal frontal cortices, but not with FA values. Furthermore, although statistical significance was not reached, there was a trend for a correlation between cortical thinning in the insula and anteromedial temporal cortex, where increased MD was observed. Previous studies have shown that LBD patients have atrophy in the insula [23, 49], and LB pathologies are frequent in the insula [50] and amygdala [51–53], located under the anteromedial temporal cortex. Thus, our results not only support the predilection of LB or Lewy neurite pathology in these limbic structures, but also suggest a temporal order of brain changes with an axonal or synaptic loss followed by neuronal cell body loss. Spongiform changes that are common in these limbic structures [54] or expansion of the extracellular space caused by the loss of synapses and neuronal cell bodies could be neuropathological substrates of the increased MD [55] and memory dysfunction in LBCI.
Visuospatial composite scores
Our third major finding is that the ADCI and LBCI spectra had different neural correlates for visuospatial dysfunction. In patients on the ADCI spectrum, the correlation of the visuospatial composite score with cortical thinning was observed in posterior brain regions, including the occipitoparietal and posterior temporal cortices, in addition to the bilateral dorsolateral prefrontal cortices. This finding is in line with previous studies showing the correlation of visuospatial dysfunction and posterior atrophy [9, 56] and cortical thinning in the right dorsolateral prefrontal cortex in ADCI patients [56]. In contrast, the DTI markers did not correlate with visuospatial dysfunction in patients on the ADCI spectrum, which is not consistent with a previous study that found that parietal radial diffusivity significantly correlated with visuospatial ability [57]. Differences in statistical methods for imaging analysis (voxel-based versus region-of-interest-based) and neuropsychological tests could explain this difference. Our findings once again support that cortical atrophy has a greater effect on cognitive dysfunction than WM degeneration in patients on the ADCI spectrum.
In patients on the LBCI spectrum, visuospatial dysfunction correlated with decreased FA in the corpus callosum and across widespread WM regions and increased MD in the WM adjacent to the bilateral anteromedial prefrontal cortices. Our results suggest that visuospatial dysfunction, a characteristic neuropsychological feature of LBD [58], and degeneration in the posterior brain WM, an imaging characteristic of LBD [34, 59], are correlated. In particular, the correlation of visuospatial dysfunction with FA in the corpus callosum is consistent with a previous study [60]. However, unlike our study, Garcia-Diaz et al. [60] also found significant correlations between visuospatial dysfunction in several visual function tests and cortical thinning in lateral temporo-parietal cortices in non-demented PD patients. As we observed just a trend for an association between the visuospatial composite scores and cortical thickness in the inferior temporo-occipital cortex and posterior cingulate cortex, our results suggest that axonal or synaptic loss could be more important than neuronal cell body loss for visuospatial dysfunction in patients on the LBCI spectrum. Future studies replicating our results are needed to confirm this hypothesis.
Attention/executive composite scores
Attention/executive dysfunction was associated with cortical thinning and WM changes across widespread areas for both spectra. This might be due to the complexity of the tasks used to assess the attention/executive function domain, which require various cortical inputs from widespread brain regions to be performed [61]. However, even for the attention/executive composite score, the ADCI spectrum had more prominent correlation with cortical thinning and the LBCI spectrum correlated more prominently with DTI markers in terms of FA values (Fig. 2). Among the three cognitive composite scores evaluated, only the attention/executive composite score exhibited significant differences across the disease stages of SCD, MCI, and dementia both in ADCI and LBCI groups (Supplementary Table 2). Therefore, cortical thinning patterns associated with attention/executive dysfunction could reflect brain regions related to the disease progression from SCD to MCI to dementia. In fact, the cortical thinning patterns in patients on the ADCI spectrum are consistent with the previously reported cortical signature of AD [62]. The cortical thinning patterns in patients on the LBCI spectrum included the superior frontal, anteromedial temporal, posterior cingulate, and occipital cortices, where a previous study reported a relationship with the progression to dementia in non-demented PD patients [63].
Limitations
Our study has some limitations. First, not all patients with ADCI were confirmed based on amyloid PET assessments, although we obtained similar results in the sensitivity analyses for the ADCI subgroup who performed 18F-FBB PET scans and had significant amyloid deposition (Supplementary Figure 3). In addition, there is a possibility of mixed AD and LBD pathologies in our patients. However, we made a thorough diagnosis based on the appropriate criteria [13], and excluded 36 patients with mixed pathologies (i.e., both AD and LB pathologies) confirmed by 18F-FBB PET and 18F-FP-CIT PET scans in neuroimaging analyses. Although our parallel investigations for the correlations between cognitive dysfunction and brain structural changes in the ADCI and LBCI spectra enabled us to conclude that the neural correlates of cognitive dysfunction could differ between the ADCI and LBCI spectra, we cannot exclude the possibility that interaction effects of AD and LBD pathologies may be reflected in our results. Further studies with pure ADCI and LBCI patients confirmed by biomarkers would be needed to draw firm conclusions. Second, despite an overlapping clinical spectrum, DLB and PDD may have different pathomechanisms and functional networks [64]. Therefore, some intragroup variability may exist in the LBCI group. Third, the equations to estimate the cognitive composite scores can differ according to the dataset, and further studies would be needed to validate our findings. Fourth, the main determinants of the visuospatial composite score (Factor 2) were RCFT copy and RCFT copy time. In patients with LBCI, the distinction between cognitive and motor deficits is an important issue when assessing their visuospatial function [65]. Therefore, our results concerning visuospatial dysfunction in the LBCI group should be cautiously interpreted. However, to avoid this issue, we used factor analyses instead of averaging individual z-scores. Furthermore, the communality (i.e., total amount of variance of an original variable shares with all other variables in the factor analysis) of RCFT copy time was large enough to be estimated as 0.688, and thus RCFT copy time appeared to well account for the subjects’ cognitive performance as a component of visuospatial function. Lastly, we could not evaluate the effects of neurotransmitter system dysregulation on cognitive dysfunction in LBCI. Several studies have reported that executive dysfunction is related to dopamine deficiency in fronto-striatal circuits [66].
Conclusions
The present study demonstrated that cortical thinning had a greater effect on cognitive dysfunction in ADCI, while WM degeneration had a greater effect in LBCI. Our results suggest that the neural correlates of cognitive dysfunction differ between patients with ADCI and those with LBCI. Future studies focusing on the correlation of structural brain changes and cognitive dysfunction could enhance the sensitivity of LBD diagnosis, which is currently too low.
Footnotes
ACKNOWLEDGMENTS
This research supported by the Basic Science Research Program through the National Research Foundation of Korea (NRF) funded by the Ministry of Education (grant number: NRF-2018R1D1A1B07048959 and NRF-2019R1I1A1A01059454), and by a grant from Canadian Institutes of Health Research (CIHR; 201085 & 247003) and Canada First Research Excellence Fund / Healthy Brains for Healthy Lives Discovery Fund (CFREF/HBHL; 247712) awarded to Professor Alan C. Evans. Dr. Seun Jeon is the recipient of following fellowships that contribute to his support: Bourse Fonds de Recherche Santé Québec (FRQS, dossier 34240 & 259605) and by Jeanne Timmins Costello Fellowship of the Montreal Neurological Institute (240522).