
Abstract
There is a need to elucidate the combined influence of neurodegeneration and cerebrovascular disease (CeVD) on cognitive impairment, especially in diverse populations. Here, we evaluated 840 multiethnic individuals (mean age = 70.18) across the disease spectrum from the Epidemiology of Dementia in Singapore study. First, we determined whether a validated quantitative MRI score of mixed pathology is associated with clinical diagnosis and whether the score differed between ethnicities (Chinese, Malays, and Indians). We then evaluated whether the score was associated with multidomain cognitive impairment and if additional measures of CeVD were further associated with cognitive impairment. We found that lower quantitative MRI scores were associated with severity of clinical diagnosis and Chinese individuals had the highest quantitative MRI scores, followed by Indians and Malays. Lower quantitative MRI scores were also associated with lower performance in attention, language, visuoconstruction, visuomotor, visual, and verbal memory domains. Lastly, the presence of intracranial stenosis and cortical cerebral microinfarcts, but not cerebral microbleeds, were associated with memory performance beyond quantitative MRI scores. Taken together, our results demonstrate the utility of using multiple MRI markers of neurodegeneration and CeVD for identifying multiethnic Asians with the greatest cognitive impairment due to mixed pathology.
Keywords
INTRODUCTION
There is increasing consensus that most dementia is multifactorial and that the clinical diagnosis of Alzheimer’s disease (AD) dementia likely stems from heterogenous and comorbid pathologic etiology [1–3]. Among mixed dementias, concomitant Alzheimer’s associated neurodegeneration and cerebrovascular disease (CeVD) is the most common [4] and a number of studies have developed MRI composite scores for determining cerebrovascular and/or neurodegenerative load for disease prediction [5–7]. In particular, a single quantitative MRI composite measure of comorbid neurodegenerative and cerebrovascular pathology comprising of hippocampus volume, cortical thickness of known AD-associated regions, white matter hyperintensities (WMH), and presence of infarcts weighted by their contributions to episodic memory performance was developed and validated in an autopsy subsample by Brickman and colleagues [5].
However, as the scores were developed in a population of African Americans, Caribbean Hispanic, and Caucasians, the applicability of this score in diverse multiethnic Asian populations such as in Singapore where individuals with concomitant AD and CeVD are common but under-recognized remains unknown [8]. Prior multiethnic community-based studies (see [9] for a review) in Singapore have found differences in dementia prevalence in ethnic Chinese, Malays, and Indians as a function of AD or vascular dementia subtypes. The largest study involving 14,817 individuals found that compared to the Chinese, Malays had double the risk of AD dementia and Indians had more than double the risk of AD and vascular dementia [10]. These interethnic differences in dementia subtypes prevalence suggest that MRI composite scores may further elucidate the combined contributions of neurodegeneration and CeVD to dementia among multiethnic Asians in Singapore.
In addition, as the weights of the quantitative score were derived based on its influence on episodic memory performance [11], whether it also captures multidomain cognitive impairment due to mixed pathology necessitates further investigation. Other MRI measures of CeVD such as presence of intracranial stenosis (ICS) [12], cerebral microbleeds (CMBs) [13] (but see [14]), and cortical cerebral microinfarcts (CMIs) [15] also likely confer independent effects on cognitive impairment and disease progression, but whether they provide additional predictive utility beyond WMH and infarcts used in the current quantitative MRI score remains unknown. The evaluation of these additional markers of CeVD is necessary to provide a more comprehensive picture of the contributions of MRI markers of CeVD in conjunction with neurodegeneration on cognitive impairment.
In order to address these open questions, here we evaluated the utility of the quantitative MRI score in a multiethnic sample from Singapore by systematically investigating its association with clinically relevant variables, including clinical diagnosis, age, and multi-domain cognitive function. We further investigated whether the score differed between ethnicities and whether the addition of other MR markers of CeVD (i.e., presence of ICS, CMBs, or CMIs) is associated with cognitive function beyond quantitative MRI scores.
MATERIALS AND METHODS
Participants
The Epidemiology of Dementia in Singapore (EDIS) study recruited a subsample of 957 participants aged ≥60 years from Singapore Epidemiology of Eye Disease (SEED) study [16, 17], a multiethnic population-based study of Chinese, Malays, and Indians aged 40–85 years. Participants in the EDIS study were recruited from December 2010 to July 2015 and screened using an abbreviated mental test (≤6 for participants with ≤6 years of formal education, and ≤8 for participants with > 6 years of formal education) and the progressive forgetfulness questionnaire reported by the participant or caregiver as previously described [18]. They underwent comprehensive clinical evaluation, neuropsychological testing, and neuroimaging. In the current study, we restricted analyses to 840 individuals (mean age = 70.18 years, standard deviation (SD) = 6.59) who had complete neuroimaging data necessary for the computation of the quantitative MRI score of concomitant neurodegeneration and cerebrovascular pathology. Demographic characteristics of the participants are summarized in Table 1. Ethics approval for the EDIS study (2009/00628) was obtained from the Singapore Eye Research Institute and National Healthcare Group Domain-Specific Review Board. Written informed consent was obtained in the preferred language of the participants.
Demographics
We were not able to assess CMBs, ICS, and CMIs in 16, 16, and 3 participants respectively.
Clinical characterization and neuropsychological assessment
Participants underwent an extensive locally validated neuropsychological battery [18, 19] to assess five non-memory domains: Executive function (Frontal Assessment Battery, Maze Task), Attention (Digit Span, Visual Memory Span, Auditory Detection), Language (Boston Naming Test, Verbal Fluency), Visuomotor speed (Symbol Digit Modality Test, Digit Cancellation), Visuoconstruction (WMS-R, Visual Reproduction Copy Task, Clock Drawing, WAIS-R Block Design), and two memory domains: Verbal memory (Word List Recall, Story Recall) and Visual Memory (Picture Recall and WMS-R Visual Reproduction). We computed Z-scores from each neuropsychological test and averaged them for each domain to derive the cognitive domain-specific Z-scores. We further averaged the 5 Z-scores in the non-memory domains and the 2 Z-scores in the memory domains separately, to derive a composite non-memory score and a composite memory score respectively.
Diagnostic status of all individuals was determined through clinical consensus meetings where clinical history, neuropsychological testing, and MRI scans were reviewed. The diagnosis of No Cognitive Impairment (NCI) was given to participants who had no objective cognitive impairment on the neuropsychological tests nor functional loss. The diagnosis of cognitive impairment without dementia (CIND) followed existing guidelines [20] and was classified as either CIND mild (≤2 impaired domains) or moderate (>2 impaired domains). The diagnosis of dementia was made according to the DSM-IV criteria. The use of these diagnostic criteria has been previously described [18].
Neuroimaging acquisition and processing
MRI scans were performed on a 3T Siemens Magnetom Trio Tim scanner with a 32-channel head coil. T1-weighted (1.0×1.0×1.0 mm3 voxels; repetition time (TR) 2300 ms; echo time (TE) 1.9 ms; inversion time (TI) 900 ms; flip angle 9°; matrix 256×256), T2-weighted (1.0×1.0×3.0 mm3 voxels; TR 3000 ms; TE 10.1 ms; matrix 247×256), fluid attenuated inversion recovery (FLAIR, 1.0×1.0×3.0 mm3; TR 9000 ms; TE 82 ms; TI 2500 ms; matrix 232×256, susceptibility-weighted imaging (SWI, TR 27 ms, TE 20 ms, flip angle 15°; matrix 192×256) scans, 3D time-of-flight magnetic resonance angiography (MRA, 0.8×0.8×0.8 mm3 voxels; TR 22 ms; TE 3.4 ms; flip angle 20°; matrix 218×256) were collected. We used visual grading for four of the MRI markers of cerebrovascular disease, namely infarcts, ICS, CMBs, and CMIs using procedures as previously described [7, 22]. In brief, presence of infarcts was determined on FLAIR and T2-weighted following the STRIVE criteria for identifying lacunes of presumed vascular origin [23]. ICS was defined by narrowing exceeding 50% of the luminal diameter in any of the assessed intracranial vessels with a final decision made on reconstructed sections of the 3D MRA. Presence of CMBs was determined on SWI images using the Brain Observer Micro Bleed Scale [24]. Presence of CMIs was defined by cortical hypointensities < 5 mm in diameter on T1-weighted scans, and confirmed on T2-, and FLAIR sequences [22]. Volumetric WMH were quantified using automated segmentation procedures at the Erasmus MC, University Medical Center Rotterdam, the Netherlands [21]. Automated cortical reconstruction and volumetric segmentation of the structural T1-weighted MRI was performed using FreeSurfer© 5.1 [25] to derive regional volumes and thickness based on regions of interest (ROIs) defined in the Desikan-Killiany atlas [26].
Quantitative MRI score
The quantitative MRI measure of cerebrovascular and neurodegeneration was computed following the equation consisting of the weighted sum of four neuroimaging markers as described by Brickman and colleagues [5]: (–0.088)*log WMH volume + (–0.045)*presence of infarct + (0.00027)*hippocampus volume + (1.03)*cortical thickness of known AD-associated regions (i.e., entorhinal cortex, para-hippocampus, inferior parietal, pars opercularis, pars orbitalis, pars triangularis, inferior temporal, temporal pole, precuneus, supramarginal gyrus, superior parietal, and superior frontal lobe). The weights for the MRI measures were derived by first determining their associations with episodic performance followed by validation in an independent sample. In addition, the score was shown to be associated with amyloid and tau biomarkers in the Alzheimer’s Disease Neuroimaging Initiative 1 (ADNI-1) sample [5].
Statistical analysis
First, we conducted an analysis of covariance (ANCOVA) to determine if clinical diagnosis (NCI, CIND mild, CIND moderate, Dementia) was significantly associated with the quantitative MRI score, controlling for age, sex, education, and intracranial volume (ICV). Following that, we conducted post-hoc tests to evaluate which clinical diagnostic groups differed in mean adjusted quantitative MRI score at a Bonferroni corrected p < 0.007 for 7 total comparisons (i.e., 0.05/7). Next, we used linear regression to evaluate if the quantitative MRI score was associated with age and an ANCOVA test to determine if the three ethnicities (Chinese, Malays, Indians) differed in quantitative MRI scores. We further tested the interaction between age and ethnicity for predicting quantitative MRI scores to determine if there were ethnic differences in cross-sectional age-associated quantitative MRI scores. In these analyses, we controlled for age, sex, education, ICV, and clinical diagnosis. We additionally controlled for presence of hypertension, diabetes, hyperlipidemia, and binarized APOE ɛ4 carrier status in a subset of 632 individuals with these data.
We then evaluated whether lower quantitative MRI scores were associated with poorer cognitive performance in seven cognitive domains (executive function, attention, language, visuomotor, visuoconstruction, verbal memory, and visual memory), controlling for age, sex, education, ICV, and clinical diagnosis. We controlled for multiple corrections at a false discovery rate (FDR) of q < 0.05. We additionally evaluated whether the quantitative MRI model resulted in a better fit compared to a nonnested model with only unweighted neurodegenerative components (i.e., hippocampal volume and mean cortical thickness of AD-associated regions) by evaluating Bayesian information criterion (BIC) differences using R package AICcmodavg. A BIC difference of 2–6, 6–10, and > 10 corresponds to a Bayes Factor of 3–20 (positive evidence), 20–150 (strong evidence), and >150 (very strong evidence), respectively [27]. We further added the presence of ICS, CMBs, and CMIs individually into separate linear models to evaluate if the inclusion of these other MR measures of CeVD was associated with non-memory and memory performance beyond the quantitative MRI score. All analyses were conducted using R 3.5.2.
RESULTS
Associations of quantitative MRI scores with clinical diagnosis
The omnibus ANCOVA F test showed that the association of diagnosis with quantitative MRI scores was statistically significant, F(3, 832 = 20.16, p = 1.28×10⁻¹², Fig. 1). Increasing severity of clinical diagnosis was associated with lower quantitative MRI scores (linear trend p < 0.001), and post-hoc comparisons (Bonferroni corrected p < 0.007) between diagnostic groups showed that demented patients had lower quantitative MRI scores than CIND moderate (adjusted mean difference = –0.27, SE = 0.05, p = 2.93×10⁻⁵), CIND mild (adjusted mean difference=–0.35, SE = 0.06, p = 8.60×10⁻¹⁰), and NCI (adjusted mean difference=–0.39, SE = 0.06, p = 5.04×10⁻¹¹). CIND moderate patients had lower quantitative MRI scores than CIND mild (adjusted mean difference = –0.13, SE = 0.03, p = 2.84×10⁻⁶) and NCI (adjusted mean difference = –0.17, SE = 0.03, p = 2.00×10⁻⁸). However, CIND mild patients did not differ in quantitative MRI scores from NCI (adjusted mean difference = –0.05, SE = 0.03, p = 0.12). Quantitative MRI scores for all diagnostic group were normally distributed as tested by the Anderson-Darling test (p > 0.05).
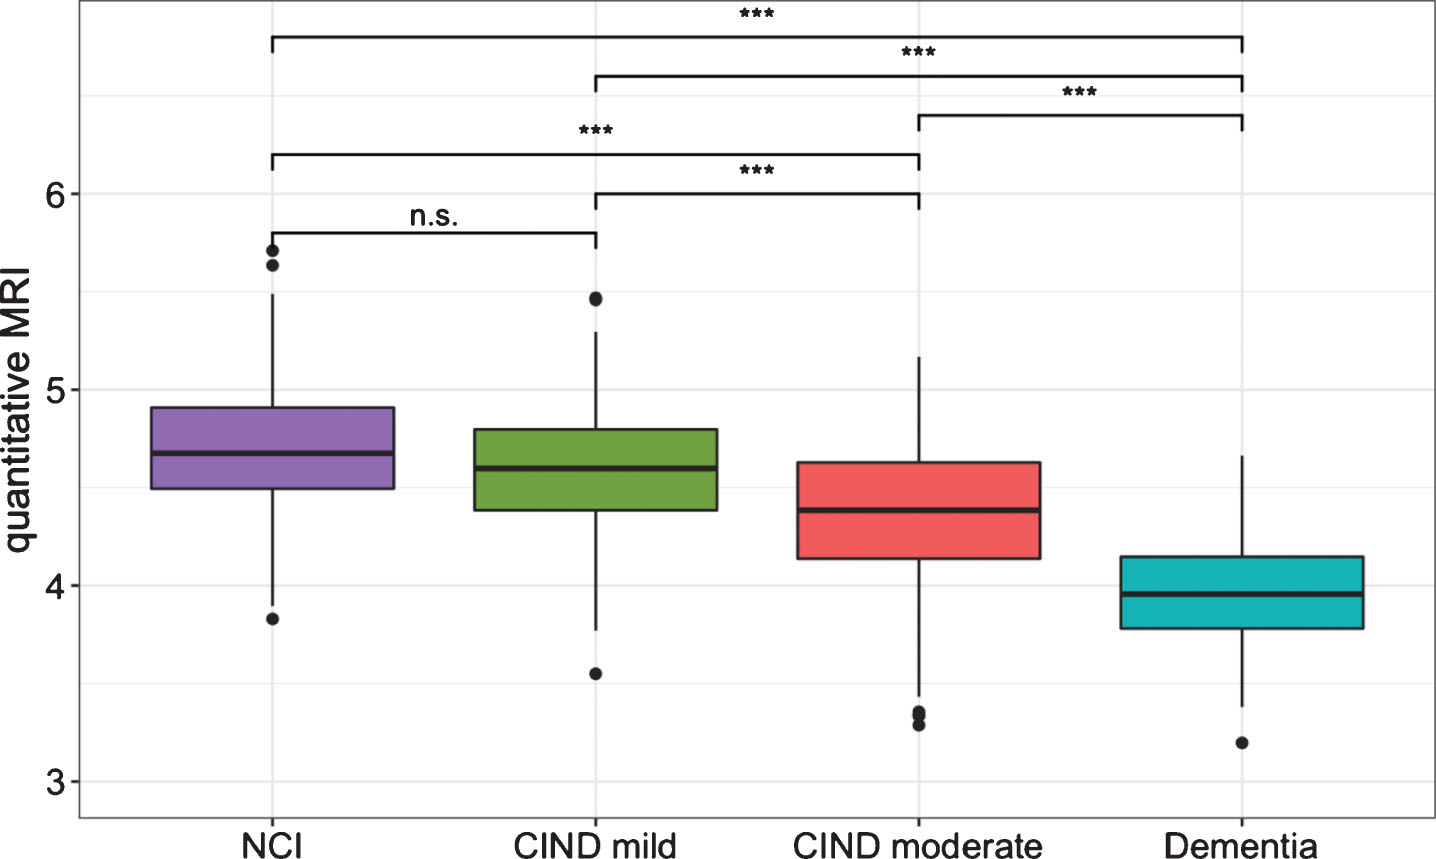
Differences in quantitative MRI scores between diagnostic groups. Individuals with increasing severity of clinical diagnostic impairment had lower quantitative MRI scores except for the post-hoc comparison between individuals diagnosed with No Cognitive Impairment (NCI) and Cognitive Impairment No Dementia (CIND). ***p < 0.001.
Associations of quantitative MRI scores with age and ethnicity
As expected, older age was strongly associated with lower quantitative MRI scores (β= –0.19, SE = 0.01, p < 2×10–16). The omnibus ANCOVA F test revealed that the effect of ethnicity on quantitative MRI scores was statistically significant F(2, 830 = 17.10, p = 5.27×10⁻⁸, Fig. 2). Post-hoc comparisons revealed that Malays had lower quantitative MRI scores compared to the Chinese (adjusted mean difference = –0.15, SE = 0.03, p = 8.78×10⁻⁹) and the Indians (adjusted mean difference = –0.06, SE = 0.03, p = 0.03). The Indians also had statistically significant lower quantitative MRI scores than the Chinese (adjusted mean difference = –0.09, SE = 0.03, p = 6.57×10⁻⁴). All differences remained statistically significant even after additionally controlling for presence of hypertension, diabetes, hyperlipidemia, and binarized APOE ɛ4 carrier status in a subset of 632 subjects who had these data, p < 0.05. The ethnicity by age interaction did not reach statistical significance, F(2, 828 = 0.61, p > 0.05) indicating that the slopes for quantitative MRI scores across age did not differ across ethnicities.

Ethnic differences in quantitative MRI scores. Chinese individuals had the highest quantitative MRI scores followed by Indians and Malays. Residuals from regressing out age, sex, intracranial volume, education, and diagnosis from quantitative MRI scores are plotted. *p < 0.05, ***p < 0.001.
Associations of quantitative MRI scores with multidomain cognitive impairment
We found that low quantitative MRI scores were significantly associated with lower performance in the non-memory domains of attention (β= 0.25, SE = 0.8, q < 0.01), language (β= 0.28, SE = 0.09, q < 0.01), visuoconstruction (β= 0.25, SE = 0.07, q < 0.001), visuomotor (β= 0.15, SE = 0.06, q < 0.05), but not executive function (β= 0.15, SE = 0.08, q = 0.06). These associations were also found for verbal memory (β= 0.18, SE = 0.07, q < 0.05) and visual memory (β= 0.32, SE = 0.07, q < 0.0001) domains (Fig. 3). Comparing between the quantitative MRI model with the hippocampal and cortical thickness model in the statistically significant cognitive domains, the quantitative MRI models had lower BIC than the neurodegeneration only models. The BIC differences were equivalent to a Bayes factor of 20–150 (indicating strong evidence [27]) for all these domains: attention (ΔBIC = 6.36), language (ΔBIC = 8.17), visuomotor (ΔBIC = 8.45), visuoconstruction (ΔBIC = 9.61), visual memory (ΔBIC = 8.97), and verbal memory (ΔBIC = 7.85).
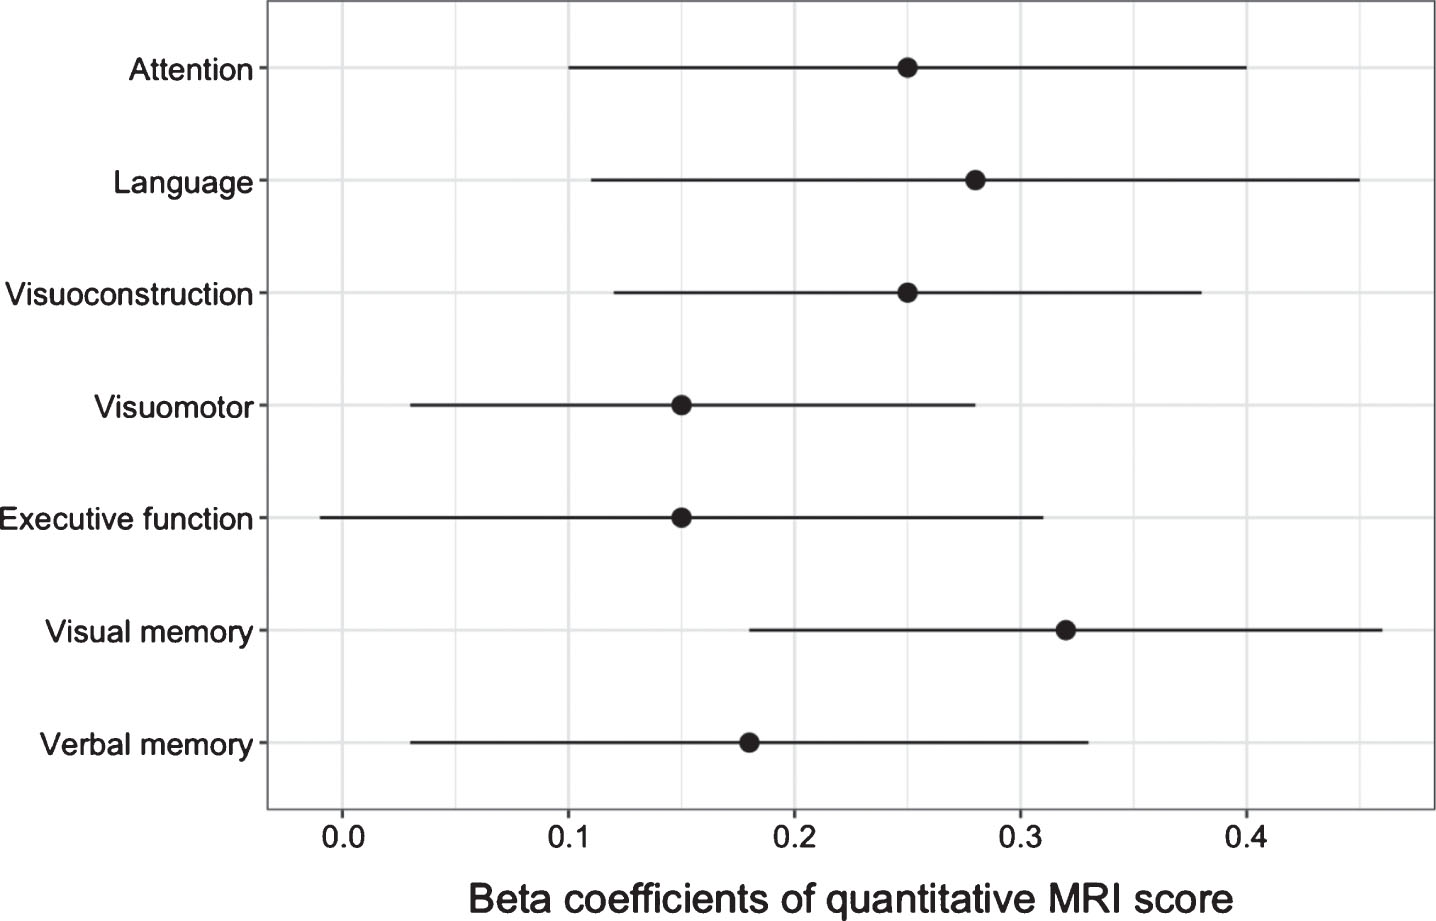
Beta coefficients of quantitative MRI scores on multidomain cognitive impairment. Quantitative MRI scores were associated with cognitive impairment in all cognitive domains at FDR adjusted q < 0.05 except for executive function (q = 0.06).
Associations other MRI markers of CeVD with cognitive impairment beyond quantitative MRI scores
The addition of presence of ICS was associated with lower scores in the composite memory domain (β= –0.11, SE = 0.05, p = 0.025) but not in the composite non-memory domain (β= –0.06, SE = 0.05, p = 0.21, Table 2). Similarly, the addition of CMIs was associated with lower scores in the composite memory domain (β= –0.15, SE = 0.07, p = 0.039) but not in the composite non-memory domain (β= –0.02, SE = 0.06, p = 0.71). The addition of the presence of CMBs was not associated with performance in both cognitive domains beyond quantitative MRI scores (p > 0.05).
Beta estimates of other MRI markers of CeVD with cognitive impairment beyond quantitative MRI scores
*p < 0.05
DISCUSSION
In this multiethnic Asian sample across the disease spectrum, we found that individuals with lower quantitative MRI scores corresponding to greater neurodegenerative and cerebrovascular pathological comorbidity, had increasing severity of clinical diagnosis and multidomain cognitive impairment. Our analyses between ethnicities revealed that Chinese individuals had the highest quantitative MRI scores compared to Indians and Malays, congruent with existing findings showing greater prevalence of dementia in the Malay and Indian communities [9, 28]. These results thus suggest that the greater prevalence may be partially explained by increased cognitive impairment due to greater concomitant neurodegeneration and cerebrovascular disease as measured by quantitative MRI scores. We did not find a statistically significant interaction between ethnicity and cross-sectional age-associated quantitative MRI scores, which may suggest that differences in mean levels of quantitative MRI scores may be apparent even in ages earlier than the individuals (age≥60) recruited for the study. It may also be the case that as the estimates used to compute the quantitative MRI score were derived from a population of African Americans, Caribbean Hispanic, and Caucasians, they may not be optimal for use in diverse Asian populations. Developing ethnic-specific quantitative MRI scores for Chinese, Malays, and Indians in future large studies may yield more precise fits and thus more accurate predictions for investigating ethnic differences in cognitive and clinical impairment over time.
In the current study, although ethnic differences in quantitative MRI persisted even after controlling for lifestyle-related risk factors of hypertension, diabetes, and hyperlipidemia, these interethnic differences may reflect overall reduced brain reserve [29] due to lower brain integrity resulting from other lifestyle, diet, and/or genetic factors that were not investigated. Of note, a large population-based study of 14,424 multiethnic individuals in Singapore found that Chinese individuals reported the highest amount of median physical activity involving moderate and/or vigorous intensity leisure time, followed by Malays and Indians. Chinese individuals were also least likely to have high waist circumference, had the lowest carbohydrate and fat intake as a percentage of daily energy, and had better lipid profiles [30]. Studies [31–33] investigating differential frequencies of APOE ɛ4 carrier status across all three ethnicities have yielded mixed results such that compared to Malays, Indians had either higher [31, 33] or lower ɛ4 frequencies [32]. However, these studies converge in showing that Chinese individuals had lower ɛ4 frequencies than Malays. In our subset of 632 individuals who had APOE data, Malays also had higher ɛ4 frequencies (24%) than Chinese (14%) and Indians (15%). As ethnic differences in quantitative MRI scores also remained statistically significant even after controlling for APOE ɛ4 carrier status, investigating polygenic differences in susceptibility to concomitant neurodegeneration and CeVD [34, 35] may shed further light on these differences found in the current study. It may be that these interethnic differences would be better elucidated by investigating interactions between polygenic and lifestyle-related factors, parallel to findings in Caucasian populations [36].
Our finding that lower quantitative MRI scores were associated with multi-domain cognitive impairment including attention, visuoconstruction, visuomotor, language, visual memory, and verbal memory indicates that the score has utility beyond being a biomarker of declarative memory performance. Across these cognitive domains, we found a better fit for the quantitative MRI model compared to a model with hippocampal volumes and cortical thickness as demonstrated by lower BIC values corresponding to Bayes factor 20–150, indicating strong evidence [27]. These results suggest that the relationships between quantitative MRI scores and cognition were not purely driven by measures of neurodegeneration, and that the quantitative MRI score of concomitant neurodegeneration and cerebrovascular disease provides additional information beyond hippocampal volumes and cortical thickness for predicting cognitive function.
Given that comorbid AD and CeVD have been found to be associated with greater cognitive impairment and AD dementia [37], the quantitative MRI score may be clinically useful for identifying individuals at the greatest risk of rapid short-term cognitive decline due to mixed pathology. This is especially relevant for developing countries in the Asia-Pacific where the general lack of expensive PET imaging in clinical evaluation is likely to persist in the future, thereby increasing its potential utility in the region. Coupled with the rising rates of obesity and other non-communicable diseases such as diabetes expected to drive increases in dementia prevalence in Asia [38, 39], composite scores of MRI measures of neurodegeneration and CeVD may provide a viable multilesion approach for disease monitoring in these populations.
Further, our results suggest that the evaluation of the presence of ICS may provide additional predictive value beyond the quantitative MRI score for memory performance, consistent with findings showing that ICS is implicated in vascular cognitive impairment and dementia [21, 40], and faster progression from mild cognitive impairment to dementia [12]. The addition of CMIs was also associated with memory performance beyond quantitative MRI, building upon existing literature showing that CMIs are predictive of cognitive impairment [15, 22]. These findings therefore suggest that the integration of ICS and CMIs into the current quantitative MRI score may generate a more comprehensive composite score of concomitant neurodegeneration and CeVD for disease prediction. The lack of an association of CMBs and cognitive function beyond quantitative MRI scores may be reflective of the current inconsistent and weak relationships of CMBs with cognition in the literature [14]. However, our findings do not preclude the possibility that a more precise weighing of the contributions of CMBs may be associated with cognitive function beyond quantitative MRI scores.
The current study is limited by its cross-sectional design which cannot capture the influence of neurodegenerative and CeVD on cognitive and clinical decline over time and future longitudinal studies are needed. The lack of CSF/PET assessment of AD-associated amyloid and tau accumulation in the current study also prevents the evaluation of whether the quantitative MRI score is associated with canonical biomarkers of AD in Asian populations. In addition, NCI and CIND mild individuals in our study did not differ statistically in quantitative MRI scores. These differences may be detected with larger sample sizes although this finding may be reflective of existing findings showing that the contributions of CeVD to AD likely manifest itself in states of mild cognitive impairment and dementia [41, 42].
In conclusion, our combined results represent the first study to determine that a quantitative MRI score of neurodegeneration and CeVD shows robust associations with diagnostic severity and multidomain cognitive impairment in a multiethnic Asian sample. Differences between ethnicities found in the current study highlight the need for greater diversity and inclusion in order for medical research to benefit everyone [43], such as through the evaluation of ethnic-specific genetic risk and susceptibility to concomitant neurodegeneration and CeVD. Future studies will be needed to validate if the inclusion of ICS and CMIs into a composite MRI score of neurodegeneration and CeVD best predict longitudinal cognitive and clinical decline. Taken together, our findings add to the growing literature demonstrating the importance of assessing the role of CeVD in the heterogeneous AD process for the identification of individuals at the highest risk of cognitive impairment due to mixed pathology.
Footnotes
ACKNOWLEDGMENTS
This study was supported by Nanyang Technological University, Singapore Start-Up Grant M40824100 and MOE AcRF Tier 1 M4012193. The Epidemiology of Dementia in Singapore study is supported by the National Medical Research Council (NMRC), Singapore (NMRC/CG/NUHS/2010 [Grant no: R-184-006-184-511]) and (NMRC/CSA/038/2013).