
Abstract
The genetics of late-onset Alzheimer’s disease (AD) is complex due to the heterogeneous nature of the disorder. APOE*4 is the strongest genetic risk factor for AD. Genome-wide association studies have identified more than 30 additional loci, each having relatively small effect size. Known AD loci explain only about 30% of the genetic variance, and thus much of the genetic variance remains unexplained. To identify some of the missing heritability of AD, we analyzed whole-exome sequencing (WES) data focusing on non-APOE*4 carriers from two WES datasets: 720 cases and controls from the University of Pittsburgh and 7,252 cases and controls from the Alzheimer’s Disease Sequencing Project. Following separate WES analyses in each dataset, we performed meta-analysis for overlapping markers present in both datasets. Among the four variants reaching the exome-wide significance threshold, three were from known AD loci: APOE/rs7412 (odds ratio (OR) = 0.40; p = 5.46E–24), TOMM40/rs157581 (OR = 1.49; p = 4.04E–07), and TREM2/rs75932628 (OR = 4.00; p = 1.15E–07). The fourth significant variant, rs199533, was from a novel locus on chromosome 17 in the NSF gene (OR = 0.78; p = 2.88E–07). NSF was also significant in the gene-based analysis (p = 1.20E–05). In the GTEx data, NSF/rs199533 is a cis-eQTL for multiple genes in the brain and blood, including NSF that is highly expressed across all brain tissues, including regions that typically show amyloid-β accumulation. Further characterization of genes that are affected by NSF/rs199533 may help to shed light on the roles of these genes in AD etiology.
INTRODUCTION
Alzheimer’s disease (AD), especially the late-onset form that comprises about 95% of all AD cases, is genetically complex with polygenic risk inheritance and heritability estimates up to 79% [1]. Large scale case-control genome-wide association studies (GWAS) as well as meta-analyses of GWAS have identified more than 30 susceptibility loci for late-onset AD [2–5]. Recent application of whole-exome microarray and whole-exome sequencing (WES) has identified rare variants in additional novel genes [6–8]. However, known AD genes/variants do not explain all of the estimated AD genetic variance [9]. APOE*4 is the most significant risk factor for AD and is also the major contributor to the observed genetic variance. It is possible that in the presence of APOE*4, the effect of some significant genes may not be apparent. In order to address this question, we analyzed WES data focusing on non-APOE*4 carriers from two datasets, including 720 cases and controls from the University of Pittsburgh Alzheimer’s Disease Research Center (PITT-ADRC) and 7,252 cases and controls from the Alzheimer’s Disease Sequencing Project (ADSP). Following separate WES analyses in each dataset, we performed meta-analysis for overlapping markers present in both datasets.
METHODS
Two independent WES datasets were used and pre-processed and analyzed for case-control association separately, and then meta-analysis was performed to combine the two. The detail of the data processing and analysis workflow is summarized in Supplementary Figure 1 and is briefly described below.
University of Pittsburgh
A total of 775 cases and controls biased against APOE*4 carriers were derived from the University of Pittsburgh Alzheimer’s Disease Research Center (PITT-ADRC) and affiliated studies. All subjects were European Americans with age 60 years and above. AD cases were determined based on criteria set by the National Institute of Neurological and Communication Disorders and Stroke (NINCDS)/Alzheimer’s Disease and Related Disorders Association (ADRDA). Controls were cognitively normal subjects who were recruited from the same geographical area as the cases. Standard protocols, including medical and neurological examinations, have been described previously [10]. All participants completed a University of Pittsburgh Internal Review Board (IRB)-approved informed consent process.
WES was performed in a commercial laboratory (Beckman-Coulter Genomics, Danvers, MA, USA) using the Illumina platform, SureSelect. All Exon V5 was used to capture the whole-exome regions followed by sequencing using paired-end 2×100 base pair read length at an average coverage of 75×. A variant call file (VCF) and the summary report were provided by Beckman-Coulter Genomics upon completion of the sequencing. Reads were mapped to human genome build GRCh37/hg19 using BWA-MEM (v0.7.6). A total of 954,226 WES variants passed the quality score recalibration (VQSR) filter. After quality control measures, the sample consisted of 406 cases (mean age: 75.67±5.69 years, mean age-at-onset (AAO): 71.53±5.5 years, 62.8% female, 22.6% autopsy confirmed; 34 APOE*4 carriers) and 367 controls (mean age: 78.68±4.67 years, 66.2% female; 19 APOE*4 carriers). As the focus of this study was on non-APOE*4 carriers, a small number (n = 53) with APOE*4 and two samples missing the phenotype were excluded and the final analysis included 720 subjects, including 372 AD cases and 348 controls.
Alzheimer’s disease sequencing project (ADSP)
The phenotype and the WES data for the Alzheimer’s Disease Sequencing Project (ADSP) were obtained from dbGaP (phg0067.v1.p4 and phs000572.v7.p4). Both cases and controls were at least 60 years old. All cases met the NINCDS-ADRDA criteria for possible or probable AD. All controls were judged to be cognitively normal. VCF files from all six consent groups were downloaded that comprised a total of 10,913 subjects and over 1.5 million genetic variants. We first annotated the 1,454,483 SNPs and 69,931 InDels with the corresponding rs number from UCSC GRCh37/hg19 assembly, variation SNP150. The annotation rate was 92.71% and 88.31% for SNP and InDel, respectively. The un-annotated variations were named with chromosome, base positions, and alleles present in the VCF as CHR: BP: MinorAllele: MajorAllele to be consistent with PITT-ADRC VCF file. Then the same quality control (QC) and the study cohort selection were applied in both data sets, as described below.
Study cohort and genotype filtering
We applied the same sample selection and QC criteria to both datasets. We performed all analyses and data manipulations with VCF tools (v0.1.12b, http://vcftools.sourceforge.net/), PLINK (v1.9, https://www.cog-genomics.org/plink2), or R (v. 3.4.4, https://www.r-project.org/). When age was used as selection criterion or as a covariate in the statistical model, we used the AAO for cases, and the last examination age for controls. Only European Americans with age 60 or older were included. In the ADSP cohort, we included only those subjects whose APOE genotype was consistent between the WES genotype file and the previous APOE genotyping. Finally, the subjects with one or two APOE*4 alleles and those who had 5% or more missing genotypes were removed from the analyses. After this filtering, there were 7,252 subjects (2,113 cases and 5,139controls) in the ADSP dataset and 720 subjects (372 cases and 348 controls) in the PITT-ADRC cohort.
We also used the same genotype filtering in both cohorts. Only the bi-allelic genotypic variants inside the WES region with minor allele frequency (MAF) 0.1% or more were included. We also required a p-value greater than 1E–05 to be considered departure from the Hardy-Weinberg equilibrium. Variants with 5% or more missing data (after the above filters) were removed. There were 61,582 overlapping variants in both datasets and they were included in the individual association analysis.
Principal component analysis
Principal components (PCs) were calculated only from the common variants (MAF > 0.05) passing the QC, as described above. To avoid using highly correlated genetic variants to estimate ethnicity structure of the study cohort from the PCs, a sliding window approach with a window size of 2000 bp shifted every 200 variants was implemented to estimate correlation (r2). Variants with maximum likelihood phasing based r2 > 0.5 were identified and also removed for PCA. The first four PCs were used as covariates in association analyses.
Association analyses
We performed logistic regression to determine the association of sequence variants with AD risk in individual datasets. Two statistical models with different covariate sets were used in the regression. The first model was adjusted for sex and the first four PCs only, and the second model included age in addition to sex and PCs. For age, AAO was used for AD cases, and the last examination age for controls. Issues related to the age adjustment are discussed further in the Results section.
In total, four association analyses were performed: two datasets versus two statistical models. Odds ratios (ORs) with 95% confidence intervals were calculated for each of the four association analyses. The Manhattan plot was generated from the “qqman” package (https://CRAN.R-project.org/package=qqman) in R to summarize the results of association studies. The exome-wide significance threshold was set to be 0.05/number of the tests, which is 0.05/61,582 = 8.12E–07 and the suggestive significance was set to be 1/number of the tests, which is 1/61,582 = 1.62E–05, as suggested by a previous Alzheimer’s disease WES study [8].
Meta-analysis
Meta-analysis was performed to combine the WES results of the same statistical model using METAL [11] by the standard-error based approach. For each genetic variant, the number of non-missing subjects from each study was used as the weight in the meta-analysis. For each meta-analysis result (META-age and META-noage), ORs with 95% confidence intervals were calculated, and the Manhattan plot used to summarize the results. The exome-wide and suggestive association thresholds were p = 8.12E–07 and 1.62E–05, respectively.
Gene-based analysis
We also tested the association between a set of variants with MAF < 0.1% within a gene and AD by using a kernel regression framework with the “SKAT” package [12–16] in R. The optimal unified sequence kernel association test (SKAT-O) was used to allow different directions of effect variants within a gene set. Genes with only one variant were excluded. Bonferroni corrections were applied for multiple testing adjustment. We also performed a summarized p-value gene-based analysis on those variants with minor allele frequency greater than 0.1% using MAGMA [17] in both meta-analysis results (with and without age). The significant p-value was set as 3.51E–06 (0.05 divided by the number of mapped genes).
Functional annotation
SNPs with p-values less than the suggestive significance level (1.62E–05) were used for several different functional analyses.
GTEx-eQTL
SNPs with p-values less than the suggestive significance level in either statistical model were grouped together and checked in the Genotype-Tissue Expression project (GTEx) v7 database. We recorded all eQTLs in the brain and whole blood tissues with p-values less than 1E–03.
Basic demographic of non-APOE*4 carriers in the PITT-ADRC and ADSP samples
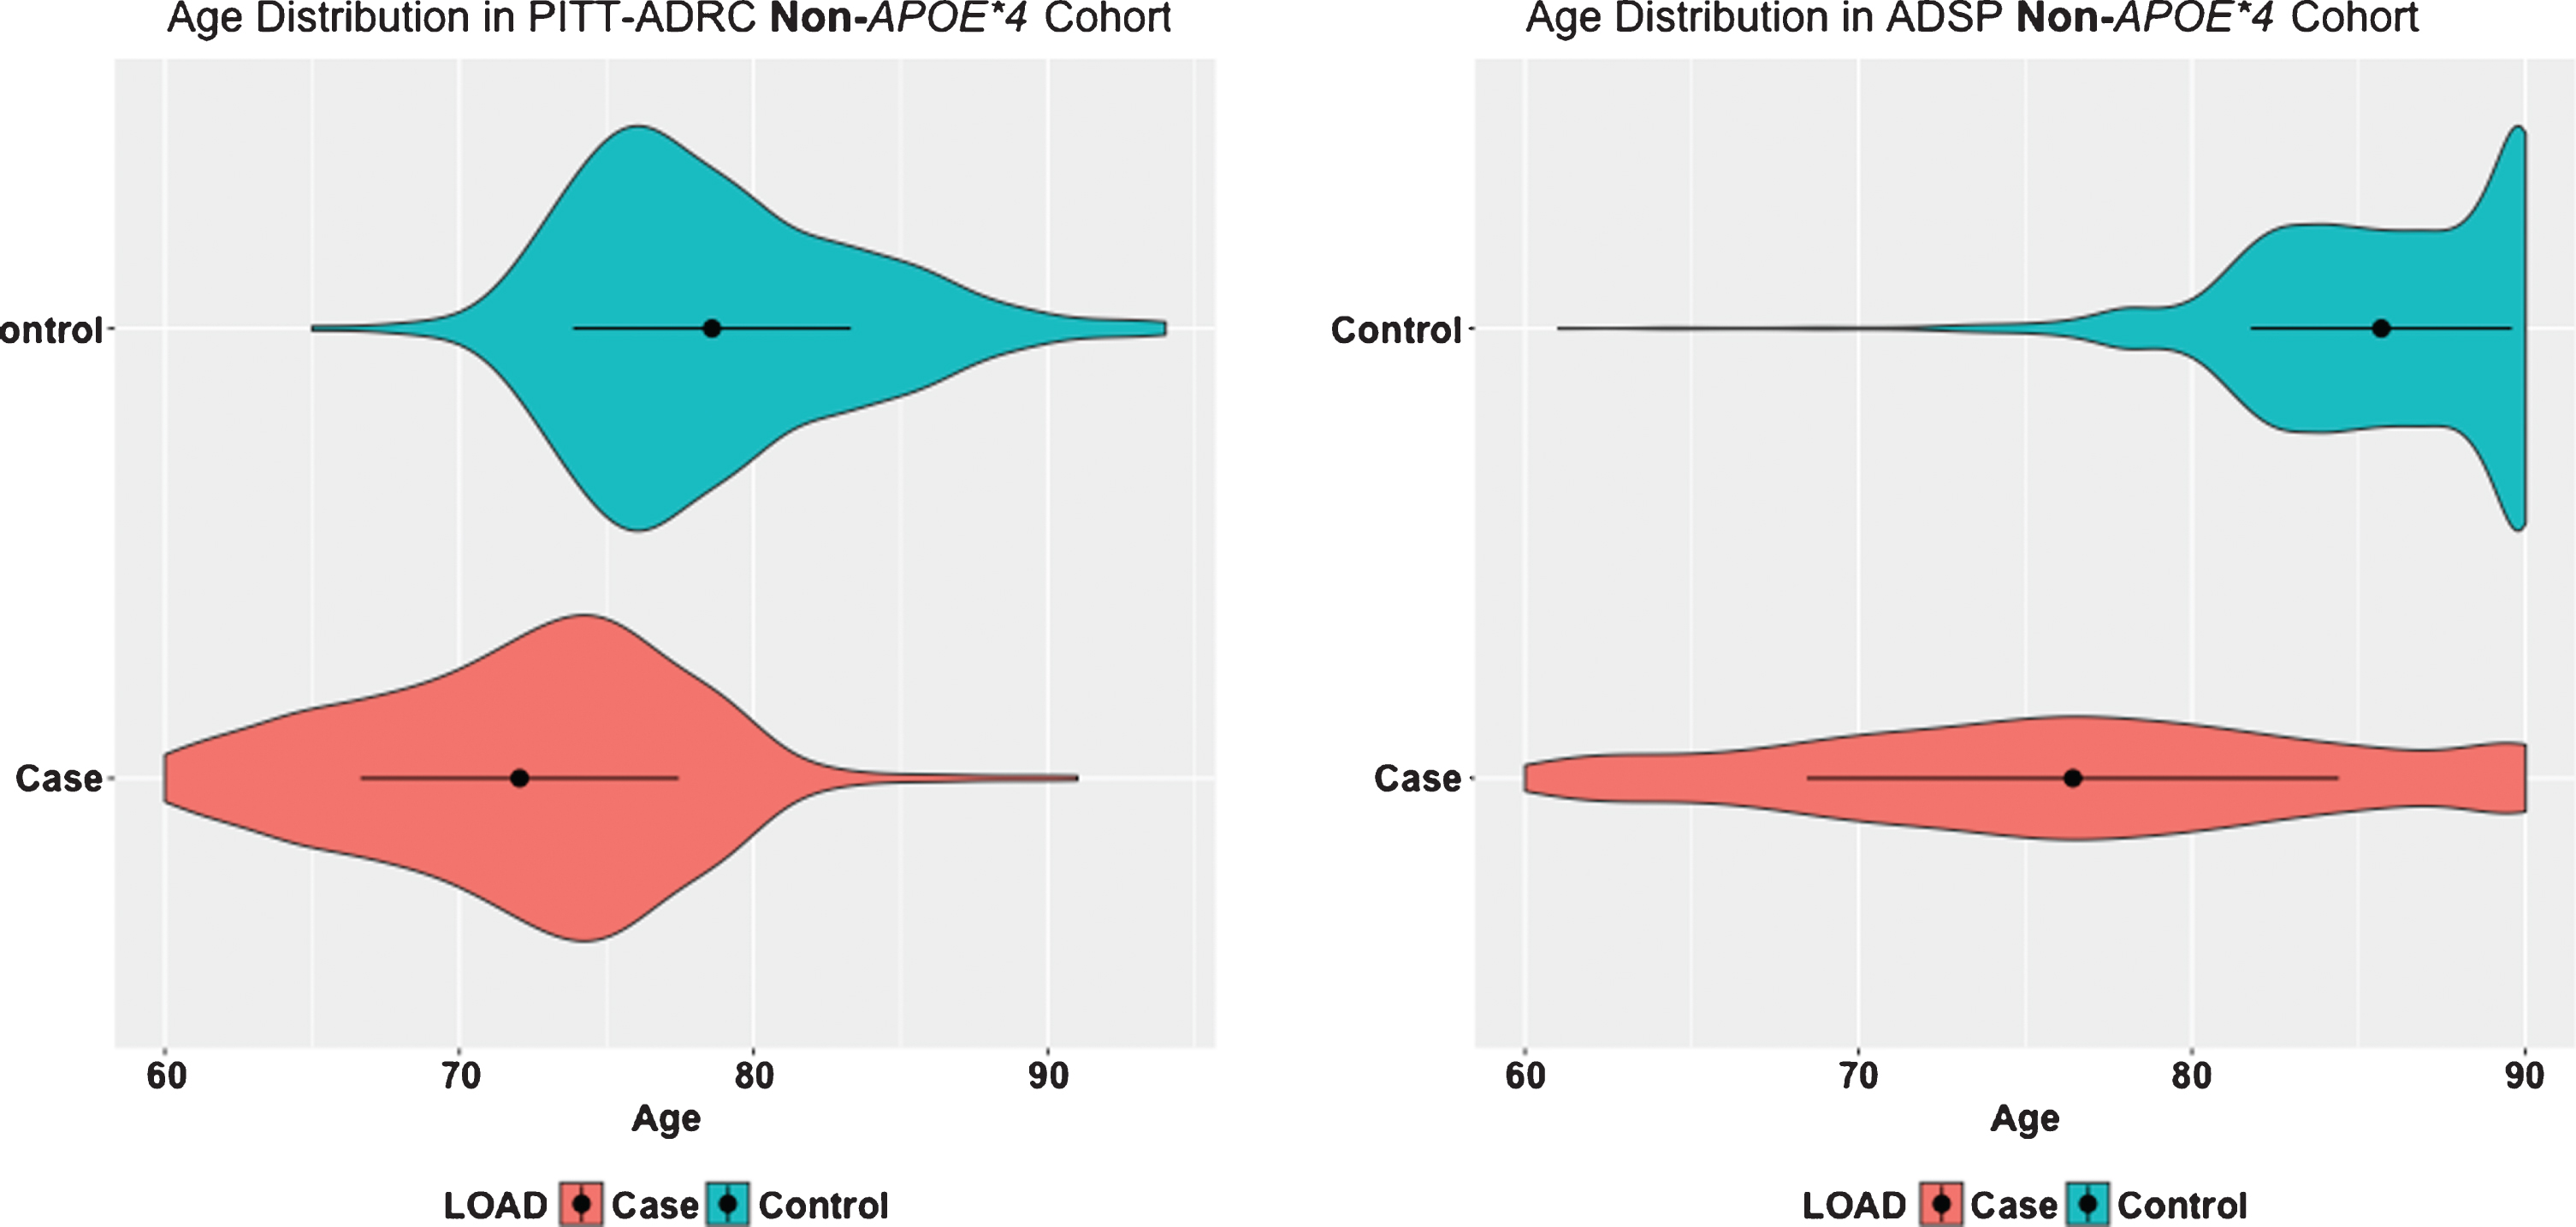
Age distributions between AD cases and controls in PITT-ADRC and ADSP data. The black dots inside the density represent the mean and the bar represent the one standard deviation on the both sides of the mean.
Functional mapping and annotation of genome-wide association studies (FUMA-GWAS)
Meta-analysis results for SNPs present in both ADSP and PITT-ADRC were used in the FUMA (http://fuma.ctglab.nl/) for functional annotation. In addition, SNPs with meta p-value reaching the suggestive significance threshold in either model were grouped together and set as the pre-defined significant SNPs in the SNP to GENE function on the FUMA-GWAS web server. In this analysis, the functional consequences of SNPs on genes were used for gene mapping. A SNP is mapped to a particular gene if this is located within the gene or 1kb upstream of the transcription starting site (TSS) or 1kb downstream of the transcription ending site (TES) of the gene. Finally, the genes successfully mapped to a pre-defined significant SNP were used to: a) explore the tissue-specific expression using the GTEx portal, and b) the gene-set enrichment analysis for the GWAS catalog via the GENE to FUNC function.
RESULTS
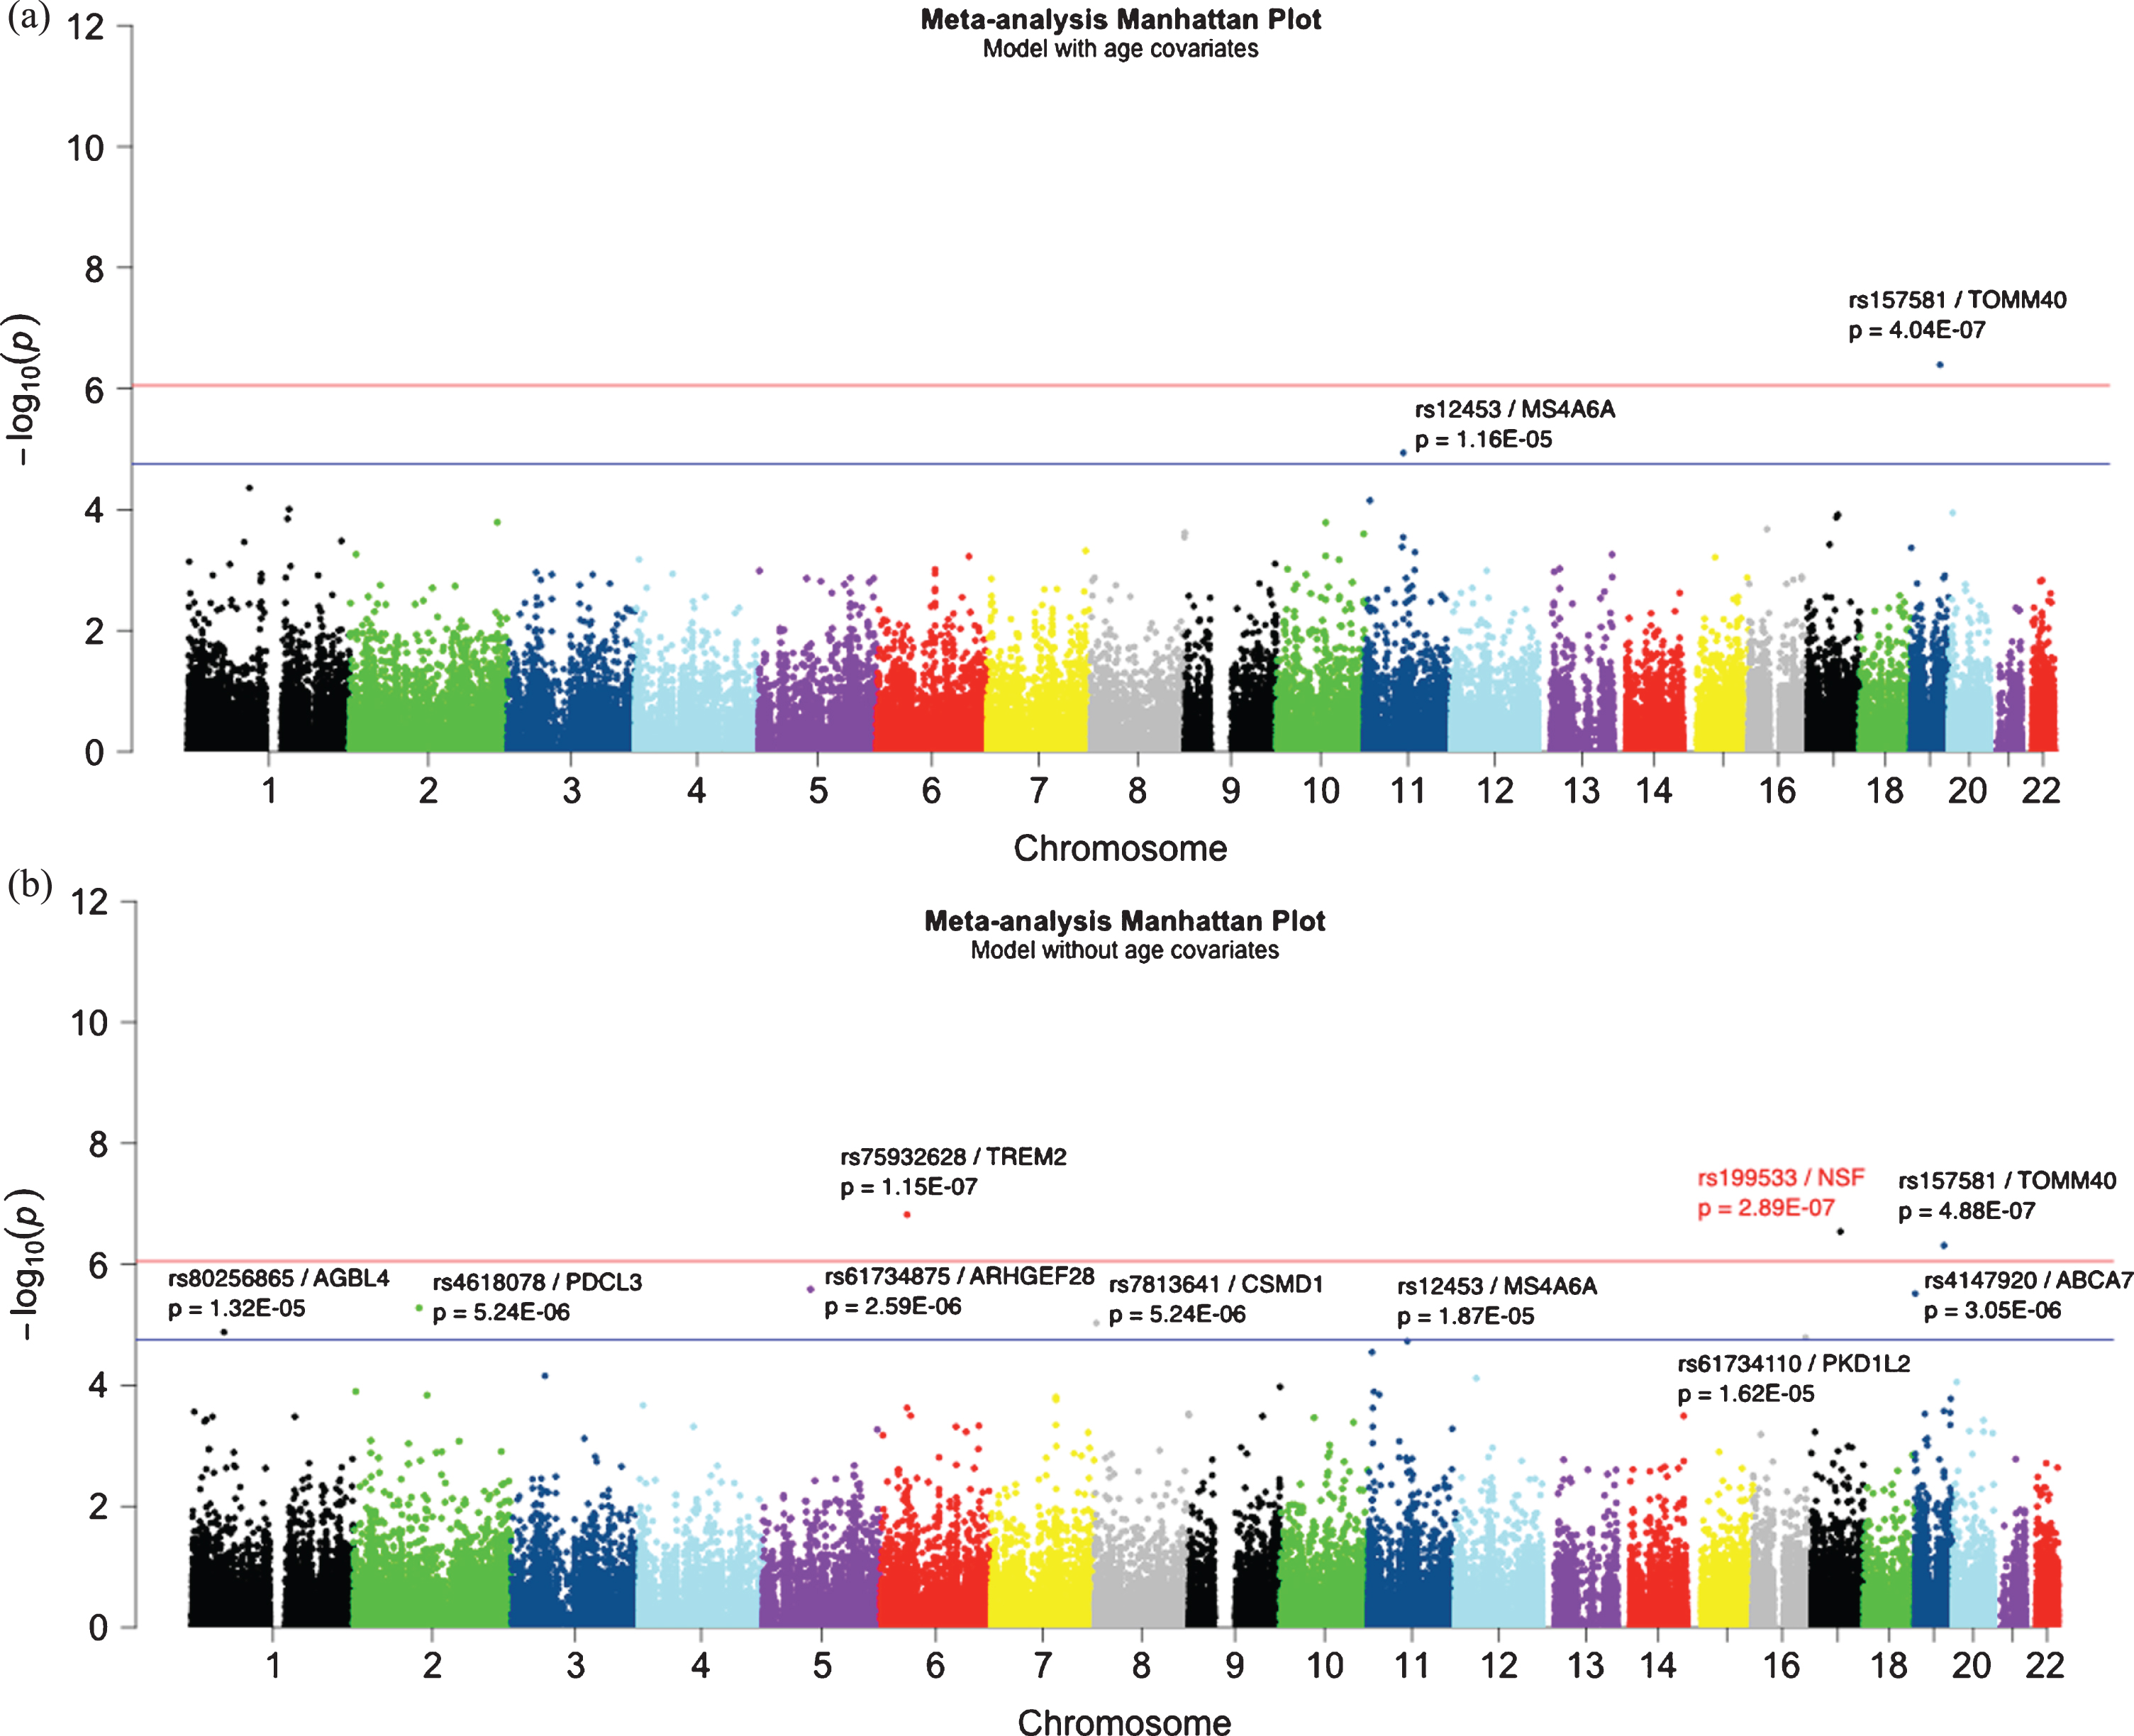
Manhattan plot of meta-analysis (a) with age and (b) without age. There was a total of 56,460 common bi-allelic variants in both studies. The redline represents the exome-wide significant level at 8.12E–07 and the blue line represents the suggestive significant threshold at 1.62E–05. The most significant APOE*2 allele is not shown in the figure (rs4712; age: p = 5.46E–24; no age: p = 7.53E–26).
Study cohort demographics
Table 1 shows descriptive statistics for the PITT-ADRC and ADSP samples. Noteworthy, the age distribution is quite different between AD cases and controls in the ADSP data (t-test p < 2.2E–16; Fig. 1). This age difference in the ADSP sample was by design so that it could enable the identification of both risk and protective variants for AD [8]. Accordingly, AD cases were selected to have relatively early AAO (60 or above) with the likelihood of being more enriched with risk variants. Likewise, controls were selected as old as possible with the expectation that they would be enriched with protective variants. This is a serious modeling challenge, because the age difference acts as a confounder. To address this issue, we performed WES association analysis with and without age in the model as described in the Methods section. In the model without age, we expect that any genetic variant whose distribution changes with age will show an association with case/control status. Even for variants with a true association or causal relationship with AD, the effect will be magnified due to the age difference. Conversely, in the model that includes age, true positive associations may not be detected due to the confounding. Since AD is an age-related phenotype, most previous studies have included age as a covariate. However, given the age distribution in this dataset we feel that it is necessary to carefully interpret results from both models, keeping in mind that the model without age may have significant numbers of false positives, but the model with age may have significant problems with false negatives.
Exome-wide analysis
Following separate WES analyses in each dataset, we performed meta-analysis for overlapping markers present in both datasets with age (META-age) or without age (META-noage) models. Quantile-quantile (QQ) plots and lambda values for the meta-analysis for both models are shown in Supplementary Figure 4 that shows no inflated values in their test statistics. The Manhattan plots are shown in Fig. 2. All SNPs having META p-value less than the suggestive significance threshold are listed in Table 2. The two exome-wide significant (p≤8.12E–07) SNPs showing consistency across the two models are: APOE*2/rs7412 (META-age: OR = 0.40, p = 5.46E–24; META-noage: OR = 0.43, p = 7.53E–26) and TOMM40/rs157581 (META-age: OR = 1.49, p = 4.04E–07; META-noage: OR = 1.39, p = 4.88E–07). TREM2/rs75932682 also showed exome-wide significant in the META-noage model (OR = 3.96, p = 1.51E–07), and MS4A6A/rs12453 in the known MS4A gene region showed suggestive association in both age (OR = 1.22, p = 1.16E–05) and without age (OR = 1.18, p = 1.87E–05) models.
List of the SNPs reaching suggestive significance in the meta-analysis with or without age. The exome-wide and the suggestive threshold are p = 8.12E–07 and p = 1.62E–05, respectively. The bold font of p-value indicates the suggestive significant, and the bold with an asterisk* represents exome-wide significant
One novel exome-wide significant SNP that we found in the META-noage model was NSF/rs199533 (OR = 0.78; p = 2.88E–07) on chromosome 17. The significant SNP is located in exon 19 and caused a G > A nucleotide change, without affecting the amino acid (Lys) change.
In addition, we found six suggestive associations in the ABCA7, ARHGEF28, PDCL3, CSMD1, AGBL4, and PKD1L2 genes (Table 2). All SNPs having META p < 1E–03 are listed in Supplementary Table 3.
Survival analysis on the top SNP
We performed survival analysis on our top NSF/rs199533 SNP in AD cases to examine if age-at-onset of dementia varies among the three genotypes. Cox proportional hazard model was applied, and sex was adjusted as a covariate. The Kaplan-Meier curves are shown in Supplementary Figure 5. Subjects homozygous (AA) for the less common allele had later age-at-onset than subjects homozygous (GG) for the common allele (median age-at-onset: 79.0 versus 76.6; p = 0.044). These results indicate that the NSF/rs199533 A allele is not only a protective against AD risk, its homozygosity also delays the age-at-onset of AD.
Gene-based analysis
In order to look at potential effects of very rare variants (MAF < 0.1%) at the gene level, we performed a SKAT-O analysis on the larger ADSP data. These very rare variants were not included in the above association analyses. A total of 10,243 gene sets were tested and the lowest observed p-value after Bonferroni correction was 0.247 for the KRT3 gene followed by 0.348 for the TTC40 gene. Thus, using a SKAT-O analysis we did not find any gene with rare variants associated with AD in the ADSP non-APOE*4 carrier cohort.
Another gene-based analysis was performed with MAGMA using non-rare variants (MAF≥0.1%) that we used in the META-analysis. A total of 14,232 protein-coding genes were tested, and none of them showed significance in the META-age model with the significance threshold of 3.51E–06 (0.05/14,232). However, the known TREM2 gene reached the significance threshold in the META-noage model (p = 1.04E–07; Supplementary Figure 6). The novel NSF (p = 1.20E–05) and ABCA7 (p = 1.95E–05) genes also achieved the suggestive significance threshold of 7.02E–05(1/14,232) in the META-noage in the meta-analysis (Supplementary Figure 6). Thus, the NSF gene shows evidence of association at both the SNP and gene levels.
Functional annotations
As described in the methods section, the META-age and META-noage results were used as inputs to the SNP to GENE function on the FUMA-GWAS web server for functional annotation. For each model, SNPs with the META p-value reaching the suggestive significance threshold in either model (Table 2) were used as the pre-defined significant SNPs in the annotation input file.
In the META-noage annotation results, the eleven pre-defined SNPs mapped to 24 genes based on the functional consequences of SNPs on genes (see Methods section). These 24 genes were then used in the GENE to FUNC function for GWAS catalog gene-set enrichment analysis.
We also looked at tissue-specific expression of those 24 genes in the GTEx database using FUMA-GWAS. Twenty-one out of 24 genes showed expression in the brain and whole blood in GTEx v6 (out of 53 tissue types), and the gene expression heat-map of 21 genes is shown in Fig. 3. The full gene expression heat-map clustering both tissues and expression levels is shown in Supplementary Figure 7. Both figures show that the NSF gene is highly expressed in all brain tissues, similarly to APOE, MAPT, and TOMM40. Some well-known LOAD-associated genes are highly expressed in only some of the brain tissues; for example, ABCA7 is highly expressed in the cerebellar hemisphere and cerebellum, and MS4A6A is highly expressed in the spinal cord cervical c1 region. The other suggestive genes we identified from the meta-analysis, such as AGBL4, ARHGEF28, and CSMD1, had low expression in the brain regions.
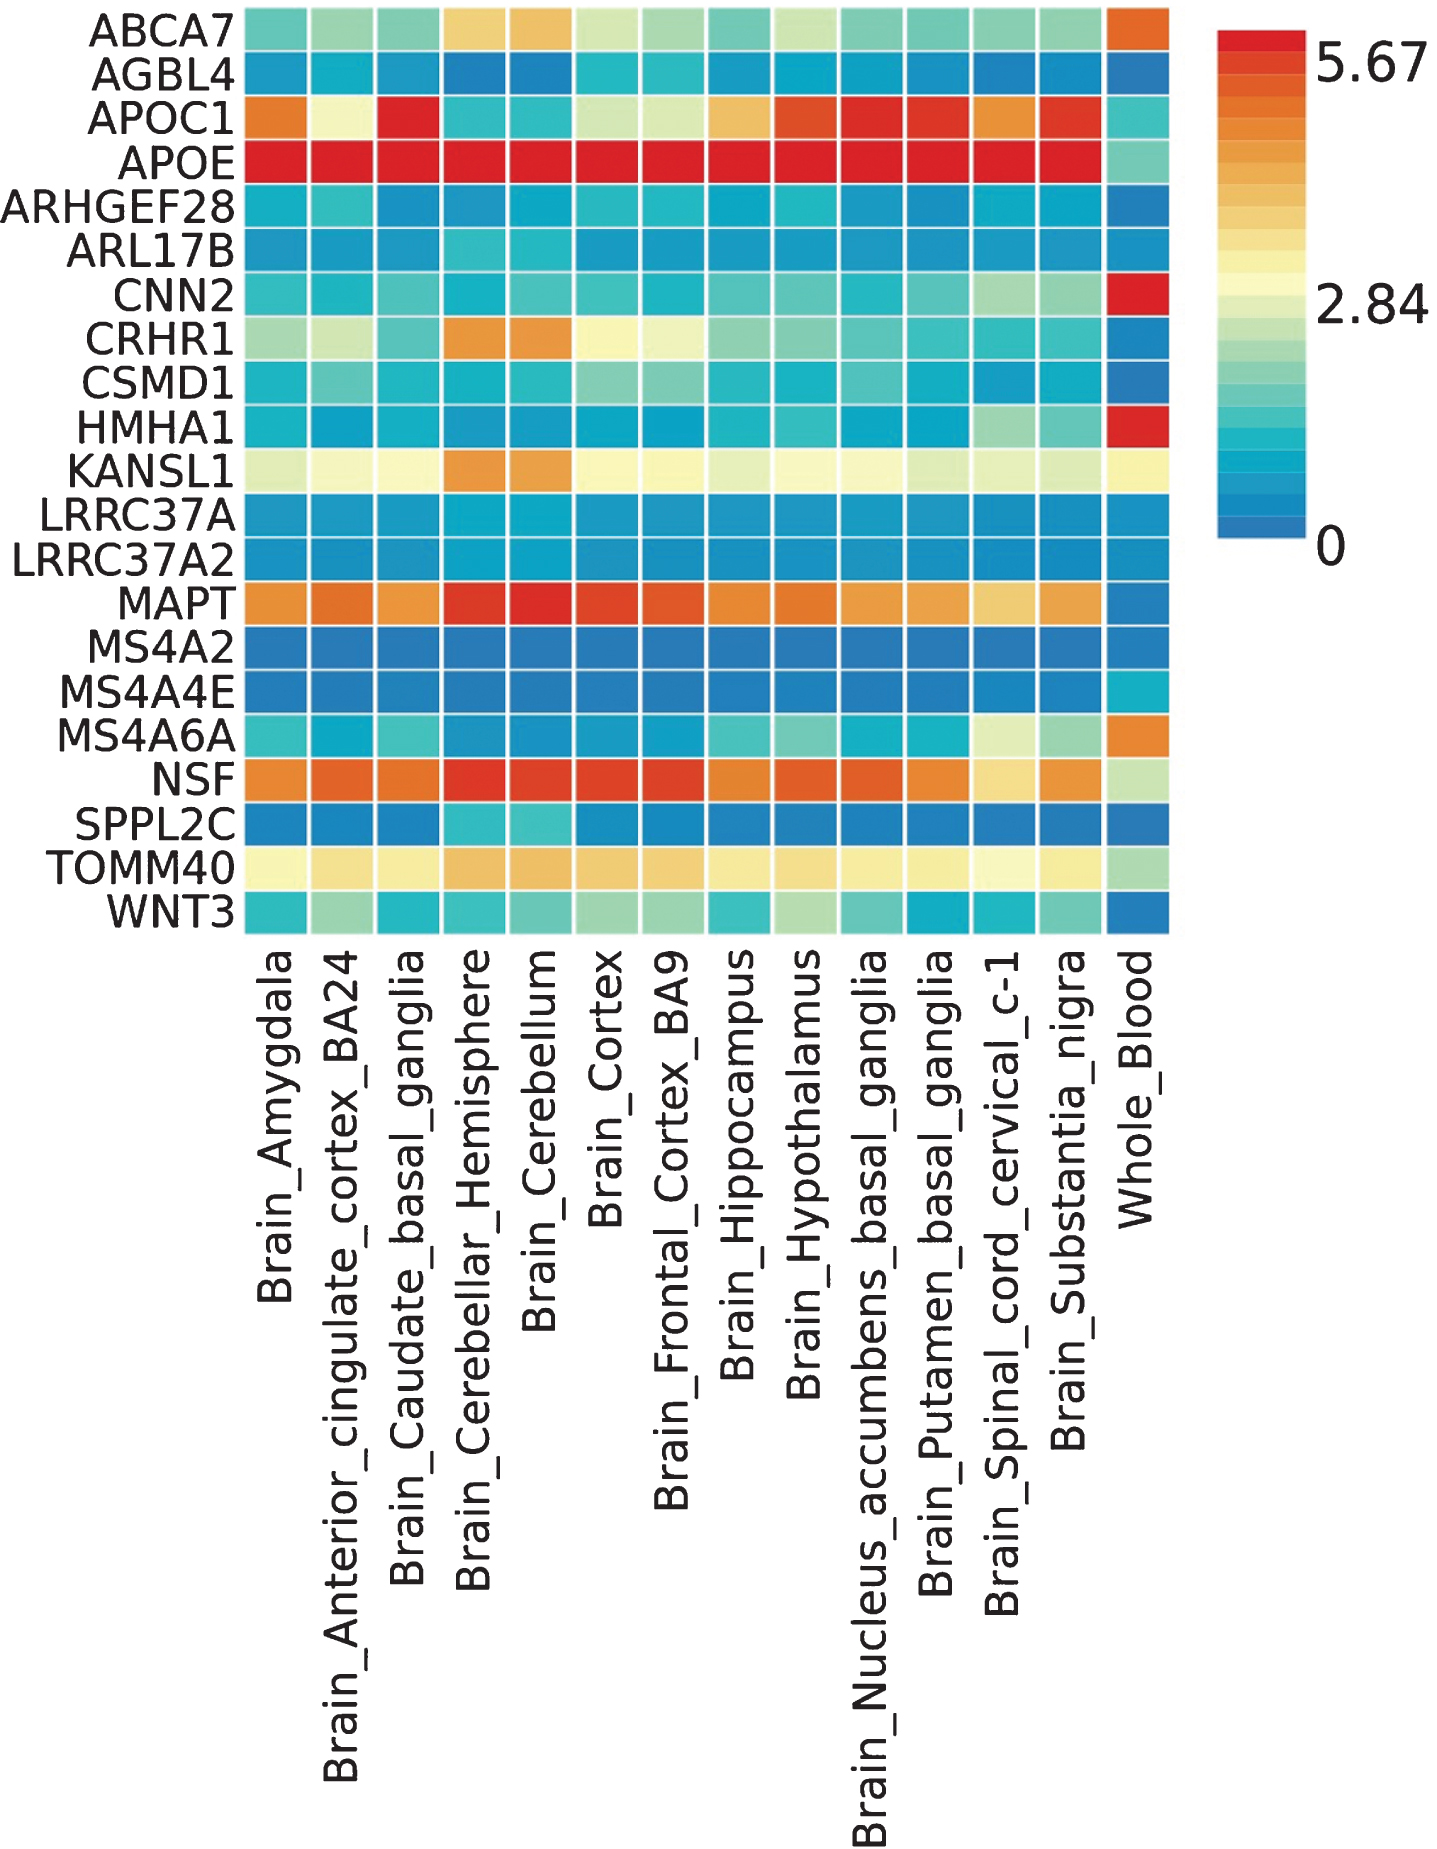
The heat map of the tissue specific gene expression for 21 genes captured in different brain regions and whole blood from Genotype-Tissue Expression project (GTEx) v6 53 tissue types dataset.
Based on GTEx v7 database, NSF/rs199533 SNP was the only genome-wide significant eQTL for multiple neighboring genes in the brain and whole blood (Supplementary Table 4). The top two most significant genes that were affected by NSF/rs199533 in multiple AD-related brain regions as well as in blood are KANSL1-AS1 and LRRC37A2 where p-values ranged from 3.55E–19 to 1.55E-36 in the brain and from 2.32E–30 to 8.89E–75in blood (Table 3).
p-values of the expression quantitative trait locus (eQTL) NSF/rs199533 on expression of KANSL1-AS1 and LRRC37A2 in different brain regions and whole blood
Finally, the GWAS catalog gene-set enrichment analysis was performed with the 24 pre-defined SNP-mapped genes from FUMA. Supplementary Table 5 lists the results of the enrichment analysis. As expected, the first few most significant categories are related to AD as well as other brain/neurological conditions such as Parkinson’s disease (PD), cerebral amyloid deposition (PET imaging), cerebrospinal fluid T-tau, Aβ1–42, and P-tau181p levels. Of note, the NSF gene was only related to the sense of smell and PD, but not related to any known AD category.
DISCUSSION
Age effect on genetic associations
Genetic studies on LOAD usually take age in the statistical model as a covariate since LOAD is a highly age-related disease. Because of extreme age confounding (extreme age difference between cases and controls) in the ADSP dataset, we used models both with and without age adjustment. The common alleles with large effect, such as APOE*2, showed statistical significance whether or not age was in the model. On the other hand, the unbalanced age distributions between the two groups masked some genetic effects of known loci when the age-adjusted model was used. For example, the known associations of TREM2/rs75932628 and ABCA7/rs4147920 were not significant in the meta-analysis with age adjustment; however, they achieved the genome-wide and suggestive thresholds, respectively in the no age adjustment model. Furthermore, some novel associations were also observed using the no age model. Thus, it was appropriate to use a model without age to account for confounding between age and AD status that not only resulted to observe the previously reported established associations but also yielded new associations. We are not saying the age covariate should be removed from the AD genome-wide studies, we only hypothesize that the true genetic association factor was a subset of the union of those top hits from the statistical models with and without age. Unfortunately, we were not able to distinguish true- and false-positive by checking the statistics or the p-values form those outcomes. The interaction between genotypes and age in the statistics model will be necessary to solve this problem, but it does not guarantee solution of unbalanced age distribution between cases and controls.
Genetic association among non-APOE*4 carriers
We performed meta-analysis on a total of 7,972 non-APOE*4 carriers and 56,460 variants from the PITT-ADRC and ADSP cohorts and identified some candidate variants with better statistical power. Among the known AD loci, APOE/rs7412, coding for the APOE*2 allele, was the top hit and exome-wide significant in both age models (p = 5.46E–24 and p = 7.53E–26) followed by TREM2/rs75932628 (Arg47His) in META-noage (p = 1.15E07). ABAC7/rs4147920 (intron-exon junction variant) showed suggestive association in META-noage (p = 3.05E–06). MS4A6A/rs12453 (p.L137L) showed suggestive association in both models (age: p = 1.16E–05; noage: p = 1.87E–05). Previously, MS4 region has also been shown to be genome-wide significant only among non-APOE*4 carriers [18].
Among the novel hits observed in non-APOE*4 carriers, NSF/rs199533(p.K702K) revealed exome-wide significance (p = 2.88E–07), while suggestive associations were observed with ARHEGF28/rs61734875(p.A1098A; p = 2.59E–06), PDCL3/rs4618078(p.P215P; p = 5.24E–06), CSMD1/rs7813641 (intron-exon junction; p = 9.34E–06), AGBL4/rs80256865 (intron-exon junction; p = 1.32E–05), and PKD1L2/rs61734110 (p.I506V; p = 1.62E–05).
NSF/rs199533
NSF is located in the chromosome 17q21.31 region that has previously been implicated with AD risk among non-APOE*4 carriers [18], where a genome-wide significant (GWS) signal was identified (rs2732703) between the KANSL1 and LRRC37A genes, which is about 200 kb downstream from the MAPT gene that codes for the microtubule-associated protein tau found in AD neurofibrillary tangles. However, conditional analysis excluded the involvement of the MAPT gene or another gene distal to LRRC37A. In our study, the top signal (rs199533) is located in the coding region of the NSF gene that is downstream from the LRRC37A gene. We were unable to check linkage disequilibrium between our top SNP and the reported GWS SNP (rs2732703), as the latter was imputed and thus not present in 1000 Genomes. But another reported GWS SNP for AD (rs2668626, p = 4.83E–08) that is only 47 bp from
NSF/rs2732703 and is a 1000 Genome variant, had r2 = 0.79 with our top signal. This indicates that NSF/rs199533 may be a functional variant or is an eQTL for other genes in this region. Noteworthy, NSF/rs199533 was found to be the most significant cis-eQTL for two adjacent genes in different AD-relevant brain tissues and whole blood, including KANSL1 antisense RNA 1 (KANSL1-AS1) and leucine rich repeat containing 37-member A2 (LRRC37A2) (see Table 3). While these two genes are ubiquitously expressed in multiple tissues, including the brain, their overall brain expression is low compared to other tissues and there is not much data available on their functions.
On the other hand, NSF expression in the brain is highest relative to other tissues, including those brain regions implicated in AD— hippocampus and cortex [19]. NSF (N-ethylmaleimide sensitive factor) is a highly conserved protein belonging to the ATPases associated with various cellular activities and is a key component of intracellular membrane traffic [20]. A missense mutation in NSF has been found to cause abnormal Golgi morphology [21]. NSF in the 17q21.31 region has been suggested to be the most likely candidate gene responsible for learning disability [22]. Interestingly, GWAS have also implicated chromosome 17q21.31 region with the risk of PD where NSF/rs199533 was one of the earlier GWS variants for PD [23]. Whereas the minor allele of NSF/rs199533 is protective in AD (OR = 0.80), it was a risk factor in PD (OR = 1.28; p = 1.09E–14). It is interesting to see a PD risk factor acting as a protective allele in AD, although some PD cases also develop dementia. The apparent opposite effect of the same variant in two late-onset neurodegenerative disease suggest a possible cascade-dependent mechanism. While PD first affects the movement and coordination and then the memory in the later stage, AD affects the memory first and then maybe some of the motor functions in the advanced stage [24]. Further in-depth genetic and functional studies of the NSF locus at 17q21.31 may shed more light on its role in the etiology of AD and PD.
In conclusion, our WES study on non-APOE*4 carriers identified a novel signal in the NSF gene, which is a cis-eQTL for multiple genes in the brain and blood. Further characterization of genes that are affected by NSF/rs199533 may help to shed light on the roles of these genes in AD etiology. Although our combined WES sample of ∼8,000 subjects from two cohorts was relatively large and uniquely suitable to find associations that may potentially be suppressed in the presence of APOE*4, this may not have enough power to detect coding variants with small effect sizes. We also highlight the potential pitfall of using age as a covariate in case-control studies where the unbalanced age distributions between the two groups may mask some genetic associations. The ADGC cohorts include: Adult Changes in Thought (ACT), the Alzheimer’s Disease Centers (ADC), the Chicago Health and Aging Project (CHAP), the Memory and Aging Project (MAP), Mayo Clinic (MAYO), Mayo Parkinson’s Disease controls, University of Miami, the Multi-Institutional Research in Alzheimer’s Genetic Epidemiology Study (MIRAGE), the National Cell Repository for Alzheimer’s Disease (NCRAD), the National Institute on Aging Late Onset Alzheimer’s Disease Family Study (NIA-LOAD), the Religious Orders Study (ROS), the Texas Alzheimer’s Research and Care Consortium (TARC), Vanderbilt University/Case Western Reserve University (VAN/CWRU), the Washington Heights-Inwood Columbia Aging Project (WHICAP) and the Washington University Sequencing Project (WUSP), the Columbia University Hispanic- Estudio Familiar de Influencia Genetica de Alzheimer (EFIGA), the University of Toronto (UT), and Genetic Differences (GD).
The CHARGE cohorts are supported in part by National Heart, Lung, and Blood Institute (NHLBI) infrastructure grant HL105756 (Psaty), RC2HL102419 (Boerwinkle) and the neurology working group is supported by the National Institute on Aging (NIA) R01 grant AG033193. The CHARGE cohorts participating in the ADSP include the following: Austrian Stroke Prevention Study (ASPS), ASPS-Family study, and the Prospective Dementia Registry-Austria (ASPS/PRODEM-Aus), the Atherosclerosis Risk in Communities (ARIC) Study, the Cardiovascular Health Study (CHS), the Erasmus Rucphen Family Study (ERF), the Framingham Heart Study (FHS), and the Rotterdam Study (RS). ASPS is funded by the Austrian Science Fond (FWF) grant number P20545-P05 and P13180 and the Medical University of Graz. The ASPS-Fam is funded by the Austrian Science Fund (FWF) project I904), the EU Joint Programme - Neurodegenerative Disease Research (JPND) in frame of the BRIDGET project (Austria, Ministry of Science) and the Medical University of Graz and the Steiermärkische Krankenanstalten Gesellschaft. PRODEM-Austria is supported by the Austrian Research Promotion agency (FFG) (Project No. 827462) and by the Austrian National Bank (Anniversary Fund, project 15435. ARIC research is carried out as a collaborative study supported by NHLBI contracts (HHSN268201100005C, HHSN-268201100006C, HHSN268201100007C, HHSN2-68201100008C, HHSN268201100009C, HHSN-268201100010C, HHSN268201100011C, and HH-SN268201100012C). Neurocognitive data in ARIC is collected by U01 2U01HL096812, 2U01HL-096814, 2U01HL096899, 2U01HL096902, 2U01H-L096917 from the NIH (NHLBI, NINDS, NIA and NIDCD), and with previous brain MRI examinations funded by R01-HL70825 from the NHLBI. CHS research was supported by contracts HHSN268201200036C, HHSN268200800007C, N01HC55222, N01HC85079, N01HC85080, N01HC85081, N01HC85082, N01HC85083, N01HC85086, and grants U01HL080295 and U01HL130114 from the NHLBI with additional contribution from the National Institute of Neurological Disorders and Stroke (NINDS). Additional support was provided by R01AG023629, R01AG15928, and R01AG20098 from the NIA. FHS research is supported by NHLBI contracts N01-HC-25195 and HHSN268201500001I. This study was also supported by additional grants from the NIA (R01s AG054076, AG049607 and AG033040 and NINDS (R01 NS017950). The ERF study as a part of EUROSPAN (European Special Populations Research Network) was supported by European Commission FP6 STRP grant number 018947 (LSHG-CT-2006-01947) and also received funding from the European Community’s Seventh Framework Programme (FP7/2007-2013)/grant agreement HEALTH-F4-2007-201413 by the European Commission under the programme “Quality of Life and Management of the Living Resources” of 5th Framework Programme (no. QLG2-CT-2002-01254). High-throughput analysis of the ERF data was supported by a joint grant from the Netherlands Organization for Scientific Research and the Russian Foundation for Basic Research (NWO-RFBR 047.017.043). The Rotterdam Study is funded by Erasmus Medical Center and Erasmus University, Rotterdam, the Netherlands Organization for Health Research and Development (ZonMw), the Research Institute for Diseases in the Elderly (RIDE), the Ministry of Education, Culture and Science, the Ministry for Health, Welfare and Sports, the European Commission (DG XII), and the municipality of Rotterdam. Genetic data sets are also supported by the Netherlands Organization of Scientific Research NWO Investments (175.010.2005.011, 911-03-012), the Genetic Laboratory of the Department of Internal Medicine, Erasmus MC, the Research Institute for Diseases in the Elderly (014-93-015; RIDE2), and the Netherlands Genomics Initiative (NGI)/Netherlands Organization for Scientific Research (NWO) Netherlands Consortium for Healthy Aging (NCHA), project 050-060-810. All studies are grateful to their participants, faculty and staff. The content of these manuscripts is solely the responsibility of the authors and does not necessarily represent the official views of the National Institutes of Health or the U.S. Department of Health and Human Services.
The four LSACs are: the Human Genome Sequencing Center at the Baylor College of Medicine (U54 HG003273), the Broad Institute Genome Center (U54HG003067), The American Genome Center at the Uniformed Services University of the Health Sciences (U01AG057659), and the Washington University Genome Institute (U54HG003079).
Biological samples and associated phenotypic data used in primary data analyses were stored at Study Investigators institutions, and at the National Cell Repository for Alzheimer’s Disease (NCRAD, U24AG021886) at Indiana University funded by NIA. Associated Phenotypic Data used in primary and secondary data analyses were provided by Study Investigators, the NIA funded Alzheimer’s Disease Centers (ADCs), and the National Alzheimer’s Coordinating Center (NACC, U01AG016976) and the National Institute on Aging Genetics of Alzheimer’s Disease Data Storage Site (NIAGADS, U24AG041689) at the University of Pennsylvania, funded by NIA, and at the Database for Genotypes and Phenotypes (dbGaP) funded by NIH. This research was supported in part by the Intramural Research Program of the National Institutes of Health, National Library of Medicine. Contributors to the Genetic Analysis Data included Study Investigators on projects that were individually funded by NIA, and other NIH institutes, and by private U.S. organizations, or foreign governmental or nongovernmental organizations.
Authors’ disclosures available online (https://www.j-alz.com/manuscript-disclosures/20-0037r2).
Footnotes
ACKNOWLEDGMENTS
The study was supported in part by NIH grants AG041718, AG030653, AG064877, AG005133, AG023651, and AG07562. The Alzheimer’s Disease Sequencing Project (ADSP) is comprised of two Alzheimer’s Disease (AD) genetics consortia and three National Human Genome Research Institute (NHGRI) funded Large Scale Sequencing and Analysis Centers (LSAC). The two AD genetics consortia are the Alzheimer’s Disease Genetics Consortium (ADGC) funded by NIA (U01 AG032984), and the Cohorts for Heart and Aging Research in Genomic Epidemiology (CHARGE) funded by NIA (R01 AG033193), the National Heart, Lung, and Blood Institute (NHLBI), other National Institute of Health (NIH) institutes and other foreign governmental and non-governmental organizations. The Discovery Phase analysis of sequence data is supported through UF1AG047133 (to Drs. Schellenberg, Farrer, Pericak-Vance, Mayeux, and Haines); U01AG049505 to Dr. Seshadri; U01AG049506 to Dr. Boerwinkle; U01AG049507 to Dr. Wijsman; and U01AG049508 to Dr. Goate and the Discovery Extension Phase analysis is supported through U01AG052411 to Dr. Goate, U01AG052410 to Dr. Pericak-Vance and U01 AG052409 to Drs. Seshadri and Fornage. Data generation and harmonization in the Follow-up Phases is supported by U54AG052427 (to Drs. Schellenberg and Wang).