
Abstract
Background:
Alzheimer’s disease (AD) pathological hallmarks were found in retinas of AD patients. Several studies showed a significant reduction of neuro-retina thickness measured through optical coherence tomography (OCT) in AD patients, but possible correlations between retina morphology, cognition, and cerebrospinal fluid (CSF) AD biomarkers (Aβ 42, t-tau, and p-tau) have been poorly investigated so far.
Objective:
In the present cross-sectional study, we measured the thickness of neuro-retinal layers through OCT searching for possible correlations with patients’ cognitive performances and CSF AD biomarkers.
Methods:
137 consecutive subjects [43 with AD, and 57 healthy controls (HC)], received an OCT scan acquisition to measure the peripapillary retinal nerve fiber layer (RNFL) thickness. In a subsample of 21 AD, 18 MCI, and 18 HC, the macular volume of ganglion cell layer (GCL), inner plexiform layer (IPL), and inner nuclear layer was computed. A comprehensive neuropsychological assessment and CSF AD biomarkers’ concentrations were available in AD and MCI patients.
Results:
Peripapillary RNFL, global, and in superior quadrant was significantly thinner in AD and MCI patients when compared to HC, while macular GCL volume was significantly reduced only in AD. RNFL thickness in nasal and inferior quadrants was correlated with single CSF AD biomarker concentrations, but no differences were found in retina morphology depending on the presence of a CSF profile typical for AD. Memory performances were positively associated with GCL and IPL volume.
Conclusion:
Our findings might propose OCT as a reliable and easy to handle tool able to detect neuro-retinal atrophy in AD in relation with cognitive performances.
Keywords
INTRODUCTION
Alzheimer’s disease (AD), the leading cause of dementia, represents one of the most difficult challenges the Scientific Community has to face in the Third Millennium. Several studies have been recently focusing on retina as a possible provider of objective and easily accessible biomarkers to support AD diagnosis, even at the earlier disease stages, given the strong embryological, structural, and functional similarities between brain and eye [1, 2]. Even though some studies showed no AD pathological hallmarks (i.e., amyloid-β protein aggregates and neurofibrillary tangles) in postmortem retinas of patients diagnosed with AD [3, 4], others found both amyloid plaques and tau deposits [5 –7] as well as degeneration of retinal ganglion cells (RGC) [8, 9] in retinas of AD patients. Optical coherence tomography (OCT) provides easily reproducible and high resolution cross-sectional imaging of human retina and automated measurements of retinal layers’ thickness, thus constituting a potentially useful tool to detect retinal thinning due to degeneration occurring in AD [10]. Previous OCT findings in the field are controversial, since some studies showed that the neuro-retina thickness is reduced in AD and mild cognitive impairment (MCI) patients when compared to healthy subjects [11 –13], while others found no differences [14, 15]. However, recent reviews [10, 16] and meta-analyses [17, 18] on the topic confirmed a clear link between retinal and cerebral changes in AD, demonstrating a significant reduction of both the peripapillary retinal nerve fiber layer (RNFL) thickness and the macular volume in AD patients. Nonetheless, correlations between neuro-retina morphology and other well validated and worldwide adopted in vivo biomarkers of AD, such as cerebrospinal fluid (CSF) biomarkers have been poorly investigated so far. Moreover, correlations between neuro-retina morphology and cognition have to be thoroughly investigated to prompt neuro-retina as an objective and reliable neurodegeneration marker, capable to mirror the disease severity in AD. In the present study we measured peripapillary RNFL thickness and macular ganglion cell layer (GCL), inner plexiform layer (IPL), and inner nuclear layer (INL) volume in a sample of AD and MCI patients (for whom CSF AD biomarkers were available as well) and healthy controls (HC), with no evidence of cognitive impairment, sharing a similar age distribution. We searched for possible differences in measurements of any OCT parameter among the different groups, considering both the clinical diagnosis and the CSF profile (suggestive or not for an underlying AD pathology). We then investigated possible correlations between OCT measurements and AD and MCI patients’ cognitive status, assessed through a well standardized in-depth neuropsychological evaluation investigating all the cognitive domains mostly involved in AD.
MATERIALS AND METHODS
Participants
We involved 145 consecutive subjects in this study (49 AD, 39 MCI, 57 HC), recruited at Neurological Department of San Raffaele Scientific Institute from September 2011 to May 2017. Inclusion criteria were: 1) clinical diagnosis of AD or MCI, according to the current diagnostic criteria [19, 20] which consider CSF AD biomarkers as supportive but not mandatory for the final diagnosis; 2) report of no cognitive deficits and complete autonomy in ADL (Activities of Daily Living) and IADL (Instrumental Activities of Daily Living) for HC, mainly enrolled among patients’ caregivers or spouses; 3) written informed consent as approved by our Institutional Ethics Committee, specific for this study. Exclusion criteria were: 1) presence of other psychiatric or medical conditions (i.e., major depressive disorder, obstructive sleep apnea, vitamin deficiency, brain neoplasms, CNS infections, or inflammatory diseases) which may account for cognitive deficits in AD and MCI patients; 2) history or presence of severe myopia (more than 6 diopters), glaucoma, pseudo-exfoliation syndrome, optic disc anomaly, age-related macular degeneration, Raynaud phenomenon, optic neuropathy, concomitant use of corticosteroid medications; 3) patients’ refusal to undergo the examination or withdrawal of the informed consent. After revision of inclusion and exclusion criteria, we finally included in the study 137 patients (43 AD, 37 MCI, 57 HC).
Optical coherence tomography
We performed OCT using a Heidelberg Spectralis-OCT (Heidelberg Engineering, Germany). Peripapillary RNFL was measured on a standard 3.5Ømm circle scan protocol centered on the optic disc by the scanning technician. For each RNFL, 1536 A-scans were acquired with an ART value (number of averaged scans) of 100. Global (RNFL G), superior (RNFL sup, 45–135°), temporal (RNFL temp, 135–225°), inferior (RNFL inf, 225–315°), and nasal quadrant (RNFL nas, 315–45°) RNFL thickness (expressed in μm) was automatically measured through the pre-installed software provided by the manufacturer. Macular GCL, IPL, and INL volume was calculated using either the “Fast Macular Volume” or “Posterior Pole” scanning protocols. For each macular scan, 31 B-scans (each consisting of 1024 A-scans) were acquired with ART ranging from 9 to 25. GCL, IPL, and INL were automatically segmented to calculate their overall volume (expressed in mm3) within the 6Ømm Early Treatment Diabetic Retinopathy Study (ETDRS) grid [21] centered on the fovea. Since the automatic software for macular segmentation was available some years after the study started, we measured macular layers’ volume only in a sub-sample of patients (“macula” subsample). All scans were checked according to the OSCAR-IB Consensus Criteria [22] and manually corrected by one of the authors (SH), blinded to the subjects’ clinical diagnosis, for clear segmentation errors, where necessary. In Fig. 1, we showed representative OCT scans acquired from 1 HC, 1 MCI, and 1 AD to measure RNFL thickness and GCL volume.
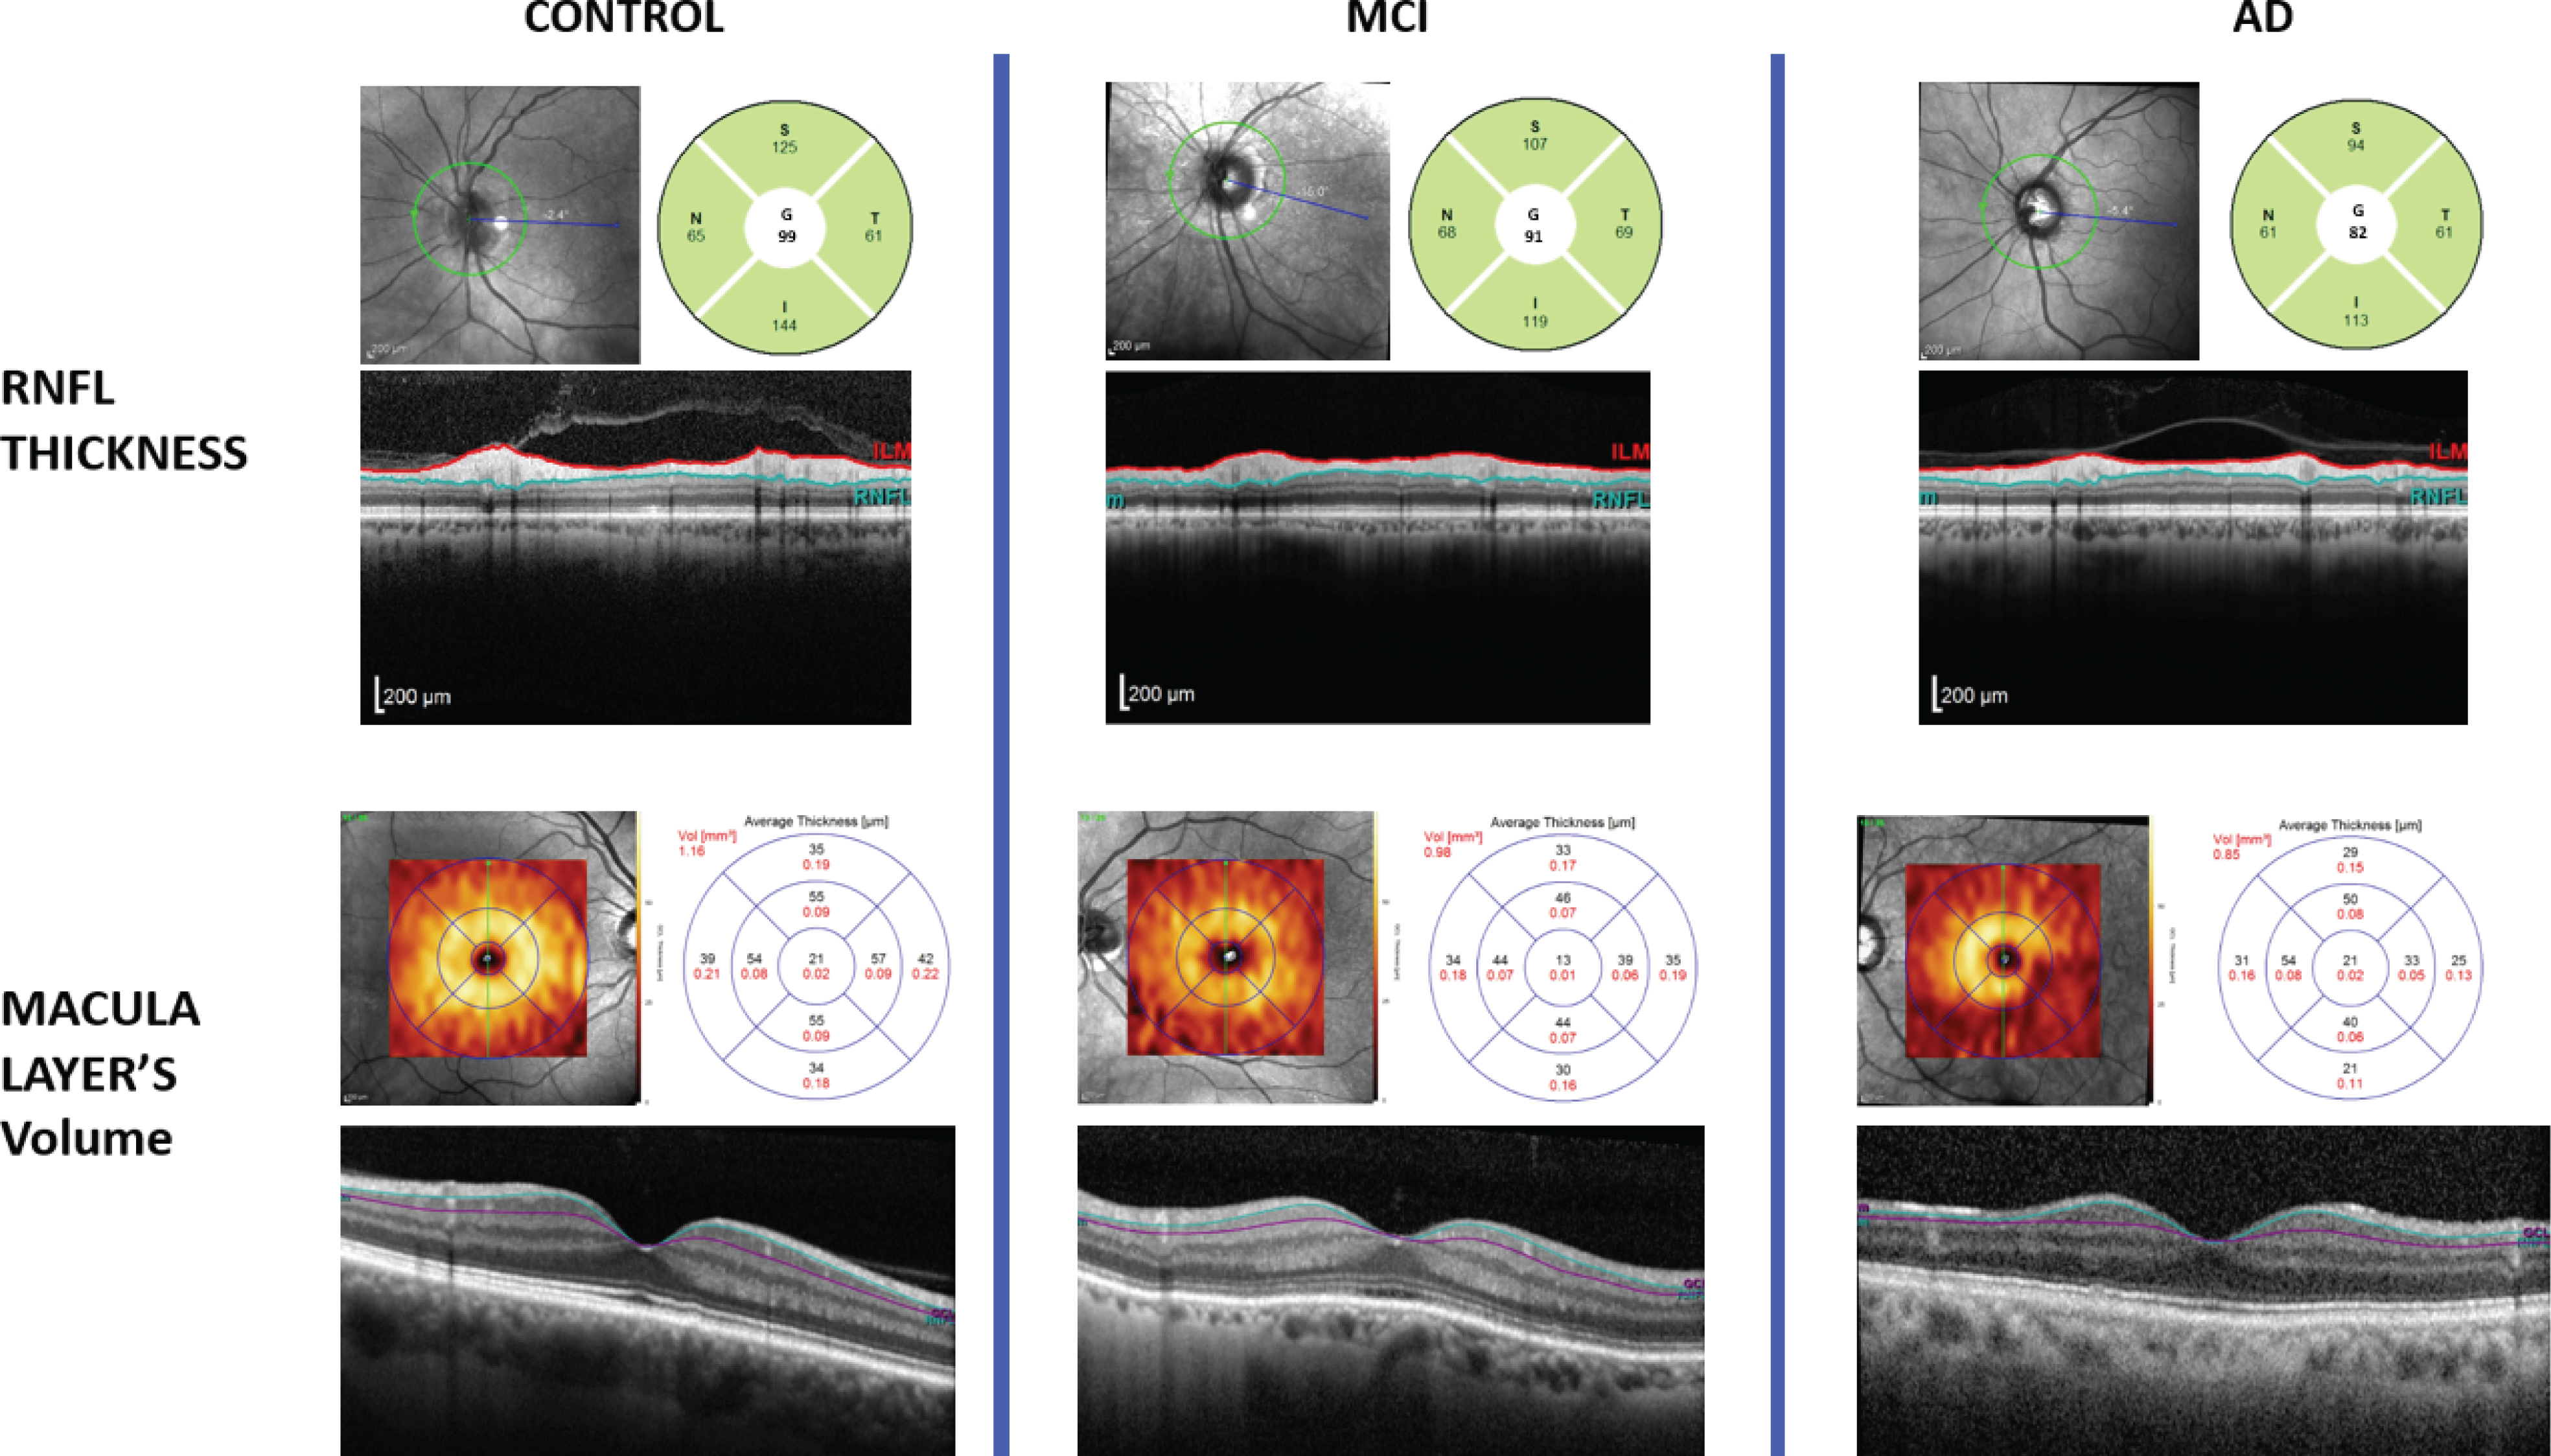
Representative figure showing example OCT scans obtained from one HC (left), one MCI (middle), and one AD (right). We showed scans to automatically measure both peripapillary RNFL (on the top) and macular GCL (on the bottom): on the top left angle the “fundus oculi” image with the retinal area to be considered; on the bottom the high resolution image of the retina with the segmented layer of interest; on the top right angle the values automatically measured for RNFL thickness (using the standard 3.5Ømm circle scan protocol) and macular GCL volume (within the 6Ømm ETDRS grid).
Cerebrospinal fluid acquisition and analysis
CSF analysis was available for diagnostic and research purposes in AD and MCI patients, to measure concentrations of the AD CSF biomarkers, i.e., the 42 amino-acidic isoform of amyloid (Aβ 42), total tau (t-tau), and tau phosphorylated at position threonine 181 (p-tau). Measurements were performed in the local laboratory (LABORAF, San Raffaele Hospital, Milan, Italy), using commercially available ELISA kits (Innogenetics®, Gent,Belgium). For each CSF biomarker, according to the main literature on the topic [23, 24], we defined the following normal values: Aβ 42≥500 ng/l; t-tau≤350 ng/l; p-tau≤60 ng/l. We considered either a p-tau/Aβ 42 ratio >0.12 [25] or a t-tau/Aβ 42 ratio >0.50 [24] as suggestive for an underlying AD pathology. CSF biomarkers’ concentrations were expressed in nanograms per liter. CSF findings were considered as supportive and not as “core” features for the clinical diagnosis of AD and MCI.
Neuropsychological assessment
We evaluated AD and MCI patients’ global cognitive status using general disease severity indices such as MMSE (Mini-Mental State Examination) [26], CDR (Clinical Dementia Rating), and CDR-sb (Clinical Dementia Rating-sum of boxes) [27]. To assess the core cognitive domains of AD and MCI patients, we used the Italian version of the following neuropsychological tests: 1) for memory domain: Rey auditory Verbal Learning Test-immediate (RAVLT-I) and delayed recall (RAVLT-D) [28]; California Verbal Learning Test-immediate (CVLT-I) and delayed (CVLT-D) recall and recognition (CVLT-Rec) [29, 30]; Story Recall (SR) [31] and Rey–Osterrieth Complex Figure recall (RFR) [31]; 2) for attentive-executive functions: Attentive Matrices (AM) [32]; Trail Making Test A, B and B-A (TMTa, TMTb, and TMT b-a) [33]; 3) for language domain: Token Test (TT) [32]; Phonemic and Semantic Verbal Fluency (PVF and SVF) [31]; 4) for visuo-spatial abilities: Rey–Osterrieth Complex Figure copy (RFC) [31] and Clock Drawing Test (CDT) [34]; 5) for reasoning: Raven’s Colored Progressive Matrices (CPM) [35]. For all the cognitive tests, we considered the “adjusted scores” computed according to the published standardized corrections for age, gender, and education [26 , 31–35]. For memory, attentive-executive functions and language, overall Z scores were computed by averaging the single Z scores of the relative tests, depending on the reference population values.
Statistical analysis
After revision of the inclusion and exclusion criteria, scans of both eyes were not available for all the subjects. When OCT scans were available for both eyes, we randomly selected one eye, to avoid underestimation of the true variance which can determine an increased risk of a Type 1 error, since the intra-individual variance between eyes is usually lower than that between subjects [36]. Depending on the distribution of our data, we used either Mann Whitney U test or Student’s T-Test for comparisons between two independent groups and Kruskal Wallis H test or one-way ANOVA for comparisons between more than two independent groups. If a statistically significant difference was present between two or more groups, post hoc pairwise comparisons were performed (Dunn’s procedure with a Bonferroni correction for multiple comparisons in case of data not normally distributed; either Tukey-Kramer or Games-Howell post hoc analyses, after checking for homogeneity of variances by Levene’s test, in case of data normally distributed). A one-way ANCOVA with sex and age as covariates was then run to check if these differences still remained after adjusting for age and sex. We used linear regression models to search for correlations between demographics (age, sex, and education), CSF parameters, RNFL thickness and macular volumes. Either non-parametric Spearman’s ρ (rho) or parametric Pearson’s r were instead adopted to correlate OCT parameters and neuropsychological “adjusted scores”. Pearson’s Chi-squared test was used to compare dichotomous variables. All statistical analyses were performed with SPSS software v.20 (SPSS Inc., Chicago, USA). The significance level was set at p < 0.05.
RESULTS
Demographics, disease severity indices, and CSF biomarkers
From the initial sample (290 eyes from 49 AD, 39 MCI, 57 HC), we retained 137 eyes (from 43 AD, 37 MCI, 57 HC) for the RNFL thickness analysis after checking for inclusion/exclusion criteria (2 eyes excluded for patient’s refusal and 8 eyes for ophthalmological issues), images’ quality assessment according to OSCAR IB criteria by SH (31 eyes excluded for sub-optimal quality) and after randomly selecting one eye when scans from both eyes were available (112 eyes randomly excluded). Among the 140 available macular scans, we retained 57 eyes (from 21 AD, 18 MCI, 18 HC) for the GCL, IPL, and INL volume measurements. Age at enrolment and female/male ratio were not significantly different between groups (Table 1). Considering MCI and AD patients, we found any significant differences neither in education, nor in CSF biomarkers’ concentrations (multiple Mann Whitney U tests), but we found a significantly higher proportion of patients with pathological values of t-tau/Aβ 42 ratio in AD compared to MCI subgroup (92% versus 71%, p = 0.016) (Table 1). AD showed significantly worse scores than MCI in disease severity indices, such as MMSE, CDR, and CDR sb (multiple Mann Whitney U tests) (Table 1). The same findings are confirmed in the “macula” subsample, as well (Supplementary Table 1).
Demographics, disease severity indices, and CSF analysis
All the reported values are mean (±SD), if not otherwise specified. For age we also reported median and min-max range. Significant differences at p < 0.05 among groups are evidenced (
Correlations
Searching for possible effects of age and sex on RNFL thickness and macular layers’ volume through linear regression models, we found that the global RNFL (RNFL G) thickness was negatively but not significantly correlated with age at OCT acquisition (B = –0.09, p = 0.428). A significant negative correlation was found between GCL and IPL volume and age (B = –0.004, p = 0.013 and p = 0.014, respectively). There was a statistically significant association between gender and RNFL G thickness (B = –3.79, p = 0.02), with males showing lower RNFL G values than females (mean±SD): 92.31±8.27 versus 96.15±9.81μm. There was no significant association between gender and macular layers’ volume. Considering MCI and AD patients, neither RNFL thickness nor macular layers’ volume were correlated with education, except for a significant negative correlation with RNFL nas thickness (B = –0.914, p = 0.001). Linear regression models and corresponding coefficients were summarized in Table 2.
Linear regression models to search for effects of age, sex and education on RNFL thickness and macular layers’ volume
For any combination we reported the regression B coefficient with the corresponding 95% C.I. (in brackets) and p-value (in the row below), obtained by linear regression models with OCT parameter as dependent variable and sex, age and education as independent variables. Significant associations at p < 0.05 are evidenced (
Neuro-retina morphology among groups: Differences
Thickness of RNFL global (RNFL G) and of superior quadrant (RNFL sup) was statistically significantly different between groups, even after adjusting for age and sex (RNFL G: p = 0.002; RNFL sup: p = 0.001). Tukey-Kramer post hoc pairwise comparisons showed that RNFL G and RNFL sup were significantly thinner in AD and MCI when compared to HC with no differences between AD and MCI (Fig. 2a, b). Thickness of all the other quadrants (i.e., RNFL temp, RNFL nas, and RNFL inf) did not significantly differ between groups (Fig. 2c–e). Differences in RNFL G and RNFL sup remain also after restricting the analyses to the sub-sample of patients considered for macular volume measurements (RNFL G: p = 0.039; RNFL sup: p = 0.02). Volume of macular GCL and IPL was significantly different between groups, even after adjusting for age and sex (GCL: p = 0.001; IPL: p = 0.003). Tukey-Kramer post hoc pairwise comparisons showed that GCL and IPL volume was significantly reduced in AD when compared to HC, while MCI did not differ to either AD or HC (Fig. 2f, g). INL volume did not differ among groups (Fig. 2h). RNFL thickness values and macular layers’ volumes are reported in Supplementary Table 2.
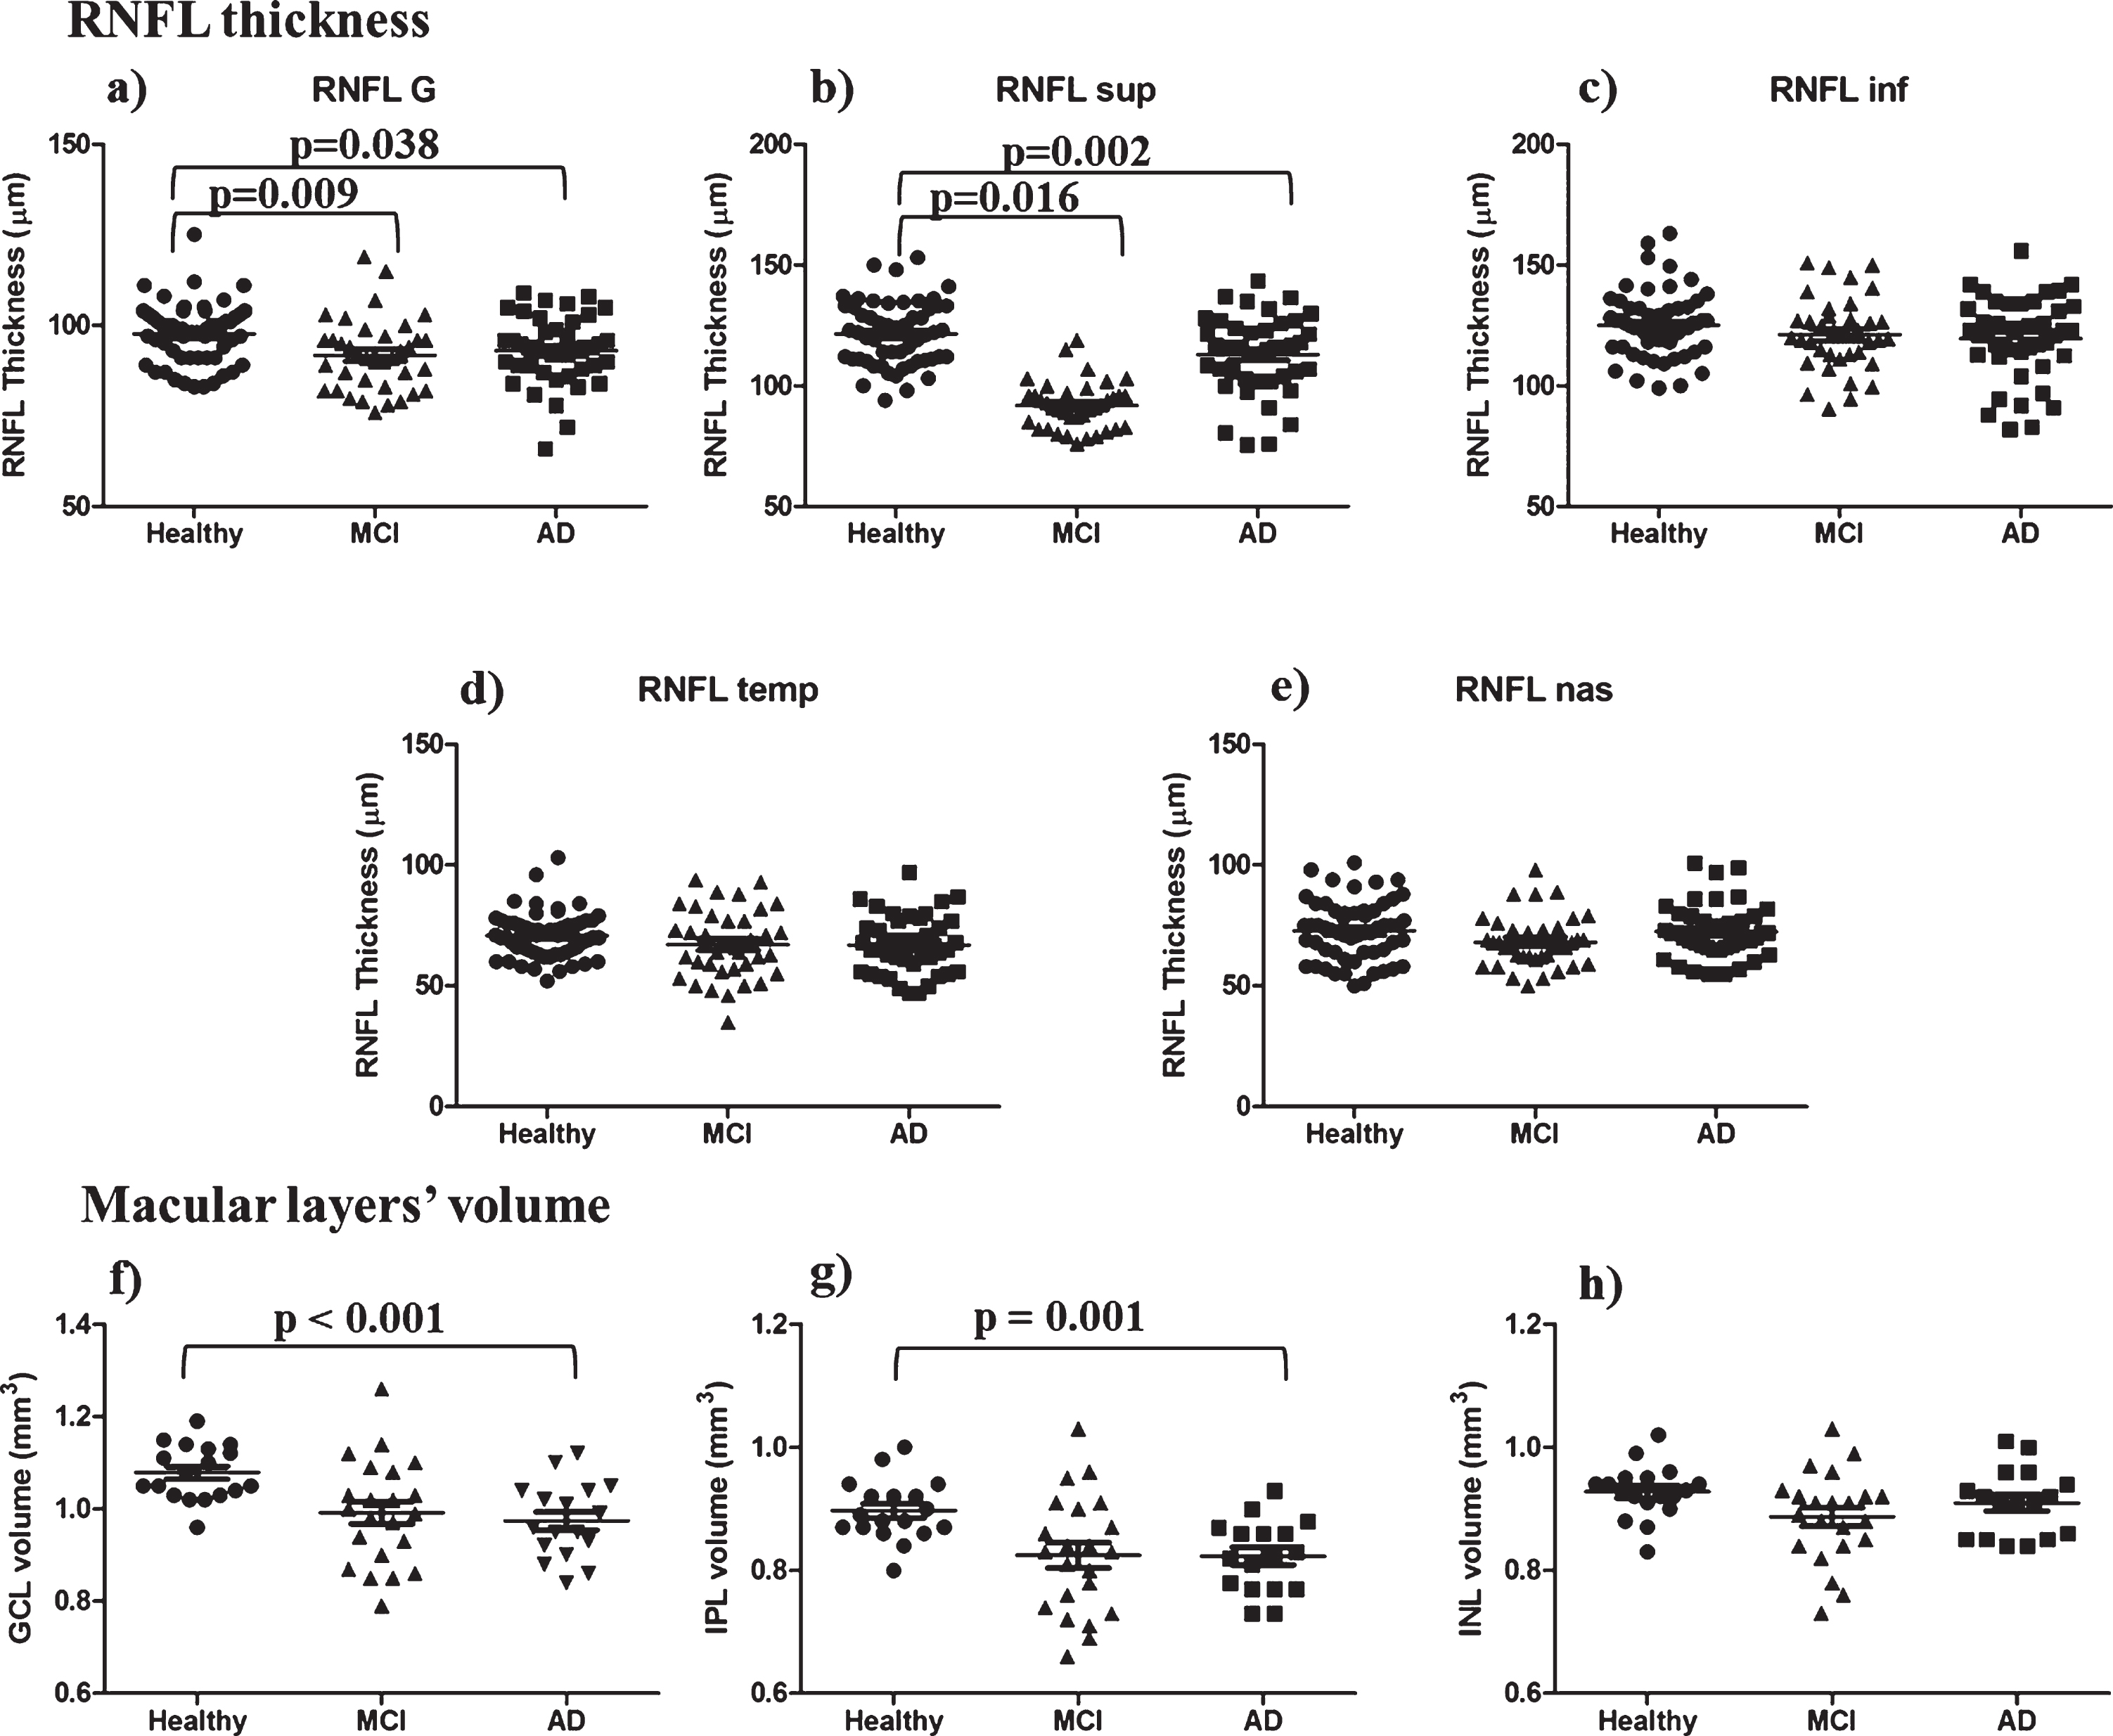
RNFL thickness and macular layers’ volume. On the top, RNFL thickness: (a) global (RNFL G) and single quadrants: (b) superior, (c) inferior, (d) temporal, (e) nasal. At the bottom, the macular layers’ volume: GCL (f), IPL (g), and INL (h). Significant differences are indicated by square brackets.
Neuro-retina and CSF AD biomarkers
After controlling for age and sex through linear regression models, RNFL nas thickness was negatively correlated with CSF Aβ 42 (B = –0.016; p = 0.033) and positively with CSF tau (B = 0.009, p = 0.041) and CSF p-tau (B = 0.073, p = 0.043) concentrations. CSF tau was positively correlated with RNFL inf (B = 0.013, p = 0.039) thickness, as well; no statistically significant correlations were found between CSF biomarkers and other OCT measurements (Table 3). After dichotomizing CSF p-tau/Aβ 42 and t-tau/Aβ 42 ratios in normal and pathological values according to the international normative data, we found no significant differences in RNFL thickness (both global and of single quadrants) and in macular layers’ volume between AD and MCI patients with pathological and normal values (multiple Student’s T-tests, p > 0.05) (Supplementary Table 3).
Linear regression models to search for effects of CSF biomarkers on RNFL thickness and macular layers’ volume
For any combination we reported the regression B coefficient with the corresponding 95% C.I. (in brackets) and p-value (in the row below), obtained by linear regression models with OCT parameter as dependent variable and sex, age and CSF biomarkers as independent variables. Significant associations at p < 0.05 are evidenced (
Neuro-retina and cognition
RNFL thickness and macular volumes were not correlated with generic disease severity indices such as MMSE, CDR, and CDR sb (Spearman’s ρ, p > 0.05). Focusing on single cognitive domains, we did not find significant correlations between RNFL thickness and the memory, attention and language overall Z-scores (Pearson’s r, p > 0.05), nor between RNFL thickness and tests about the visuo-spatial skills (i.e., RFC and CDT) and the reasoning domain (CPM), Spearman’s ρ, p > 0.05. We found that both the macular GCL and the IPL volumes were significantly positively correlated with the memory overall Z score, (Pearson’s r, GCL: 0.363, p = 0.029; IPL: 0.368, p = 0.027) (Fig. 3a, b). Considering the single memory neuropsychological tests, we found the macular IPL volume was positively correlated with CVLT-I (Pearson’s r = 0.523, p = 0.022) and SR (Pearson’s r = 0.336, p = 0.048) adjusted scores (Fig. 3c, d). These correlations were no longer significant (Pearson’s r, p > 0.05) considering only those AD and MCI patients with either a t-tau/Aβ 42 ratio > 0.5 or a p-tau/Aβ 42 ratio > 0.12. No other significant correlations were found between macular volumes and the attention and language overall Z-scores, CPM, CDT and RFC. Correlations between neuro-retina morphology and cognitive domains were summarized in Supplementary Table 4.

Correlation between OCT and cognition. The Memory overall Z score was positively correlated with GCL (a) and IPL (b) volumes. Considering the memory single tests, the California Verbal Learning Test Immediate recall (CVLT-I) (c), and the Story Recall (SR) (d) were positively correlated with the IPL volume.
DISCUSSION
Peripapillary RNFL thickness and macular GCL/IPL volume are reduced in patients with cognitive impairment
In our study AD and MCI subjects showed significantly thinner RNFL (both the global value and in superior quadrant) compared to HC, in line with most of the studies on the topic which have reported a significant decrease of the RNFL thickness in AD and MCI, both the overall value [11 , 37–42] and the superior quadrant RNFL [39, 42]. Fewer studies reported instead no significant differences in RNFL thickness between AD/MCI patients and healthy controls [14 , 44]. However, recent meta-analyses on the topic confirmed a significant reduction of RNFL in AD patients [17 , 45]. Given that AD pathological hallmarks (i.e., senile plaques and NFT) have been found both in the retina [38] and in the visual cortex [46], particularly in the cuneal gyrus [47] which receives axons from the superior retina, an open question remains whether RNFL atrophy (and the superior RNFL atrophy, in particular) is due to local phenomenon, retrograde trans-synaptic degeneration or both. As a collateral finding, in our sample, RNFL was slightly thicker in female than in male participants, in contrast to some studies finding no differences between genders [15, 48], but in line with others that found a thicker RNFL in females both in children [49, 50] and in the adults/elderly [51 –53]. Fewer data are available about macular layers’ volume in AD. Previous studies confirmed a significant reduction of the macular total volume in AD [54 –56] and MCI [55] when compared to HC subjects. More specifically, the macular ganglion cell complex (GCC = RNFL + GCL + IPL) volume seems to be significantly reduced in AD [57 –59] and MCI [59] when compared to HC. In partial disagreement with these findings, but in line with a recent meta-analysis which confirmed that the macular volume is reduced in AD but not in MCI when compared to HC [18], we found that only AD showed reduced macular GCL and IPL volumes with regard to HC, while MCI did not differ from either AD nor HC. Assuming that MCI is an intermediate condition including either patients with an underlying incipient dementia or patients with other non-degenerative causes of cognitive impairment, we might speculate that the absence of differences in macular GCL and IPL volume between MCI and other groups might be due to such an heterogeneity represented by “not demented, not healthy” MCI patients.
Neuro-retina morphology may mirror cognition
To our knowledge, this is one of the first studies to have extensively searched for possible correlations between OCT and cognition in patients with cognitive impairment. The macular structure in both AD and MCI patients seems to be associated with performances in the memory domain, one of the mostly involved cognitive domains in AD. We found indeed a significant positive correlation between both GCL and IPL volumes and the overall memory Z score: the higher the volume, the better the patient’s performance. More specifically, the macular IPL volume was positively correlated with two memory tests (Story Recall and California Verbal Learning Test, Immediate recall). Even though, due to the small macula sample size, this association might have been strongly influenced by fewer subjects with better cognitive performances, thus needing further validation, nevertheless such an association in patients with cognitive impairment is quite novel. So far, no clear correlation between retinal nerve fiber layer loss and the severity of cognitive impairment assessed only by generic items (i.e., MMSE and/or CDR-sb) has been demonstrated [55, 60], with only one study finding a significant positive correlation between GCL + IPL volume and MMSE [61]. We found indeed no correlations between any OCT parameters and MMSE or CDR-sb. Similarly, a recent study found that macular GCC in AD is positively associated with cognitive performances in constructional praxis and semantic-lexical system, but not with MMSE [62]. Associations between neuro-retina morphology and cognition have been confirmed in cognitively unimpaired subjects, as well. A thicker RNFL (in particular the temporal segments) seems to correlate with better performances in different cognitive domains [63, 64]. Moreover, subjects with no apparent cognitive impairment and a thinner RNFL at baseline are at higher risk to perform worse at follow-up cognitive testing in a large community-based cohort of healthy subjects [65]. With regard to macular structure, other studies found that a thinning of GCL/IPL was associated with poor cognition in the community-dwelling elderly [66] and may reflect disease severity in AD patients [67, 68]. Taken together, these data might corroborate the role of neuro-retina as a possible proxy of subjects’ cognition. The correlation between IPL and cognition in particular is noteworthy. IPL is the retinal layer where dendrites of RGC make synapses with cells of the INL. RGC dendritic pruning was described in a murine model of AD-related amyloid pathology [69]. Similarly, synaptic dysfunction, plasticity impairment and reduction in dendritic spine density have been also described in humans [70], to the point that some authors described “Alzheimer’s Disease as a synaptic failure” [71]. Thence IPL, the neuro-retina synaptic layer, might be the most sensitive to pathological changes occurring in AD, well correlating with cognitive impairment. Interestingly, at earlier AD stages (i.e., cognitively unimpaired subjects with evidence of cerebral amyloid burden), a thickening rather than a thinning of IPL has been described [72], apparently in contrast with our findings showing a reduction of the IPL volume in AD and MCI patients. A possible explanation for such a discrepancy might be the different disease stages when IPL was measured: at earlier stages an IPL thickening may occur, probably due to an aberrant inflammatory response playing a role in the AD pathogenesis in the pre-symptomatic phases [73, 74], which is then followed by neurodegeneration in the symptomatic (MCI and AD) stages, mirrored by IPL volume reduction. This hypothesis cannot be validated through the present data, needing further studies analyzing longitudinal changes in neuro-retina morphology along the AD continuum. However, we think that it might prompt the neuro-retina (and IPL, in particular) as a new possible disease stage marker, sensible to the different changes occurring at different stages along the AD continuum.
Neuro-retina atrophy is independent of age and CSF profile suggestive for an underlying AD pathology
Several studies showed a significant reduction of RNFL thickness with age [52 , 75–77]. In our study we found no correlations between RNFL thickness and age, in line with another study [38], and a negative correlation between macular GCL/IPL and age. Considering that cognitively unimpaired subjects and AD/MCI patients in our sample did not differ in age and that differences in RNFL and GCL/IPL among groups still remained after adjusting for age, we can argue that neuro-retina atrophy in AD seems to be an age-independent phenomenon or, even better, an increased aging phenomenon, probably due to a further specific neuro-degenerative process. Furthermore, we found no significant differences in any OCT measurements between patients with pathological and normal values of either p-tau/Aβ 42 or t-tau/Aβ 42 ratio. Since these ratios define a CSF profile typical for AD, suggesting an underlying AD pathology with a good reliability [78], even at the very early disease stages [79], we might argue that the reduction of neuro-retina thickness seems to be irrespective of the underlying etiology. If we consider neuro-retina as a brain tissue sensitive to neurodegeneration regardless of the underlying cause, this finding is not surprising. Similarly, a recent study found no correlation between CSF AD biomarkers and RNFL thickness nor macular volume, but a significant one between both global and parietal brain atrophy and macular volume, thus arguing that brain and eye are related to one another, regardless of the possible underlying pathological process [80]. Thence, OCT might represent a disease stage rather than a disease state marker, irrespective of the underlying neurodegenerative pathology. However, we found a weak but significant correlation between all the single AD biomarkers and RNFL thickness in the nasal quadrant and a positive association between CSF tau and RNFL thickness in the inferior quadrant. RNFL nas thickness was negatively correlated with CSF Aβ 42 levels and positively correlated with CSF tau and p-tau concentrations. More in detail, lower CSF Aβ 42 concentrations reflecting a higher cerebral amyloid burden [81] are correlated with a higher RNFL nas thickness, in line with another study which found a higher macular IPL volume in patients with evidence of cerebral amyloid burden [72]. Since retinal amyloid deposits have been demonstrated in patients with postmortem evidence of cerebral amyloid accumulation [82], we might argue that a higher amyloid burden in brain may be associated with a higher one in retina and a consequent higher inflammation and gliosis, mirrored by higher CSF tau and p-tau concentrations, which are markers of neuronal damage [81], leading to an increased RNFL thickness. This hypothesis is quite tentative and needs further comparative studies with brain and retinal amyloid specific-trackers to be confirmed.
Limitations
This study has several limitations. The cross-sectional design and the lack of MRI data to be correlated with might have weakened our findings about OCT as a possible disease severity marker, while the absence of data relative to other types of dementia cannot allow us to state whether the neuro-retina degeneration we observed is specific to AD. Moreover, CSF analysis was not available for healthy controls: considering OCT as a possible disease stage marker, we think that the potential inclusion of some AD “asymptomatic” cases did not affect our findings. Then, we did not consider the eye axial length which is significantly associated with RNFL thickness [49]; this could have partially limited the power of our analysis. Finally, even though some ophthalmologic disorders that may determine retinal thinning (i.e., diabetic retinopathy, macular degeneration, and glaucoma) may be asymptomatic, the adoption of strict inclusion/exclusion criteria together with a careful assessment of OCT scans according to the OSCAR-IB criteria, should have limited the effect of such ophthalmological confounders on our findings. On the other hand, we think that our study has several strengths: the quite large sample size, the availability of a “biomarker supported” diagnosis, and the correlation of OCT findings with a thorough in-depth neuropsychological battery. Therefore, we think that, even if preliminary, our findings might promote OCT as a reliable, cost effective, and easy to handle tool able to detect neuro-retinal atrophy in AD. Further studies are needed to validate our data, to search for retinal changes in other dementias, and to explore usefulness of OCT as a disease progression marker in longitudinal settings, as well as to investigate the relationship between retinal abnormalities and regional patterns of brain atrophy on MRI scans.
Footnotes
ACKNOWLEDGMENTS
This work was carried out within the framework of the Ivascomar project of the Italian Ministry of Research (CTN01_00177_165430), Cluster Tecnologico Nazionale Scienze della Vita “Alisei”, Italian Ministry of Research and partially supported by Regione Lombardia (POR FESR 2014-2020) within the framework of the NeOn project (ID 239047).