
Abstract
Background:
Oligomeric amyloid-β (Aβ) is one of the major contributors to the pathomechanism of Alzheimer’s disease (AD); Aβ oligomerization in plasma can be measured using a Multimer Detection System-Oligomeric Aβ (MDS-OAβ) after incubation with spiked synthetic Aβ.
Objective:
We evaluated the clinical sensitivity and specificity of the MDS-OAβ values for prediction of AD.
Methods:
The MDS-OAβ values measured using inBlood™ OAβ test in heparin-treated plasma samples from 52 AD patients in comparison with 52 community-based subjects with normal cognition (NC). The inclusion criterion was proposed by the NINCDS-ADRDA and additionally required at least 6 months of follow-up from the initial clinical diagnosis in the course of AD.
Results:
The MDS-OAβ values were 1.43±0.30 ng/ml in AD and 0.45±0.19 (p < 0.001) in NC, respectively. Using a cut-off value of 0.78 ng/ml, the results revealed 100% sensitivity and 92.31% specificity.
Conclusion:
MDS-OAβ to measure plasma Aβ oligomerization is a valuable blood-based biomarker for clinical diagnosis of AD, with high sensitivity and specificity.
INTRODUCTION
Studies investigating the development of a biomarker for the early diagnosis of Alzheimer’s disease (AD) have increased throughout medical communities worldwide. Many studies have suggested that amyloid-β (Aβ) oligomers could present as potent toxic species compared to insoluble fibrils [1–4]. Aβ oligomers, playing a key role in AD pathogenesis, have become a promising candidate for AD diagnosis. Efforts to measure Aβ oligomers in humoral fluids are currently underway [5–7]. However, cost-effective and non-invasive diagnostic methods to detect Aβ oligomers are not currently available in clinical practice. Furthermore, a clinically applicable method to measure Aβ oligomers in the blood has not yet been reported. Due to the invasiveness of lumbar puncture, the accessibility of patients for cerebrospinal fluid (CSF) analysis is low, limiting its general usage. Therefore, blood analysis would be a beneficial complement to this shortcoming. However, there are several limitations of using plasma Aβ as blood-based biomarker of AD. Firstly, Aβ is highly diluted in blood [8, 9]. Furthermore, Aβ can bind to and interfere with other protein and peptides [10, 11], and undergo degradation [12] and self-aggregation [13] in the blood.
An atypical approach, called the Multimer Detection System-Oligomeric Aβ (MDS-OAβ), was introduced to measure the oligomerization dynamics in plasma samples after spiking synthetic Aβ [14]. This essentially utilizes the MDS technique, which can selectively detect oligomers in a given sample [15, 16]. One study found that the level of Aβ oligomers increased after spiking Aβ and incubation, in plasma samples of AD patients but not in healthy normal subjects [14]. The elevated levels of Aβ oligomers closely correlated with conventional AD biomarkers, such as CSF Aβ42 and Pittsburgh compound B (PIB) positron emission tomography (PET) standard uptake ratio, CSF phosphorylated tau, and CSF total tau [17]. In this study, we aimed to validate the accuracy of MDS-OAβ for measuring Aβ oligomerization dynamics in heparin-treated plasma samples from patients with AD and healthy controls. The objective of this study was to assess the sensitivity and specificity of the MDS-OAβ test in differentiating plasma from AD patient and subjects with normal cognition (NC). The positive predictive value (PPV) and negative predictive value (NPV) were also evaluated. In addition, the MDS-OAβ levels in AD patients was compared to the Clinical Dementia Rating (CDR) scores, a numeric scale used to quantify the severity of dementia symptoms.
MATERIALS AND METHODS
The study was supported by a contract research organization (CRO). This clinical study was approved by the Korea Ministry of Food and Drug Safety (MFDS) and performed in accordance with its approved protocol (No.753). Approval by the institutional review board (IRB) of Seoul National University Bundang Hospital (IRB no.: E-1703/386-001) and Chung-Ang University Hospital (IRB no.:1722-008-272) were obtained. Furthermore, the study was conducted in compliance with Good Clinical Practice established by the Korea Ministry of Food and Drug Safety and International Council for Harmonization of Technical Requirements for Pharmaceuticals for Human Use and ethical principles of the Declaration of Helsinki.
Materials
The samples were selected from repositories. It was initiated on June 30, 2017 and continued until September 14, 2017. 53 AD and 52 normal residual plasma samples (both heparin-treated) collected by Seoul National University Bundang Hospital and Chung-Ang University Hospital were screened based on the following inclusion/exclusion criteria. The inclusion criteria for the NC group were as follows: 1) a community-based population; 2) no abnormality on the Health Screening Questionnaire [18]; 3) absence of memory complaints; 4) a Korean Dementia Screening Questionnaire score ≤6 [19]; 5) normal general cognition (within 1 standard deviation of the age- and education-adjusted norms of the Korean version of the Mini-Mental State Examination [20] and a score >26); 6) intact activities of daily living (K-IADL≤0.42); 7) no depression (the short-form Geriatric Depression Scale ≤7); 8) no history of thyroid dysfunction, vitamin B12 deficiency, or folate deficiency; 9) no abnormalities on the MRI scan; and 10) education for at least 6 years. A more stringent inclusion criteria was applied to patients with AD: 1) the probable AD criteria proposed by the National Institute of Neurological and Communicative Disorders and Stroke and the Alzheimer’s Disease and Related Disorders Association (NINCDS-ADRDA) [21], as well as the DSM-IV; 2) a follow-up of at least 6 months to determine the clinical course of AD by experienced neurologists; 3) male or female patients between the ages of 50 to 80; and 4) education for at least 6 years. The case records were reviewed thoroughly. Exclusion criteria included the presence of cognitive impairment other than AD, stroke, and delirium. Detailed demographic data of subjects with NC and AD are presented in Table 1.
Demographics of the subjects included in the study
Data presented as mean±standard deviation. NC, subject with normal cognition; AD, patient with Alzheimer’s disease; MMSE, Mini-Mental State Examination.
The sample size was calculated considering the sensitivity and specificity for the clinical diagnosis of AD [22] and clinical trials of amyloid PET [23]. The sensitivity of 70.9% for diagnosing AD by Beach et al. was set as the predetermined sensitivity (P0) [22] and the sensitivity of 88.0% based on clinical trials of Vizamyl™ Flutemetamol F 18 [23] as the expected sensitivity (P1). Based on the sensitivities following the hypothesis and equation by K. Hajian-Tilaki [24], a sample size of 47 was calculated. Initially, 60 samples for each group were extracted from the repositories. Of these, the CRO excluded 16 samples due to medical history and sample quality issues. Finally, heparin-treated plasma samples from 52 patients with AD and 52 subjects with NC were selected considering the 10% dropout for this study (Fig. 1). The MDS-OAβ measurements using the inBlood™ OAβ test (PeopleBio Inc., Gyeonggi-do, Republic of Korea) were taken twice successively, and the average was used. The exclusion criteria of samples were as follows: If an analyzer-related error occurs during an analysis, conduct a re-test and an error occurs in the re-test; if there was only one error that was not corrected in the additional measurement; if the number of remaining samples to be re-tested was insufficient. All 104 samples were randomized and anonymized for the test. For each sample, a random assignment number generated by an independent statistician from Seoul National University Bundang Hospital IRB was assigned as the sample identification number.
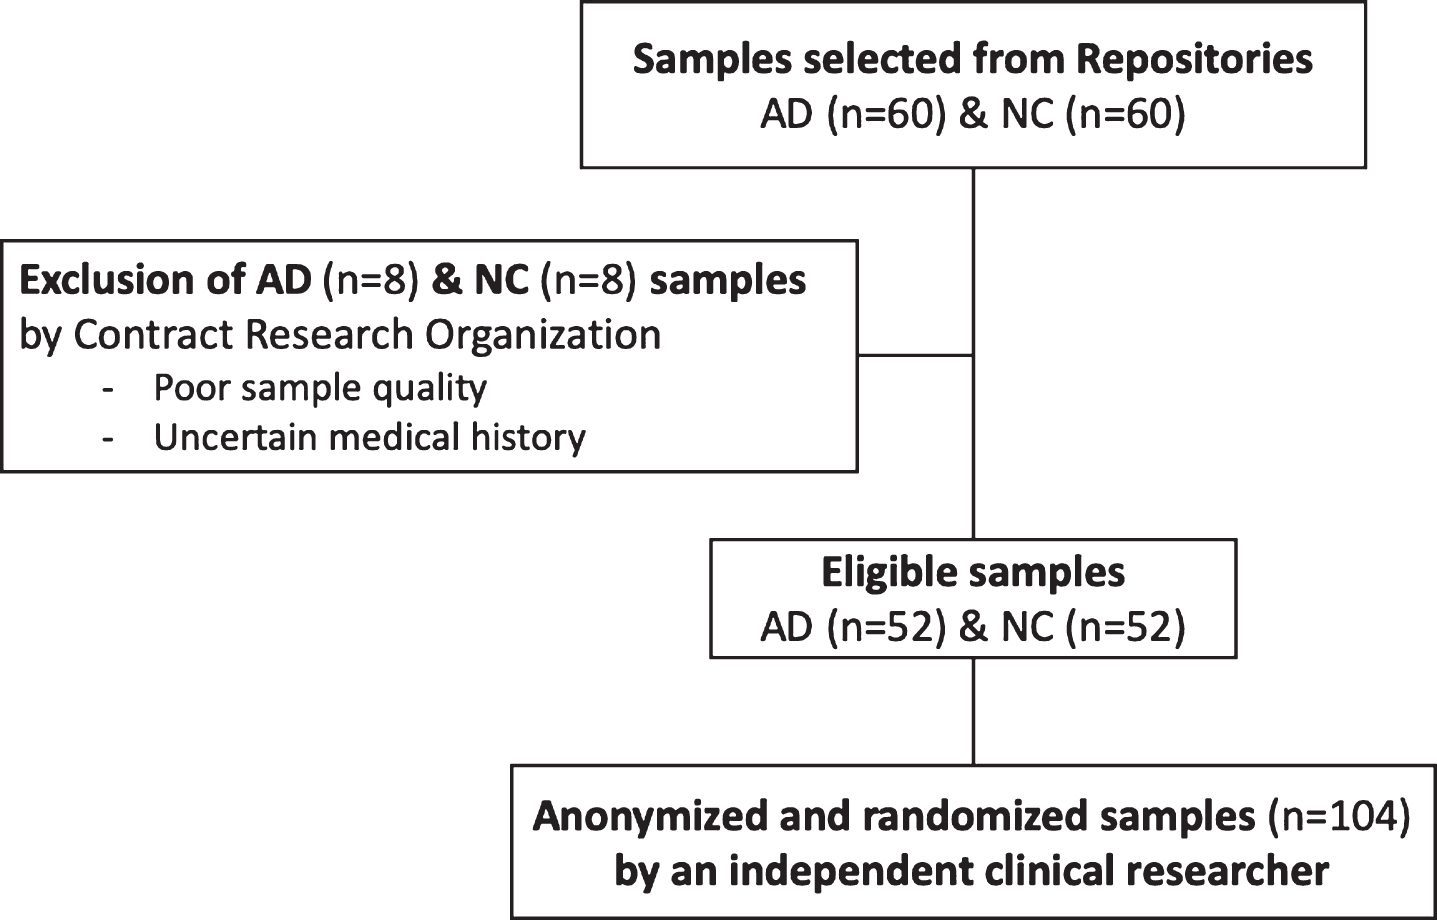
Enrollment of eligible subjects for MDS-OAβ validation. AD, patient with Alzheimer’s disease; NC, subject with normal cognition.
Assay description and procedure
The inBloodTM™ OAβ test (People Bio Inc., Gyeonggi-do, Republic of Korea) was utilized to quantify MDS-OAβ values in heparin-treated plasma from patients with AD and NC. The inBlood™ OAβ test, based on MDS was a modified atypical sandwich immunoassay for measuring oligomeric Aβ. In the MDS method, the epitope-overlapping antibodies specific for the N-terminus of Aβ were used to capture and to detect the Aβ oligomers. The epitopes for the 6E10 and W0-2-HRP antibodies overlapped at the N-terminus of Aβ, and mouse monoclonal anti-6E10 (BioLegend, San Diego, CA, USA) and anti-W0-2-HRP antibodies (Absolute Antibody Ltd, Oxford, UK) were therefore used to capture and to detect Aβ oligomers, respectively.
Prior to the assay, aliquots of plasma samples were thawed at 37°C for 15 min. As indicated in the assay protocol of the inBloodTM OAβ test, PBR-1 (synthetic Aβ made by PeopleBio Inc.) was spiked into plasma and the mixture was incubated at 37°C for 48 h. The incubated plasma sample mixture and serially diluted standard samples were added to each well of the plates. The plates were incubated at about 20 to 25°C for 1 h. After washing three times with washing buffer, W02-HRP antibody was added to the wells, and the plates were incubated for 1 h at about 20 to 25°C. To increase the sensitivity of detection, 100μl/well of enhanced chemiluminescence substrate solution (Rockland Immunochemicals Inc., Limerick, PA, USA) was added, and the Relative Luminescence Unit (RLU) signal was detected using a Victor 3TM multi-spectrophotometer. Dilutions providing signal in the linear range of the standard curves were used for the conversion to RLU values to determine the concentration of oligomerized Aβ.
Statistical analysis
Average MDS-OAβ value from the inBlood™ OAβ tests of each group were compared using a two independent sample t-test. Receiver operating characteristic (ROC) analysis of the MDS-OAβ values of the plasma samples from patients with AD and subjects with NC was performed to obtain the corresponding cut-off value for the highest area under the curve (AUC). The cut-off value obtained by the ROC analysis was reverified by calculating the reference interval. The reference interval and the associated confidence interval (CI) were determined by a non-parametric method according to the guideline of Clinical and Laboratory Standards Institute (CLSI). This was determined to be positive if the individual MDS-OAβ value was higher than the cut-off value. In addition to the calculation of the sensitivity and the specificity to differentiate between plasma samples of patients with AD and subjects with NC, the positive and negative predictive values were also calculated. We also determined if the sensitivity and specificity of MDS-OAβ value within the 95% confidence interval are 70.9% and 70.8% obtained in a clinical test [22], respectively, using Z-test. Furthermore, to confirm the correlative trend of MDS-OAβ values and AD severity, MDS-OAβ levels were compared with the CDR scores (ANOVA). All statistical analyses were performed with the SPSS (version 23, IBM Corp., USA), with a statistical significance p-value was set at 0.05.
RESULTS
None of the 104 samples were excluded during the test procedure. The average MDS-OAβ values of the AD and NC samples were 1.43±0.30 ng/ml and 0.45±0.19 ng/ml, respectively, and there was a significant difference between the two groups (p < 0.001) (Fig. 2). The ROC analysis indicated an optimal cut-off value (0.78 ng/ml), which allowed the best differential discrimination between patients with AD and NC subjects. In order to closely verify the optimal cut-off value, we induced the reference interval by biding by the guideline from CLSI C28-A3; ‘the (indirect) techniques are perhaps more appropriately employed using data from individuals who are relatively healthy.’ The 95% reference interval subjected to NC is 0.783 ng/ml and therefore, is approximate to the cut-off value of ROC analysis. The AUC was 0.999. As a result, all 52 samples of the AD group were found to be positive, and 48 samples of the NC group were negative, indicating 100% sensitivity (95% CI: 100%) and 92.31% specificity (95% CI: 85.07∼99.55%). The PPV and NPV were 92.86% and 100%, respectively. The sensitivity of 70.9% and specificity of 70.8% determined previously studied [22] were within those of this test with the 95% confidence interval in a one-tailed test with significance level of 0.025 (Z-test) (Table 2).
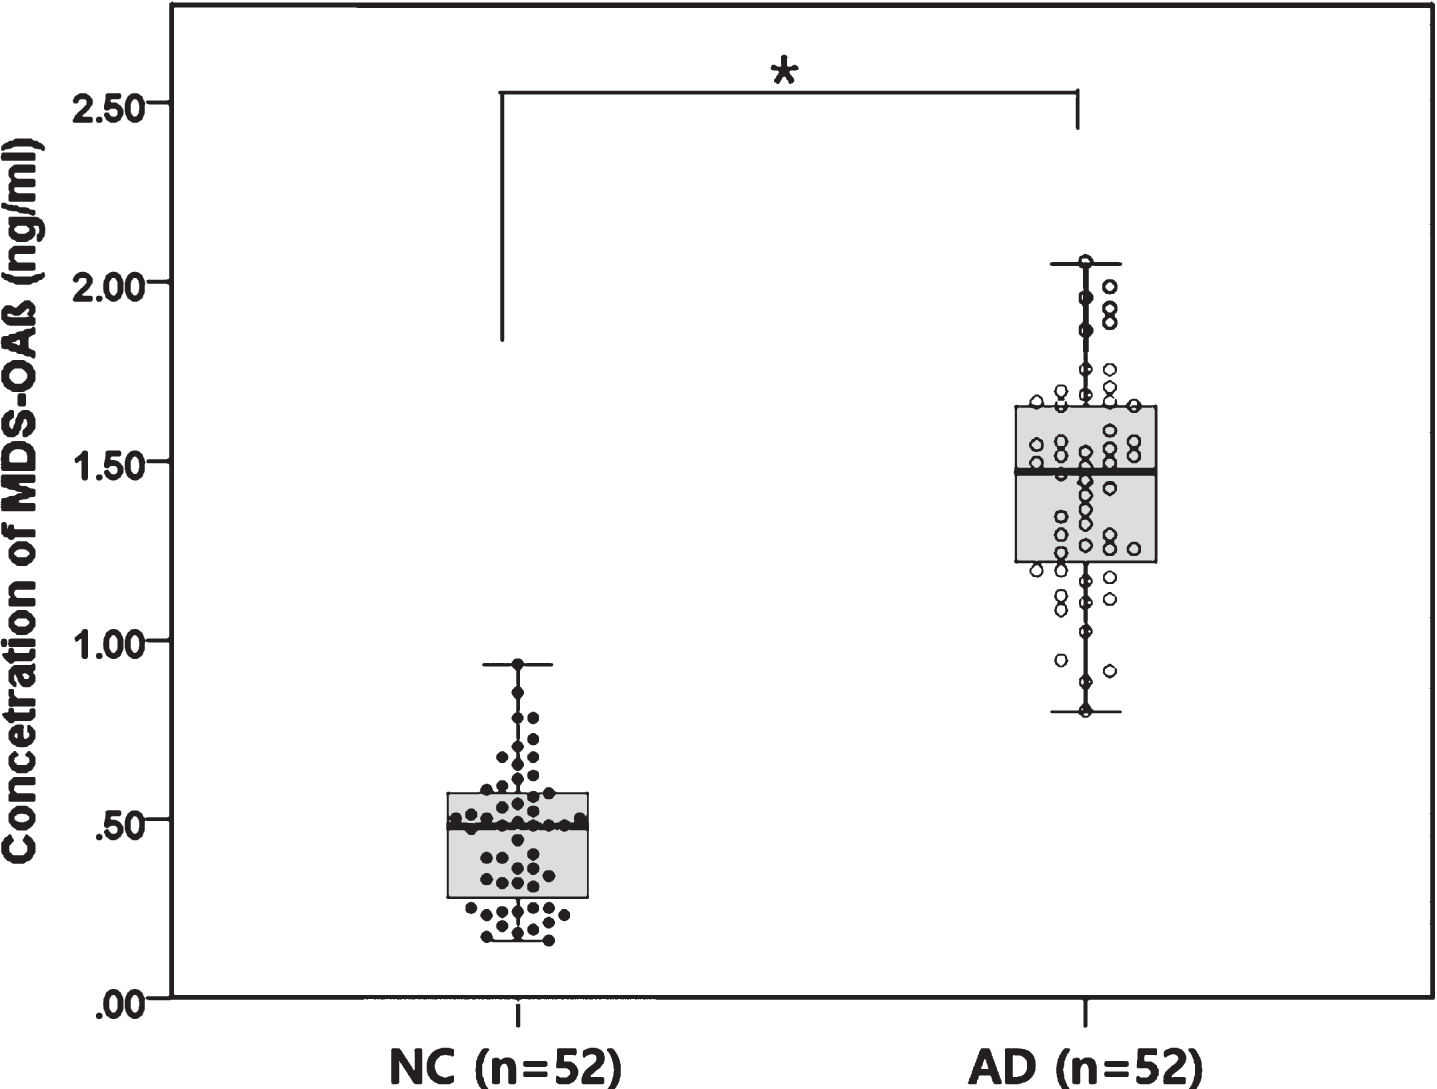
MDS-OAβ levels in heparin-treated plasma samples of Alzheimer’s disease patients and subjects with community-based normal cognition. The concentration of MDS-OAβ was significantly higher in AD patients than in NC subjects. *t-test, p < 0.001; AD, patient with Alzheimer’s disease; NC, subject with normal cognition.
Characteristics of MDS-OAβ between subjects with Alzheimer’s disease and normal cognition when using a cut-off value of 0.78 ng/ml
NC, subject with normal control; AD, patient with Alzheimer’s disease. *Ratio difference as to whether the sensitivity is greater than 70.9%; Z-test.
The MDS-OAβ levels were significantly higher in patients with a CDR score of 0.5 (1.46±0.33 ng/ml, n = 25), 1 (1.53±0.21, n = 17), and 2 (1.26±0.21, n = 9), compared with CDR 0 (0.45±0.19, n = 25) (t-test, p < 0.001) (Fig. 3). Interestingly, the average of MDS-OAβ levels decreased as the CDR score (0.5, 1, and 2) in AD patients increased; however, there was no significance (ANOVA, p = 0.084).
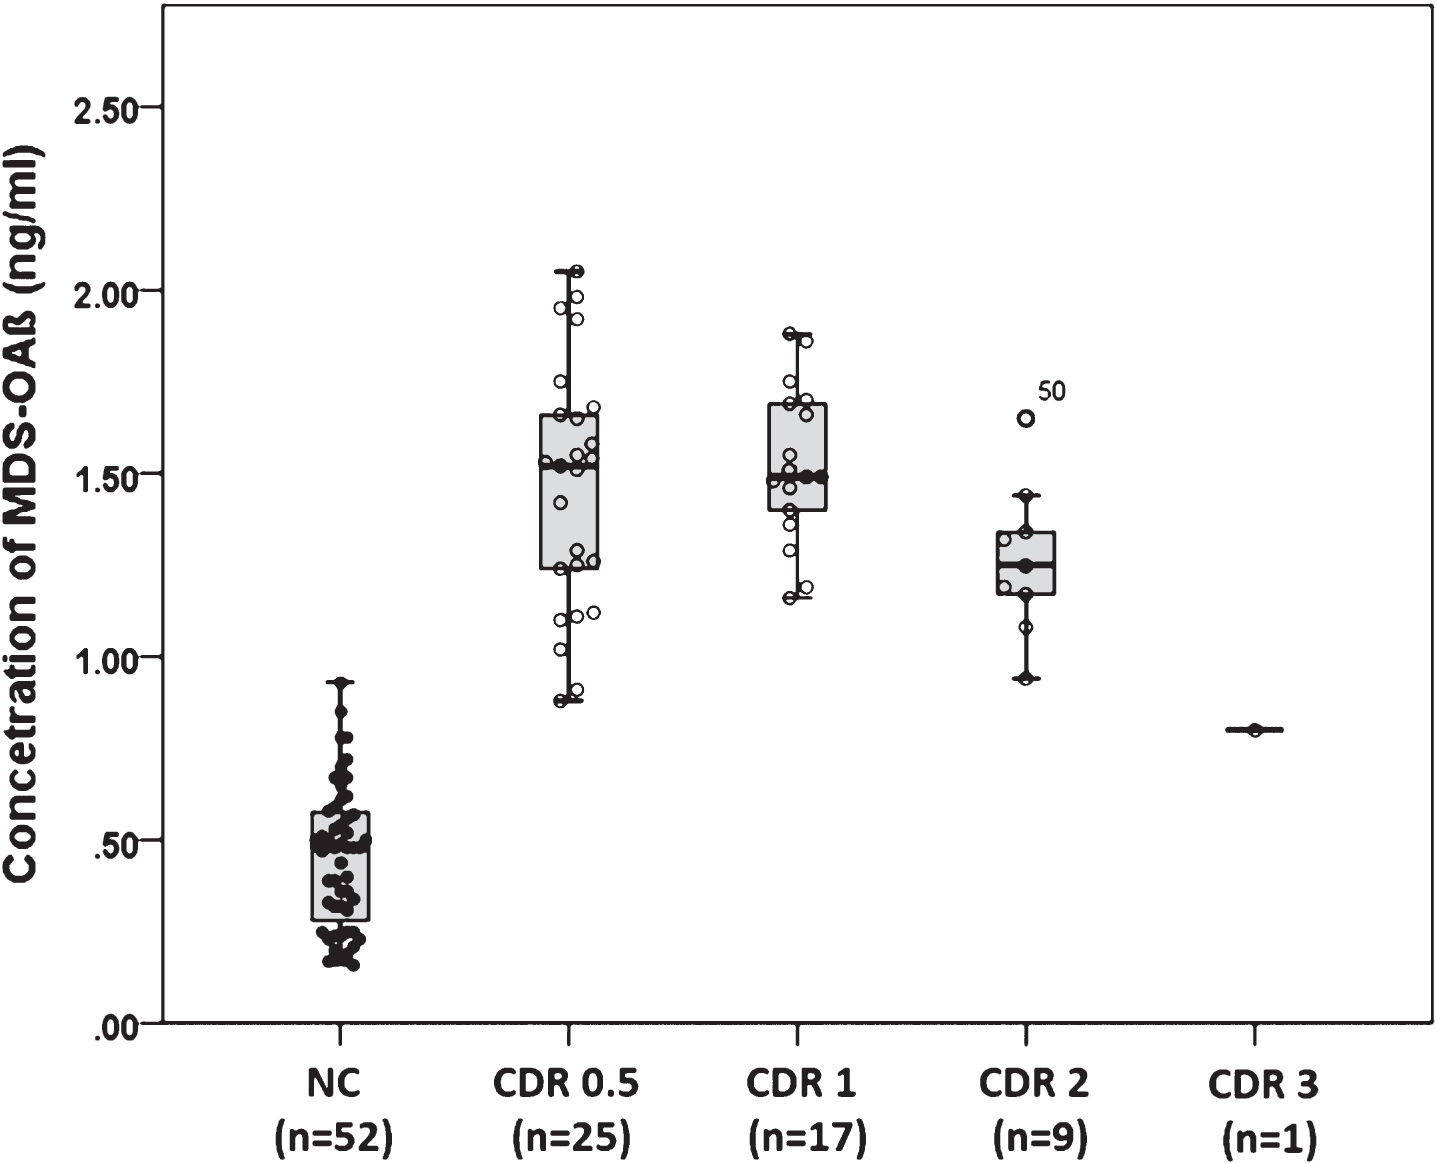
MDS-OAβ level based on the clinical dementia rating. The decrease of the MDS-OAβ mean with an increase of CDR score was not significant (p > 0.05); however, the MDS-OAβ levels were significantly higher in patients with a CDR score of 0.5, 1, and 2 versus those with a CDR score 0 was significant (p < 0.001).
DISCUSSION
Many researchers have chosen Aβ oligomers as a biomarker for the diagnosis of AD as it satisfies the criteria of an ideal biomarker, which was proposed by the Ronald and Nancy Reagan Research Institute-NIA in 1998 [25]. Several studies have substantiated the positive correlation between the levels of Aβ oligomers in plasma and the likelihood of AD [26], and found the sensitivity and specificity to be less than 85% [6]. The MDS-OAβ measures oligomerization dynamics of Aβ in the blood without the need for specialized equipment, unlike conventional techniques which directly measure Aβ molecules using larger machines due to the low concentration of target molecules in the blood [14]. In this study, the oligomerization tendencies of Aβ in AD and normal plasma were measured using the MDS-OAβ, and we demonstrated that the sensitivity and specificity were 100% and 92.3%, respectively; therefore, MDS-OAβ has very high sensitivity and specificity in distinguishing AD from NC. We used a stringent patient recruitment criterion for this study. For example, AD patients were followed-up for at least 6 months by experienced neurologists to rule out the possibility of cognitive impairment caused by any other disease, and community-based NC subjects without cognitive decline, were enrolled.
The spiked synthetic Aβ played an important role in measuring oligomeric Aβ in the plasma of AD patients. Two hypotheses could be conceivable. The first is that the spiked Aβ acts as a seed and induces oligomerization. The other possibility is an oligomerization of spiked Aβ by factor X (not yet identified) in AD plasma. They should be revealed in future research.
Although the data was not shown in this study, while assessing 29 cases of the AD, all patients showed high MDS-OAβ levels, and a PIB or Florbetaben PET was conducted. The standardized uptake value radio (SUVR) of 25 cases were positive, and 3 cases had a positive visual rating but negative SUVR. One case had a negative amyloid PET but had a typical CSF profile of AD. This patient may have a soluble form Aβ, which failed to produce Aβ plaques in the brain; therefore, only showing changes in the CSF biomarker [27–30]. While the MDS-OAβ measures dynamics of Aβ oligomerization [14], amyloid PET only reveals the fibrillar form of Aβ in the brain [31], which may have caused the discrepancy. The other possible reason is that changes in CSF biomarkers may have occurred before the amyloid PET change. Aβ oligomerization tendency in plasma may reflect as early as changes in CSF biomarkers, which requires further study.
Many studies have argued that biomarkers, such as brain volume and CSF Aβ42, p-tau, and t-tau which indicates the downstream effects of AD, show an increase in severity as the disease progress and formed a graph of the sigmoid curve [32, 33]. However, the average of MDS-OAβ level in this study was the highest at CDR score 0.5 and the lower as AD progress (Fig. 3). MDS-OAβ measures the oligomerization dynamics of Aβ, which corresponds to the derivative of the sigmoid function of Aβ accumulation. It is possible that this biomarker changes during the early phase of AD, as shown with other biomarkers associated with processes upstream of the AD pathomechanism, and decreases in expression as the disease progresses [34–36]. Another possible explanation could be that the concentrations of neuronal injury/death biomarkers decrease after symptom onset, which suggests slowing of the acute neurodegenerative processes with symptomatic disease progression [37].
One limitation of the present study was the age difference between the AD and NC groups. However, we found that there was no correlation between MDS-OAβ levels and age in the 52 NC subjects (range 51–77, mean 60.5±7.4), and speculated that age difference was not a significant variable in influencing MDS-OAβ levels. Second, the MMSE score of AD increased in patients with CDR 2 and 3 (Table 1), but this is thought to be due to the patients being of a younger age than those with CDR 1. Additionally, because the numbers of subjects were CDR 2 and 3 with only 9 and 1 respectively, the reversal of MMSE with increasing CDR is not significant.
Conclusions
Plasma samples of AD and NC subjects were differentiated using MDS-OAβ, which measured the Aβ oligomerization tendency of plasma. Furthermore, MDS-OAβ was found to have high sensitivity and specificity. Based on the current findings, measuring the Aβ oligomerization tendency in plasma could be a simple and reliable blood-based biomarker for the diagnosis of AD.