
Abstract
Background:
Alzheimer’s disease (AD) is the most common cause of dementia in older individuals, and amnestic mild cognitive impairment (aMCI) is currently considered the prodromal stage of AD. The hippocampus and fornix interact functionally and structurally, with the fornix being the major efferent white matter tract from the hippocampus.
Objective:
The main aim of this study was to examine the impairments present in subjects with AD or aMCI and the relationship of these impairments with the microstructure of the fornix and the functional connectivity (FC) and gray matter volume of the hippocampus.
Methods:
Forty-four AD, 34 aMCI, and 41 age- and gender-matched normal controls (NCs) underwent neuropsychological assessments and multimode MRI. We chose the bilateral hippocampi as the region of interest in which gray matter alterations and FC with the whole brain were assessed and the fornix body as the region of interest in which the microstructural integrity of the white matter was observed. We also evaluated the relationship among gray matter alterations, the abnormal FC of the hippocampus and the integrity of the fornix in AD/aMCI
Results:
Compared to the NC group, the AD and aMCI groups demonstrated decreased gray matter volume, reduced FC between the bilateral hippocampi and several brain regions in the default mode network and control network, and damaged integrity of the fornix body (decreased fractional anisotropy and increased diffusivity). We also found that left hippocampal FC with some regions, the integrity of the fornix body, and cognition ability were significantly correlated. Therefore, our findings suggest that damage to white matter integrity may partially explain the reduced resting-state FC of the hippocampus in AD and aMCI.
Conclusion:
AD and aMCI are diseases of disconnectivity including not only functional but also structural disconnectivity. Damage to white matter integrity may partially explain the reduced resting-state FC in AD and aMCI. These findings have significant implications for diagnostics and modeling and provide insights for understanding the disconnection syndrome in AD.
Keywords
INTRODUCTION
The hippocampal formation is typically affected in the early stages of Alzheimer’s disease (AD), as shown by growing evidence suggesting structural atrophy and functional alterations in this brain region [1, 2]. Amyloid-β plaques and neurofibrillary tangles first appear in the hippocampus before spreading to other brain regions [3]. The fornix is initially formed from the major output fibers of the hippocampus, connecting the hippocampus with other brain regions. The integrity of the fornix is important for hippocampal function [4, 5], and the degeneration of hippocampal neurons is one of the reasons for the degradation of the fornix. Therefore, the hippocampus and fornix (important components of the classic Papez circuit) interact functionally and structurally, and the hippocampus-fornix circuitry plays an important role in the cognitive decline observed in AD [5, 6].
Volumetric differences from noninvasive structural magnetic resonance imaging (MRI) [7 –9], altered functional connectivity (FC) [10 –12], and microstructural alterations in diffusion MRI measures of the hippocampus [13 –15] in AD/MCI have been well studied. More importantly, a variety of studies have suggested an interaction between hippocampal volume and the integrity of the fornix [14, 16]. For example, Pelletier and colleagues found that hippocampal alterations was significantly associated with reduced fractional anisotropy (FA) of the fornix, and the recursive regression procedure suggested that hippocampal alterations could be mediated by a loss of fornix connections [17]. Fletcher and colleagues also suggested that reductions in fornix volume might be explained at least in part by clinically silent hippocampal degeneration [18]. In addition, changes to the structural connection of the fornix to the hippocampus are also being delineated in AD [14, 19]. Whereas the differential effects of hippocampal FC and white matter tract and gray matter alterations have been extensively studied, less is known about the relationship among them. Anatomical connectivity and functional connectivity are inherently related, and clarifying the complex relationship between brain structure and function is of growing interest within the neuroimaging community [20]. Anatomical disruptions may influence the organization of functional connections and the white matter microstructure; therefore, combining MRI modalities will advance our understanding of the network connectivity changes in amnestic MCI (aMCI)/AD [21].
Inspired by these studies, we explored the overarching hypothesis that hippocampal gray matter and FC are coupled with microstructural alterations of the fornix in AD. The aim of the present study was to provide a preliminary picture of the changes that occur in the fornix, as well as the relationships between microstructural white matter changes and alterations in hippocampal FC at different cognitive stages in AD/aMCI. We hypothesized that AD/aMCI subjects have disease severity-related alterations in gray matter volume, FC, and white matter integrity consistent with previous studies. We also hypothesized that the altered gray matter volume and FC of the hippocampus are associated with white matter alterations in the fornix. For this purpose, multimodal MRI data were analyzed from 44 AD, 34 aMCI, and 41 normal controls (NCs). The FC and gray matter volume of the hippocampus, as well as the microstructural integrity of the fornix and the correlations of these measures were evaluated. The combined use of structural, functional, and diffusion MRI may provide a new opportunity for understanding brain network changes in aMCI/AD and elucidate subtle decoupling changes between structural and functional brain networks.
MATERIALS AND METHODS
Standard protocol approvals, registration, and patient consent
This study was approved by the Medical Ethics Committee of PLA General Hospital. Written informed consent was obtained from each enrolled subject or his/her authorized guardian. The participants underwent general physical, psychological, and laboratory examinations prior to enrollment in the formal study. The participants did not take medications that might have influenced cognition during the scans, and all patients received professional suggestions for further treatment.
Subjects
The participants were recruited from two sources: outpatients from the Chinese PLA General Hospital or a website advertisement. The detailed diagnostic criteria for AD, aMCI, and NC status can be found elsewhere in our previous studies [22 –28]. Details regarding the subjects’ information are given in the Supplementary Material. Briefly, the recruited AD patients fulfilled the NINCDS-ADRDA (National Institute of Neurological and Communicative Disorders and Stroke and the AD and Related Disorders Association) criteria for the diagnosis of probable AD [29]. The aMCI patients were required to conform to the criteria described by Petersen [30]. The AD and aMCI patients also met the core clinical criteria of the new diagnostic criteria for probable AD and aMCI due to AD [31, 32]. The NCs included gender- and age-matched subjects without memory decline. Each subject was right-handed and underwent a battery of neuropsychological tests, including the Mini-Mental State Examination (MMSE) [33], Montreal Cognitive Assessment (MoCA) [34], Trail Making Test, Clock Drawing Test [35], Similarities Test, Complex Figure Replication Task, Animal Verbal Fluency Test [36], and Auditory Verbal Learning Test (AVLT) [37], and was assessed using the Geriatric Depression Scale, Clinical Dementia Rating (CDR) [38], and Activities of Daily Living (ADL) scale [39]. Briefly, following the exclusion of subjects with substantial head motion (any axis >3 mm or any angle >3°), 119 subjects (44 AD, 34 aMCI, and 41 age- and gender-matched NCs) were included in the present study. To ensure the accuracy of the diagnosis, we selected atypical patients, including 14 AD and 12 aMCI patients, for examination by 11C-PIB-PET [40]. The demographic and neuropsychological details of the subjects are shown in Table 1.
Demographic, clinical, neuropsychological, and head motion data and DTI measures of the fornix in the NC, aMCI, and AD groups
Data presented as the mean±standard deviation. Chi-squared test was used for gender comparisons; One-way ANOVAs with Bonferroni-corrected post hoc t tests were used for age, MMSE, FA, AxD, MD and RD comparisons. Post hoc comparisons of significant group differences:aaMCI versus NCs,bAD versus aMCI,cAD versus NCs.dFifteen subjects refused to or could not continue this test.eFourteen subjects refused to or could not continue this test.fSixteen subjects refused to continue this test.gTwelve subjects refused to continue this test.hModulated normalized gray matter volume corrected for individual brain size in the statistical analysis using the total intracranial volume in Cat12. DTI, diffusion tensor imaging; NCs, normal controls; aMCI, amnestic mild cognitive impairment; AD, Alzheimer’s disease; MMSE, Mini-Mental State Examination; MoCA, Montreal Cognitive Assessment; CDR, Clinical Dementia Rating; AVLT, Auditory Verbal Learning Test; ADL, Activities of Daily Living; TIV, total intracranial volume; Hip, hippocampus; FA, fractional anisotropy; MD, mean diffusivity; RD, radial diffusivity; AxD, axial diffusivity.
Data acquisition
A 3.0 T Siemens MR system (Skyra, Siemens Germany) with a standard head coil was used to acquire the MR images. For each subject, T2-weighted images were collected and evaluated by two senior radiologists (H.Y. and N.A.) during the scan. The structure scans were performed using a 3D Magnetization Prepared Rapid Gradient Recalled Echo (MPRAGE) with the following parameters: repetition time (TR) = 2,530 ms, echo time (TE) = 3.43 ms, inversion time (TI) = 1100 ms, flip angle = 7°, matrix = 256×256, field of view (FOV) = 256×256 mm2, and slice thickness = 1 mm. Each volume comprised 192 sagittal slices with a resolution of 1×1×1 mm3. Resting-state fMRI scans were performed using an echo planar imaging (EPI) sequence with the following parameters: TR = 2,000 ms, TE = 30 ms, flip angle = 90°, matrix = 64×64, FOV = 220×220 mm2, slice thickness = 3 mm, and slice gap = 0.9 mm. Each volume comprised 34 axial slices, and each functional run lasted for 8 min. The diffusion tensor imaging (DTI) images were acquired using a single-shot EPI sequence, and all acquisitions were aligned on the anterior commissure-posterior commissure plan (AC-PC). The diffusion gradients were applied in 64 noncollinear directions (b = 1000 s/mm2), and one image was acquired with no diffusion weighting (b = 0, b0 image). The other parameters were as follows: TR = 7,000 ms, TE = 91 ms, matrix = 128×128, FOV = 256×256 mm2, flip angle = 90°, slice thickness = 3 mm, and slice gap = 0 with 45 axial slices. During the scanning, the subjects were instructed to keep their eyes closed and to relax; comfortable foam padding was used to minimize head motion, and ear plugs were used to reduce the scanner noise.
Structural MRI
The structural images were preprocessed through standard steps with voxel-based morphometric (VBM) analysis using the CAT12 toolbox (http:///www.neuro.uni-jena.de/cat). First, the T1-weighted images of the subjects were aligned with the International Consortium for Brain Mapping (ICBM) template and were tissue-segmented according to the tissue probability map provided in the CAT12 toolbox. Second, the segmented gray matter was modulated by the nonlinear normalization parameters to correct for individual brain size. Finally, the modulated and warped gray matter was smoothed by convolution with an isotropic Gaussian kernel (8 mm full width half maximum [FWHM]). The bilateral hippocampi in the Brainnetome Atlas (http://www.atlas.brainnetome.org) were extracted and resampled to the standard MNI space (the size of the left hippocampus was 4733 mm3, and the size of the right hippocampus was 4488 mm3). The mean modulated gray matter volume of the left and right hippocampus were extracted for further analysis.
Functional MRI procedure
Data preprocessing
The data were preprocessed in steps consistent with the protocols of our previously published studies [41] using an in-house Brainnetome fMRI toolkit (Brant, http://brant.brainnetome.org) [42]. The first 10 images were discarded to allow magnetization equilibrium, and then the preprocessing steps included 1) slice-timing for time correction, 2) realignment to reduce head motion, 3) normalization to a standard EPI template and reslicing to 2×2×2 mm cubic voxels, 4) denoising by regressing out several effects, e.g., six motion parameters and their first order deviation, linear drift, and the mean time series of all voxels within the white matter and cerebrospinal fluid, 5) temporal filtering (0.01–0.08 Hz) to reduce noise [22–24 , 43], and 6) spatially smoothing with a 6 mm FWHM kernel.
Estimation of the FC of the hippocampus
The seed reference time series of the left and right hippocampi was obtained by averaging the fMRI time series of all voxels within each side of the hippocampus in the Brainnetome Atlas (http://www.atlas.brainnetome.org). Correlation analysis was carried out between the seed reference and the whole brain in a voxel-wise manner, after which the correlation coefficients were transformed to z-values using the Fisher r-to-z transformation to improve normality. This procedure produced spatial maps in which the values of voxels represented the strength of the correlation with the hippocampus.
DTI procedure
Data preprocessing
The DTI data preprocessing was performed using FSL software (https://fsl.fmrib.ox.ac.uk/fsl). All the diffusion-weighted images were aligned to the nondiffusion-weighted image (the first b0 volume) by applying an affine registration using the eddy_correct function in FSL 5.0 [44]. For each subject, the b-matrix was reoriented to provide a more accurate estimate of tensor orientations using fdt_rotate_bvec in FSL. The brain mask in DTI space was acquired from the b0 image using the Brain Extraction Tool in FSL. After the above corrections and reorientation, the diffusion tensor and DTI indices were calculated using the FSL FDT tool.
Estimation of white matter measures of the fornix
To locate the fornix for each subject, the ICBM-DTI-81 white matter labels atlas was used in this study. The size for the extracted body of the fornix was 659 mm3 (Supplementary Figure 1). The procedure of warping the body of the fornix from the atlas to the individual native DTI space was as follows: First, we employed linear and then nonlinear methods to register the native FA map to the individual T1 image using the registration tools flirt [45] and fnirt in FSL, respectively. Second, we used flirt and fnirt to linearly and then nonlinearly register the individual T1 image to the standard anatomical atlas (MNI152_T1_1 mm_brain.nii.gz). Next, we inverted the two derived transformation matrices from DTI space to T1 space and from T1 space to atlas space. Finally, the two inverted transformation matrices were applied to warp the body of the fornix from atlas space to native DTI space using a nearest-neighbor interpolation. Then, the mean values of FA, mean diffusivity (MD), radial diffusivity (RD), and axial diffusivity (AxD) of the body of the fornix were calculated for each subject.
Statistical analysis
To compare the FC of the left hippocampus between the control and patient groups, one-way analysis of variance (ANOVA) of the z-values was performed with age and gender as covariates to create an abnormality map showing significant differences in connectivity to the left hippocampus among the three groups (NC, aMCI, and AD). A combined threshold of contrast maps was set at p < 0.001 for each voxel and a cluster size of at least 480 mm3, which was equal to the corrected threshold of p < 0.01 determined by Monte Carlo simulation. Subsequently, the regions that showed significant differences were identified as the regions of interest (ROIs), and the mean hippocampal connectivity values of the three groups were extracted to evaluate the altered FC strength (FCs) at different stages of disease severity. Statistical comparisons of the mean FCs were performed using a two-sample, two-tailed t-test with age and gender as covariates between each pair of groups (p < 0.05, Bonferroni corrected). The same statistical analysis was performed for the right hippocampus.
For the gray matter volume of the bilateral hippocampi and white matter measures of the fornix, ANOVA was first performed to evaluate group differences with age and gender as covariates (p < 0.05, Bonferroni corrected). Then, a two-sample two-tailed t-test was performed with age and gender as covariates to assess group differences in each measure between each pair of groups (p < 0.05, Bonferroni corrected).
In the current study, we investigated the clinical correlates (Pearson correlation coefficient) of three types of imaging measures, i.e., the strength of altered hippocampal FCs, mean hippocampal gray matter volumes, and white matter integrity (FA, MD, RD, AxD) of the fornix of the AD and aMCI groups. We also investigated the coupling properties between the FC of the hippocampus, mean gray matter volumes of the hippocampus, and white matter integrity of the fornix in the aMCI and AD groups. To determine the relationship between gray matter volume (or the white matter integrity measures) and cognitive ability (MMSE) in the AD and MCI groups, we performed a statistical mediation analysis using multivariable regression modeling, with age and gender as covariates. Because these analyses were exploratory in nature, we used a statistical significance level of p < 0.05.
RESULTS
Hippocampal gray matter volumes and FC
Both the mean volumes of the bilateral hippocampi were significantly lower in patients with AD and aMCI than in NCs (p < 0.05, Bonferroni corrected, Table 1). Moreover, the decreased hippocampal volume in the AD group was significantly more severe than that in the aMCI group (p < 0.05, Bonferroni corrected, Table 1).
Comparison of the pattern of FC of the left hippocampus (Hip.L) among the groups revealed that several brain regions, including the right parahippocampus (Phip.R), posterior cingulate cortex/precuneus (PCC/Pcu), right superior frontal gyrus (SFG.R), medial frontal gyrus (MFG), and bilateral angular gyrus (ANG), showed significantly lower connectivity to the left hippocampus in patients with AD than in NCs (Table 2). Analysis of the right hippocampus (Hip.R) showed that the left medial prefrontal cortex, left dorsal lateral prefrontal cortex, and middle cingulate cortex (MCC) showed lower connectivity in patients with AD than in NCs (Table 3, Fig. 1). Except for the connectivity between the left hippocampus and right putamen (PUT.R), the FCs of the aMCI subjects were lower than those of the NC subjects (p < 0.001), but higher than those of the AD subjects (p < 0.001) in the identified brain regions (Fig. 1).
Altered FC using the left hippocampus as the ROI for the comparison between the AD and NC groups (p < 0.001, cluster size > 50 voxels, palpha < 0.01, AlphaSim corrected)
FC, functional connectivity; ROI, region of interest; AD, Alzheimer’s disease; NC, normal controls; BA, Brodmann area; SFGmed, medial superior frontal gyrus; MFG, medial frontal gyrus; Phip, parahippocampus; PUT, putamen; ITG, inferior temporal gyrus; Pcu, precuneus; MTGp, middle temporal gyrus pole; PCC, posterior cingulate cortex; SFG, superior frontal gyrus.
Altered FC using the right hippocampus as the ROI for the comparison between the AD and NC groups (p < 0.001, cluster size >50 voxels, p alpha < 0.01, AlphaSim corrected)
FC, functional connectivity; ROI, region of interest; AD, Alzheimer’s disease; NC, normal controls; BA, Brodmann area; SFG, superior frontal gyrus; MFG, medial frontal gyrus; SFGmed, medial superior frontal gyrus; MCC, middle cingulate cortex.
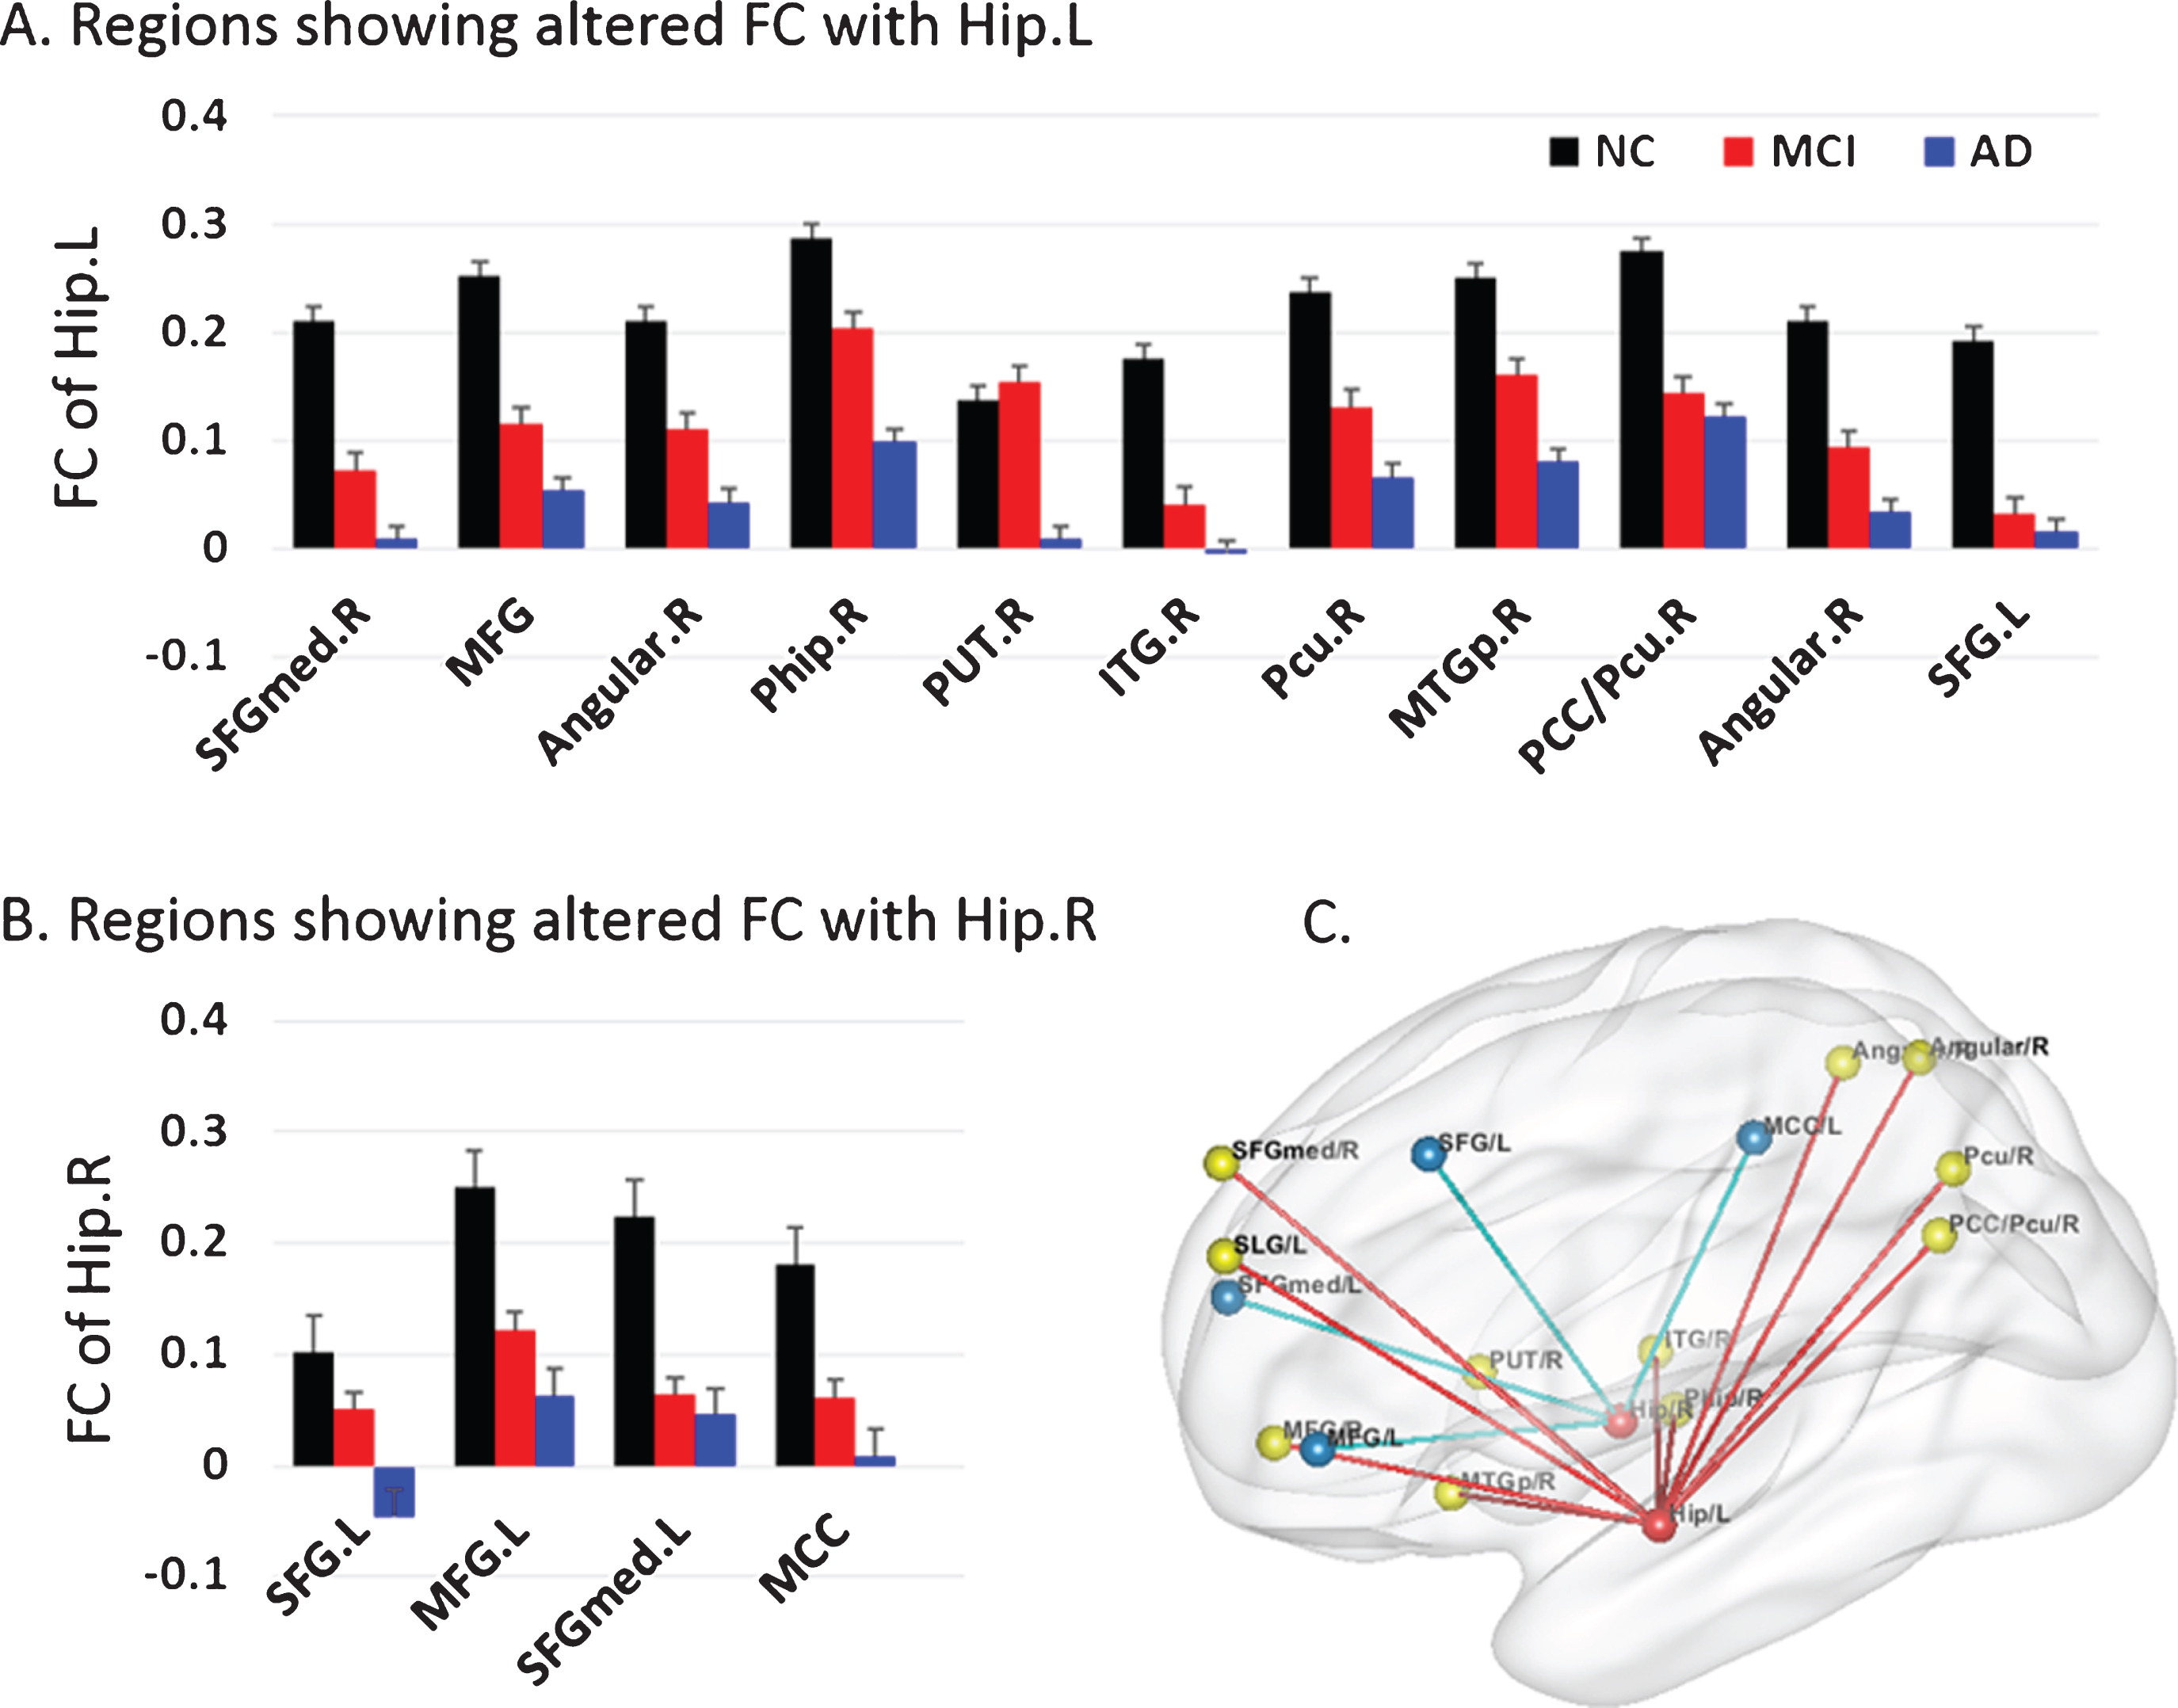
A) The FC strength between the left hippocampus and the identified brain region in the NC (black), MCI (red), and AD (blue) groups. B) The FC strength between the right hippocampus and the identified brain region in the NC (black), MCI (red), and AD (blue) groups. C) Brain areas with significant differences in bilateral hippocampal FC between the NC and AD groups. Bars represent the mean FC. Error bars represent the standard error of FC.
Fornix integrity
The mean FA value of both the right and left fornix bodies in the AD group was significantly lower than in the other groups (Table 1), and the diffusion coefficients MD, AxD, and RD were significantly increased in the AD group compared with those in the aMCI and NC groups (p < 0.05, Bonferroni corrected). The differences in these parameters between the aMCI group and the NC group were not significant, potentially indicating that there is no significant microstructure alteration in the early stage of cognitive decline (Table 1).
Correlation analyses
Taking age and gender as covariates, the volume of the bilateral hippocampi were significantly correlated with the MMSE scores (Fig. 2) and the microstructural white matter integrity (FA, MD, AxD, and RD) values of the fornix (Fig. 3 and Supplementary Figure 2). In addition, we also found that the FCs between both hippocampi and most of the identified regions (especially the connectivity between the hippocampus and Phip) were significantly correlated with the hippocampal volumes, cognitive ability (MMSE), and microstructural white matter integrity scores of the fornix in the aMCI and AD populations (p < 0.05, uncorrected) (Figs. 4–6 and Supplementary Figures 3 and 4). In particular, the correlations between four connectivity pairs (Hip.L-ANG.R, Hip.L-ANG.L, Hip.L-PUT.R, and Hip.R-SFG.L) and gray matter volume persisted after Bonferroni correction at p < 0.05 (N is the number of identified connectivity pairs) (Fig. 4), and the correlations between three connectivity pairs (Hip.L-Phip.R, Hip.L-PUT.R, and Hip.R-SFG.L) and MMSE scores persisted after Bonferroni correction at p < 0.05 (N is the number of the identified connectivity pairs) (Fig. 5). The additional analysis showed that most of the clinical variables were significantly associated with the imaging measures (gray matter volumes, white matter integrity scores, and the identified functional connectivities) (Supplementary Figure 5). The results of the mediation analysis showed that only the connectivity between the left hippocampus and right PUT partially mediated the relationship between gray matter volume and cognitive outcomes (Fig. 7).
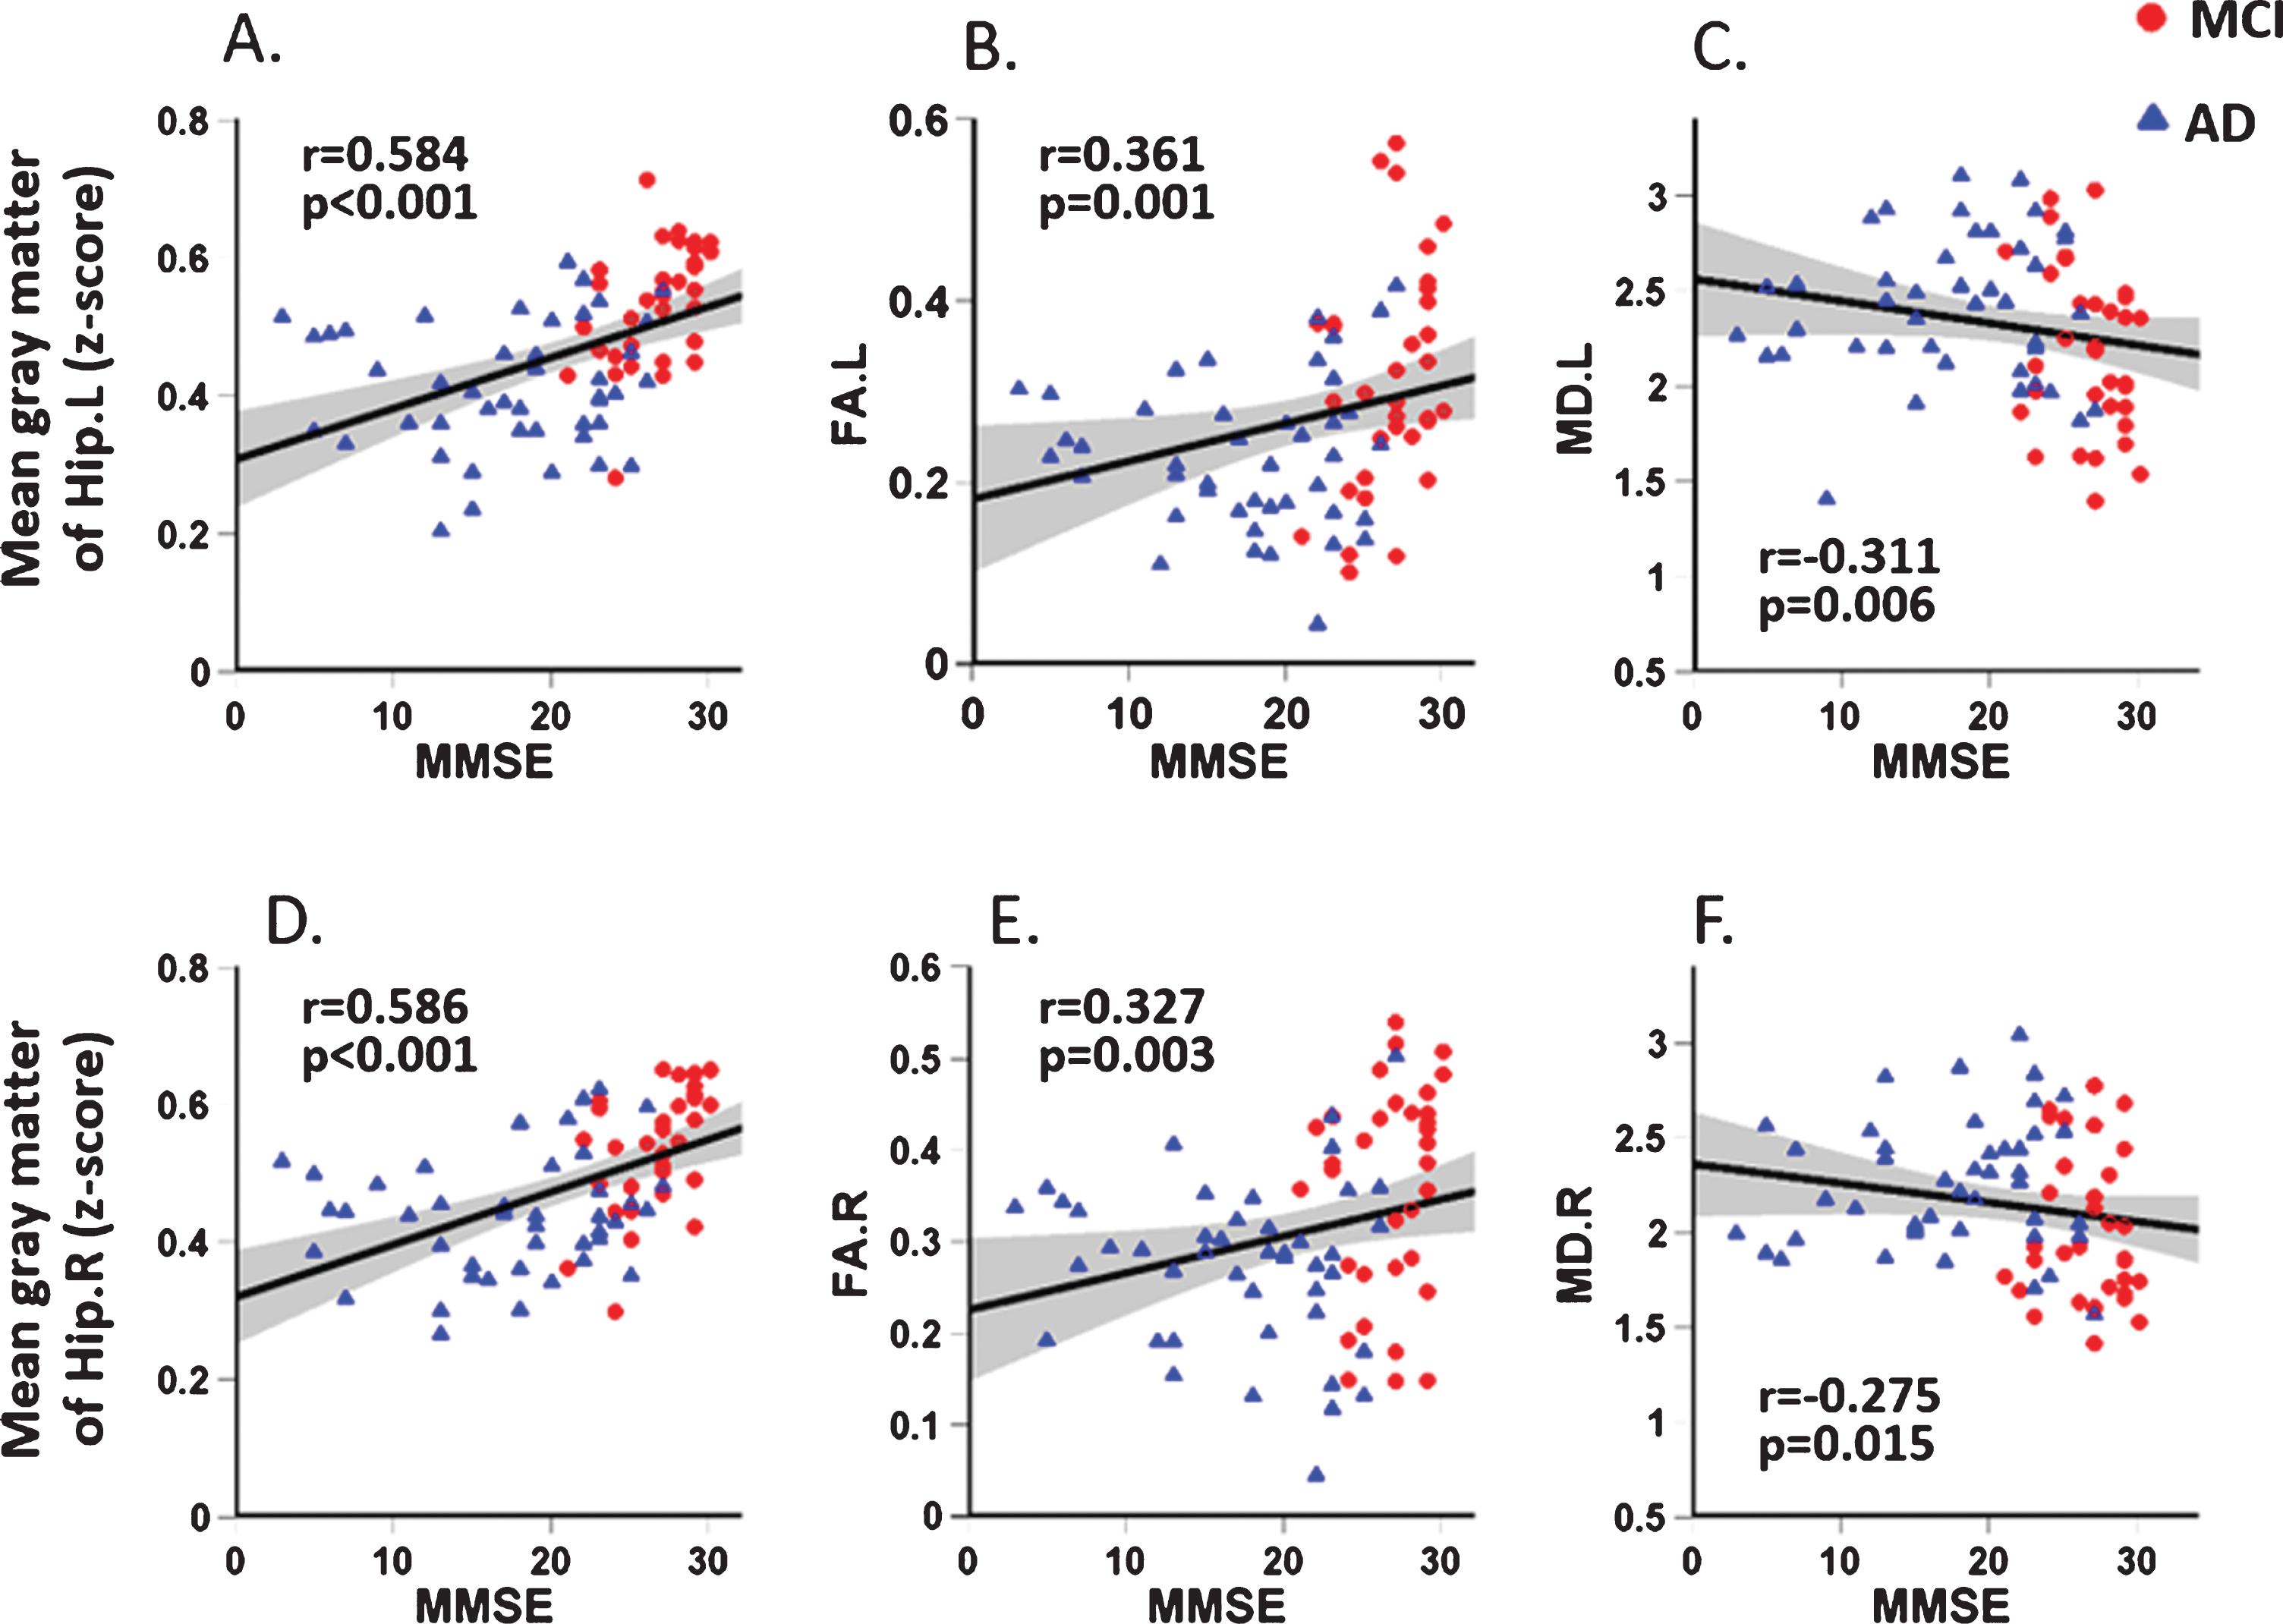
Correlation between MMSE scores and the mean gray matter of the left and right hippocampi and the parameters of the bilateral fornix (FA and MD) in both MCI and AD patients. A–C for the left side. D–F for the right side.
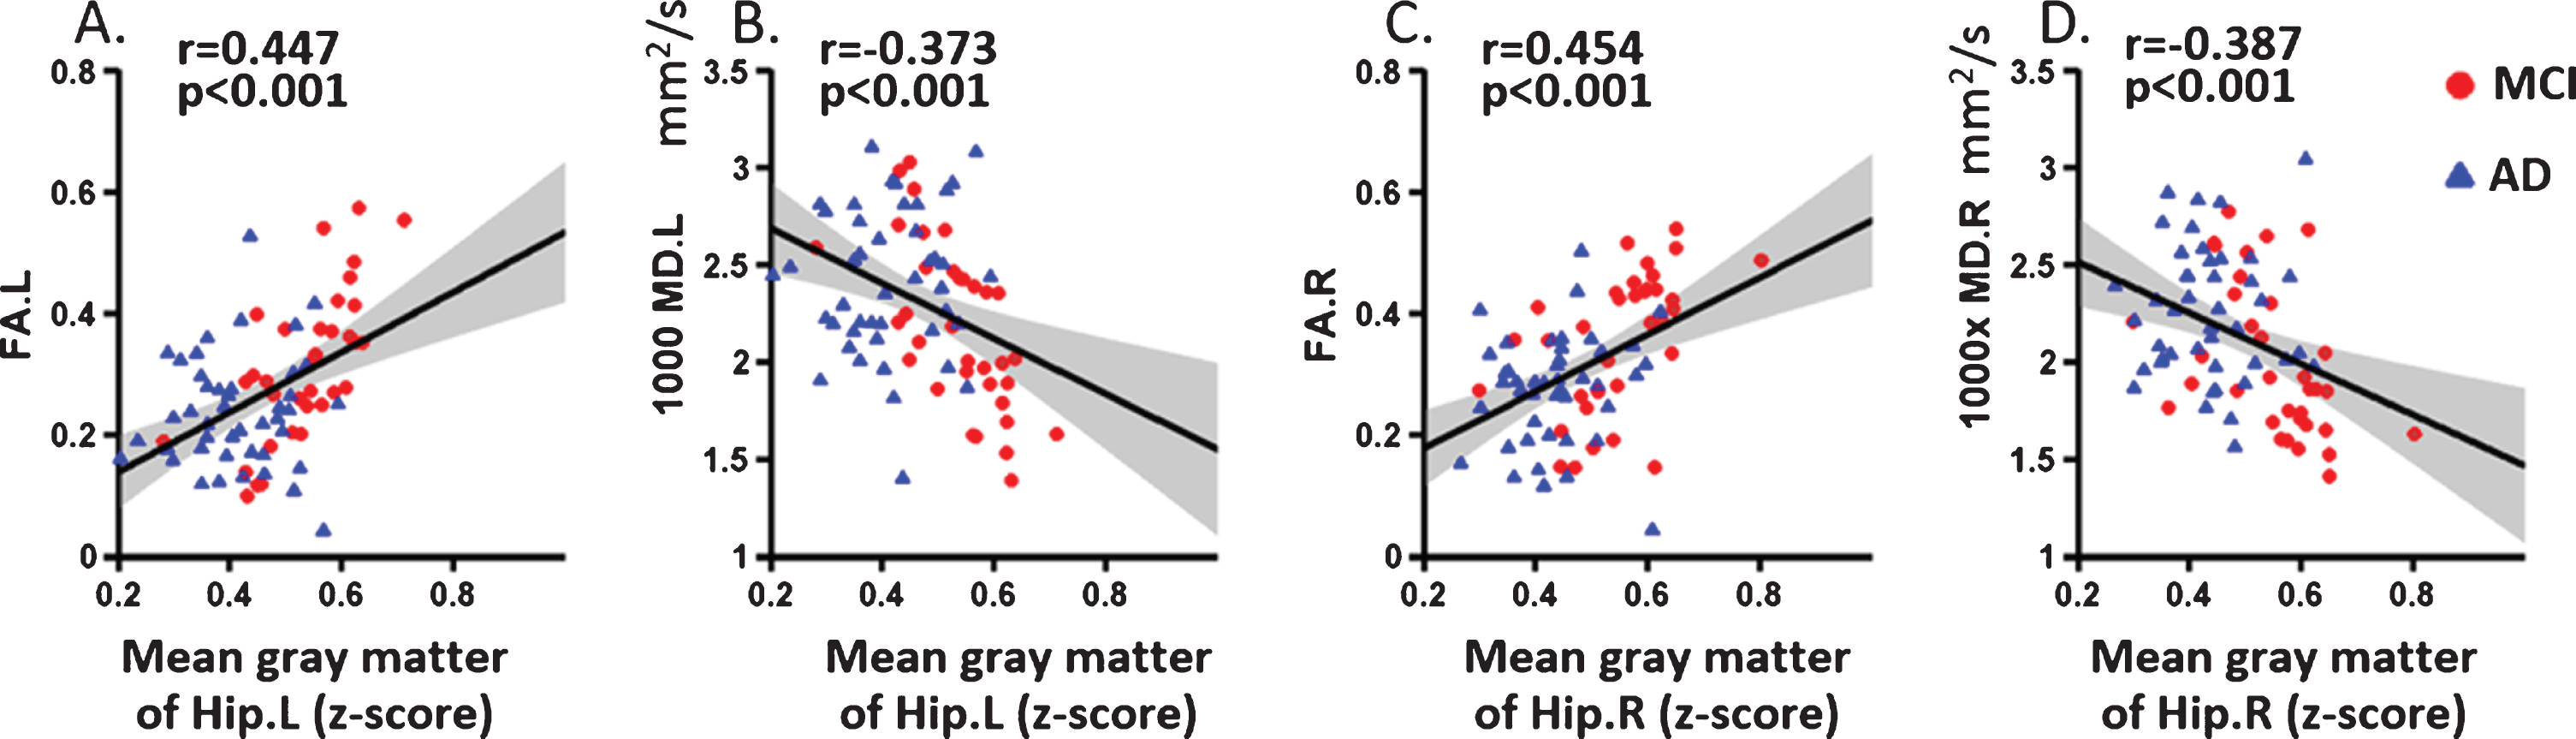
The correlation between the mean gray matter of the hippocampus and the integrity of the fornix (FA and MD) in both MCI and AD patients. A-B for the left side. C-D for the right side.
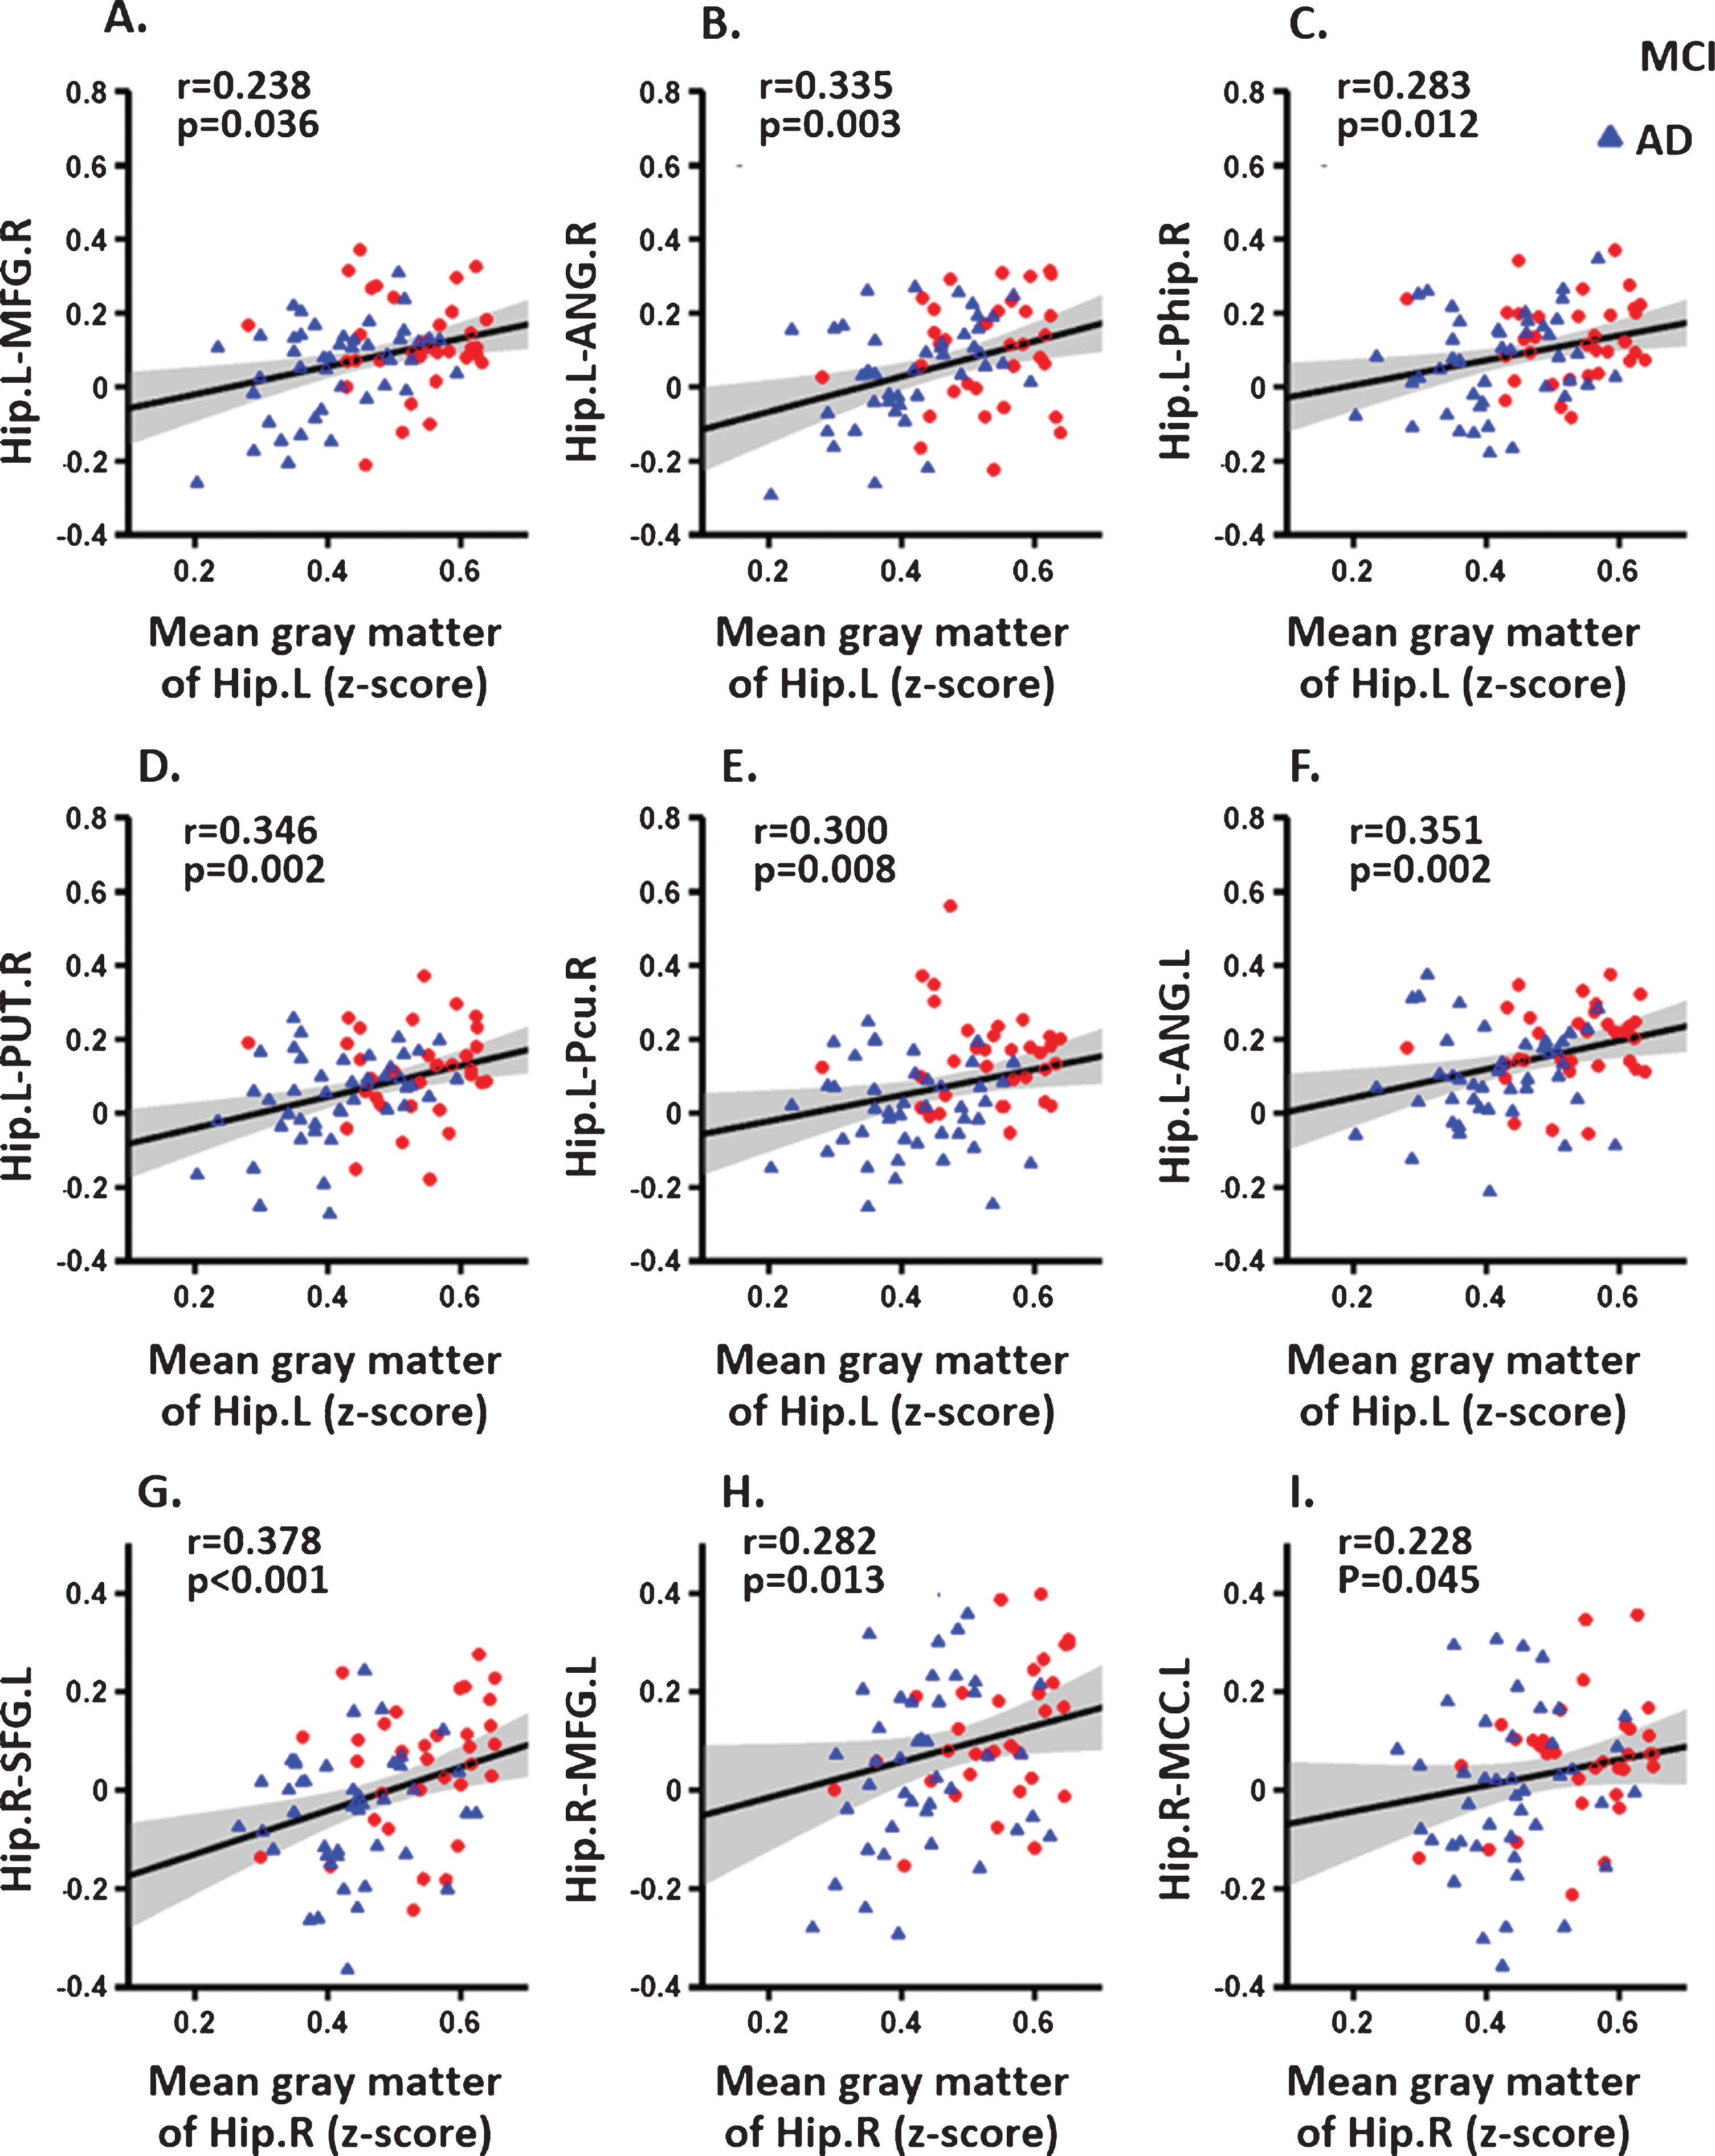
Correlation between the mean strength of the FC and the mean gray matter of the hippocampus in the patient groups. A–F for the left hippocampus. G–I for the right hippocampus.
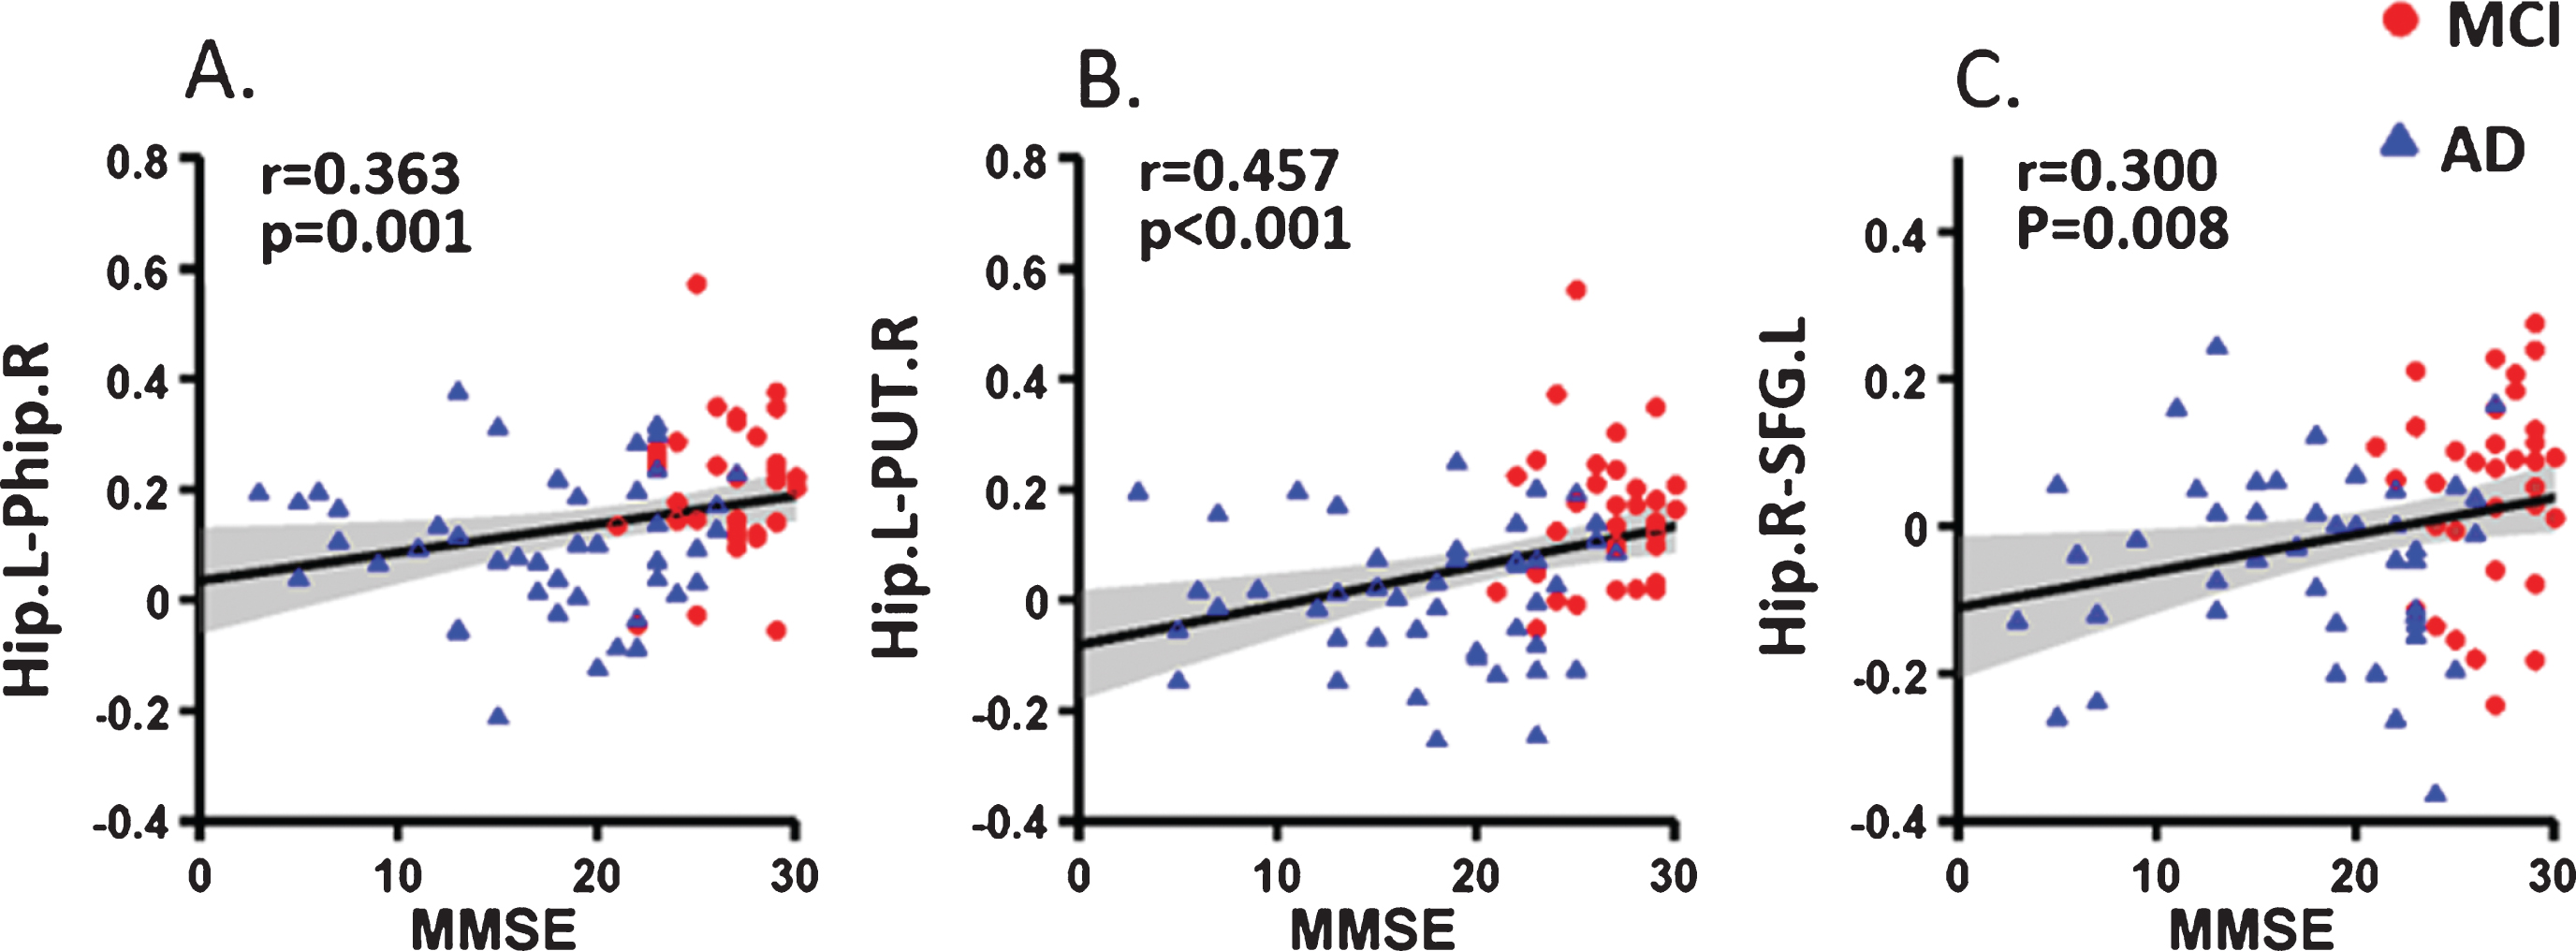
Correlation of hippocampal FC mean strength with MMSE scores in the patient groups. A) left hippocampus to the right parahippocampus; B) left hippocampus to the right putamen; C) right hippocampus to the left superior frontal gyrus.
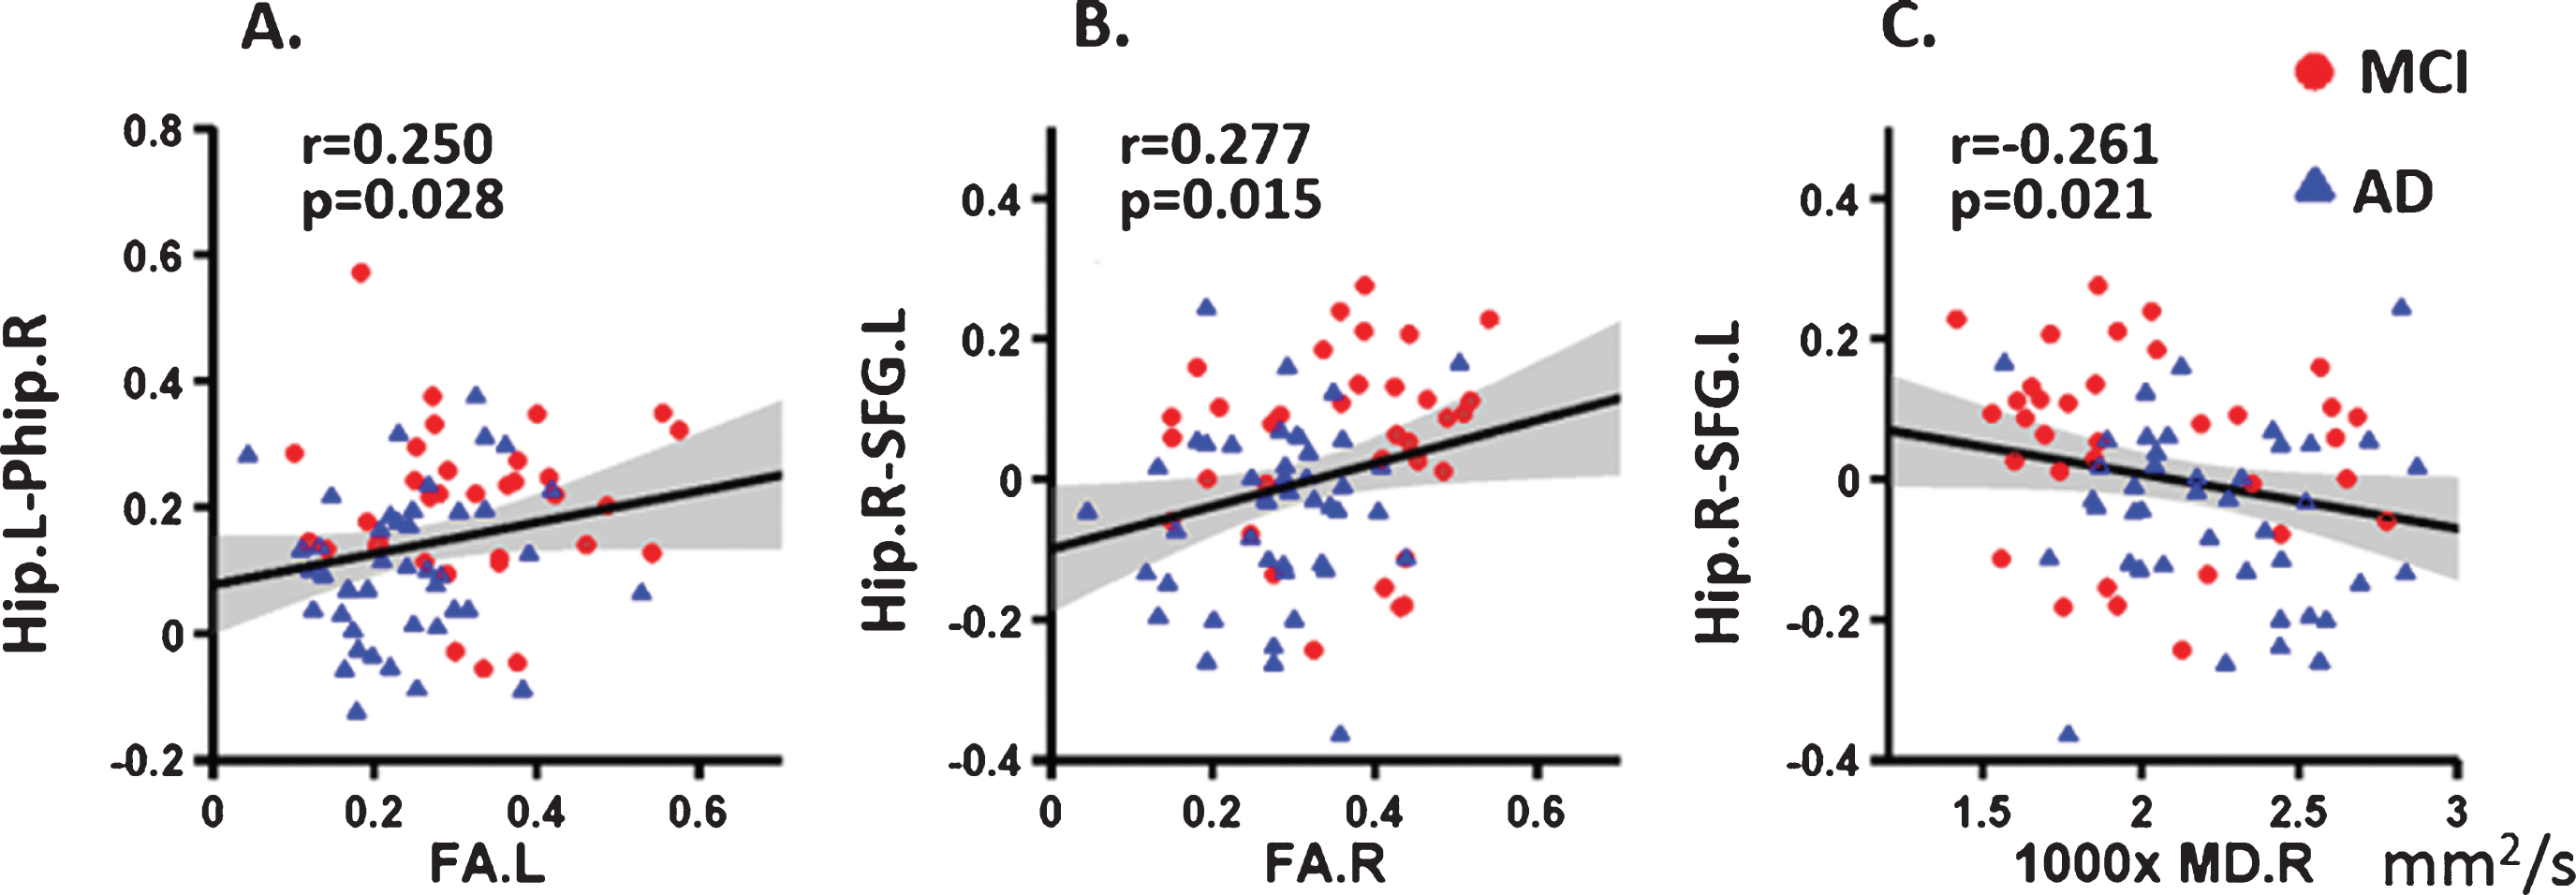
Correlation of hippocampal FC mean strength with the integrity of the fornix in the patient groups. A) left hippocampus to the right parahippocampus; B) right hippocampus to the right superior frontal gyrus; C) right hippocampus to the left superior frontal gyrus.
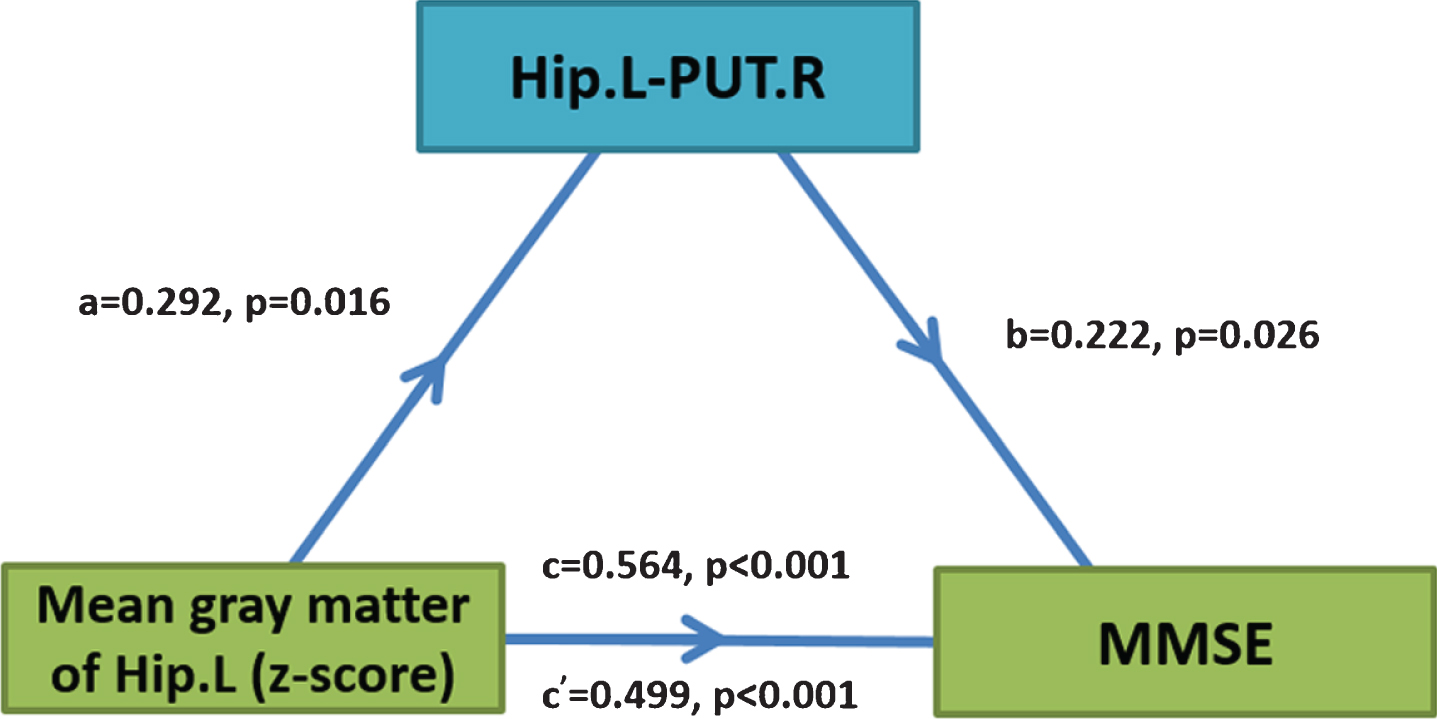
Diagrams showing statistical mediation of the relationship between mean gray matter volume of the left hippocampus and cognitive function by functional connectivity (Hip.L-PUT.R). Mediation analysis was performed to examine the potential indirect relationship between mean gray matter volume (X) and MMSE score (Y) via the overall functional connectivity (M). In each model, age, sex, years of education, and total brain volume were entered as covariates. Path a and path b indicate the association between mean gray matter volume and the MMSE score, and the FC variable and cognition, respectively. Path c represents the total effect of mean gray matter volume on cognition, and path c’ shows the direct effect of mean gray matter volume on cognition after controlling for the FC variable as a mediating factor. X, predictor variable; Y, outcome variable; M, mediator.
DISCUSSION
In the present study, we examined the relationship between MRI measures, including hippocampal volume and connectivity, and their relation to fornix integrity and cognition ability in patients with aMCI, AD, and age-matched controls. Notably, each part of the results in the present study has been analyzed in various previous studies in AD and/or MCI patients, including altered hippocampus connectivity [11 , 46], impaired fornix white matter structure [19], and changes in hippocampal volume [25 , 47]. To our knowledge, for the first time, this study combined structural, functional, and diffusion MRI to study the decoupling of anatomical disruptions and altered functional connections and may serve as a new reference for understanding brain network changes in aMCI/AD. Together, the correlations among the microstructure of the fornix, gray matter volume, and cognitive ability suggest that the fornix plays an important role in cognitive function, which is with disease progression in AD/aMCI. Our results clearly demonstrated disease-related functional and anatomical changes of the hippocampus and fornix, suggesting that the disruption of hippocampal connections with the remote cortical regions is associated with altered white matter integrity of the fornix in aMCI and AD patients.
Altered hippocampal FC in AD
Consistent with previous studies, the present study identified reduced FCs between the bilateral hippocampi and several important brain regions in patients with aMCI and AD. Notably, most of the identified brain regions, such as the PCC/Pcu, ANG, medial prefrontal lobe, and Phip, are the main components of the default mode network (DMN). The DMN plays a vital role in episodic memory processing and has been hypothesized to be associated with cognitive decline in AD [11 , 48–51]. These regions have been shown to have amyloid plaque deposits [52, 53], volume changes [52, 54], hypometabolism [55], and dysfunction [56, 57] at the early stage of AD. Therefore, the DMN has been considered to be one of the basic networks of AD-related pathophysiology [58]. The present study provides additional evidence to confirm the damaged connectivity between the DMN and the hippocampus in AD [11, 12]. Importantly, the strength of this impaired hippocampal FC was significantly correlated with hippocampal gray matter changes and white matter integrity, further suggesting that the hippocampus is the structural basis of the altered FC in AD. In summary, this study further demonstrated that the functional changes between the hippocampus and DMN might be a significant pathophysiological mechanism in AD, supporting the disconnection hypothesis of AD.
In addition to the regions of the DMN, we also found changes in connectivity between the PUT and hippocampus in AD and aMCI subjects. Indeed, amyloid deposits and reduced volume of the putamen have been observed in the early disease process in AD [59, 60]. Recent literature has also shown that the putamen is active in probabilistic learning [61, 62] and working memory [63]. All of these findings suggest that the degeneration of deep gray matter structures, in addition to the hippocampus, might also occur in the process of AD and may contribute to cognitive deterioration.
It is well known that averaging fMRI signals across all voxels is defined as the global brain signal. The global brain signal might, to a large extent, reflect non-brain activity noise (such as physiological activity and head movement) [64, 65]. To date, controversy persists regarding whether the global brain signal should be removed during data preprocessing. To evaluate the effects of the global brain signal, Pearson correlation of the average time series of the bilateral hippocampi were calculated with and without the global mean signal. The results showed that the mean correlation coefficients were larger than 0.7 for the bilateral hippocampi (Supplementary Figure 6). The F-maps with the global mean signal also showed a higher correlation (R > 0.4), and the regions of significant differences among the groups showed large overlap with or without the global mean signal (Supplementary Figure 7). Therefore, we speculate that the significant differences in hippocampus connectivity observed among the groups are likely meaningful and reliable.
The integrity of the fornix
In patients with AD relative to those with aMCI and NCs, the white matter measures (FA, MD, AxD, RD) showed significant and disease-associated alterations in the bilateral fornix. DTI-derived measures such as FA and MD are widely used to quantify the integrity of tissue microstructure and fiber organization [66]. The decreased FA and increased MD results in the present study suggest microstructural degradation of white matter in AD [67, 68]. However, FA and MD permit only a simplified description of water diffusion, and neither is particularly well suited for elucidating the underlying mechanism of white matter injury. We further studied changes in directional diffusivity (RD and AxD) in the fornix of AD and aMCI subjects. RD describes the mean magnitude of water diffusion perpendicular to the axon tracts, and increased RD is thought to be an indicator of myelin breakdown [24, 69]. A previous study found that AD subjects showed increased RD in the temporal, parietal, and frontal regions, and these measures were correlated with cognitive ability [15, 70]. Therefore, the increased RD in the fornix might imply demyelination as a mechanism for AD in the present study. AxD is a measure of parallel diffusivity, and some experimental studies have demonstrated a link between decreased AxD and axonal damage or the loss of fiber tracts [71]. It has been hypothesized that after fiber degeneration, the fragmentation of axons creates barriers to the longitudinal displacement of water molecules, resulting in an initial decrease of AxD. This cellular debris is subsequently cleared by microglia, reestablishing diffusion parallel to the remaining axons that results in an increase in diffusion in the longitudinal direction, thus also increasing AxD. In this study, AD patients showed increased AxD compared with NC and aMCI subjects, which is also supported by previous studies [72, 73]. One reason for this phenomenon might be that the activation of microglial cells within an inflammatory process following axonal damage can contribute to the clearance of axonal fragments, thus facilitating the longitudinal diffusion of water molecules and the corresponding increase in AxD [74]. Another possible explanation is that axonal atrophy may lead to increased extra-axonal space, which allows water molecules to move faster parallel to the axons, eventually leading to increases in AxD in AD patients [75]. It should also be noted that the contradictory findings in AxD should be interpreted with caution, and large-scale prospective, follow-up studies are needed. Taken together, these results indicate that the microstructural changes of the fornix were a combined response to myelin degeneration and axonal injury and might also be related to the decreased activity of hippocampal neurons in AD patients.
The relationship between FC and microstructural white matter integrity
The brain is organized as an effective functional network in which complex systems with different functional areas are segregated. The early pathological changes of AD occur in the entorhinal cortex (including the hippocampal structure) and then are observed throughout the limbic system. The fornix provides the main input into the hippocampus, and the hippocampus-fornix connection is an important component of the Papez circuit [76]. The Papez circuit, which involves the hippocampus, fornix, mammillary bodies, anterior thalamic nuclei, and PCC, is critical for episodic memory. Episodic memory decline is one of the earliest cognitive deficits in AD, and connectivity changes in the Papez circuit may be used for early risk detection for AD [77]. The fornix is the main efferent fiber in the hippocampus and connects the hippocampus and subcortical structures of the brain. The fibers of the fornix are also the main output circuit that transfer information from the hippocampus to the anterior thalamic nuclei, mammillary bodies, striatum, and prefrontal cortex [76]. Hippocampal information might be integrated through the commissure of the fornix and then pass directly through the parahippocampal gyrus and the hippocampus [78]. Our findings are also in concordance with those of other previous works. For example, Kehoe and colleagues found that there was a significant positive association between diffusion in the fornix and the FC of the thalamus and hippocampus in older healthy controls [21]. Teipel and colleagues found hypoactivation in posterior brain areas during working memory accompanied by reduced FA in intra-cortical projecting fiber tracts in AD/aMCI subjects [79]. In addition, some studies have found that white matter integrity might be the basis for normal cognition [80]. The concurrence of hippocampal FC abnormalities and changes in white matter integrity of the fornix suggests an anatomical-functional relationship to a certain extent and may provide the structural basis for theoretical models of cognitive decline in AD.
It is worth noting that the changes in aMCI and AD hippocampal FC and the abnormalities in fornix integrity were more significant on the left side. Previous voxel-based gray matter volume studies showed that alterations of the left hippocampus were more obvious than those of the right hippocampus in AD patients [7, 81]. Functional imaging studies have also shown that there is asymmetry in hippocampal metabolism, amyloid plaques, senile plaques and neurofibrillary tangles [82, 83]. Our results are in good agreement with those of the above studies, suggesting that there is asymmetry in hippocampal function and structure.
Limitations
Several limitations should be noted in this study. First, the present study clarified the relationship among the gray matter volume of the hippocampus, the FC of the hippocampus, the white matter integrity of the fornix and cognitive ability as measured by the MMSE in AD and aMCI groups. Notably, the present study did not find significant alterations in the white matter integrity of the fornix in aMCI subjects, unlike the observed altered FC of the hippocampus. This might be because the aberrant hippocampal FC patterns may precede the structural alterations during the progression of AD pathology [84]. Additionally, fiber connectivity abnormalities might lead to a decrease in the efficiency of information transmission among different regions, leading to a decrease in the functional connection. Meanwhile, neuronal soma injury also leads to the degeneration of white matter tracts. Hence, the causal relationship between them is not yet clear although we found that FC (especially Hip.L-PUT.R FC) likely mediates the relationship between the altered gray matter volume and cognitive ability. Second, we only evaluated the white matter integrity of the fornix based on a given brain atlas, which might underestimate the relationship between the alterations in FC and microstructure. Third, the present study includes a series of bivariate correlations among FC, gray matter volume, and white matter integrity (FA, MD, RD AxD) measures and some of these associations are weak (p uncorrected) and exploratory. Hence, with the further development of MRI techniques and DTI data with a high signal-to-noise ratio, a good tractography method might enable us to simultaneously analyze FC and structural fibers and then evaluate the exact relationship between the FC and microstructural alterations. Lastly, not all the subjects’ diagnosis of AD and aMCI was established using AD biomarkers, which reduces the diagnostic accuracy for patients [85, 86]. Additionally, a large-scale, prospective, independent follow-up study with AD biomarkers may be needed to investigate the functional-anatomical relationship [87, 88].
Conclusion
In addition to the altered gray matter volumes, reduced FCs of the hippocampus and impaired white matter properties in the fornix in AD, the present study showed a significant correlation among the FC of the hippocampus, gray matter volume, and the microstructure of white matter in AD, suggesting that the Wallerian-like degeneration of fornix axons might be secondary to AD-related hippocampal neuronal soma injury. The combined use of structural MRI, DTI, and fMRI may advance our understanding of the altered neural function, potential changes in white matter tracts, and the relationship between structural and functional brain networks in AD. Taken together, these findings have significant implications for diagnostics and modeling and provide insights for understanding the disconnection syndrome in AD.
Footnotes
ACKNOWLEDGMENTS
We appreciate all the subjects for their time.
This work was partially supported by the National Key Research and Development Program of China (No. 2018YFC2001700), the National Natural Science Foundation of China (Grant Nos. 81871438, 81901101, 81871398, 81471120), the Strategic Priority Research Program (B) of the Chinese Academy of Sciences (Grant No. XDBS01020200), the Natural Science Foundation of Tianjin (Grant No. 19JCQNJC10400), and Beijing Municipal Science & Technology Commission (Grant No. Z171100000117001).
Availability of data and materials
The datasets used and/or analyzed during the current study are available from the corresponding author upon reasonable request.