
Abstract
Background:
The hippocampus, entorhinal cortex, and basal forebrain are among the first brain structures affected by Alzheimer’s disease (AD). They play an essential role in spatial pattern separation, a process critical for accurate encoding of similar spatial information.
Objective:
Our aim was to examine spatial pattern separation and its association with volumetric changes of the hippocampus, entorhinal cortex, and basal forebrain nuclei projecting to the hippocampus (the medial septal nuclei and vertical limb of the diagonal band of Broca – Ch1-2 nuclei) in the biomarker-defined early clinical stages of AD.
Methods:
A total of 98 older adults were recruited from the Czech Brain Aging Study cohort. The participants with amnestic mild cognitive impairment (aMCI) due to AD (n = 44), mild AD dementia (n = 31), and cognitively normal older adults (CN; n = 23) underwent spatial pattern separation testing, comprehensive cognitive assessment, and MRI brain volumetry.
Results:
Spatial pattern separation accuracy was lower in the early clinical stages of AD compared to the CN group (p < 0.001) and decreased with disease severity (CN > aMCI due to AD > AD dementia). Controlling for general memory and cognitive performance, demographic characteristics and psychological factors did not change the results. Hippocampal and Ch1-2 volumes were directly associated with spatial pattern separation performance while the entorhinal cortex operated on pattern separation indirectly through the hippocampus.
Conclusion:
Smaller volumes of the hippocampus, entorhinal cortex, and basal forebrain Ch1-2 nuclei are linked to spatial pattern separation impairment in biomarker-defined early clinical AD and may contribute to AD-related spatial memory deficits.
INTRODUCTION
Alzheimer’s disease (AD) is the most common age-related neurodegenerative disease characterized by gradual cognitive decline leading to dementia, where cognitive impairment interferes with daily functioning [1]. AD dementia is preceded by the pre-dementia stages: mild cognitive impairment (MCI) due to AD, where cognitive impairment does not interfere with daily functioning [2], and preclinical AD, the earliest stage characterized by the presence of clinically asymptomatic AD neuropathological changes [3]. Among AD-related cognitive impairment, episodic and spatial memory deficits have been identified as the early cognitive markers of the disease [4 –6]. Pattern separation plays a key role in accurate memory encoding of verbal and non-verbal information, thus allowing for subsequent accurate recall. It is a process of encoding of similar inputs as non-overlapping representations (memories) so that they can be recalled separately from each other [7 –9]. This also applies to spatial pattern separation, the process that is essential for encoding of similar spatial information during spatial navigation. Spatial pattern separation is important for encoding and subsequent recall of locations within short-term and long-term memory [10] when interference between spatial information is high (for example, when recalling where parking today versus where parking yesterday), but may not be needed for encoding of spatial information that does not share similar contextual features [9].
Pattern separation processes strongly depend on the hippocampus, especially on the dentate gyrus and its mossy fiber connections to the hippocampal CA3 region [11, 12]. The major input to the hippocampus is the perforant path, which projects from the entorhinal cortex [13]. Two subregions of the entorhinal cortex that are part of two distinct information-processing pathways have been identified. The anterolateral entorhinal cortex receives input from the perirhinal cortex and is required for processing of object information (object discrimination), whereas the posteromedial entorhinal cortex receives input from the parahippocampal cortex and is required for processing of spatial information (spatial discrimination) [14]. These two pathways converge in the hippocampus and contribute to object and spatial pattern separation processes. Pattern separation in the hippocampus is basically modulated by acetylcholine levels, i.e., high levels of acetylcholine bias pattern separation-completion dynamics toward pattern separation [12]. Acetylcholine decreases activity of recurrent collaterals in the CA3 region through presynaptic inhibition, and increases mossy fiber neurotransmission and activity in the dentate gyrus, which is more responsive to perforant path stimulation from the entorhinal cortex [15], thus by all of these mechanisms increasing discrimination ability. Conversely, low levels of acetylcholine bias pattern separation-completion dynamics away from pattern separation and decrease discrimination ability through increased activity of the CA3 recurrent collaterals and decreased mossy fiber neurotransmission [12]. The major source of acetylcholine is the basal forebrain, whose specific nuclei, the medial septal nuclei together with the vertical limb of the diagonal band of Broca (Ch1-2 nuclei), provide cholinergic projections via the fimbria to the hippocampus [16]. Lesions of the cholinergic fornical projections were found to result in less effective spatial pattern separation processes [17].
Aging is associated with less efficient pattern separation. This was demonstrated by a number of studies comparing young and older adults in object [18 –20] and spatial [8, 21] discrimination tasks, where more pronounced age-related impairment was observed in object than in spatial pattern separation abilities [8]. Age-related pattern separation decline was associated with structural and functional changes in the hippocampal network and its inputs, including but not limited to CA3/dentate gyrus network hyperactivity [20], dentate gyrus/CA3 representational rigidity (this is weaker activation in response to more similar stimuli) [22], volumetric [23] and microstructural changes in the dentate gyrus/CA3 region, and perforant path integrity [22]. Another hypothesized mechanisms contributing to age-related pattern separation decline are decreased acetylcholine modulation as a result of degraded cholinergic projections from the basal forebrain to the hippocampus [24] and impaired information processing in the anterolateral entorhinal–perirhinal cortical pathway [25].
Pathological aging is associated with more prominent pattern separation deficits than normal aging. This was demonstrated by studies using a visual object discrimination task, where cognitively unimpaired older adults had more accurate pattern separation abilities than their peers with worse memory performance (lower delayed word list recall scores) [18] and those meeting clinical criteria for amnestic MCI (aMCI) (i.e., individuals with impaired memory function but no decline in activities of daily living) [18, 26]. In aMCI, pattern separation performance was linked to decreased activity in the entorhinal cortex and hyperactivity in the CA3/dentate gyrus [26]. The CA3/dentate gyrus hyperactivity in aMCI was attenuated under treatment with a low dose of the antiepileptic drug, which led to improved performance in a visual object discrimination task [27, 28]. Thus, these studies provided evidence that hyperexcitability in the CA3/dentate gyrus network is a reversible condition, which may underlie object discrimination impairment in cognitively impaired older adults. Older adults with worse memory performance also showed pattern separation impairment in spatial discrimination tasks [8 , 29] that was more pronounced in carriers of the apolipoprotein E ɛ4 allele [30], which is a genetic risk factor for sporadic AD [31]. However, structural and functional neural changes underlying spatial pattern separation impairment have not been investigated.
Results of the previous studies clearly showed more pronounced deficits in pattern separation abilities in older adults with subtle and clinically noticeable (i.e., in aMCI) memory impairment compared to their cognitively normal peers [18 , 29]. The studies also suggested that structural and functional changes in the hippocampal network and the entorhinal cortex, some of which could be potentially reversible, may underlie pattern separation deficits in older adults with lower memory performance [26, 27]. However, it should be noted that memory impairment in older adults, including those meeting the criteria for aMCI, may be due to several causes including various neurodegenerative diseases, not limited to AD, cerebrovascular diseases, mood disorders, systemic disorders and medications [32]. AD as the underlying disease causing memory impairment can be identified by using specific biomarkers [1, 2]. The biomarkers of AD have been used in two studies on pattern separation. The studies indicated object discrimination impairment in mild to moderate AD dementia [33] and amyloid-β and tau protein related pathological activity within the medial temporal lobe during a visual object discrimination task in cognitively normal older adults [34]. To our knowledge, pattern separation abilities, especially those including spatial discrimination, have not been investigated in biomarker-defined early clinical stages of AD (aMCI due to AD and mild AD dementia).
The AD neuropathological changes first occur in the transentorhinal and entorhinal cortex and very early spread to the hippocampus [35]. The hippocampus plays an essential role [12] in pattern separation and the entorhinal cortex plays there a modulatory role [12, 22] through the perforant path. Pattern separation impairment may therefore be present in the earliest clinical stages of AD and contribute to early accelerated decline of memory and spatial navigation in individuals with AD. The basal forebrain is one the first brain structures affected by AD neuropathological changes [36, 37]. The basal forebrain Ch1-2 nuclei are the major source of cholinergic projections to the hippocampus [16]. Pattern separation is modulated by acetylcholine levels [12]; however, no study to our knowledge has examined whether pattern separation abilities, especially those including spatial discrimination, are associated with structural changes in the basal forebrain including the Ch1-2 nuclei.
We used a previously published spatial pattern separation task [21] with adapted administration for cognitively impaired participants to assess: 1) the differences in spatial pattern separation in the biomarker-defined early clinical stages of AD (aMCI due to AD and mild AD dementia) compared to cognitively normal (CN) older adults, 2) the influence of spatial separation distance and time delay between presentation and recall on spatial pattern separation performance, 3) the associations of spatial pattern separation performance with hippocampal, entorhinal cortical, and basal forebrain Ch1-2 nuclei volumes, and 4) the role of hippocampal volume in these associations.
We hypothesized that: 1) the participants in the biomarker-defined early clinical stages of AD would have less accurate spatial pattern separation performance compared to the CN older adults, accuracy of the performance would be related to the disease severity, and differences in spatial pattern separation would not be explained by general memory or other cognitive deficits; 2) accuracy of spatial pattern separation would be reduced with increasing spatial interference (i.e., with smaller distance between presented objects) and would depend on time delay between presentation and recall; 3) smaller volumes of the hippocampus, entorhinal cortex, and basal forebrain Ch1-2 nuclei would be associated with lower accuracy of spatial pattern separation above and beyond global brain atrophy and demographic characteristics; and 4) given the essential role of the hippocampus in spatial pattern separation, hippocampal volume would mediate the pathway especially between entorhinal cortical volume and spatial pattern separation accuracy above and beyond global brain atrophy and demographic characteristics in the biomarker-defined early clinical stages of AD.
METHODS
Participants
Recruitment and inclusion criteria
A total of 98 participants were recruited from the Czech Brain Aging Study cohort [38] at the Memory Clinic of the Charles University, 2nd Faculty of Medicine and Motol University Hospital in Prague, Czech Republic and signed an informed consent approved by the local ethics committee [39]. The participants with early clinical AD were referred to the Memory Clinic by general practitioners and neurologists for memory complaints reported by themselves and/or by their informants. CN older adults were recruited from the University of the Third Age and from relatives of the participants and hospital staff.
All participants underwent clinical and laboratory evaluations, comprehensive cognitive assessment, brain magnetic resonance imaging (MRI), and completed a spatial pattern separation task. A subset of the participants with early clinical AD underwent a spinal tap with cerebrospinal fluid (CSF) collection and analysis of amyloid-β1–42. All data were collected within 60 days for each participant. The participants were classified into three groups: mild AD dementia, aMCI due to AD and CN older adults based on clinical criteria, information provided by the participants and their informants, cognitive and biomarker assessment. Participants with mild AD dementia (n = 31) met the clinical criteria for probable AD dementia outlined in recommendations from the National Institute on Aging and the Alzheimer’s Association workgroup [1] including insidious onset, history of worsening of cognition, evidence of cognitive impairment in at least two cognitive domains including memory (i.e., score lower than 1.5 standard deviations [SDs] below the age- and education-adjusted norms in any memory test and in at least one other non-memory cognitive test) and a significant impairment in activities of daily living. At the time of the assessment some participants were treated with acetylcholinesterase inhibitors (n = 12), selective serotonin reuptake inhibitors (SSRI) for depressive symptoms (n = 3), and with a combination of acetylcholinesterase inhibitors and SSRI (n = 4). Participants with aMCI due to AD (n = 44) met the clinical criteria for MCI due to AD outlined in recommendations from the National Institute on Aging-Alzheimer’s Association workgroups on diagnostic guidelines for AD [2] including memory complaints, evidence of memory impairment (i.e., score lower than 1.5 SDs below the age- and education-adjusted norms in any memory test), generally intact activities of daily living and absence of dementia. The group included participants with isolated memory impairment, single domain aMCI (n = 13), and participants with memory impairment and additional deficits in one or more other cognitive domains, multiple domain aMCI (n = 31). The participants with multiple domain aMCI usually had a combination of memory impairment and executive dysfunction (n = 12) and additional impairment of one or more cognitive functions (n = 19). Some participants were treated with acetylcholinesterase inhibitors (n = 9), SSRI for depressive symptoms (n = 4), and with a combination of acetylcholinesterase inhibitor and SSRI (n = 1). The pathophysiology of AD was supported by biomarker assessment in both AD groups. All participants had hippocampal atrophy on MRI (e.g., pathological Medial Temporal Lobe Atrophy [MTA] score) and thus they had at least intermediate biomarker probability of AD etiology. Participants who underwent a spinal tap (n = 37) had in addition positivity of amyloid-β (this is, low amyloid-β1–42 level in CSF) indicating high biomarker probability of AD etiology. This subgroup included participants with mild AD dementia (n = 15) and aMCI due to AD (n = 22). The subgroup was similar to those with intermediate biomarker probability of AD etiology in terms of all demographic and clinical characteristics but age, where amyloid-β positive participants in the mild AD dementia group were younger than those who did not undergo a spinal tap (71.1 versus 78.5 years). CN participants (n = 23) did not report any cognitive complaints, had cognitive performance within the normal range (i.e., score higher than 1.5 SDs below the age- and education-adjusted norms in any cognitive test). In addition, they had no evidence of hippocampal atrophy on MRI (i.e., normal MTA score) and did not have family history of AD or other type of dementia in the first-degree relatives. These stringent criteria were applied to minimize the possibility of including participants with preclinical and early clinical AD.
Exclusion criteria
Participants with depressive symptoms (≥6 points on the 15-item Geriatric Depression Scale [GDS-15]), anxiety (≥10 points on the Beck Anxiety Inventory [BAI]), low visual acuity (<20/40 [corrected] on visual acuity tests), moderate to severe white matter vascular lesions on MRI (Fazekas score >2 points) other primary neurological or psychiatric disorders were not included in the study. The biomarker evidence of AD pathology, including hippocampal atrophy on MRI (i.e., normal MTA score) and positivity of amyloid-β1–42 (i.e., low amyloid-β1–42 level in CSF), where available, was required for all participants with mild AD dementia and aMCI due to AD. The participants with mild dementia and aMCI with absence of hippocampal atrophy and those with CSF levels of amyloid-β1–42 above the internally validated cut-off value of 665 pg/ml [40] were not included.
Spatial pattern separation task
The spatial pattern separation task is a spatial memory task involving varying degrees of spatial interference to assess spatial pattern separation that was modeled after a delayed-match-to-sample for spatial location task used in rodents [41]. This task was adapted from the previous study [21] and was run on a computer with a 24″ monitor placed approximately 50 cm from the participant’s face. The spatial pattern separation scheme is presented in Fig. 1. There were no visual cues around the monitor that could be used to remember spatial locations of the stimuli. Each trial consisted of a sample phase followed by a choice phase. In the sample phase, the participants were instructed to remember the location of a blue circle on the screen. The circle measuring 2 cm in diameter appeared for 5 s in one of 18 possible locations within a nonvisible horizontal line across the middle of the screen. During the choice phase, two identical blue circles were displayed. One of the circles, the target circle, was in the same location as the original circle in the sample phase (correct choice). The foil circle was in a location that was either to the left or right from the original circle (incorrect choice). There were four possible spatial separations that were used to separate the target and foil circles during the choice phase: 0 (edges of the circles were touching), 0.5, 1.0, and 1.5 cm. During the choice phase, the participants had to identify the target circle by pressing a green button in the right hand if the target circle was the right one of the two circles, or pressing a red button in the left hand if the target circle was the left one. During a time delay of 10 s or 20 s between the sample and choice phases, the participants were instructed to look in the middle of the screen and to read aloud a randomly appearing string of numbers to prevent the participants from fixating the eyes on the location of the original circle. After the choice phase, the participants were again instructed to look in the middle of the screen where a little cross appeared for 3 s. The little cross separated each trial of the task. There were a total of 64 trials for the task, consisting of 32 trials with 10 s time delay and 32 trials with 20 s time delay. There were 8 trials for each separation distance (0, 0.5, 1.0, and 1.5 cm) in each time delay condition (10 s and 20 s). The whole task consisting of 64 trials was split into two sets of 32 trials, each lasting about 15 min, where spatial separation, target circle on a particular side (left or right) and time delay were pseudo-randomized. There was a five-minute break between these two sets of trials to minimize fatigue of the participants. Thus, it took approximately 35 min to complete the whole task.
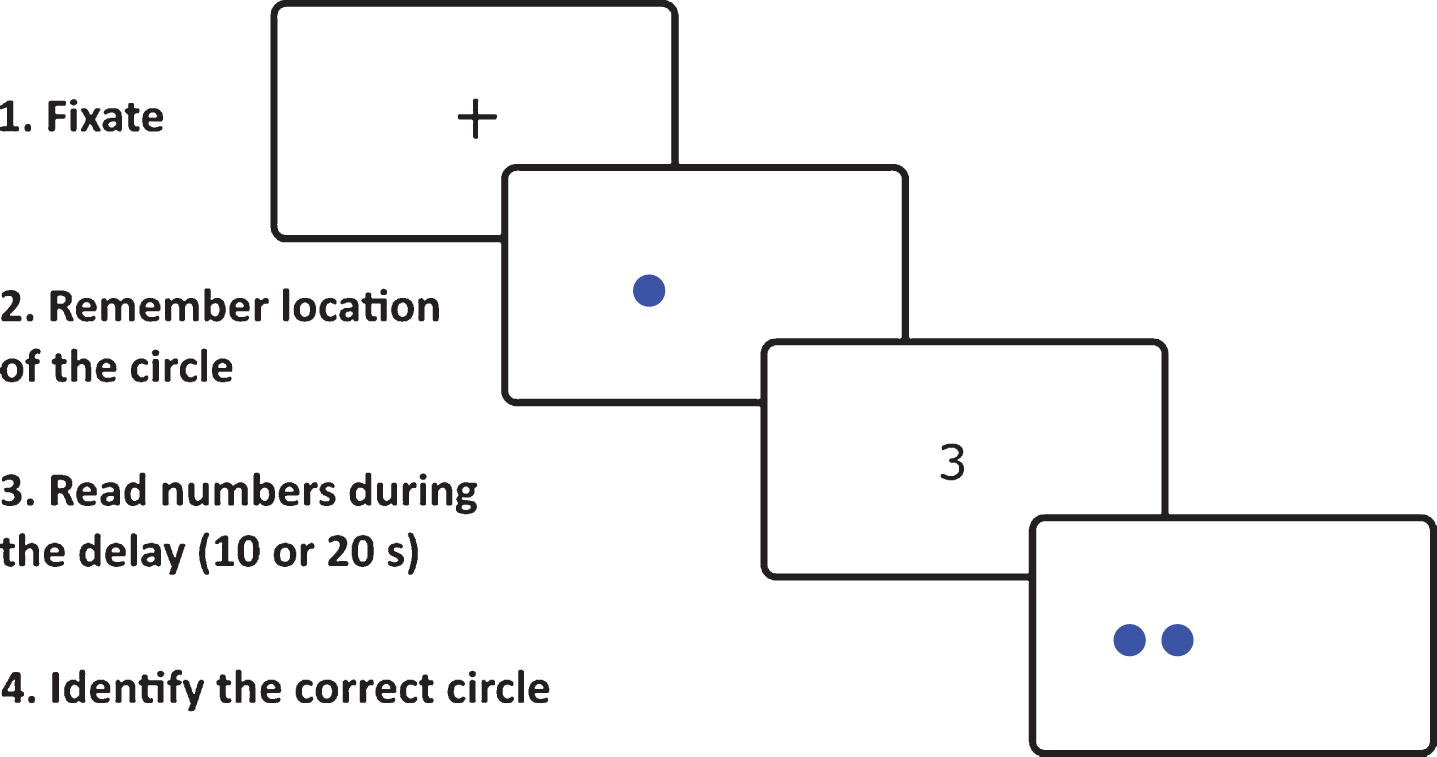
Example of spatial pattern separation task stimuli in one of 64 trials as seen by participants on the computer screen.
The original task [21] was adapted for cognitively impaired participants such that in addition to the original instructions all participants completed familiarization training consisting of four trials. This training was administered prior to the testing. Next, unlike reading a string of random letters while looking away from the screen that was performed in the original study [21], the participants in our study read aloud a randomly appearing string of numbers in the middle of the screen between the sample phase and the choice phase to prevent them from fixating the eyes on the location of the sample phase circle. We made this modification based on the results from the pilot study where looking away from the screen and back again was confusing for some of the participants with early clinical AD and reduced their adherence to the task.
Cognitive assessment
The cognitive assessment comprised the following tests: 1) verbal memory measured with the Logical Memory (LM) subtest of the Wechsler Memory Scale-Revised (Story I) – Immediate and Delayed Recall conditions and the Rey Auditory Verbal Learning Test (RAVLT) – trials 1–5 and 30-minute Delayed Recall trial; 2) non-verbal memory measured with the Rey-Osterrieth Complex Figure Test (ROCFT) – the Recall condition after 3 min; 3) visuospatial function measured with the ROCFT – the Copy condition and the Clock Drawing Test; 4) executive function measured with the Trail Making Test (TMT) B and Controlled Oral Word Association Test (Czech version with letters N, K and P); 5) attention and working memory measured with the Forward and Backward Digit Span subtests from the Wechsler Adult Intelligence Scale – Revised and TMT A; and 6) language measured with the Boston Naming Test (BNT, 30-item version). The Mini-Mental State Examination (MMSE) was administered to measure global cognitive function. The GDS-15 and BAI were used to assess depressive symptoms and anxiety among participants. The neuropsychological tests were administered by three trained neuropsychologists. Group-wise neuropsychological characteristics are listed in Table 1.
Characteristics of study participants
Demographic, cognitive, and MRI characteristics. Values are mean (SD) except for gender. p refer to the main effect across all groups. For p values indicating the level of significance compared with CN group: *p < 0.05; **p < 0.01; ***p < 0.001; compared with aMCI group: + p < 0.05; ++ p < 0.01; +++ p < 0.001. Effect sizes were calculated as Cramér’s V for the χ 2 test (gender) and partial eta-squared for one-way analysis of variance (all other variables). aNormalized to estimated total intracranial volume. CN, cognitively normal; aMCI due to AD, amnestic mild cognitive impairment due to Alzheimer’s disease; mild AD dementia, mild Alzheimer’s disease dementia; MMSE, Mini-Mental State Examination; GDS-15, Geriatric Depression Scale 15-item version; BAI, Beck Anxiety Inventory; LM-IR, Logical Memory I – Immediate Recall condition; LM-DR, Logical Memory I – Delayed Recall condition; RAVLT, Rey Auditory Verbal Learning Test; RAVLT 1-5, trials 1 to 5 total; RAVLT 30, word recall after 30 minutes; TMT A and B, Trail Making Tests A and B; COWAT, Controlled Oral Word Association Test (with letters N, K and P); ROCFT-C, Rey-Osterrieth Complex Figure Test – the Copy condition; ROCFT-R, Rey-Osterrieth Complex Figure Test – the Recall condition after 3 minutes; DSF, Digit Span Forward total score; DSB, Digit Span Backward total score; BNT, Boston Naming Test; Ch1-2, the medial septal nuclei and the vertical limb of the diagonal band of Broca; MRI, magnetic resonance imaging.
MRI acquisition and analysis
We used the established MRI protocol [42], where the brain scans were performed on a Siemens Avanto 1.5T scanner (Siemens AG, Erlangen, Germany) employing a 12-channel head coil. T1-weighted 3-dimensional high-resolution magnetization-prepared rapid gradient echo (MP-RAGE) sequence with the following parameters were used: TR/TE/TI = 2000/3.08/1100 ms, flip angle = 15°, 192 continuous partitions, slice thickness = 1.0 mm and in-plane resolution = 1 mm. Scans were visually inspected to ensure appropriate data quality and to exclude participants with a major brain pathology that could interfere with cognitive functioning. Hippocampal atrophy was evaluated on coronal T1-weighted images at the level of the anterior pons using the MTA visual scale. We used the previously established age-specific MTA cut-off scores for hippocampal atrophy – MTA score ≥2 points for participants ≤75 years and ≥3 points for participants >75 years [43]. The final MTA score was based on the agreement of 2 independent experienced rates.
FreeSurfer image analysis suite (version 5.3; http://surfer.nmr.mgh.harvard.edu/) was used to compute left and right hippocampal and entorhinal cortical volumes, total brain volume and estimated total intracranial volume (eTIV), the internal reference. The details of these procedures were described elsewhere [44 –46]. We followed the previously described protocol [47, 48] to compute volumes of the left and right basal forebrain nuclei. Images were processed using statistical parametric mapping (SPM8, Wellcome Trust Center for Neuroimaging) and the VBM8-toolbox (http://dbm.neuro.uni-jena.de/vbm/) implemented in MatLab R2015b (MathWorks, Natick, MA). As in the previous study [40], we used the basal forebrain mask based on a cytoarchitectonic map of the basal forebrain cholinergic nuclei aligned in MNI space, derived from combined histology and MRI of a postmortem brain [49, 50]. The mask consists of 6 basal forebrain regions: the nucleus basalis of Meynert – posterior (Ch4p) and combined anterior and intermediate (Ch4ai) parts, the horizontal limb of the diagonal band of Broca (Ch3), nucleus subputaminalis (NSP), interstitial nuclei (IN), and medial septal nuclei with the vertical limb of the diagonal band of Broca (Ch1-2). The cytoarchitectonic map was designed to fit into the standard MNI space. We non-linearly registered all the images into the MNI152 template and used the resulting DARTEL parameters [51] to warp the cytoarchitectonic map into individual brain scans. The volumes of the Ch1-2 nuclei projecting directly to the hippocampus [16] were extracted. The warps were visually assessed for accuracy and no volumes were removed. Hippocampal, entorhinal cortical, Ch1-2 nuclei, and total brain volumes were normalized to eTIV using the previously published regression formula [52]. Because of small volumes of the Ch1-2 nuclei and limited resolution of the scans, left and right Ch1-2 nuclei volumes were summed into a single measure of total Ch1-2 nuclei volume. Total hippocampal and entorhinal cortical volumes were also derived using this procedure. Group-wise MRI characteristics are listed in Table 1.
Data analysis
For continuous variables, a one-way analysis of variance (ANOVA) with post hoc Sidak’s test was used. For changes in proportion (gender), a χ 2 test was used. The Pearson’s correlation coefficients were calculated to explore the bivariate relationships. The 3×2×4 mixed factorial ANOVA with diagnostic group (CN versus aMCI versus mild dementia) as the between-subjects factor and time delay (10 s versus 20 s) and spatial separation (0 versus 0.5 versus 1.0 versus 1.5 cm) as the within-subjects factors was used to analyze accuracy of spatial pattern separation performance measured as the percentage of correct responses, which was the dependent variable. The post hoc planned polynomial contrasts were used to assess the effect of spatial separation in the whole sample. The post hoc Sidak’s test was used to compare average differences in spatial pattern separation performance between individual groups. The post hoc pairwise comparisons with Holm-Bonferroni correction for multiple comparisons were used to compare differences in spatial pattern separation performance between individual groups for each spatial separation and to interpret the significant interactions between variables.
The 3×2×4 mixed model ANCOVA with ROCFT Recall, LM, and RAVLT Delayed Recall scores sequentially entered into the model as covariates was conducted to address the possibility that differences between the diagnostic groups in the spatial pattern separation task may be explained by general memory deficits. Additional analyses controlled for other cognitive measures were also performed. Next, the 3×2×4 mixed factorial ANCOVA with age, gender, years of education, and GDS-15 and BAI scores simultaneously entered as covariates was conducted to address the possibility that differences between the diagnostic groups in the spatial pattern separation task may be influenced by demographic and psychological factors.
To assess the ability of the spatial pattern separation task to discriminate the CN group (reference) from the aMCI and mild dementia groups, the receiver operating characteristics (ROC) analysis was performed separately for 10 s and 20 s time delay conditions with calculation of the size of the areas under the ROC curves (AUCs), sensitivity and specificity. Significance of the differences between AUCs for 10 s and 20 s time delay conditions was also assessed.
The Pearson’s correlation coefficients were calculated to explore the bivariate relationships between total volumes of the hippocampus, entorhinal cortex and Ch1-2 nuclei and spatial pattern separation performance after 10 s and 20 s delay. Holm-Bonferroni correction for multiple comparisons was used in the correlation analysis. The subsequent multivariate linear regression analysis was used to control for the effect of total brain volume as a measure of global brain atrophy and demographic characteristics including age, gender and years of education.
To investigate whether hippocampal volume mediates the associations (pathways) between entorhinal cortical and Ch1-2 nuclei volumes and spatial pattern separation performance, the mediation analyses controlled for total brain volume and demographic characteristics were conducted using a bootstrapping technique [53]. Specifically, the mediation analyses were used to establish the extent to which total entorhinal cortical and Ch1-2 nuclei volumes influence spatial pattern separation performance after 10 s and 20 s through total hippocampal volume. We performed 4 separate mediation analyses to explore: 1) the association of total entorhinal cortical volume and spatial pattern separation performance after 10 s through total hippocampal volume, 2) the association of total entorhinal cortical volume and spatial pattern separation performance after 20 s through total hippocampal volume, 3) the association of Ch1-2 nuclei volumes and spatial pattern separation performance after 10 s through total hippocampal volume, and 4) the association of Ch1-2 nuclei volumes and spatial pattern separation performance after 20 s through total hippocampal volume.
In our mediation analyses (Fig. 2), a total effect (c) represents the association between total entorhinal cortical or Ch1-2 nuclei volumes (independent variables) and spatial pattern separation performance after 10 s or 20 s (dependent variables). The total effect is decomposed into two separate effects: 1) an indirect effect (a*b) – the association of total entorhinal cortical or Ch1-2 nuclei volumes and spatial pattern separation performance after 10 s or 20 s through total hippocampal volume (mediator variable) and 2) a direct effect (c’) – the direct association between total entorhinal cortical or Ch1-2 nuclei volumes and spatial pattern separation performance after 10 s or 20 s. The proportion mediated effect size (PM) representing how much of the association operates through a mediator variable was calculated as a ratio of the indirect effect to the total effect.
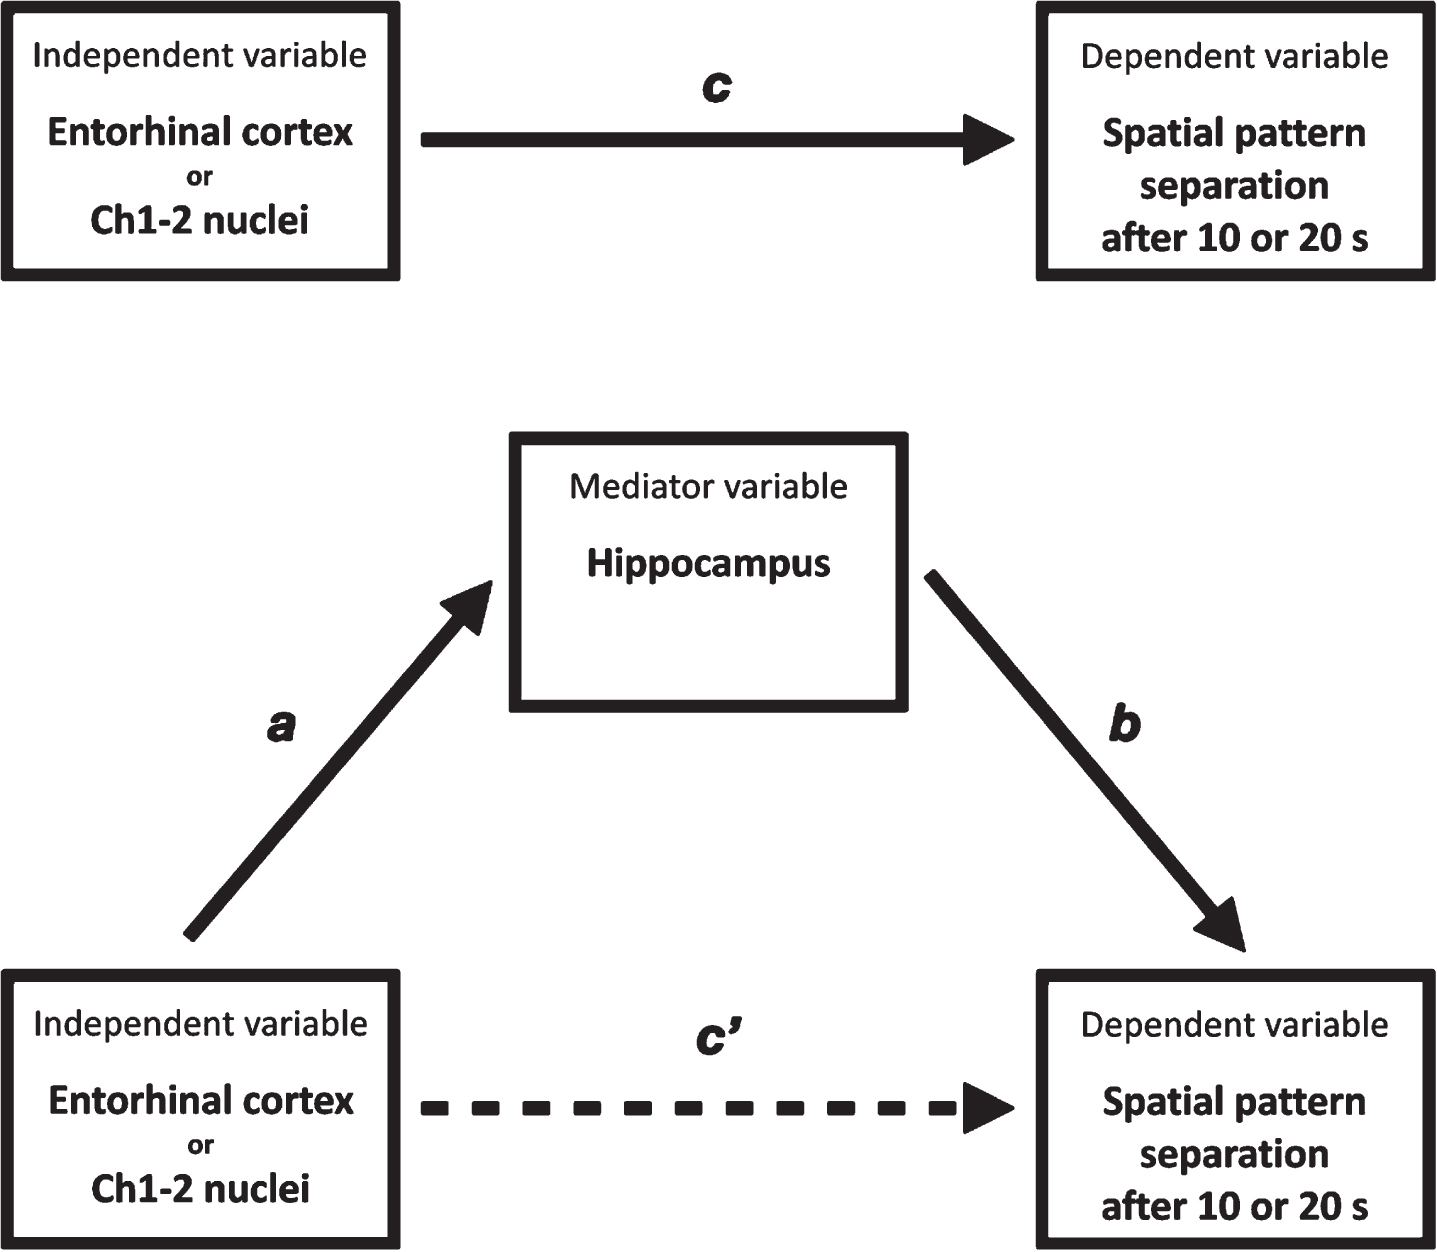
Mediation analysis. entorhinal cortex or Ch1-2 nuclei, Entorhinal cortical or Ch1-2 nuclei volumes; spatial pattern separation after 10 s or 20 s, spatial pattern separation performance after 10 s or 20 s; hippocampus, hippocampal volume; c) total effect of the independent variable on the dependent variable; c’) direct effect of the independent variable on the dependent variable controlled for the mediator variable; a, b) indirect effect of the independent variable on the dependent variable through the mediator variable.
Statistical significance was set at two-tailed (alpha) of 0.05. Effect sizes are reported using partial eta-squared (η p 2) for mixed factorial ANOVA and ANCOVA. Partial eta-squared of 0.2 corresponds to Cohen’s d of 1.0. All analyses were conducted using IBM SPSS for Windows version 20.0. Significance of the differences between the AUCs was calculated with the statistical tool on http://vassarstats.net/roc_comp.html.
RESULTS
Demographics
The demographic characteristics are presented in detail in Table 1. The CN group was younger than the aMCI due to AD (p < 0.001) and mild AD dementia (p < 0.001) groups and more educated than the mild AD dementia group (p = 0.002). There were no differences in gender proportion between the groups. As expected, aMCI due to AD and mild AD dementia groups had lower MMSE score (p < 0.001) and worse performance in most of the cognitive tests (p≤0.034) compared to the CN group. The mild AD dementia group reported higher level of depressive symptoms than the CN group (p = 0.031). There were no differences in level of anxiety symptoms between the groups. Spatial pattern separation performance after 10 s and 20 s delay correlated with all neuropsychological measures (r≥0.21, p≤0.040).
Spatial pattern separation
The mean percentage of correct performance for each spatial separation for the CN, aMCI due to AD, and mild AD dementia groups and for time delay of 10 s and 20 s are presented in Fig. 3. In the 3 (diagnostic group) × 2 (time delay) × 4 (spatial separation) mixed factorial ANOVA, there was a significant main effect of diagnostic group (F[2, 95] = 75.65, p < 0.001, η p 2 = 0.44), where on average, the aMCI due to AD (p < 0.001, 95% confidence interval [CI] [12.18, 22.76]) and mild AD dementia (p < 0.001, 95% CI [23.22, 34.54]) groups had less accurate spatial pattern separation performance than the CN group. Specifically, the CN group outperformed the aMCI due to AD (t(66)≥3.17, p≤0.002) and mild AD dementia (t(53)≥5.39, p < 0.001) groups at each of the spatial separations. The between-group differences at each of the spatial separations remained significant after Holm-Bonferroni correction for multiple comparisons. Also, on average, the mild AD dementia group had less accurate spatial pattern separation performance than the aMCI due to AD group (p < 0.001, 95% CI [6.56, 16.23]). Specifically, the aMCI due to AD group outperformed the mild AD dementia group at the 0, 1, and 1.5 cm spatial separations (t(74)≥2.60, p≤0.010). The between-group differences at the 0, 1, and 1.5 cm spatial separations remained significant after Holm-Bonferroni correction for multiple comparisons. The effect of time delay (10 s versus 20 s) and interaction between diagnostic group and time delay were not significant (F[1, 95] = 0.09, p = 0.761, η p 2 = 0.00 and F[2, 95] = 0.77, p = 0.465, η p 2 = 0.01). However, there was a significant main effect of spatial separation (F[3, 285] = 20.12, p < 0.001, η p 2 = 0.10). Specifically, there was a significant linear effect of spatial separation (F[1, 95] = 52.46, p < 0.001, η p 2 = 0.22) where, on average, as the spatial separation increased, the performance increased. The spatial separation-by-diagnostic group (F[6, 285] = 0.81, p = 0.565, η p 2 = 0.01), spatial separation-by-time delay (F[3, 285] = 1.29, p = 0.277, η p 2 = 0.01), and spatial separation-by-diagnostic group-by-time delay (F[6, 285] = 1.54, p = 0.162, η p 2 = 0.02) interactions were not significant.
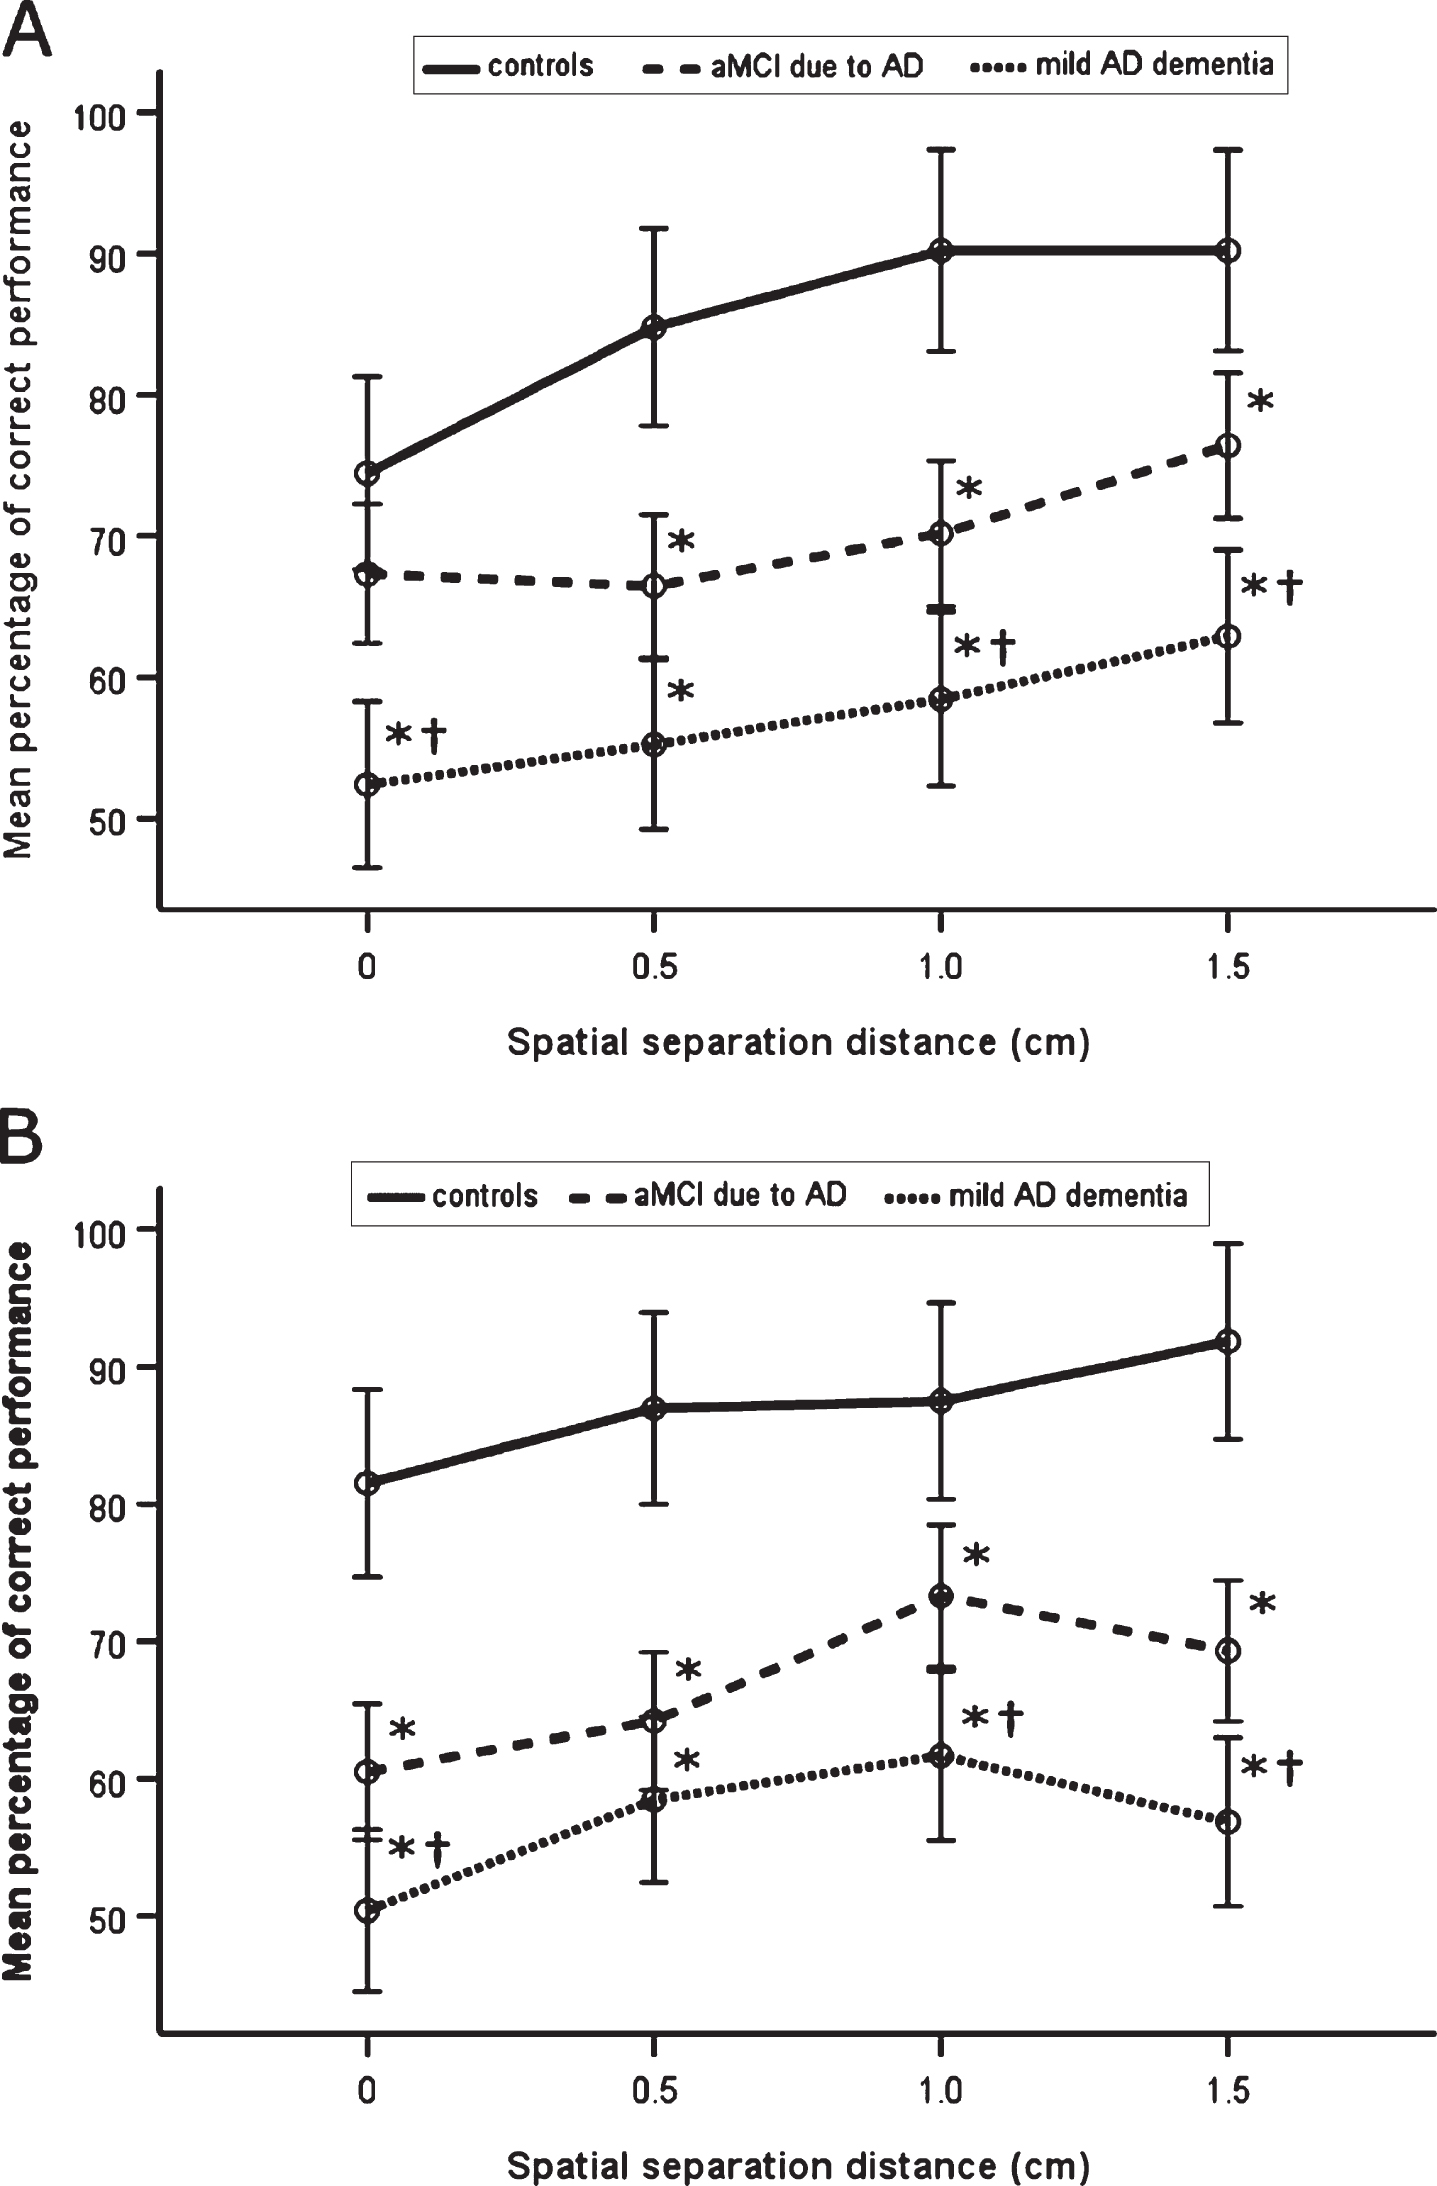
Spatial pattern separation performance. A) Mean percentage of correct performance for each spatial separation for time delay of 10 s. B) Mean percentage of correct performance for each spatial separation for time delay of 20 s. *p < 0.05 compared to the CN group; †p <0.05 compared to the aMCI due to AD group. aMCI due to AD, amnestic mild cognitive impairment due to Alzheimer’s disease; mild AD dementia, mild Alzheimer’s disease dementia.
To address the possibility that differences between the diagnostic groups in the spatial pattern separation task were due to general memory deficits, ROCFT Recall, LM, and RAVLT Delayed Recall scores, which correlated with spatial pattern separation performance (r≥0.47, p < 0.001), were sequentially entered into the model as covariates. In these analyses, significant main effects of diagnostic group (F[2, 94]≥15.42, p < 0.001, η p 2≥0.19) and spatial separation (F[3, 282]≥4.96, p≤0.002, η p 2≥0.07) including the linear effect (F[1, 94]≥13.48, p < 0.001, η p 2≥0.19) were retained, whereas the main effects for time delay and all interactions remained non-significant. Controlling for other cognitive measures, which correlated with spatial pattern separation performance including the ROCFT Copy condition, Clock Drawing Test, TMT A and B, Controlled Oral Word Association Test, BNT, and Forward and Backward Digit Span scores (r≥0.21, p≤0.040), did not significantly change the results. Similarly, to address the possibility that differences between the diagnostic groups in the spatial pattern separation task may be influenced by demographic and psychological factors, age, gender, years of education, and GDS-15 and BAI scores were entered into the model as covariates. Again, a significant main effect of diagnostic group was retained (F[2, 90] = 47.27, p < 0.001, η p 2 = 0.30). The main effect of spatial separation was not significant (F[3, 270] = 0.86, p = 0.464, η p 2 = 0.01), although the spatial separation-by-diagnostic group interaction approached significance (F[6, 270] = 1.98, p = 0.068, η p 2 = 0.04). Specifically, there was a significant quadratic effect (F[2, 90] = 3.411, p = 0.037, η p 2 = 0.07), which was driven by the effect of spatial separation in the CN group. The effect of time delay and all other interactions remained non-significant.
ROC analysis
The size of the area under the ROC curve for pattern separation performance after 10 s and 20 s delay discriminating the aMCI due to AD group from the CN group was 0.84 (95% confidence intervals [0.75, 0.94], p < 0.001) and 0.92 (95% CI [0.85, 0.99], p < 0.001), respectively. For 10 s delay, using the Youden’s index, the optimal sensitivity and specificity was 77% and 82%, respectively, for the cut-off value of 26 from 32 correct trials. For 20 s delay, using the Youden’s index, the optimal sensitivity and specificity was 82% and 82%, respectively, for the cut-off value of 25 from 32 correct trials. There were no significant differences between AUCs of pattern separation performance after 10 s and 20 s delay (AUC difference = 0.08, p = 0.173).
The size of the area under the ROC curve for pattern separation performance after 10 s and 20 s delay discriminating the mild AD dementia group from the CN group was identical at 0.98 (95% confidence intervals [0.94, 1.00], p < 0.001) and 0.98 (95% CI [0.94, 1.00], p < 0.001), respectively. For 10 s delay, using the Youden’s index, the optimal sensitivity and specificity was 86% and 94%, respectively, for the cut-off value of 24 from 32 correct trials. For 20 s delay, using the Youden’s index, the optimal sensitivity and specificity was 91% and 97%, respectively, for the cut-off value of 24 from 32 correct trials. There were no significant differences between AUCs of pattern separation performance after 10 s and 20 s delay (AUC difference = 0.00, p = 0.972). The ROC curves are presented in Fig. 4.

The ROC analysis. A) The ROC curve for pattern separation performance after 10 s delay discriminating the aMCI due to AD group from the CN group (reference). B) The ROC curve for pattern separation performance after 20 s delay discriminating the aMCI due to AD group from the CN group (reference). C) The ROC curve for pattern separation performance after 10 s delay discriminating the mild AD dementia group from the CN group (reference). D) The ROC curve for pattern separation performance after 20 s delay discriminating the mild AD dementia group from the CN group (reference). ROC, receiver operating characteristics; AUC, area under the curve; aMCI due to AD, amnestic mild cognitive impairment due to Alzheimer’s disease; mild AD dementia, mild Alzheimer’s disease dementia.
Hippocampal, entorhinal cortical, and Ch1-2 nuclei volumes and spatial pattern separation
The MRI characteristics are presented in detail in Table 1. There was a main effect of group on total hippocampal, entorhinal cortical, and Ch1-2 nuclei volumes (F[2, 95]≥8.25, p≤0.001, η p 2≥0.17), where the CN group had greater volumes than both, the aMCI due to AD and mild AD dementia groups (p≤0.002). There were no differences in total brain volume between the groups. In the correlational analyses (Table 2), total hippocampal, entorhinal cortical, and Ch1-2 nuclei volumes correlated with each other (r≥0.38, p < 0.001) and their lower volumes correlated with less accurate spatial pattern separation performance after 10 s and 20 s delay (r≥0.25, p≤0.020). The results remained significant after Holm-Bonferroni correction for multiple comparisons. The associations between lower total hippocampal, entorhinal cortical, and Ch1-2 nuclei volumes and less accurate spatial pattern separation performance after 10 s and 20 s delay were also significant in the subsequent regression analyses controlling for total brain volume and demographic characteristics (R-squared [R2]≥0.26, β≥0.25, p≤0.018) (Table 3).
Correlation matrix of hippocampal, entorhinal cortical and basal forebrain Ch1-2 nuclei volumes and spatial pattern separation performance
*p < 0.05; **p < 0.01; and ***p < 0.001. The correlations remained significant after Holm-Bonferroni correction for multiple comparisons. aNormalized to estimated total intracranial volume. Ch1-2, the medial septal nuclei and the vertical limb of the diagonal band of Broca.
Regression models of hippocampal, entorhinal cortical and basal forebrain Ch1-2 nuclei volumes and spatial pattern separation performance controlled for total brain volume and demographic characteristics
*p < 0.05; **p < 0.01; and ***p < 0.001. aNormalized to estimated total intracranial volume. β, standardized regression coefficient; R2, R-squared; Ch1-2, the medial septal nuclei and the vertical limb of the diagonal band of Broca.
To investigate whether hippocampal volume mediates the pathways between entorhinal cortical and Ch1-2 nuclei volumes and spatial pattern separation performance above and beyond global brain atrophy and demographic characteristics, we conducted mediation analyses controlled for total brain volume, age, gender and education. In these mediation models (R2 = 0.33, p < 0.001 and R2 = 0.31, p < 0.001), total hippocampal volume significantly mediated the association between total entorhinal cortical volume and spatial pattern separation performance after 10 s delay (indirect effect = 0.98, 95% CI [0.16, 1.83], p = 0.038, PM = 0.57) and 20 s delay (indirect effect = 0.99, 95% CI [0.15, 1.97], p = 0.028, PM = 0.72). The direct effect of total entorhinal cortical volume on spatial pattern separation performance after 10 s delay (direct effect = 0.75, 95% CI [– 0.66, 2.15], p = 0.293) and 20 s delay (direct effect = 0.38, 95% CI [– 0.99, 1.75], p = 0.581) was not significant, indicating that hippocampal volume fully mediated the association between entorhinal cortical volume and spatial pattern separation performance above and beyond total brain volume and demographic characteristics.
In the subsequent mediation models (R2 = 0.36, p < 0.001 and R2 = 0.39, p < 0.001), the mediation effect of total hippocampal volume on the association between total Ch1-2 nuclei volume and spatial pattern separation performance after 10 s delay (indirect effect = 11.25, 95% CI [– 4.30, 30.64], p = 0.182, PM = 0.20) and 20 s delay (indirect effect = 10.12, 95% CI [– 3.79, 29.34], p = 0.193, PM = 0.17) was not significant. The direct effect of total Ch1-2 nuclei volume on spatial pattern separation performance was significant for performance after 10 s delay (direct effect = 44.19, 95% CI [5.70, 82.68], p = 0.025) and 20 s delay (direct effect = 49.65, 95% CI [11.39, 87.92], p = 0.012), indicating the direct association between Ch1-2 nuclei volume and spatial pattern separation performance above and beyond total brain volume and demographic characteristics.
DISCUSSION
In this study we used a spatial memory task involving varying degrees of spatial interference to investigate spatial pattern separation performance and its association with hippocampal, entorhinal cortical, and basal forebrain Ch1-2 nuclei volumes in the early clinical stages of AD defined by standard biomarkers and in CN older adults. Our results showed that participants in the biomarker-defined early clinical stages of AD (aMCI and mild dementia) had less accurate spatial pattern separation performance than CN older adults, and participants with mild AD dementia had less accurate performance than the participants with aMCI due to AD. Together, these results suggest that spatial pattern separation becomes less efficient with increasing severity of the disease. Our results also showed that performance in the task decreased with smaller distances between the target and foil circles (i.e., with decreasing spatial separation) in both early clinical stages of AD and CN older adults. This is in line with the hypothesis that smaller distance between the target and foil circles represents higher spatial interference which requires a spatial pattern separation process to orthogonalize spatial input and maintain non-overlapping representations of spatial locations [9]. It should be noted that these results remained essentially unchanged after controlling for verbal and non-verbal memory and other cognitive test scores in the statistical analyses. Thus, less accurate performance in the early clinical stages of AD was not likely to be attributable to general memory or other cognitive deficits but was more likely to reflect less efficient spatial pattern separation. Controlling for age, gender, education, anxiety, and depressive symptoms also did not substantially influence the results indicating that spatial pattern separation performance could discriminate the early clinical stages of AD from CN older adults above and beyond differences in demographic characteristics and psychological factors. In fact, the spatial pattern separation task discriminated CN older adults from participants with mild AD dementia with up to 91% sensitivity and 97% specificity and CN older adults from participants with aMCI due to AD with up to 82% sensitivity and 82% specificity.
This study builds on the results of the previous studies on pattern separation in older adults, especially those showing less efficient spatial pattern separation in individuals with versus without worse memory [8 , 55] that was magnified by the presence of the apolipoprotein E ɛ4 allele [30], the genetic risk factor for sporadic AD [31]. This study further extends previous findings by showing that spatial pattern separation may be impaired in the early clinical stages of AD, as defined by standard biomarkers, and that spatial pattern separation accuracy decreased with increasing severity of the disease, with the results apparently not driven by general memory and other cognitive deficits. Next, our results suggested that the spatial pattern separation task can distinguish individuals in the biomarker-defined early clinical stages of AD from CN older adults with high sensitivity and specificity and therefore has the potential to be used as a screening tool for detection of AD-related early cognitive decline. AD biomarkers, especially metabolic [56], demonstrated very high sensitivity and specificity for the early diagnosis of AD; however, their use remains limited to research and expert memory clinics because of their high costs and invasiveness. Therefore, there has been an increasing effort to develop diagnostic cognitive tests for the detection of subtle cognitive impairment associated with pathological changes in specific brain structures affected very early in AD. Recent studies indicate that testing of spatial abilities, unlike standard neuropsychological testing, is a promising way to differentiate aMCI patients with and without AD pathology [57, 58]. Our study suggests that the spatial pattern separation task has the potential to be among the tests that are able to detect AD-related cognitive impairment, hence assisting in the early identification and diagnosis of AD. The spatial pattern separation task may also be used in longitudinal monitoring of the disease progression given its ability to differentiate individuals with aMCI and mild dementia. Future studies are needed to verify psychometric validity of this task on larger cohorts of non-demented older adults with and without AD pathology in clinically-based settings.
An unexpected result was that accuracy of spatial pattern separation performance did not vary as a function of time delay between presentation and recall across the groups. Previous studies found that pattern separation performance decreased with increasing delay between presentation and identification of visual objects [7, 59]. However, these studies used a different paradigm, where the longer time delay was due to the increasing number of separating trials including similar (intervening) objects, which may affect pattern separation processes [60]. In our study we used a distraction task, where the participants read aloud a randomly appearing string of numbers during a time delay of 10 s or 20 s, which did not require specific pattern separation or other memory processes. It should be noted that a distraction task compared to no distraction during the constant time delay may induce forgetting on delayed-match-to-sample tasks by interfering with online maintenance of the target location, which was reported in individuals with hippocampal damage [61]. A previous study [62] found that amnestic participants with hippocampal atrophy due to hypoxia were similarly impaired for a time delay of 10, 20, and 30 s compared to CN participants in a spatial pattern separation task but were able to discriminate all spatial distances for a time delay of 5 s. These results indicate that lower performance in spatial pattern separation tasks in individuals with hippocampal impairment may be caused by rapid forgetting of information within a short time period between 5 and 10 s, partially due to the distraction task between the sample and choice phases. The rapid forgetting does not seem to be further accelerated in a time period between 10 s and 20 s. This finding together with evaluation of the effect of longer time delays beyond 30 s should be the focus of future studies. It should be noted that the spatial pattern separation task, which included both time delay conditions (10 s and 20 s), took about 35 min to complete. This relatively long time-to-completion limits the test’s use as a screening tool in patients with early AD. However, the shorter versions with the 10 s or the 20 s time delay condition, which take approximately 13 and 17 min, respectively, to complete, could be more useful for testing patients in the clinical setting. The ROC analysis indicated that both time delay conditions similarly distinguish individuals with AD dementia from CN normal adults and that the 20 s time delay condition may better distinguish between individuals with aMCI due to AD and CN older adults (AUC = 0.92) than the 10 s time delay condition (AUC = 0.84), although the difference between both conditions was not significant. More studies directly comparing the 10 s and the 20 s time delay condition are required to determine their usefulness as screening tools for the clinical evaluation of patients with early AD.
Aging is associated with episodic [63] and spatial memory decline [64]. Age-related decline was also observed in discrimination tasks [18, 20] including those focused on spatial pattern separation abilities [21]. Therefore, age-related differences between the groups could affect the results in our study. However, controlling for age together with other demographic factors in the statistical analyses did not substantially influence the differences between CN older adults and participants with early clinical stages of AD in spatial pattern separation performance. This may indicate that pattern separation is more strongly associated with cognitive status (i.e., group membership) than with the age of the participants, which is in agreement with previous findings showing that differences between young and older adults in pattern separation tasks became non-significant after excluding those with cognitive impairment [8 , 29]. Next, controlling for depression and anxiety in the statistical analyses also did not substantially influence the results. Depression in older adults is associated with worse cognitive performance, especially with deficits in attention, concentration abilities, and executive functions [65]. Further, depression together with anxiety disorders is associated with more pronounced spatial memory impairment in individuals with aMCI [66]. We did not include individuals with psychiatric disorders, higher depression, or anxiety symptoms and although the participants with mild AD dementia had more depressive symptoms than CN older adults, they still scored within a normal range. This may be the reason why differences between the groups in depressive symptoms did not substantially affect our results of the spatial pattern separation analysis.
To reveal structural brain changes underlying spatial pattern separation impairment, we measured hippocampal, entorhinal cortical, and Ch1-2 nuclei volumes. The hippocampus and the entorhinal cortex were selected because they play an essential and through the perforant path a modulatory role, respectively, in pattern separation [9 , 22] and are affected very early in AD [35, 67]. The Ch1-2 nuclei are specific nuclei of the basal forebrain that is also one of the first brain structures affected in AD [36, 68] and its degeneration was shown to precede and predict neuropathological changes in the entorhinal cortex in the preclinical stage of the disease [37]. The basal forebrain Ch1-2 nuclei are the major source of acetylcholine for the hippocampus [16], where acetylcholine was shown to modulate pattern separation processes [12, 15]; however, the direct association between structural changes in the basal forebrain including the Ch1-2 nuclei and pattern separation has not been investigated. Our results showed lower volumes of the hippocampus, entorhinal cortex and Ch1-2 nuclei in the biomarker-defined early clinical stages of AD and their associations with less accurate spatial pattern separation performance. The associations remained significant after controlling for total brain volume, age, gender, and education in the statistical analyses, indicating that less accurate performance in the early clinical stages of AD was not linked to general brain atrophy but was more likely to reflect atrophy of specific brain regions relevant for spatial pattern separation [9] above and beyond demographic characteristics. The results are consistent with previous studies showing medial temporal lobe and basal forebrain atrophy in early AD [69 –71]. They are also largely consistent with previous findings of hippocampal atrophy and functional changes in the entorhinal cortex, dentate gyrus, and CA3 regions that were associated with less accurate performance in a visual object discrimination task in individuals with aMCI [26] and findings of the associations between functional changes within the medial temporal lobe structures during the visual object discrimination task and AD-related tau pathology in the hippocampus and entorhinal cortex in CN older adults [34]. Our study extended these findings by showing that hippocampal and entorhinal cortical atrophy was associated with less accurate performance in the spatial pattern separation task in the biomarker-defined early clinical stages of AD and that this less accurate performance was also linked to atrophy of the Ch1-2 nuclei, the major source of cholinergic projections to the hippocampus [16].
The mediation analyses revealed that the association between lower volume of the entorhinal cortex and less accurate spatial pattern separation performance was fully explained by lower hippocampal volume above and beyond global brain atrophy and demographic characteristics. These findings indicate that entorhinal cortex operates on spatial pattern separation processes indirectly through the hippocampus. Our results of the interrelations between structural changes of the hippocampus and entorhinal cortex and pattern separation performance in the biomarker-defined early clinical stages of AD complement the findings of computational models and behavioral studies demonstrating that the hippocampus, especially the dentate gyrus and CA3 hippocampal regions, play a critical role in pattern separation processes that are strongly modulated by the afferent hippocampal projections from the entorhinal cortex via the perforant path [12]. Next, the mediation analyses revealed that lower Ch1-2 nuclei volume was directly associated with less accurate spatial pattern separation above and beyond global brain atrophy and demographic characteristics. The results point to the important link between structural changes of the basal forebrain cholinergic system and less effective spatial discrimination in the biomarker-defined early clinical stages of AD. They also complement the previous findings of animal studies demonstrating that low levels of acetylcholine [12] and lesions of basal forebrain cholinergic projections [17] result in less effective spatial pattern separation processes. The associations between integrity of basal forebrain’s fornical projections and pattern separation in early clinical stages of AD should be the focus of future studies.
One of the strengths of our study is the fact that this is the first study to date to examine spatial pattern separation in the biomarker-defined early clinical stages of AD. In addition, we investigated the associations between spatial pattern separation and volumetric changes of the hippocampus, entorhinal cortex and also of the basal forebrain Ch1-2 nuclei, the major source of cholinergic projections to the hippocampus, whose relation to pattern separation has not been studied in humans. Finally, we used well-defined homogeneous cohorts of CN older adults and individuals in the early clinical stages of AD, where the diagnosis of AD was supported by biomarker assessment including hippocampal atrophy and amyloid-β positivity.
This study also has limitations. The cross-sectional design of the study does not allow for tracking the changes in spatial pattern separation performance over time but the longitudinal study is ongoing. In addition, the assessment of CSF amyloid-β1–42, which is one of the most specific biomarkers of AD [72], was performed only in a subset of the AD participants. It should be noted that aMCI due to AD and mild AD dementia participants with and without amyloid-β1–42 assessment were similar in demographic and clinical characteristics and spatial pattern separation performance (the results are not reported). However, among participants with mild AD dementia, the younger participants were more likely to undergo a spinal tap, which may have influenced our results. For ethical reasons, spinal tap was not performed in the CN participants to rule out preclinical AD. Next, the CN participants were not exactly matched on age and education with the AD participants and constitute the smallest group. Despite the use of general linear models, which are relatively lenient with respect to homoscedasticity requirements in analysis of variance, it should still be pointed out that standard deviations of some cognitive tests (i.e., MMSE, TMT A and B, ROCFT-C, ROCFT-R, LM-DR, and BNT) were not equal across the groups, which may still affect ANOVA results. However, it should be noted that a non-parametric test yielded essentially the same results. Another possible limitation of this study may be the fact that we were unable to reliably estimate premorbid intelligence. Given group differences in age and education, premorbid intelligence may have played a role in the results. We modified the administration of the original task such that the participants read aloud a randomly appearing string of numbers in the middle of the screen, instead of looking away from the screen, during a delay between the sample phase and choice phase. Thus, although the participants in the pilot study did not report fixating their eyes on the location of the sample phase circle during reading a string of numbers, we cannot completely rule out that this may have happened in some of the participants in this study. Because of the design of our study we could not demonstrate the superiority of the spatial pattern separation task over the standard memory tests in distinguishing individuals in the biomarker-defined early clinical stages of AD from CN older adults. Further research should also investigate whether the spatial pattern separation task has a potential to sensitively detect subtle cognitive changes associated with preclinical AD. Finally, because of the technical limitations of the MRI scanner, we did not measure regions of the hippocampus or posteromedial and anterolateral subdivisions of the entorhinal cortex, so we could not investigate the specific roles of the dentate gyrus and CA3 regions in pattern separation [22] and the role of the posteromedial entorhinal cortex in spatial processing [8].
Conclusion
In summary, our findings indicate that spatial pattern separation is impaired in the biomarker-defined early clinical stages of AD and the accuracy of spatial pattern separation performance decreases with increasing disease severity, above and beyond general memory and other cognitive deficits and demographic and psychological factors. In addition, our results suggest that less accurate spatial pattern separation is related to atrophy of the hippocampus, entorhinal cortex, and the Ch1-2 nuclei, the major source of cholinergic projections to the hippocampus. Our findings further indicate that the hippocampus and Ch1-2 nuclei have a direct effect on spatial pattern separation processes, while the entorhinal cortex operates indirectly through the hippocampus. These results extend the previous findings suggesting age-related pattern separation decline by showing that spatial pattern separation performance reflects also the progression of AD-related pathology and its impairment may contribute to spatial memory deficits in early AD.
Footnotes
ACKNOWLEDGMENTS
The authors would like to thank Ms. K. Kopecka, Mr. J. Korb, Ms. A.F. Mazancova, Ms. K. Cechova, Ms. V. Matuskova, and Ms. M. Dokoupilova for help with data collection, Dr. I. Gazova, Dr. I. Mokrisova, Dr. Z. Nedelska, and Dr. J. Cerman for help with participant recruitment, Mr. M. Uller for help with MRI data processing, and Prof. S.J. Teipel and Dr. M. Grothe for creating a basal forebrain mask.
This study was supported by the Grant Agency of Charles University grants no. 693018 and 654217; the project no. LQ1605 from the National Program of Sustainability II (MEYS CR); Ministry of Health, Czech Republic–conceptual development of research organization, University Hospital Motol, Prague, Czech Republic grant no. 00064203; Ministry of Health of the Czech Republic grant no. 16–27611A; and Institutional Support of Excellence 2. LF UK grant no. 6990332. Dr. R. Andel acknowledges support through a University of South Florida Nexus Initiative (UNI) Award.