
Abstract
Background:
Microglia are traditionally described as the immune cells of the brain and have an inflammatory role in Alzheimer’s disease (AD). Microglial morphological and phenotypic shifts in AD have not been fully characterized; however, microglia are often described as either pro- or anti-inflammatory.
Objective:
To determine microglial if microglial morphology and phenotype changes with disease status.
Methods:
This study observed morphology through Iba1 immunohistochemistry on tissue sections encompassing the primary motor cortex and somatosensory barrel fields. Immunohistochemistry for pro-inflammatory markers: CD14 and CD40; and anti-inflammatory markers: CD16 and TREM2, was performed at 3, 6, and 12 months of age which correlated with pre-plaque, onset, and significant plaque load in APP/PS1 brains (n = 6) and compared to age-matched littermate controls (n = 6).
Results:
Microglia demonstrated a defined morphological shift with time. Deramified morphologies increased in the APP/PS1, at both 6 months (p < 0.0001) and 12 months (p < 0.0001). At 12 months, there were significantly lower numbers of ramified microglia (p < 0.001). Results indicated that microglia have a heterogenic marker immunoreactivity as CD16, TREM2, and CD40 were associated with an activated morphology at the same time points. All inflammatory markers were significantly upregulated at 12 months in the APP/PS1 mice (TREM2 (F (2,30) = 10.75, p = 0.0003), CD40 (F (2,30) = 15.86, p < 0.0001), CD14 (F (2,30) = 6.84, p = 0.0036), and CD16 (F (2,30) = 3.026, p = 0.0635)).
Conclusion:
Our data indicate that pro- and anti-inflammatory factors of microglia occur in APP/PS1 mice.
INTRODUCTION
Microglia are the resident immune cell of the brain. Microglia are integral in the maintenance of the central nervous system (CNS), through functions of cellular debris clearance, synaptic maintenance, inflammation, and neuronal support [1]. In a healthy brain, microglia respond to changes in the CNS homeostasis with changes to their morphology and the release of inflammatory cytokines to regain homeostasis. This response may become undesirable in diseases concerning the CNS, as pathology may elicit a chronic inflammatory response leading to more harm than benefit [2]. Uncertainty to the exact role microglia have in disease is relevant in the context of Alzheimer’s disease (AD), a neurodegenerative disease, hallmarked by neurofibrillary tangles and deposits of amyloid-β (Aβ) plaques. In AD, microglia are thought to lose their homeostatic function due to the ongoing insult of pathology, consequently driving disease progression [3, 4].
Microglial inflammation in AD is considered detrimental due to their inflammatory profiles being deemed predominantly pro-inflammatory. A multitude of markers have been ascribed to microglia in AD, including a variety of cluster of differentiation (CD) markers [1], chemokines and cytokines [2] and most recently the report of disease-associated microglia [3]. There is increasing evidence in other models of disease suggesting microglia display a mixed inflammatory phenotype [5, 6]. This aligns with an emerging hypothesis that microglial phenotypes exist on a continuum between pro- and anti-inflammatory states [7, 8]. Morphologies have been hypothesized to indicate function or cell-surface marker expression (i.e., phenotype); however, few studies have investigated marker expression with a morphological analysis to determine whether this is the case in AD. Therefore, it is of interest to combine a phenotypic and morphological analysis in a model with a persistent inflammatory stimulus. To address this knowledge gap, we investigated the phenotype of microglia and their morphology throughout disease progression via a subset of inflammatory surface markers (CD14, CD16, CD40, and TREM2). These markers have been reported to change in clinical cases of AD [4 –6] and in the instance of CD14 murine studies have indicated integral roles in mediating the inflammatory cascades but also amyloidosis [7]. This study combined an analytical approach in an AD mouse model (APP/PS1) characterized by Aβ plaques.
MATERIAL AND METHODS
All experimental procedures were performed in accordance with the Australian Code of Practice for the Care and Use of Animals for Scientific Purposes and approved by the Animal Ethics Committee of the University of Tasmania (A12780). A total of n = 36 mice were used in this study. Male transgenic APPswe, PSEN1dE9 (APP/PS1; n = 6 per timepoint) were used as a model of amyloidosis. These mice express mutant mouse/human amyloid precursor protein (APP) and mutant human presenilin 1 (PS1) on C57BL/6 background [B6.Cg-Tg (APPswe, PSEN1dE9) 85Dbo/J] (APP/PS1;(5). This model simulates Aβ pathology that resembles the initial stages of AD, and Aβ deposits have been observed from 3 months of age, with profuse plaque deposition present by 8 months of age [8, 9]. Age-matched wildtype littermate male mice served as controls (n = 6/time point). Animals were housed in standard conditions (20°C, 12/12 h light/dark cycle) with water and food ad libitum.
Tissue preparation
APP/PS1(Tg) and age matched wildtype mice (WT) were transcardially perfused with 4% paraformaldehyde in PBS at 3, 6, or 12 months of age. Brains were removed and post-fixed in 4% paraformaldehyde in PBS. Tissue was cryoprotected in sucrose, before being frozen. Brains were serially sectioned in the coronal plane on a cryostat (Leica CM 1850) at 40μm. Sections used for analysis were from bregma 2 mm to bregma –2.75 mm, according to the mouse brain atlas [10]. All analyses were performed blind to genotype and age.
Immunohistochemistry for microglia
For each animal, two sections were stained encompassing the regions of interests (ROI) primary motor cortex and somatosensory barrel fields. These tissue sections were labelled as described as below. Microglial morphology was assessed by staining with rabbit anti-Iba1 (1:1000, Wako, Cat: 019-19741). In order to discriminate phenotype other known markers of microglia were used in conjunction with Iba1: pro-inflammatory markers; mouse anti-CD40 (1:1000, ThermoFisher Scientific, Cat: 14-0402-82), mouse anti-CD14 (1:500, Abcam, Cat: ab182032, and anti-inflammatory markers; mouse anti-TREM2 (1:1000, R&D systems, Cat: AF1729), and mouse anti-CD16 (1:500, ThermoFisher Scientific, Cat: MA1-7633). Prior to primary antibody incubation, a blocking solution of 4% milk was applied for 2 h. Following overnight incubation with primary antibodies at 4°C, sections were washed in PBS. Labelling was visualized by species specific AlexaFluor secondary antibodies for multiple labelling at 1:2000, incubated for 2 h at room temperature (donkey anti-rabbit IgG-594, Cat: 711-585-152, donkey anti-mouse IgG-488, Cat: 715-545-150, donkey anti-sheep IgG-488, Cat: 713-545-147, or goat anti-rat IgG-488, Cat: 112-545-167). Following secondary antibody incubation, sections were washed in PBS. Amylo-Glo “ready to dilute” (Biosensis) stain was used to visualize plaque deposits as per manufacturer’s directions. Briefly, following the secondary antibody incubation and subsequent washes, the tissue sections were placed into a 70% ethanol solution for 5 min at room temperature. The sections were then rinsed in MilliQ water for 2 min and placed in Amylo-Glo stain for 10 min. The sections were then rinsed in saline. The tissue sections were then rehydrated, rinsed in MilliQ, and mounted using Dako fluorescent mounting medium.
Microscopy and image analysis
Photomicrographs of the ROI were attained via a Perkin Elmer Ultra view VoX spinning disk confocal microscope and proprietary software. Microglial analysis was performed in Image J (v.1.41) using images with centered plaque deposits in the areas specified. Five images were analyzed for each animal at each timepoint (3, 6, and 12 months, n = 6), totaling 30 images for each of the 6 cohorts. Microglia were counted using a grid on each image, each square was 70μm2. Ten squares were chosen within each photomicrograph, 5 surrounding a plaque deposit and 5 on the edge away from the plaque. Analysis also considered microglia proximity to plaques. Microglia within a distance of one square (70μm) were considered associated to plaques, and two squares away (140μm) from the plaque was considered non-associated with plaques. Iba-1 positive microglia were counted and identified into one of the five morphological categories; ramified, activated, hyper-ramified, rod, or amoeboid [11 –17]. Following morphological analysis, microglia were examined for double-labelling of Iba-1 with either a pro-inflammatory phenotypic markers (CD14 and CD40) or anti-inflammatory phenotypic markers (CD16 and TREM2). Microglia were classified as having positive colocalization through spatial overlap of Iba-1 and the specified surface markers, which was verified through z-stacked images to identify fluorescently double-labelled microglia over 10μm2 planes, allowing reduction of noise. The average number of microglial morphologies and the type of phenotypic immunoreactivity was recorded at each time point within both WT and Tg mice.
Statistics
Data were expressed as mean±SEM and analyzed with R stats software (version 1.1.463) and graphed though GraphPad Prism 5 software package (GraphPad Software). Statistical significance was analyzed using Student t-test for two-group comparison, followed by the Tukey post-hoc test for multiple comparisons. Differences were considered significant for p < 0.05.
RESULTS
To further understand the relationship between the morphological and phenotypic shifts of microglia, we used an AD mouse model (APP/PS1) characterized by Aβ plaques. We did this by investigating markers associated with pro- and anti-inflammatory phenotypes and observed their corresponding morphology to determine whether microglia present a mixed or skewed inflammatory profile in response to progressive plaque pathology and if morphology has a specific inflammatory profile function. We studied APP/PS1 mice and age-matched littermate controls over three time points (3, 6, and 12 months), correlating to progressive development of amyloid plaques [8 , 19]. This study quantified ramified, activated/hyper-ramified and amoeboid/macrophage microglia. Rod microglia were rarely present and thus were not included in analysis. We set significance at p < 0.05. Moreover, we performed a spatial analysis of morphologies in regard to proximity with plaque deposits. In both human and mouse studies [20 –24], ramified microglia are characterized by symmetrically distributed thin, long ramified processes with a small spherical soma. Activated microglia display significantly an enlarged soma and processes with some retraction. Amoeboid microglia display an enlarged soma and lack processes.
In Tg APP/PS1 mice, microglial morphology was significantly altered compared to age-matched WT controls. Ramified microglia, the surveying morphology, demonstrated a significant decrease in number in the Tg mice at 6 and 12 months, finding a significant interaction between age and strain (F (2,30) = 19.75, p < 0.0001; Fig. 1). Deramified microglia were found to be significantly increased at 6 and 12 months in the Tg mice relative to their WT counterparts, with a significant interaction between age and strain (F (2,30) = 24.92, p < 0.0001; Fig. 1). Similarly, the fully deramified, amoeboid morphology was significantly increased in the Tg mice at 6 and 12 months, with a significant interaction between strain and age (F (2,30) = 38.96, p < 0.0001; Fig. 1). Spatial analysis of morphologies through Tukey’s post-hoc test, revealed significance of the amoeboid morphology at plaque location at 6 months (p < 0.05) and 12 months (p < 0.0001) of age.
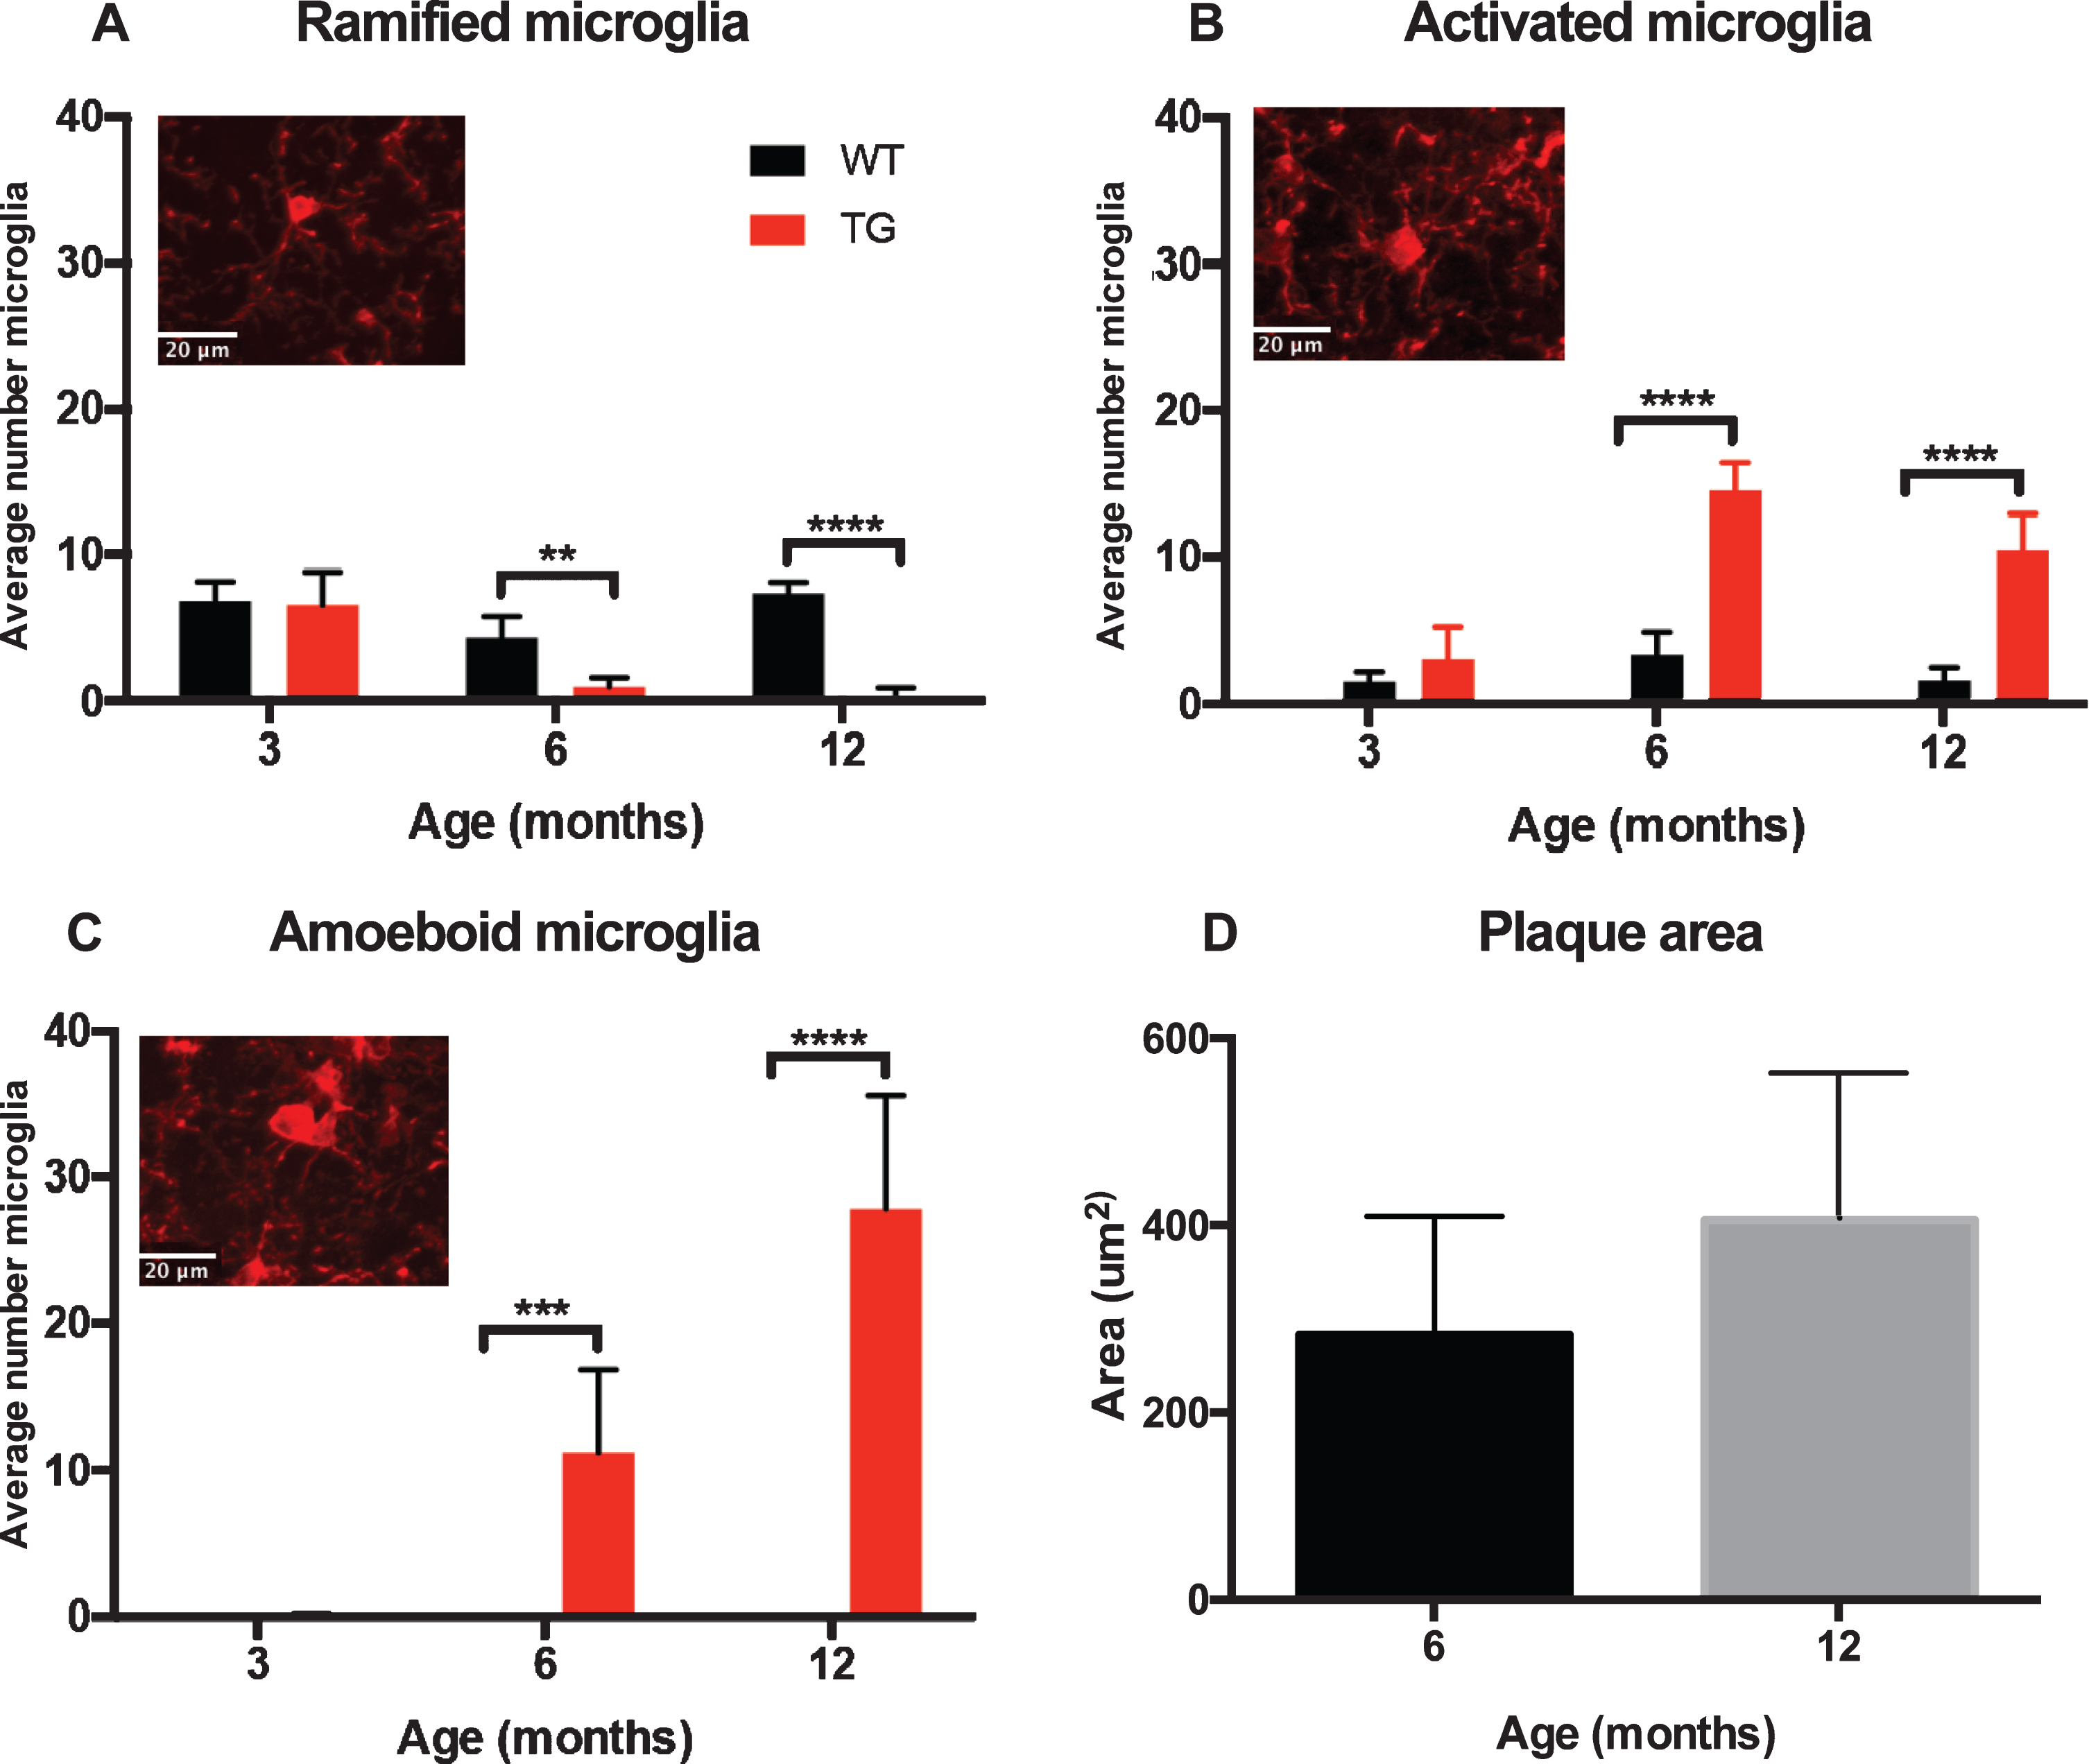
Distinct morphological shifts observed to increasing plaque load when comparing APP/PS1 (TG) and age-matched control (WT). Quantification of the average number of ramified, activated and amoeboid microglia (+SEM) demonstrated a significant morphological shift to increasing plaque pathology (D) when compared to their age-matched wildtype controls. Significant interaction between the age and strain of mice was found for each morphology, (A) ramified; F (2,30) = 19.75, p < 0.0001, (B) activated; F (2,30) = 24.92, p < 0.0001, and (C) amoeboid; F (2,30) = 38.96, p < 0.0001.
Pro-inflammatory markers CD14 and CD40 were increased in transgenic mice
CD14 is a lipopolysaccharide (LPS) receptor present as a membrane-bound form at the surface of myeloid cells. The interaction of LPS (endotoxin) with the CD14-TLR4 receptor complex modulates the host innate immune [25]. In the Tg APP/PS1 mice, we hypothesized that CD14 immunoreactivity would increase in activated microglia over time. We further anticipated CD14 in Tg mice would be significantly higher than in the WT mice. We found microglia that were CD14 positive were not limited to activated microglia nor the Tg mice; furthermore, our data demonstrated the pro-inflammatory marker, CD14, increases with age in the ramified morphology in the WT mice by 12 months of age (Fig. 2).

Representative CD14 and Iba1 IHC images from wildtype (WT) and APP/PS1 (TG) mice. Iba1 (red) ramified microglia were evident at 3 months in both WT and TG mice, however, by 6 months microglial morphogy became more activated in TG mice especially in relation to plaques (blue). CD14 (green) was prevelant by 6 months of age regardless of strain, with staining increasing at 12 months.
At 3 months of age, approximately 22% of microglia counted co-localized with CD14 regardless of strain; with a majority of those CD14 microglia being in the ramified morphology (Tg = 72%, WT = 84%). At 6 months, approximately 50% of microglia counted were positive for CD14 in the Tg mice. Of the CD14 microglia, approximately 60% were in an activated state, whereas in the WT mice, approximately 66% of microglia counted were CD14 positive and a majority of these (56%) were ramified. By 12 months, CD14 in the Tg mice remained at approximately 50% of microglia counted; however, a majority (62%) of these were in the ameboid/macrophage morphology. Conversely, at 12 months in the WT mice, 81% of the microglia counted were positive for CD14, of which 86% were in the ramified morphology (see Table 1). Statistical analysis revealed CD14 positive microglia in the Tg mice was most prominent in the amoeboid/macrophage morphology at 12 months of age (p < 0.001). Further statistical analysis with a two-way ANOVA revealed that CD14 immunoreactivity without the factor of morphological subtypes demonstrated a significant interaction between age and strain (F (2,30) = 6.84, p = 0.0036; Fig. 3A). Tukey’s post-hoc tests showed that CD14 positive microglia was significantly upregulated in the Tg mice at 6 months (p < 0.01; Fig. 3) and 12 months of age (p < 0.0001; Fig. 3) in comparison to the WT mice. Separating the microglia based on morphological subtype demonstrated significance between age and strain in the ramified (F (2,30) = 31.36, p < 0.0001; Fig. 3B), activated (F (2,30) = 33.66, p < 0.0001; Fig. 3D), and amoeboid/macrophage (F (2,30) = 15.66, p < 0.001; Fig. 3E) morphologies through a two-way ANOVA.
CD14 positive microglia in wild-type (WT) and APP/PS1 (TG) mice at 3, 6, and 12 months of age. Numbers in brackets are Iba1 positive microglia counted

Quantification of CD14 immunoreactivity. Representative high power image of CD14 immunohistochemistry staining in separate channels and merged. Closed arrows denote colocalization of microglia and CD14 (A). CD14 expression without the factor of morphological subtypes demonstrated a significant interaction between age and strain (F (2,30) = 6.84, p = 0.0036; B). Separating the microglia based on morphological subtype demonstrated significance between age and strain in the ramified (F (2,30) = 31.36, p < 0.0001; C), activated (F (2,30) = 33.66, p < 0.0001; D), and amoeboid (F (2,30) = 15.66, p < 0.001; E) morphologies through two-way ANOVA. The data demonstrated CD14 expression was more significantly associated to plaque depositions than the surrounding microglia at both 6 months (p < 0.05; Fig. 2F) and 12 months (p < 0.0001).
Further analysis via a Tukey’s post-hoc multiple comparisons test demonstrated that there was a significant downregulation of CD14 positive ramified morphology in the Tg mice both 6 months (p < 0.001) and 12 months of age (p < 0.0001) compared to control mice. CD14 positive colocalization in activated microglia of Tg mice demonstrated a significant downregulation at 6 months (p < 0.01) but then was upregulated at 12 months (p < 0.0001). CD14 positive amoeboid microglia in the APP/PS1 mice demonstrated upregulation at both 6 months (p < 0.05) and 12 months (p < 0.0001) when compared to WT mice. A spatial analysis was also performed to determine the CD14 immunoreactivity of microglia at plaque and non-plaque locations in the Tg mice. The data demonstrated CD14 immunoreactivity in amoeboid/macrophage microglia, which was more significantly associated to plaque depositions than the surrounding microglia at both 6 months (p < 0.05; Fig. 3F) and 12 months (p < 0.0001; Fig. 3F).
CD40 is associated with pro-inflammatory properties and previously has been shown to show no change in the normal aging process [26]. In the APP/PS1 mouse model, we hypothesized that CD40 positive microglia would increase within the activated morphology correlating to increase amyloid plaque deposition (Fig. 4). Through a two-way ANOVA, it was revealed that CD40 immunoreactivity in all microglial subtypes demonstrated a significant interaction was found between age and strain (F (2,30) = 15.86, p < 0.0001; Fig. 5). Further analysis with Tukey’s post-hoc showed CD40 to be significantly upregulated in the Tg mice at 12 months of age (p < 0.0001; Fig. 5) compared to their age-matched WT counterparts.
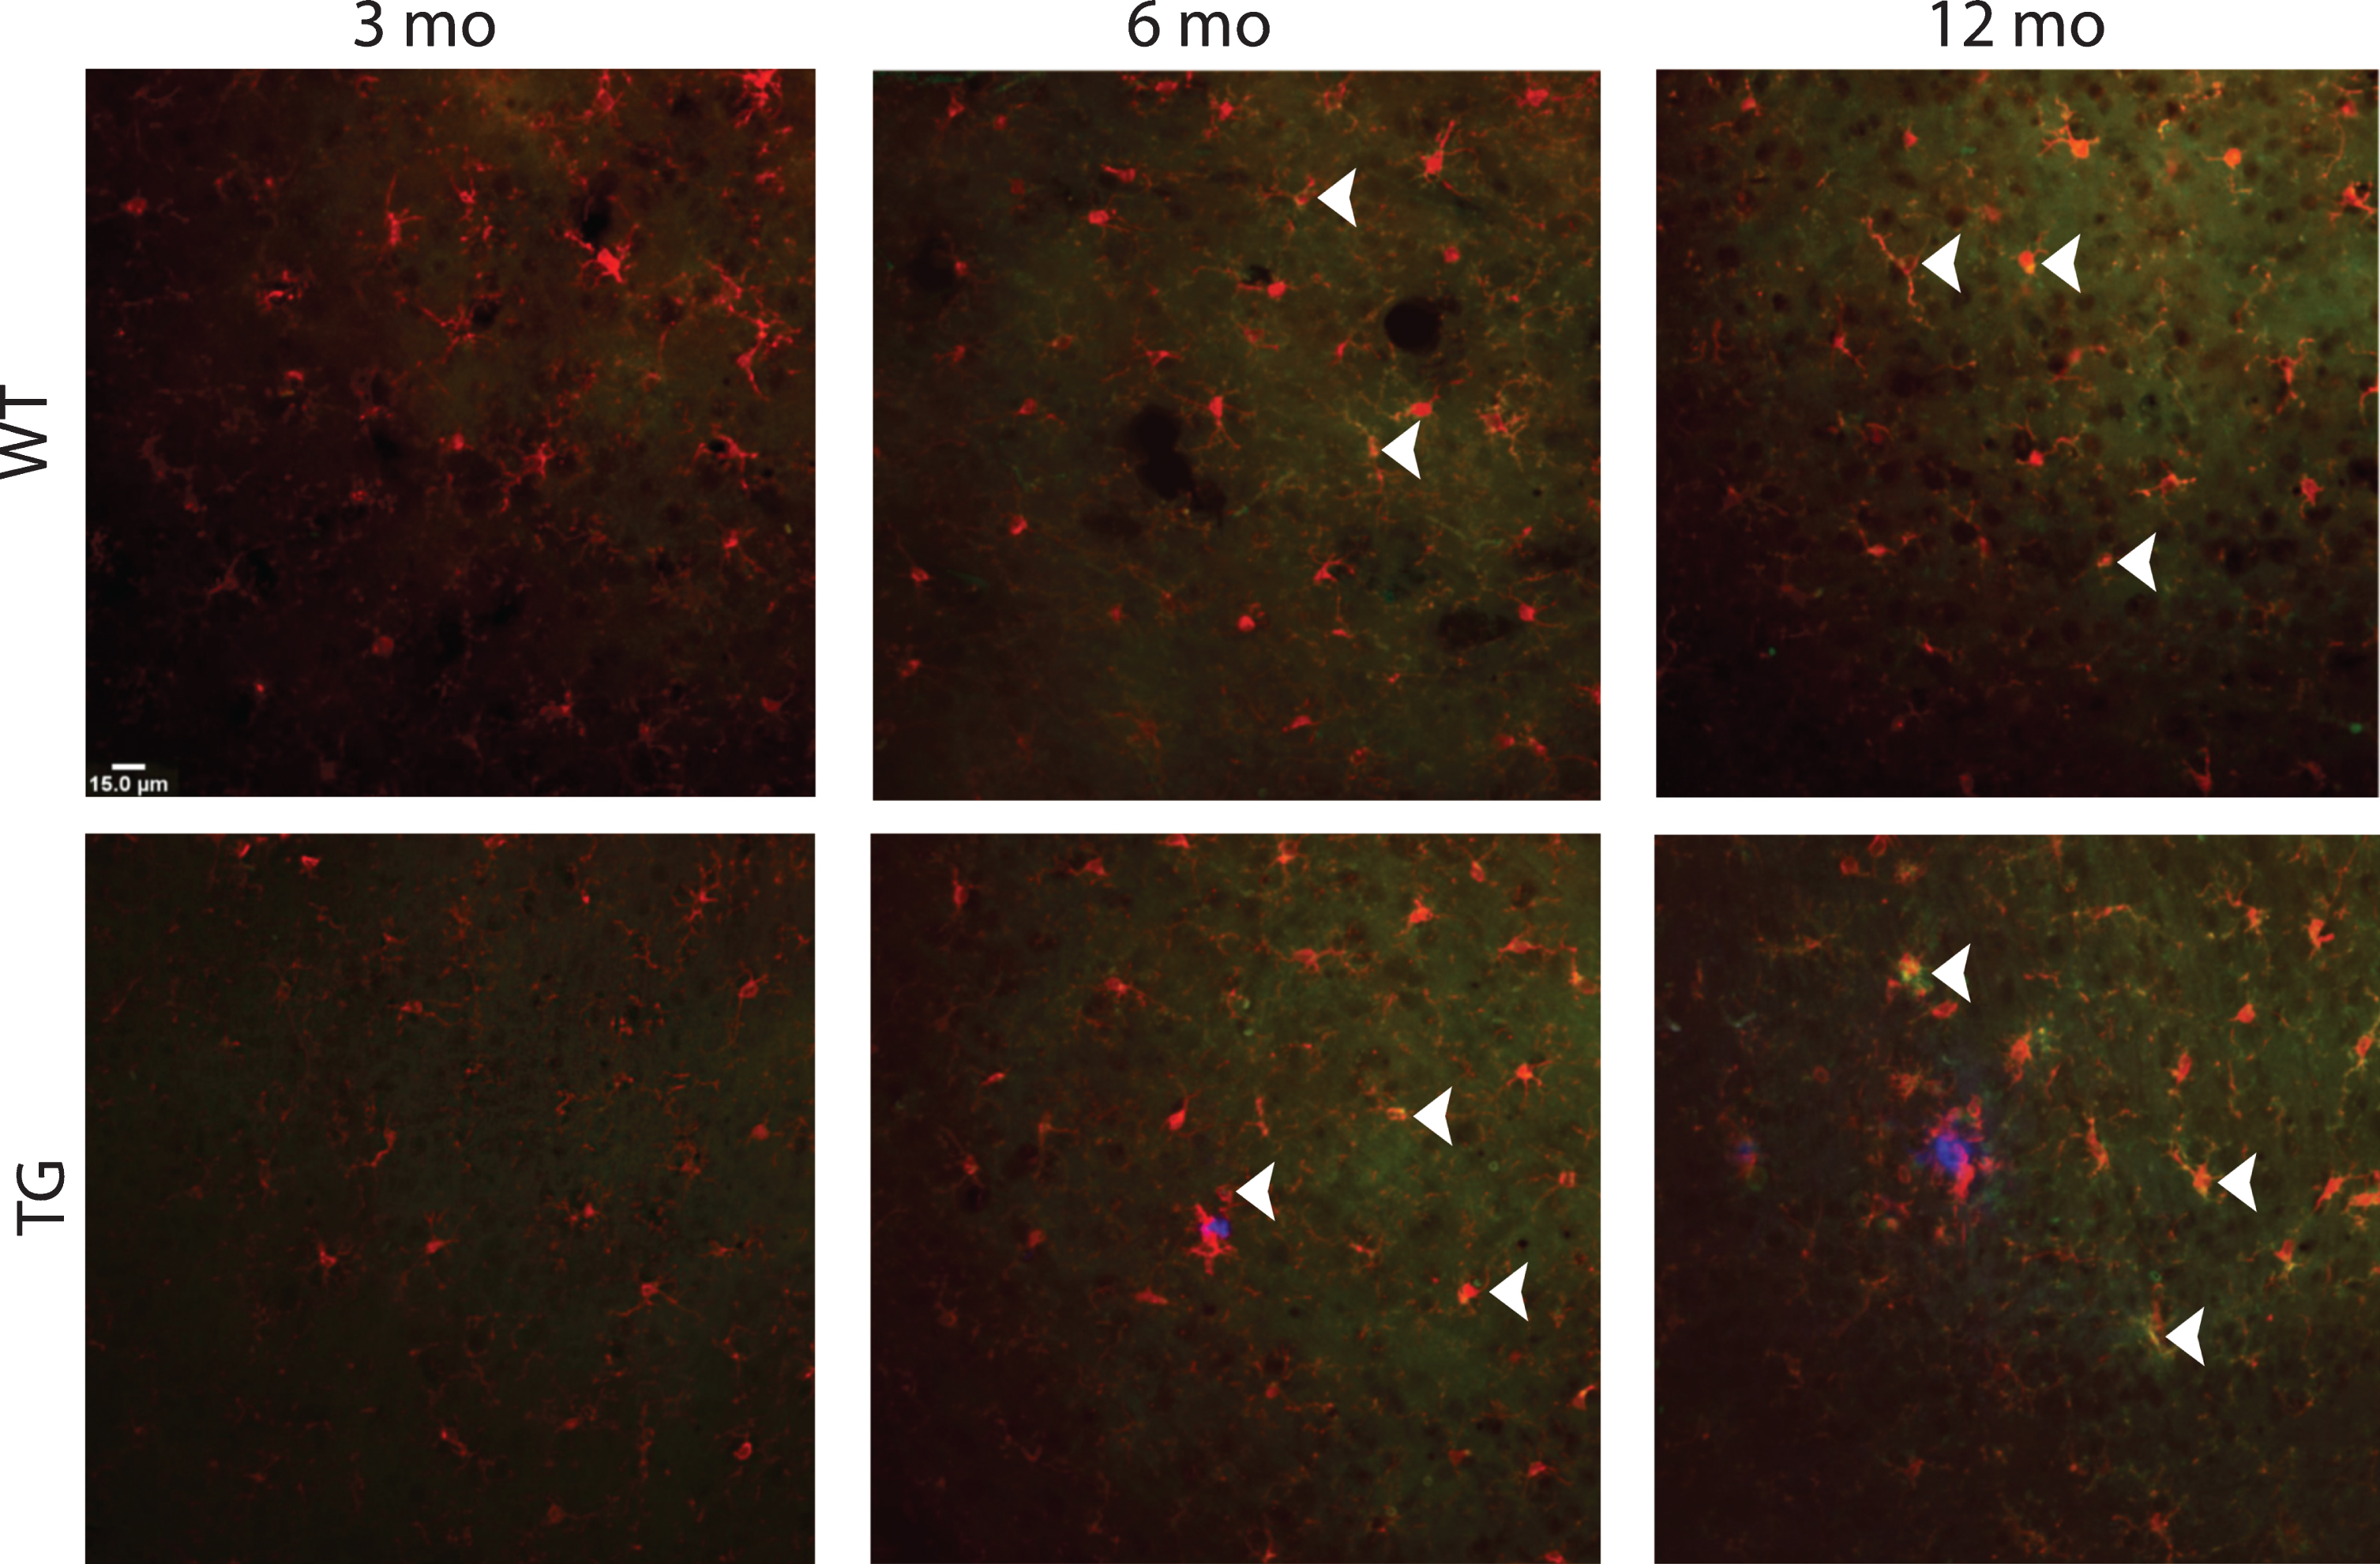
Representative immunohistochemical images of CD40 and Iba1. Ramfied Iba1 (red) microglia were evenly distributed throughout the wildtype (WT) cortex, whereas Iba1 positive microglia in the APP/PS1 (TG) mice displayed a mixed morphology of activated and ramified. At 6 months of age, CD40 colocalization with Iba1 was evident in TG mice which increased 12 months (closed arrows).
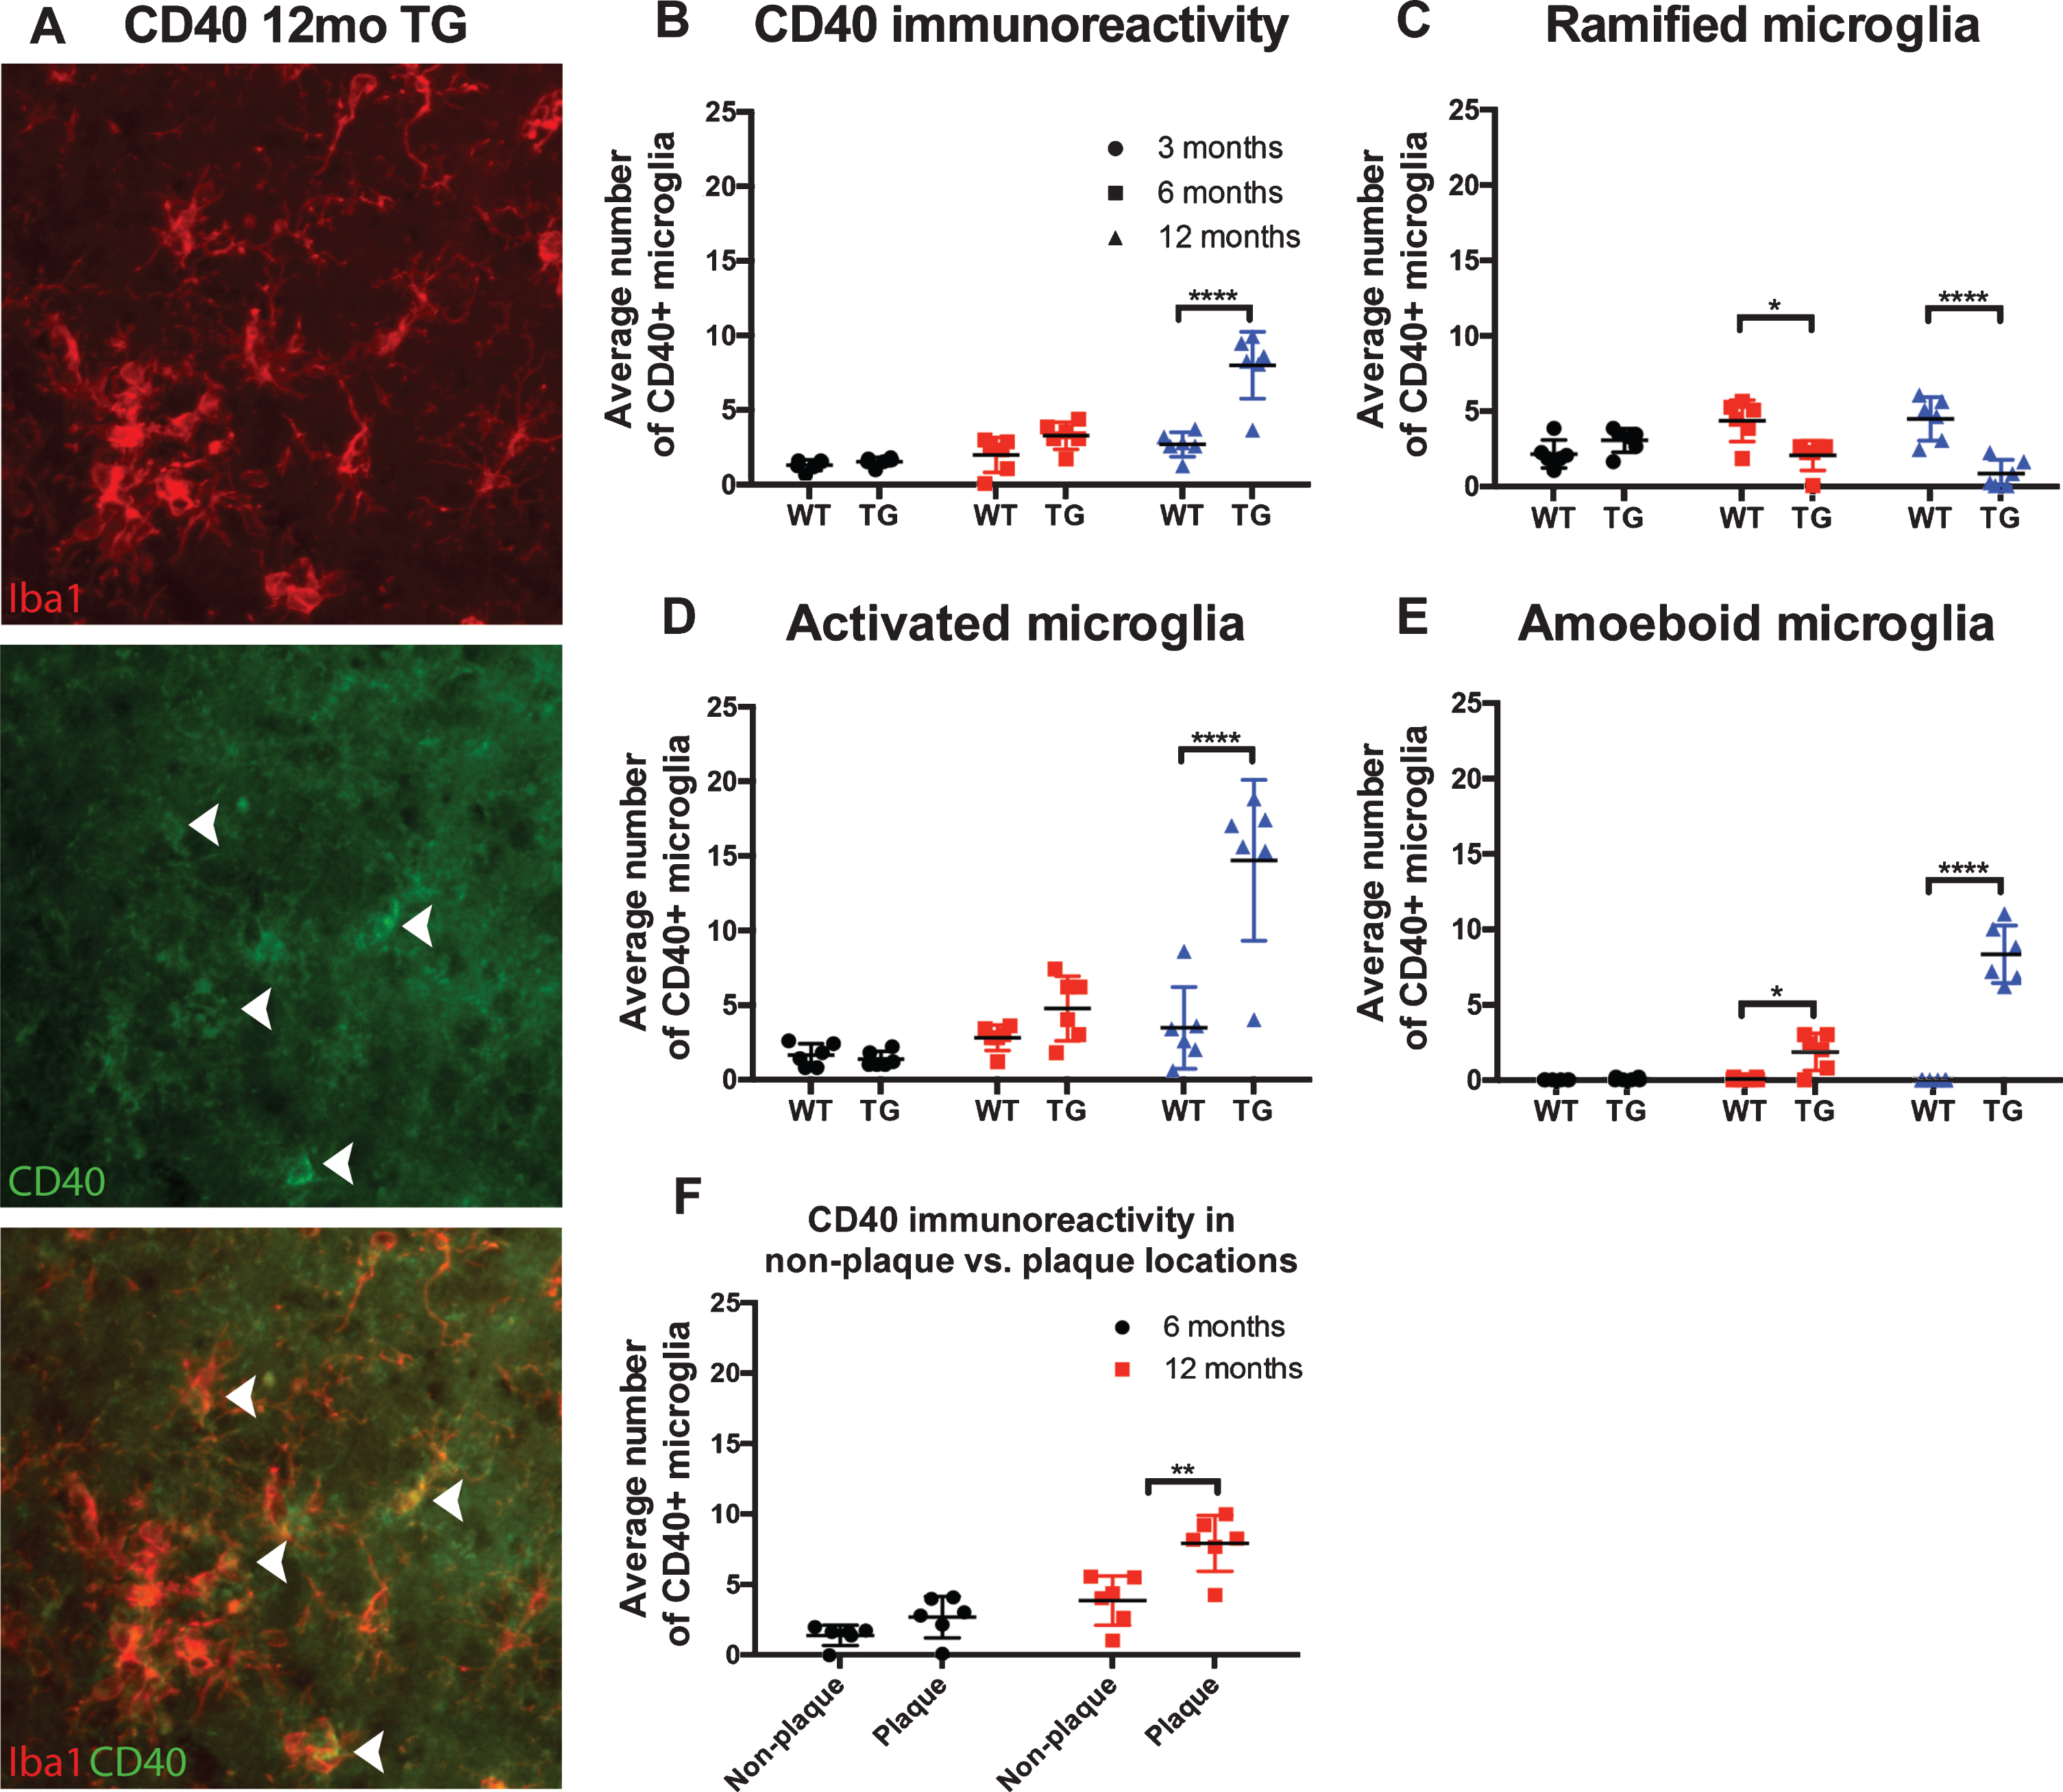
Quantification of CD40 immunoreactivity. Representative high power image of CD40 immunohistochemistry staining in separate channels and merged. Closed arrows denote colocalization of Iba1 positive microglia and CD40 (A). Statistical analysis via two-way ANOVA revealed CD40 expression in all microglial subtypes (B), with a significant interaction was found between age and strain (F (2,30) = 15.86, p < 0.0001). CD40 colocalization with microglia in all morphologies, significance was found through a two-way ANOVA between interaction and strain in the ramified (F (2,30) = 13.39, p < 0.0001; C), activated (F (2,30) = 15.59, p < 0.0001; D), and amoeboid (F (2,30) = 66.06, p < 0.0001; E) morphologies when compared to wildtype mice. Spatial analysis of all morphologies found significant CD40 immunoreactivity with microglia associated with plaques at 12 months (p < 0.001; F).
At 3 months of age, approximately 46% of microglia counted co-localized with CD40 in the Tg mice; with a majority (∼68%) of those CD40 microglia being in the ramified morphology. In WT mice, approximately 38% of microglia at 3 months colocalized with CD40, with a majority (∼56%) being in the ramified morphology. At 6 months, approximately 47% of microglia counted were positive for CD40 in the Tg mice. Of the CD40 microglia approximately 53% were in an activated state, whereas in the WT mice, approximately 78% of microglia counted were CD40 positive and a majority of these (60%) were ramified. By 12 months, CD40 in the Tg mice remained at approximately 65% of microglia counted; however, a majority (62%) of these were in the activated morphology. Conversely, at 12 months in the WT mice 89% of the microglia counted were positive for CD40, of which 56% were in the ramified morphology (see Table 2).
CD40 positive microglia in wild-type (WT) and APP/PS1 (TG) mice at 3, 6, and 12 months of age. Numbers in brackets are Iba1 positive microglia counted
A two-way ANOVA of positive CD40 staining found a significant interaction of age and strain in the ramified (F (2,30) = 13.39, p < 0.0001; Fig. 5C), activated (F (2,30) = 15.59, p < 0.0001; Fig. 5D), and amoeboid (F (2,30) = 66.06, p < 0.0001; Fig. 5E) morphologies when compared to control mice. Through Tukey’s post hoc analysis, the CD40 immunoreactivity in ramified microglia was found to be significantly upregulated in the wild-type mice at 6 months (p < 0.05) and at 12 months (p < 0.0001) compared to the Tg mice. CD40 immunoreactivity in activated microglia in the Tg mice was found to be significantly upregulated at 12 months (p < 0.0001). CD40 immunoreactivity in amoeboid microglia was found to be significantly increased in the Tg mice at 6 (p < 0.05) and 12 months (p < 0.0001). Overall, CD40 immunoreactivity was more prominent in the activated morphology compared to the other subtypes. Further spatial analysis of all morphologies found significant CD40 positive microglia associated with plaques at 12 months (p < 0.001; Fig. 5F).
Anti-inflammatory markers CD16 and TREM2 were significantly increased in activated microglia in the Tg mice
CD16 is associated with an immune regulatory role. CD16 has previously been observed to increase with normal aging, which was also evident in our findings (Fig. 6) [27]. In the Tg we hypothesized that CD16 would be increase in the activated morphology of microglia correlating to increased amyloid plaque deposition. Through a two-way ANOVA, it was revealed that CD16 immunoreactivity, across microglial regardless of morphological subtypes demonstrated a non-significant interaction between age and strain (F (2,30) = 3.026, p = 0.0635; Fig. 7B). However, significance in CD16 immunoreactivity was found in the main effects of strain (F (1,30) = 16.66, p = 0.0003) and age (F (2,30) = 14.00, p < 0.0001). Through further analysis with Tukey’s post-hoc, CD16 was found to be significantly upregulated in the APP/PS1 mice at 6 months of age (p < 0.01) compared to age-matched control mice.
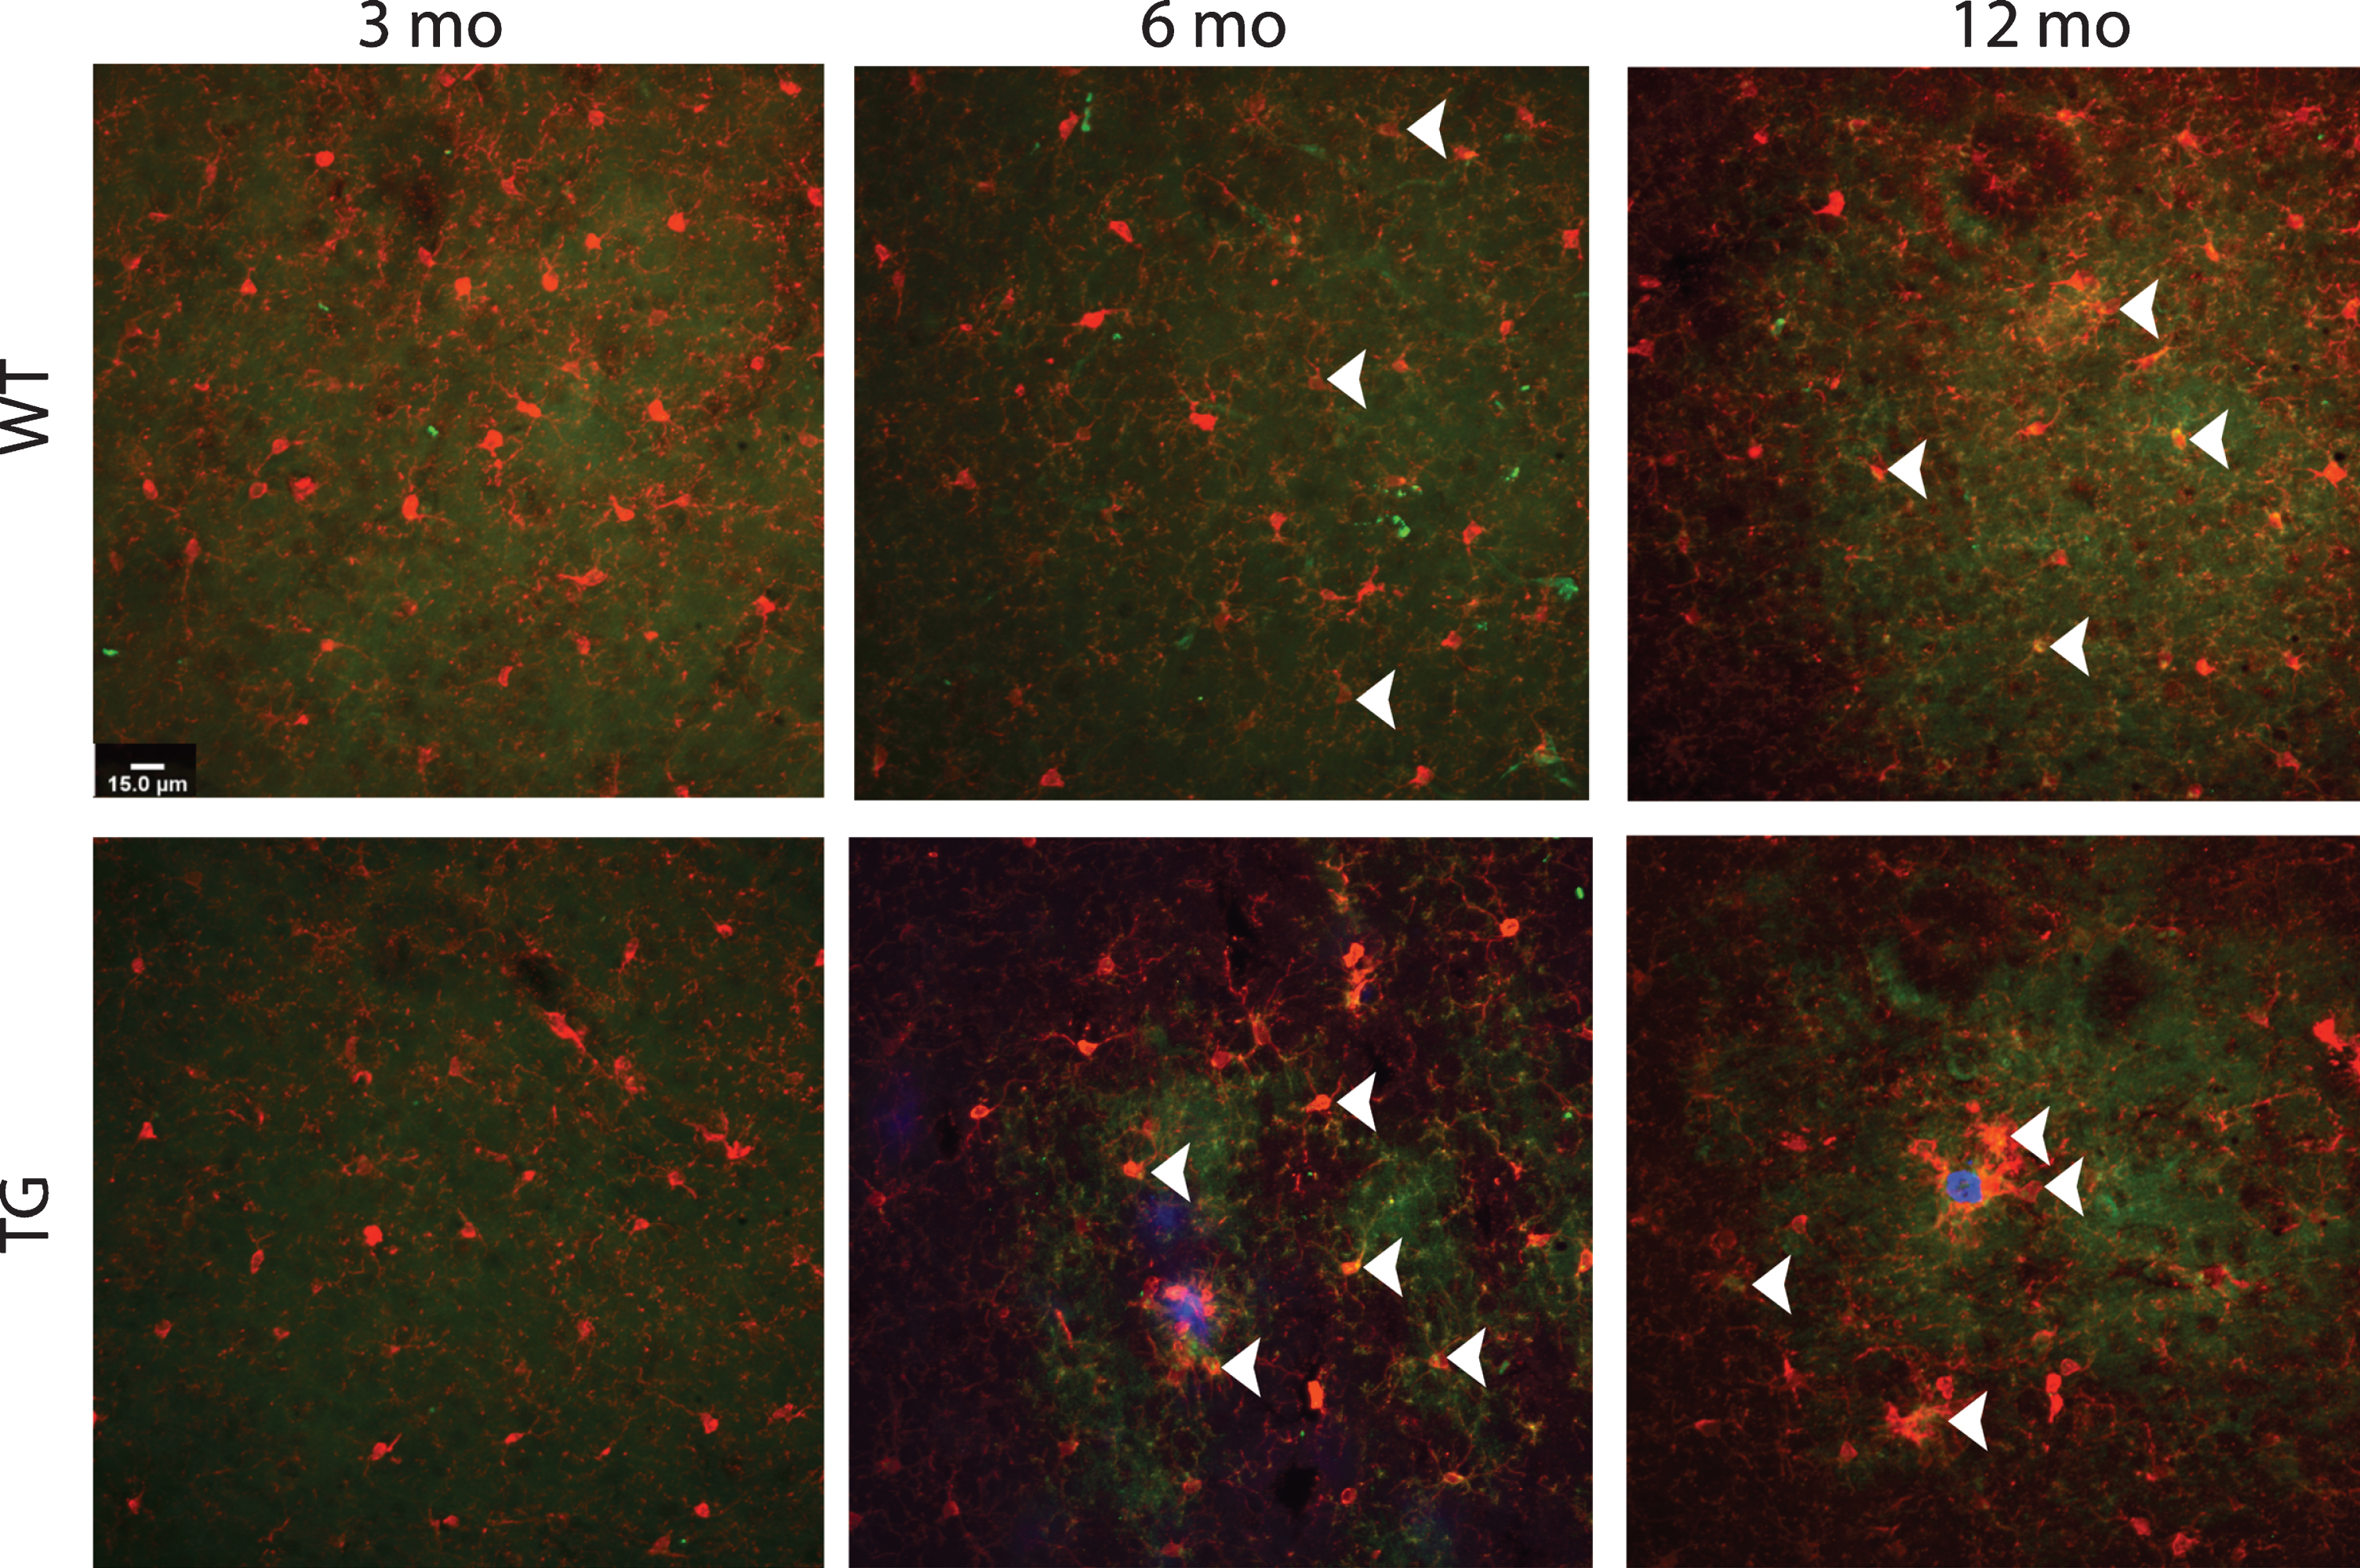
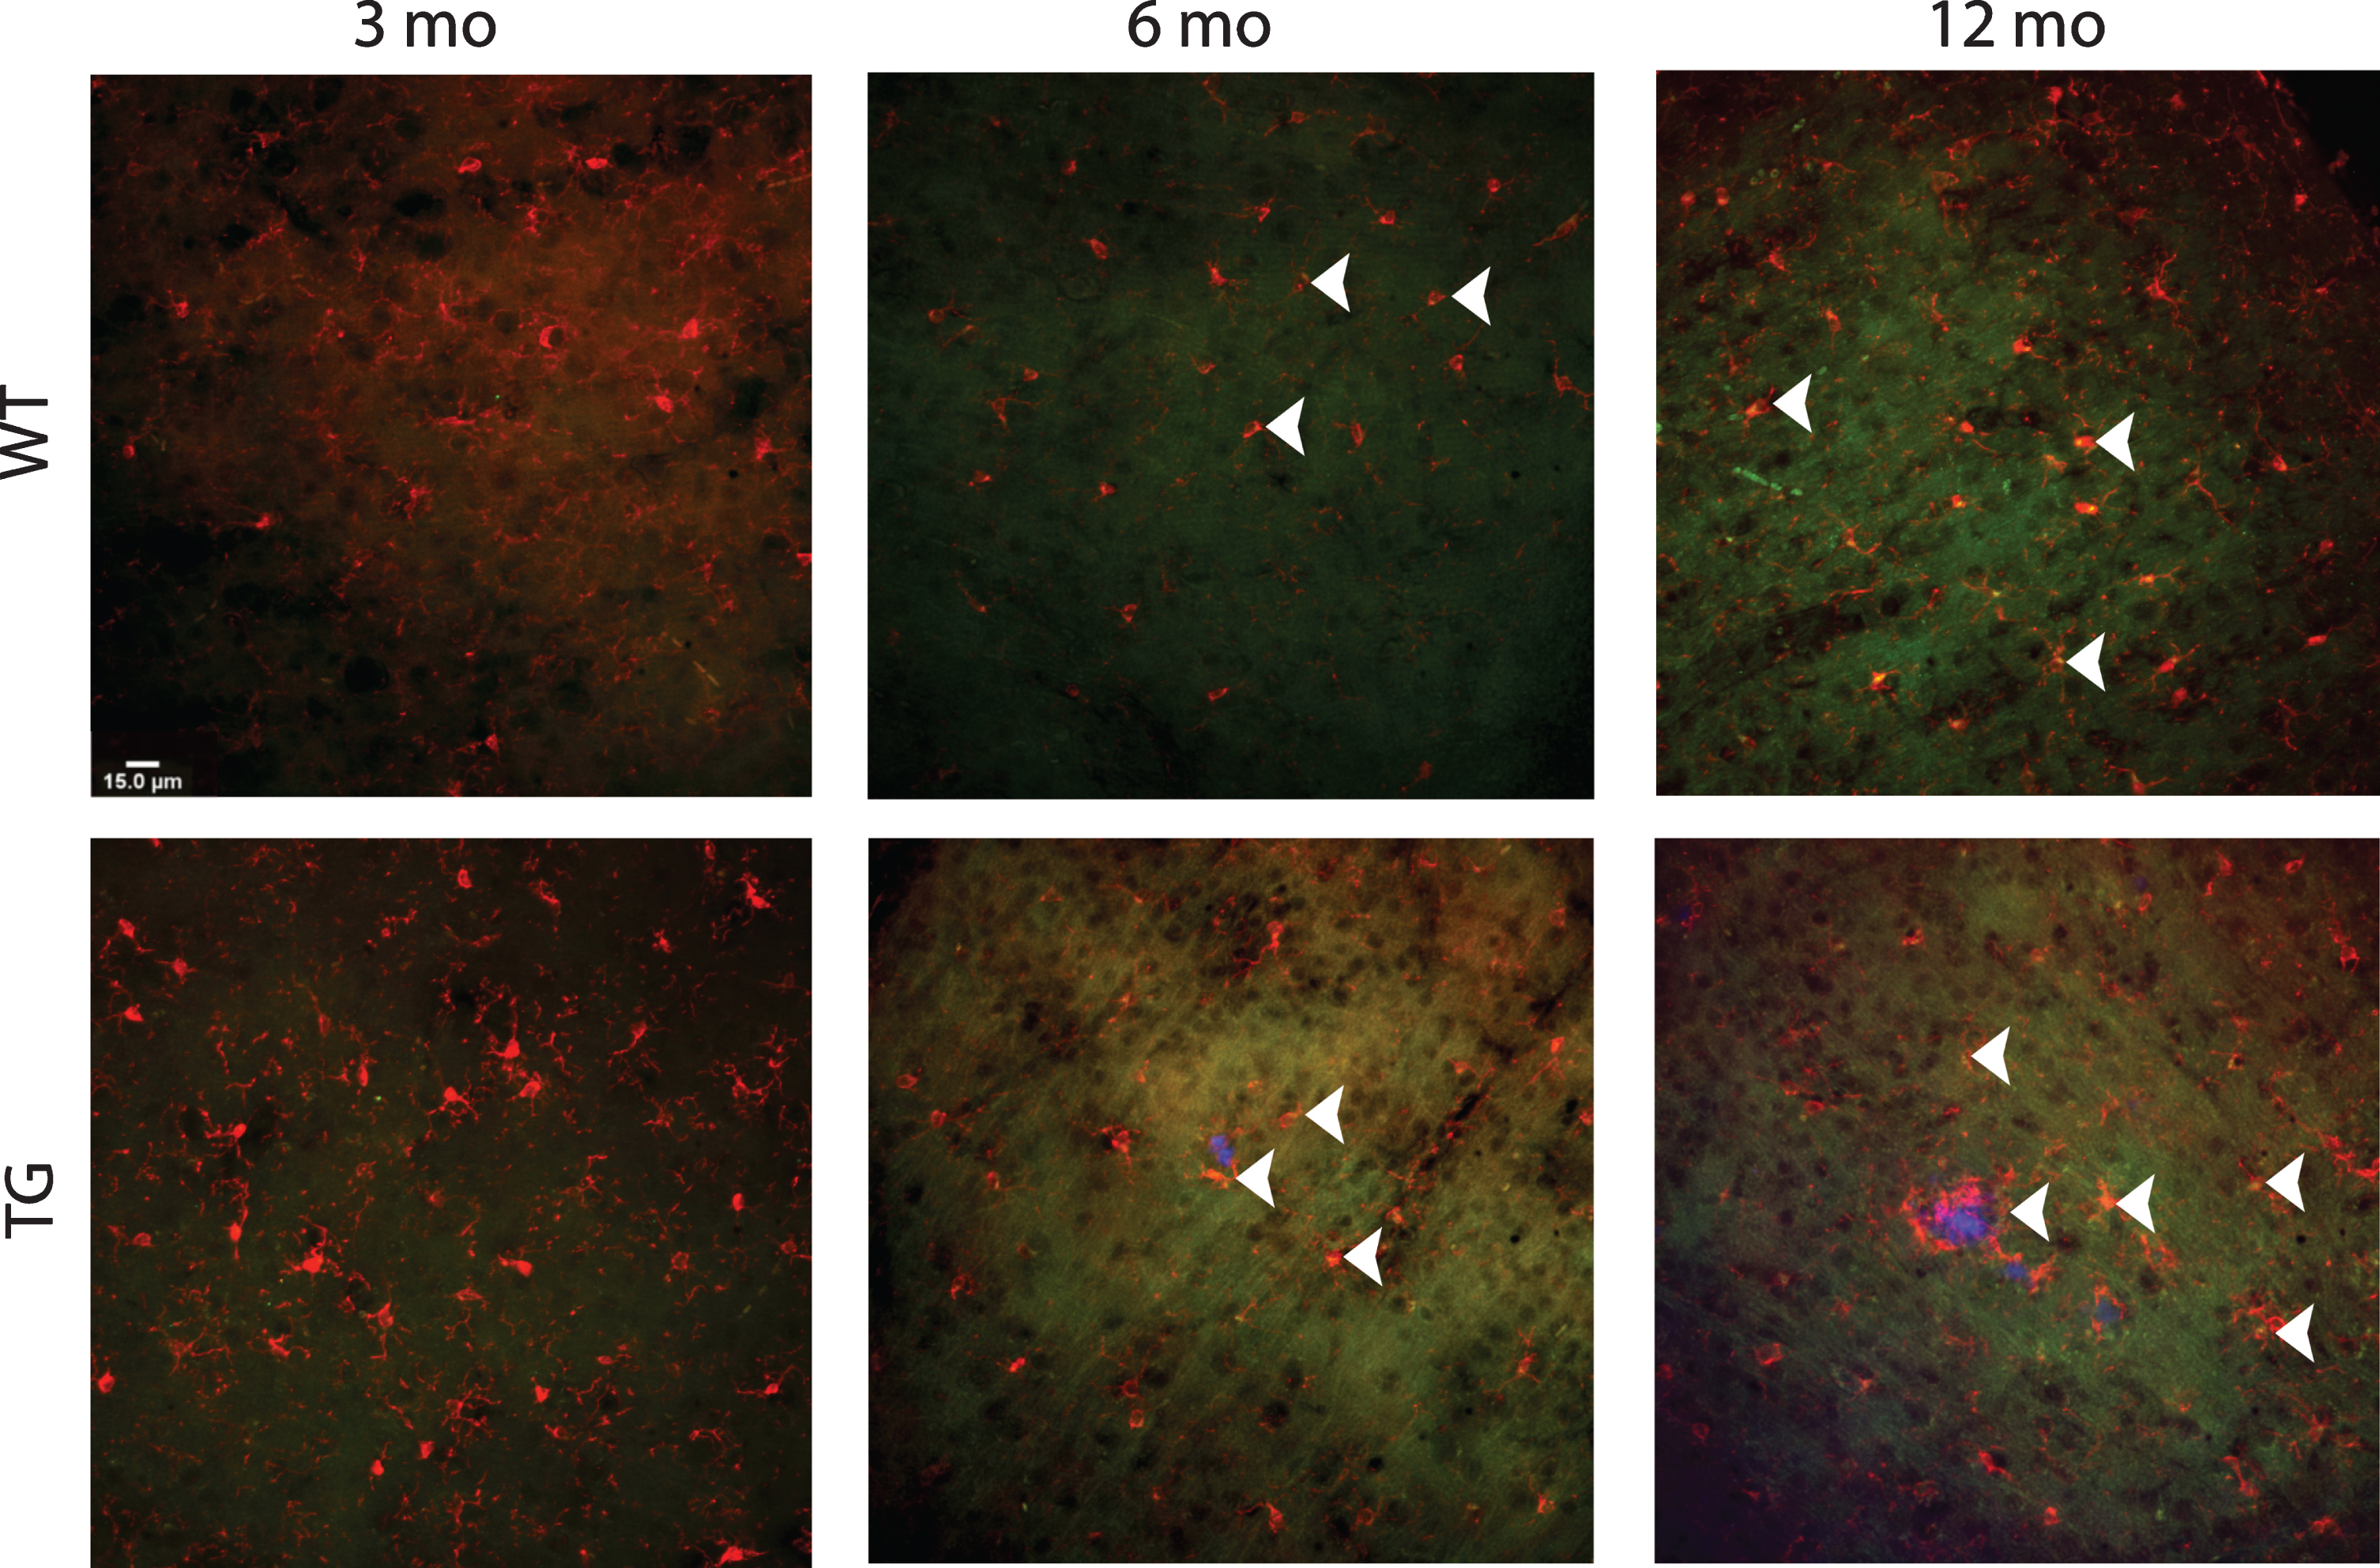
Representative immunohistochemical images of CD16 and Iba1. Ramfied Iba1 (red) microglia were evenly distributed throughout the wildtype (WT) cortex, whereas Iba1 positive microglia in the APP/PS1 (TG) mice displayed a mixed morphology of activated and ramified. CD16 (green) was evident from 3 months of age regardless of strain, with significant increases at 6 months in the both the WT and APP/PS1 (TG) mice. CD16 was still evident at 12 months in both strains.
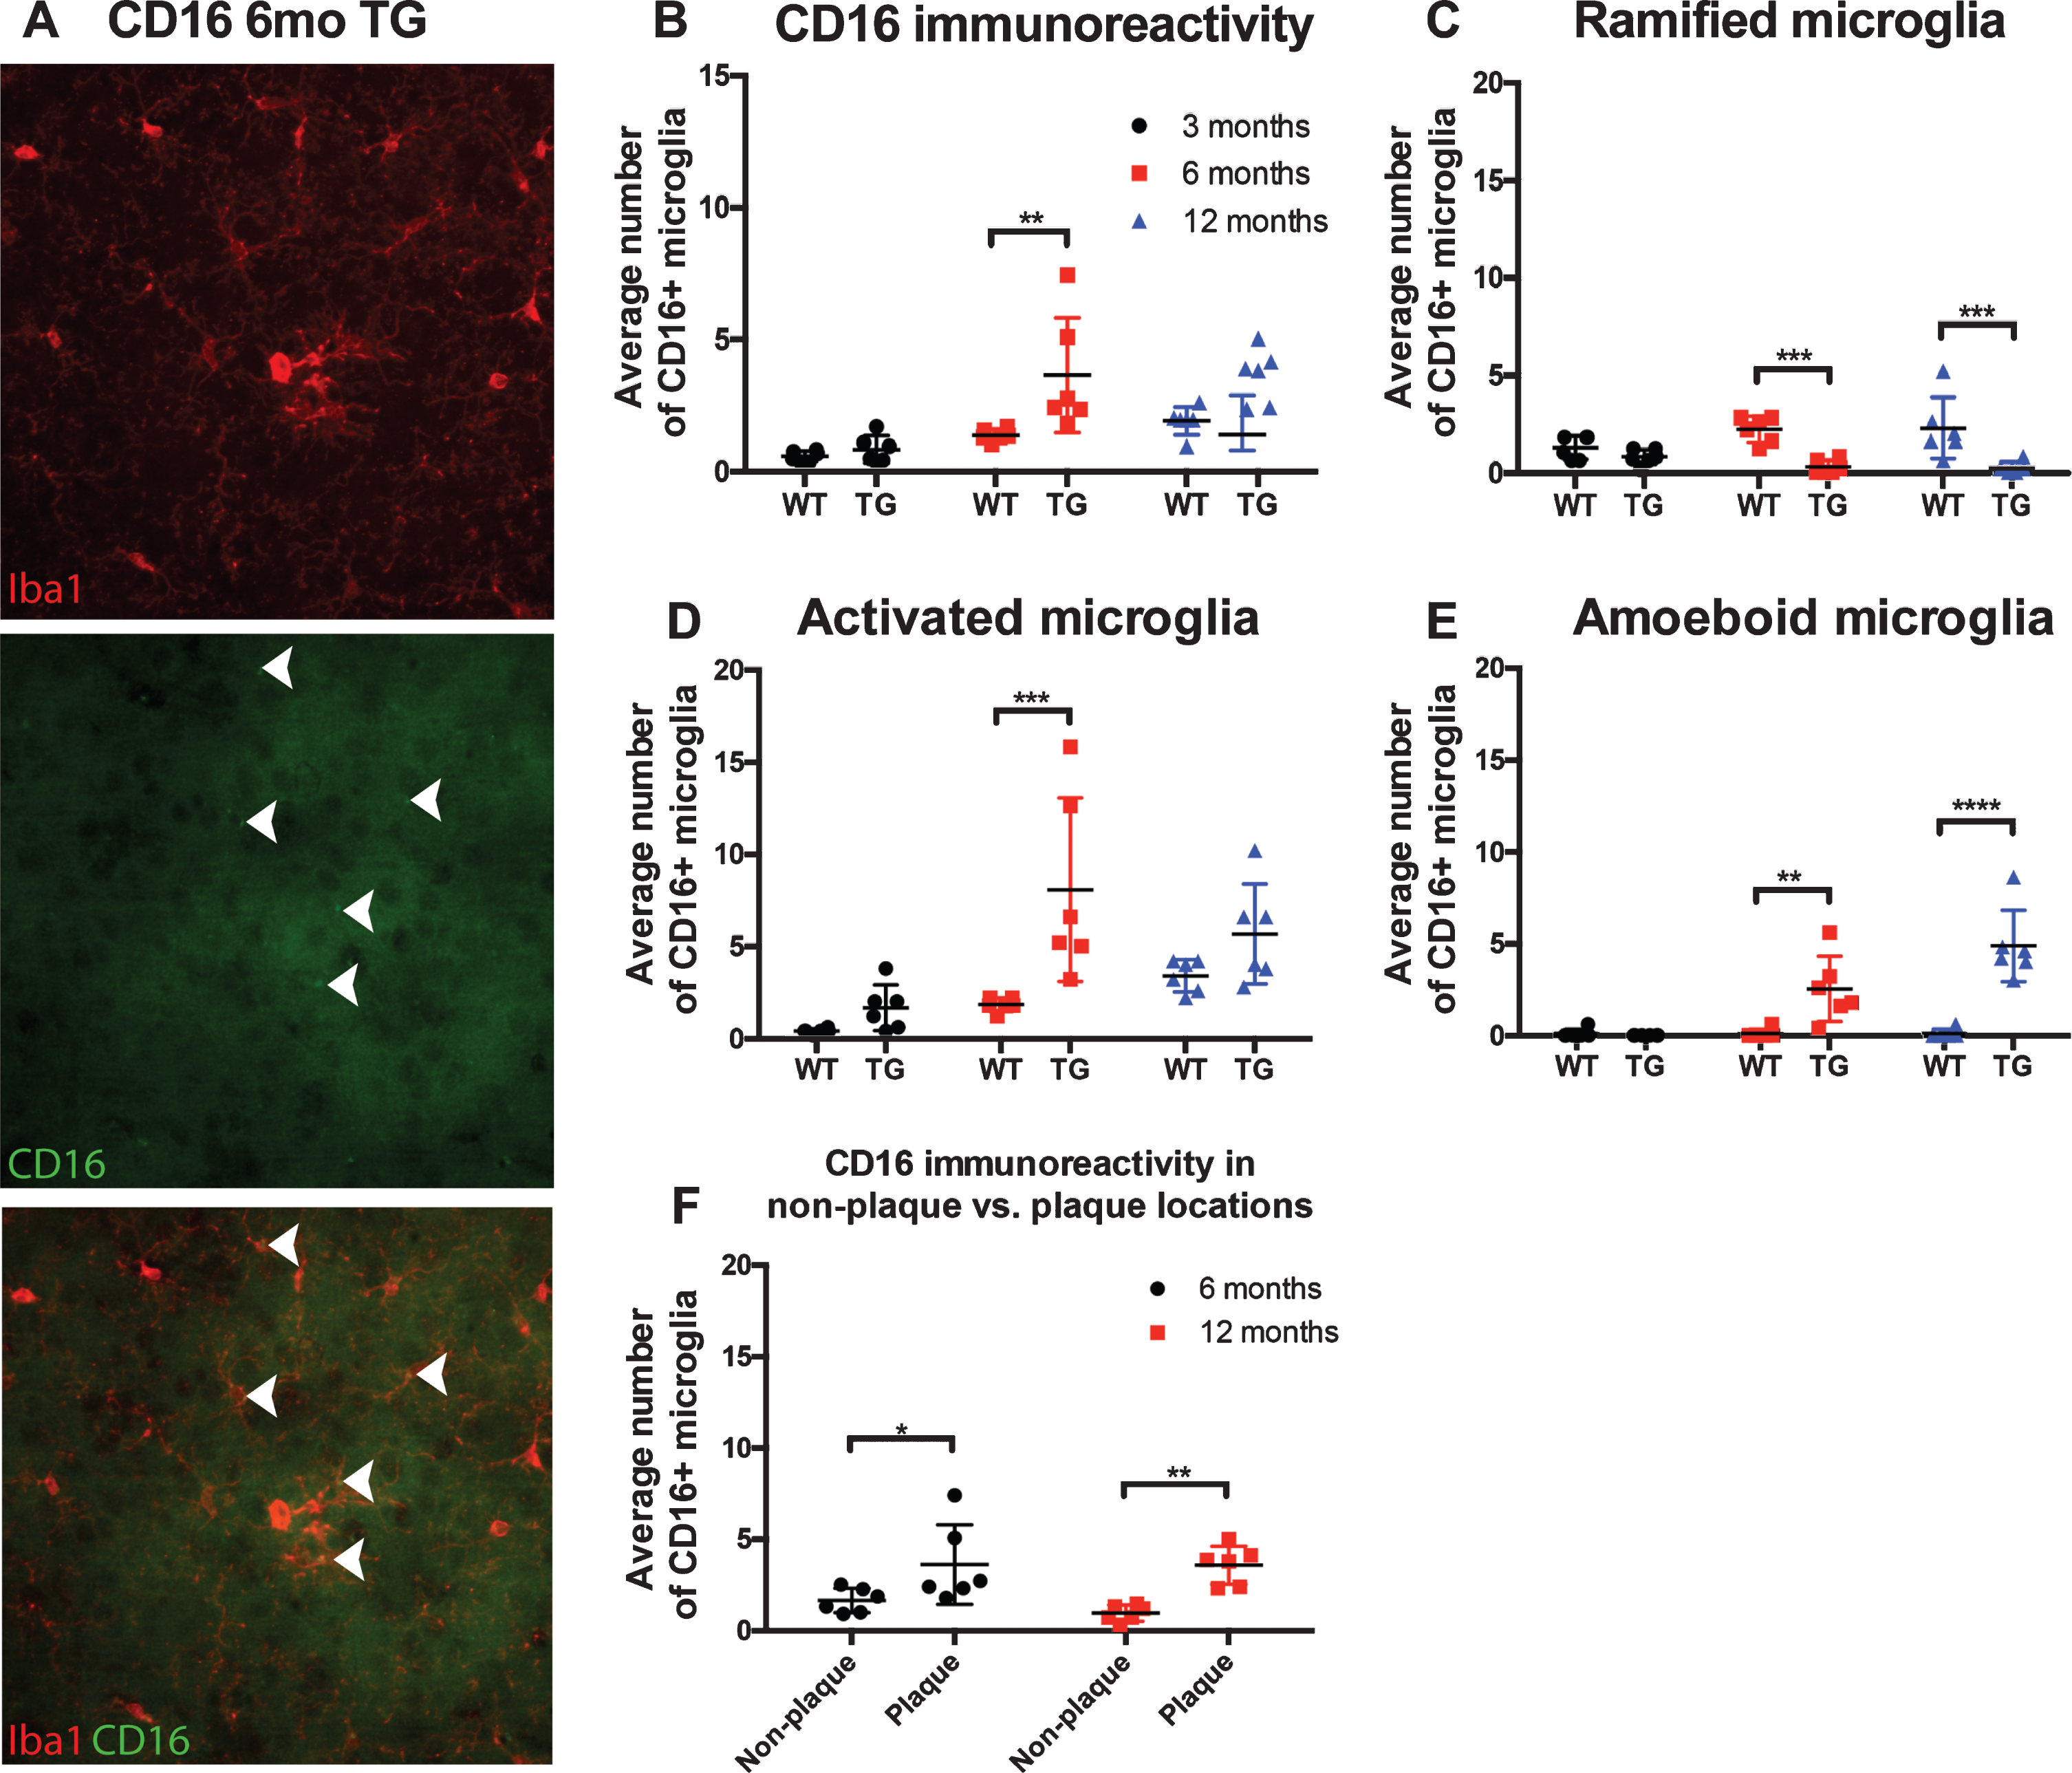
Quantification of CD16 immunoreactivity. Representative high power image of CD16 immunohistochemistry staining in separate channels and merged. Closed arrows denote colocalization of Iba1 positive microglia and CD16 (A). Statistical analysis via a two-way ANOVA revealed CD16 immunoreactivity, not accounting for morphological subtypes demonstrated a non-significant interaction between age and strain (F (2,30) = 3.026, p = 0.0635; B). Separating CD16 positive microglia based on morphological subtype significance was found between age and strain in the ramified (F (2,30) = 3.705, p = 0.0365; C), activated (F (2,30) =3.593, p = 0.0399; D),and amoeboid (F (2,30) = 15.06, p < 0.0001; E) morphologies through two-way ANOVA. Spatial analysis was also performed of CD16+ immunoreactive microglia at plaque and non-plaque sites. it was determined that CD16 expression was significantly upregulated at both 6 months (p < 0.05) and 12 months (p < 0.001) at plaque locations (F).
At 3 months of age, approximately 31% of microglia counted co-localized with CD16 in the Tg mice; with a majority (∼69%) of those CD16 microglia being in the activated morphology. In WT mice, approximately 22% of microglia at 3 months colocalized with CD16, with a majority (∼76%) being in the ramified morphology. At 6 months, approximately 42% of microglia counted were positive for CD16 in the Tg mice. Of the CD16 microglia approximately 74% were in an activated state, whereas in the WT mice, approximately 46% of microglia counted were CD16 positive and a majority of these (54%) were ramified. By 12 months, CD16 in the Tg mice remained at approximately 34% of microglia counted; however, a majority (53%) of these were in the activated morphology. Conversely, at 12 months in the WT mice, 62% of the microglia counted were positive for CD16, of which 59% were in the activated morphology (see Table 3).
CD16 positive microglia in wild-type (WT) and APP/PS1 (TG) mice at 3, 6, and 12 months of age. Numbers in brackets are Iba1 positive microglia counted
Separating CD16 positive microglia based on morphological subtype significance was found between age and strain in the ramified (F (2,30) = 3.705, p =0.0365; Fig. 7C), activated (F (2,30) = 3.593, p =0.0399; Fig. 7D), and amoeboid (F (2,30) = 15.06, p < 0.0001; Fig. 7E) morphologies through two-way ANOVA. Further multiple comparisons using Tukey’s post-hoc demonstrated significant positive CD16 in activated microglia at 6 months of age in the Tg mice (p < 0.001) compared to controls. For the amoeboid morphology, CD16 immunoreactivity was significantly upregulated in the Tg mice at both 6 months (p < 0.001) and 12 months (p < 0.0001) compared to WT mice. Overall, analyzing positive CD16 microglia between the morphologies, CD16 was most prominent in the activated morphology at 6 months. Further spatial analysis was also performed of positive CD16 microglia at plaque and non-plaque sites. it was determined that CD16 was significantly upregulated at both 6 months (p < 0.05) and 12 months (p < 0.001; Fig. 7F) at plaque locations.
TREM2 is associated with anti-inflammatory properties and previously has been shown to have increased expression in normal aging [28]. TREM2 variants have been identified as a risk factor for AD, with recent studies reporting an increase in the AD brain [28]. In the Tg mice we hypothesized that positive TREM2 microglia would increase in the activated morphology correlating to increase amyloid plaque deposition (Fig. 8).
Representative immunohistochemical images of TREM2 and Iba1. Ramfied Iba1 (red) microglia were evenly distributed throughout the wildtype (WT) cortex, whereas Iba1 positive microglia in the APP/PS1 (TG) mice displayed a mixed morphology of activated and ramified. TREM2 (green) staining was more pronounced at 6 months in both the WT mice and TG mice. However, at 12 months TREM2 was most evident in TG mice.
At 3 months of age, approximately 15% of microglia counted co-localized with TREM2 in the Tg mice; with a majority (∼69%) of those TREM2 microglia being in the ramified morphology. In WT mice, approximately 36% of microglia at 3 months colocalized with TREM2, with a majority (∼78%) being in the ramified morphology. At 6 months, approximately 55% of microglia counted were positive for TREM2 in the Tg mice. Of the TREM2 microglia approximately 67% were in an activated state, whereas in the WT mice, approximately 48% of microglia counted were TREM2 positive and a majority of these (76%) were ramified. By 12 months, TREM2 in the Tg mice remained at approximately 50% of microglia counted; however, a majority (60%) of these were in the activated morphology. Conversely, at 12 months in the WT mice, 54% of the microglia counted were positive for TREM2, of which 52% were in the activated morphology (see Table 4).
TREM2 positive microglia in wild-type (WT) and APP/PS1 (TG) mice at 3, 6, and 12 months of age. Numbers in brackets are Iba1 positive microglia counted
Through two-way ANOVA analysis of TREM2 immunoreactivity, a significant interaction was found between age and strain in all morphological subtypes (F (2,30) = 10.75, p = 0.0003; Fig. 9B). Through further analysis with Tukey’s post-hoc, TREM2 immunoreactivity was found to be significantly upregulated in the AD mice at 12 months of age (p < 0.0001) compared to control mice. When analyzing the morphology of TREM2 positive microglia through a two-way ANOVA, a significant interaction between age and strain was found in activated (F (2,30) = 6.244, p = 0.0054; Fig. 9D) and amoeboid (F (2,30) = 26.71, p < 0.0001; Fig. 9E) morphologies when compared to controls. Further multiple comparisons using Tukey’s post-hoc demonstrated significant downregulation of TREM2 immunoreactivity in the ramified morphology at 6 months (p < 0.05; Fig. 9C) compared to controls. TREM2 immunoreactivity in the activated morphology microglia was significantly downregulated at 6 months (p < 0.05) but then upregulated at 12 months (p < 0.001). Amoeboid/macrophage-like microglia, TREM2 immunoreactivity found significant upregulation in the Tg mice at both 6 months (p < 0.05) and 12 months (p < 0.0001). Overall, when comparing TREM2 in all morphological subtypes, TREM2 immunoreactivity in the APP/PS1 mice was most prominent at both 6 and 12 months in the activated morphology. Further spatial analysis of all microglial morphology subtypes revealed TREM2 positive microglia were significantly associated with plaque sites at 12 (p < 0.001; Fig. 9F) months of age.
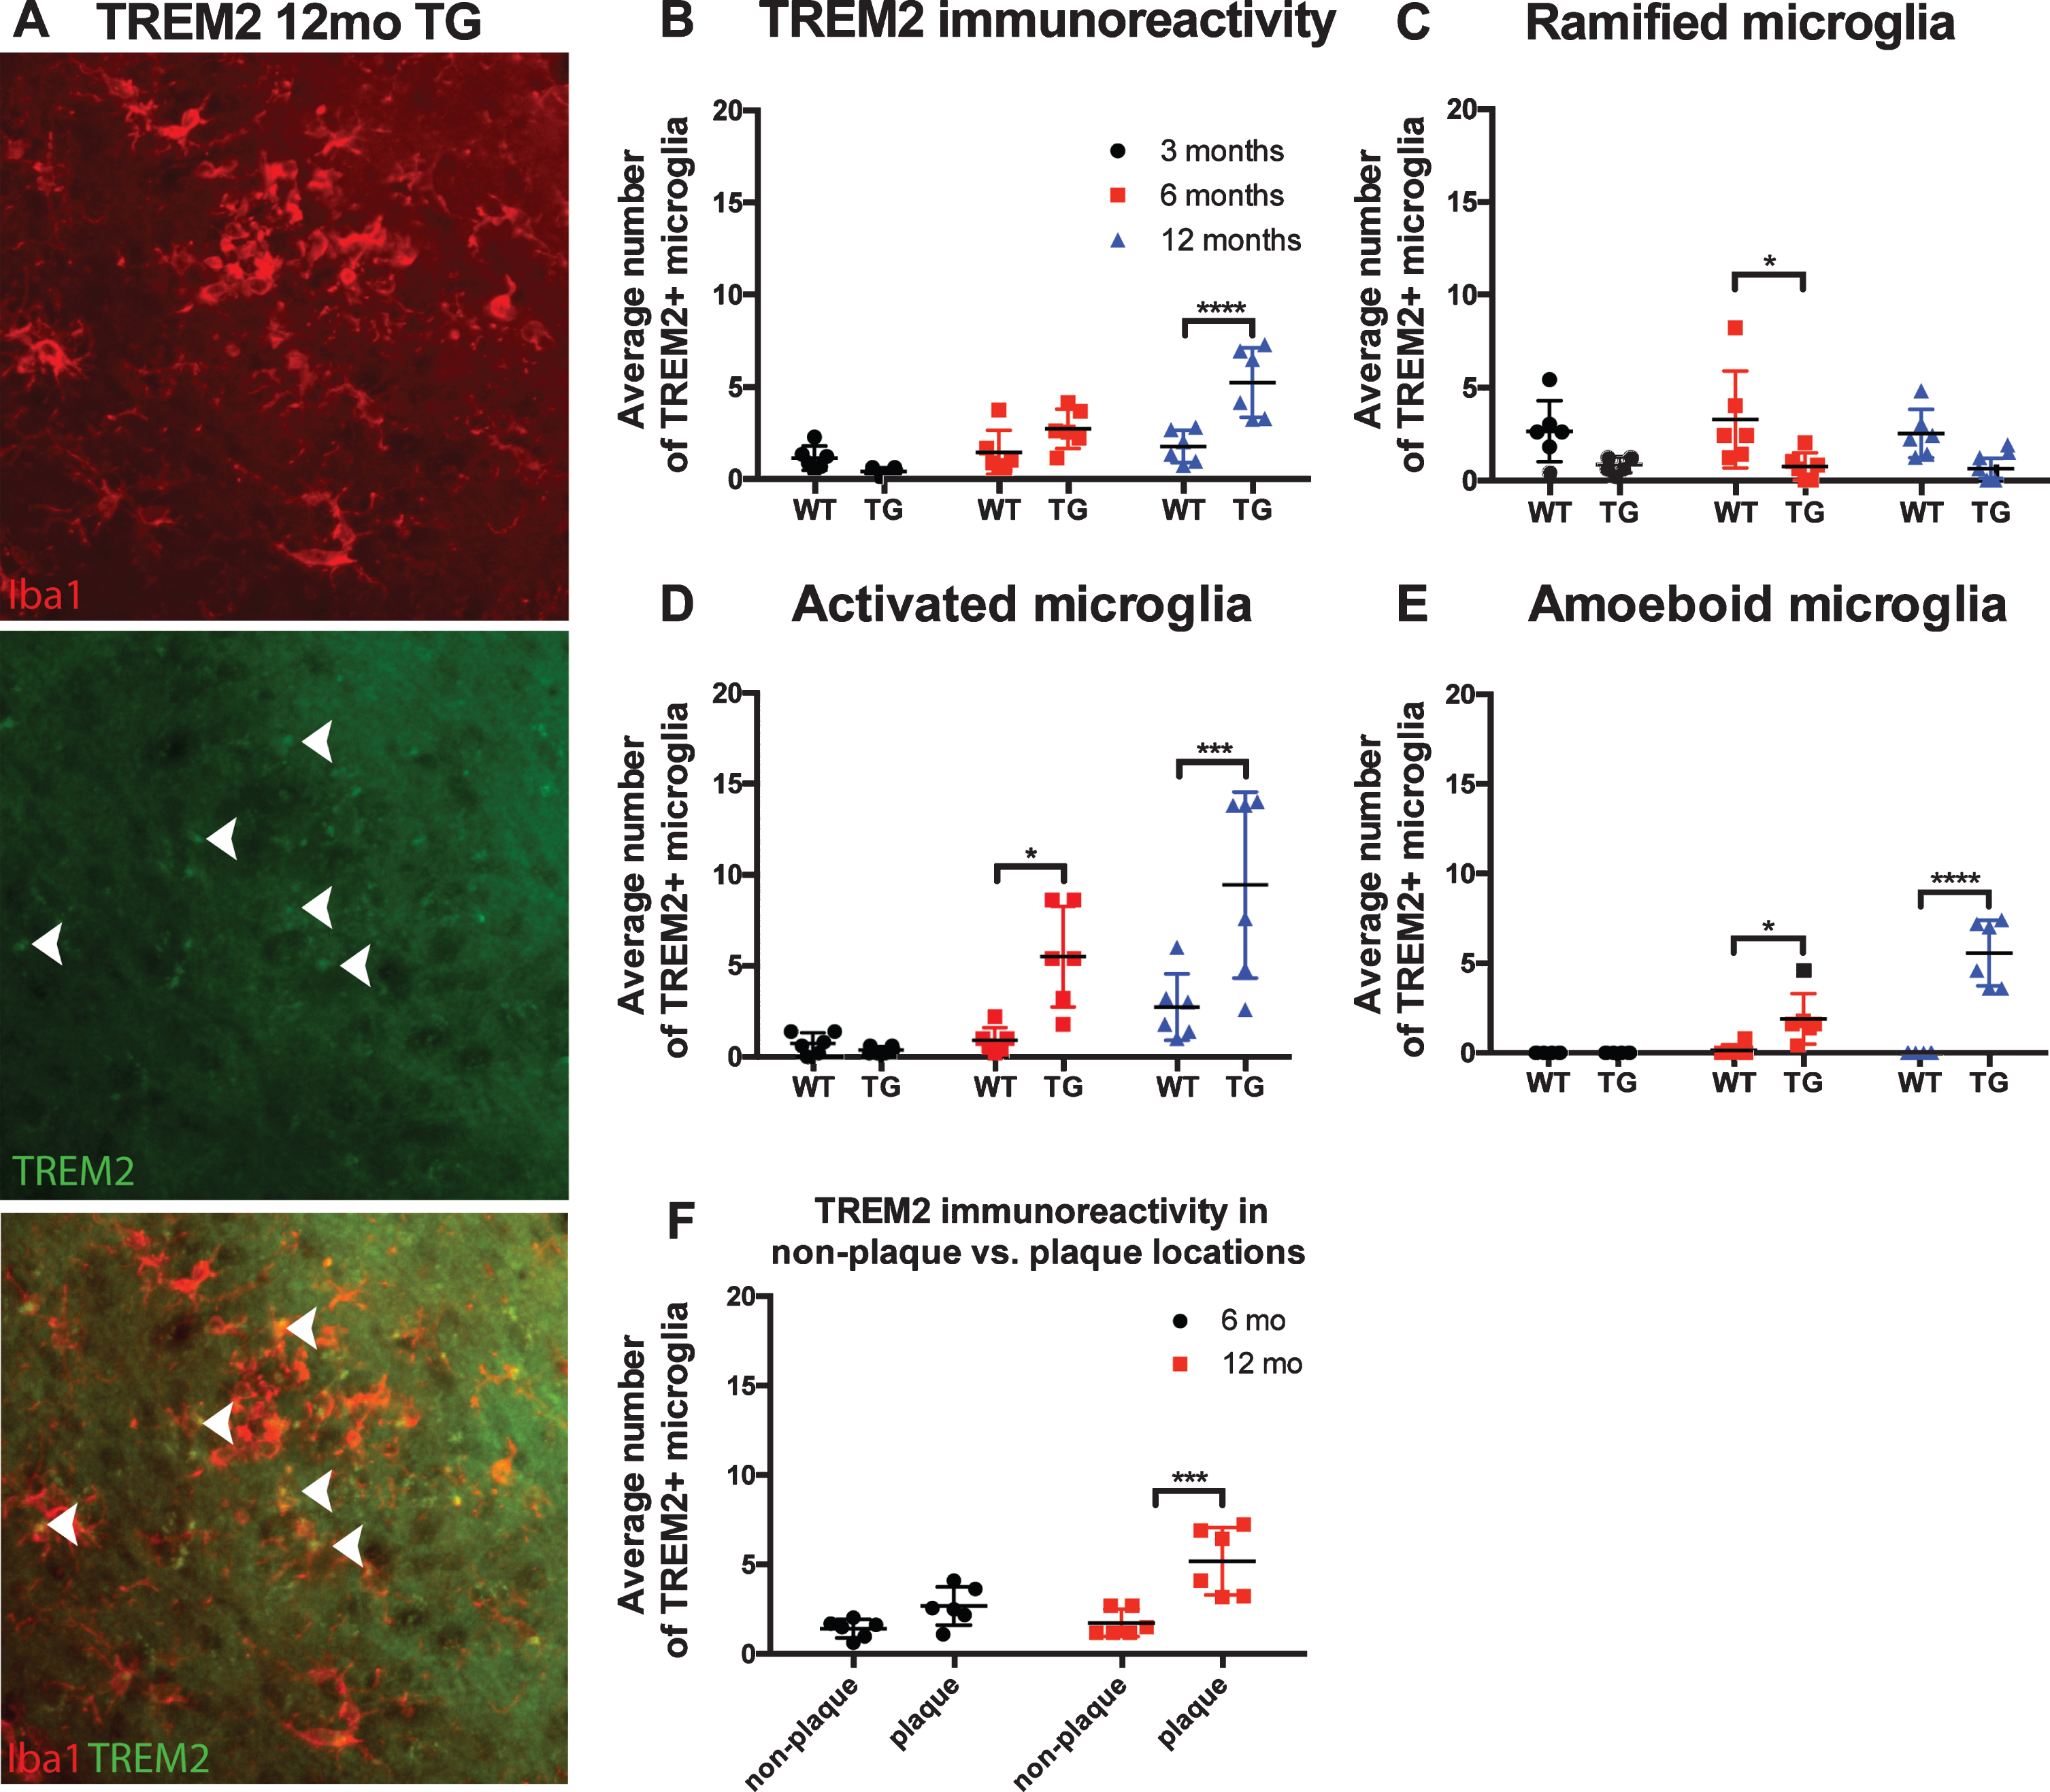
Quantification of TREM2 immunoreactivity. Representative high power image of TREM2 immunohistochemistry staining in separate channels and merged. Closed arrows denote colocalization of Iba1 positive microglia and CD16 (A). Analysis via a two-way ANOVA revealed a significant interaction of TREM2 expression between age and strain in all morphological subtypes (F (2,30) = 10.75, p = 0.0003; B). Using Tukey’s post-hoc transgenic mice demonstrated a significant downregulation of TREM2 in the ramified morphology at 6 months (p < 0.05; C) compared to controls. When breaking down morphology TREM2 expression through a two-way ANOVA, a significant interaction between age and strain was found in activated (F (2,30) = 6.244, p = 0.0054; D) and amoeboid (F (2,30) = 26.71, p < 0.0001; (E)) morphologies when compared to controls. Further spatial analysis of all microglial morphology subtypes revealed TREM2 expression of all microglial morphologies was significantly associated with plaque sites at 12 months of age (p < 0.001; F).
DISCUSSION
Our study investigated different microglial morphologies and their expression of cell surface markers to develop a greater understanding of the microglial phenotype in AD. Our data suggests that both pro- and anti-inflammatory cell surface marker increase with mounting plaque deposition at 3, 6, and 12 months in an APP/PS1 mouse model. Both inflammatory phenotypes were associated with the activated morphological subtype; however, CD14 expression was associated with the amoeboid morphology. The authors acknowledge that solely using immunohistochemistry to examine microglia in AD is a limitation of this study. However, by collecting the tissue for immunohistochemistry it enabled spatial examination of microglia in regions close to plaques and the capacity to visualize phenotype of microglia to morphology and plaque size. By collecting tissue for molecular techniques such as western blotting or PCR, the capacity to determine microglial specific morphology and the location in relation to plaques is lost. Further studies which incorporate these molecular techniques to confirm immunohistochemistry results are required. This study has important implications for understanding microglial inflammation in AD, adding further evidence for a push for phenotypic analysis to move away from discrete characterization.
Morphometric changes were associated with increasing amyloidosis
The morphometric aspect of this study investigated the change in ramified, activated and amoeboid morphologies. To classify morphology of microglia we used parameters from our previously published studies [11 –17]. A limitation of this is the subjective nature of classification and the lack of morphometrical details, such as soma size, number and length of processes and branch points (see [29, 30]). Nonetheless, data suggests that with increasing amyloidosis, microglia undergo a distinct morphological shift. In the Tg mice, ramified microglia were observed to decrease at each time point, which was particularly obvious around plaques. The decrease of ramified microglia may be indicative of parenchyma surveillance loss, instead moving toward defensive morphologies. In our age-matched controls there was also a decrease in ramified microglia, though not to the extent seen in the Tg mice. These data mirror reports from other models, where reduced microglial arborizations were observed [29]. The de-ramification of Tg mice may be reflective of disease progression alone [31].
The activated microglial morphology increased significantly in the APP/PS1 mouse model. Inversely to the ramified morphology, an increase of activated microglia was observed at both 6 and 12 months, compared to control mice. This morphology was mostly associated with the increase pro-inflammatory profiles, suggesting a role in becoming reactive to homeostatic changes phenotype. However, this does not exclude other morphologies from being able to express inflammatory markers as evident in this study. Similarly, to activated, amoeboid microglia/macrophages also increased at 6 and 12 months of age, particularly at plaque sites. It remains unclear whether these morphological changes are a sign of degeneration to the disease process or instigated for a specific role. However, studies have demonstrated a physical role for the rapid increase of microglia at plaque sites. The upsurge of activated and amoeboid microglia/macrophages that are directly associated, encapsulating the plaques in a sense, has been shown to have role in limiting plaque expansion [32, 33]. The behavior of microglia morphological shifts is arguably heavily dependent on the stage of disease.
The increased distortion of microglial morphologies has been previously hypothesized to be indictive of dysregulation and the last step before senescence [34]. This is known as the glial cell dysregulation hypothesis of AD, whereby the increasingly toxic environment renders microglial defensive functions, and ultimately perpetuates the disease process through abnormal expression of cytokine, reactive species, and other mediators [34]. This suggests that even though this study saw an increase of cell surface markers associated with pro- and anti-inflammatory properties, it does not mean that their downstream effects are functional. The morphological shifts observed in this study therefore could align with a theory of microglial dysregulation in neurodegeneration, where clumping of swollen microglia and loss of homogenous tissue distribution occurs [34]. A limitation of the current study is that the APP/PS1 mouse is only modelling one pathological hallmark of AD and potentially we are only visualizing a small component of the microglial damage. Further research is therefore required with the combination of neurofibrillary tangles, which could advance microglial dysregulation.
AD microglia present mixed inflammation
Our study demonstrated that microglia are heterogenic in the immunoreactivity of cell surface markers. Inflammatory markers are therefore not fitting to determine microglial modality nor morphology alone, as the markers used are both beneficial and deleterious to AD pathology. We suggest that microglia express a mixture or pro- anti-inflammatory cell markers that potentially are not functioning appropriately. Previously used nomenclatures, including M1 and M2, have been too simplistic to describe microglial responses, as it does not encompass the theory of microglial dysregulation. The incorporation of other microglial surface markers would be advantageous in future studies. In accordance with the microglial community, the emerging agreeance is that microglia are heterogeneous in their phenotypic profile [35]. We investigated cell surface expression of CD16, TREM2, CD14, and CD40. CD16 and TREM2 are associated with anti-inflammatory properties and have been used to define microglial populations in health and disease models [6 , 36], whereas CD14 and CD40 are typically assigned pro-inflammatory properties and thus have been used to determine deleterious microglia [6, 37]. This study reports mixed inflammation across 3, 6, and 12 months in APP/PS1 mice, with the number of microglia that were positive for the pro-inflammatory markers, CD14 and CD40, being slightly elevated at 6 and 12 months compared to the anti-inflammatory markers TREM2 and CD16. However, the proportion of microglia which were positive for CD14, CD40, or TREM2 was similar ∼50% in APP/PS1 mice. The proportion of microglia positive for CD16 remained at ∼30% in APP/PS1 mice compared to ∼60% in wild-type, suggesting the potential dysregulation of anti-inflammatory markers is an indicator of disease status and more research is required to fully elucidate this point.
Anti-inflammatory cell surface markers: CD16 and TREM2
Anti-inflammation in AD has previously been suggested to be dampened or to disrepair through the production of pro-inflammation [38]. Our data agrees with this notion that anti-inflammation is dampened or dysregulated, as their corresponding cell surface markers are not decreasing overtime. To the best of our knowledge there have been no previous studies looking at a relationship between CD16 and TREM2 marker immunoreactivity in microglial morphological subsets, nor has their immunoreactivity over multiple time points in an APP/PS1 mouse model been quantified. CD16 is characterized by ligation of immunoglobulin Fc gamma receptors (FcγRs), resulting in downregulated expression of IL-12 and increased IL-10 and HLA-DR expression, while TREM2 is associated with a wide array of functions in the healthy CNS, such as survival, activation, proliferation, phagocytosis, cell maturation, and inflammation [39]. TREM2 has also been shown to inhibit inflammation through downregulation of PI3 K/AKT and NF-kB signaling [40].
CD16 immunoreactivity was found to be increased at 6 months in activated morphology, whereas TREM2 was significantly higher in activated morphologies at both 6 and 12 months. Human studies of microglia CD16 are few, with one noting an early AD stage increase of CD16 [41], and another showing a decrease in late stage AD [42]. We also demonstrate an increase of CD16 and TREM2 in ramified microglia in WT mice at 6 and 12 months of age. This fits into the research showing that normal ageing phenotypes show an increase in inflammatory markers [43]. Even though TREM2 is associated with anti-inflammatory profiles, contemporary literature is finding an increase of TREM2 immunoreactivity in human AD brains [28, 44].
Recent literature found that TREM2 variants are in fact a risk factor for early-onset AD [45]. TREM2 mediates the switch from homeostatic to a neurodegenerative microglia phenotype in APP/PS1 mice through the APOE pathway [46]. This contradicts the use of markers being used to phenotype microglia into discrete, pro- or anti-inflammatory phenotypes. Our data further indicates microglia activation does not adhere solely to a pro- or anti-inflammatory framework. Potential reasons for the differences in anti-inflammatory microglia being upregulated and downregulated at different time points would most likely be due to functionality and disease-specific expressions. We recognize that though we see the immunoreactivity, whether this expression is functional was not investigated at this point.
Pro-inflammatory markers: CD14 and CD40
Pro-inflammation is widely associated with end-stage of disease [38]. Our study looked at the pro-inflammatory markers, CD40 and CD14. To our knowledge, very few studies have looked at these markers over time to increasing plaque load, nor have studied them in association with any specific morphology. However, both markers having been identified in post-mortem tissue of AD patients [5, 47]. CD40 and its corresponding CD40 ligands play a critical role in the activation of microglial and inflammatory marker expression. The expression of CD40/CD40L has been reported to be altered in AD patients [48]. The induction of CD40 on microglial occurs in the presence of soluble forms of Aβ, suggesting an early role of CD40 in disease progression. CD14 is associated with pro-inflammation and thus an M1 phenotype; however, functionally CD14 is more diverse, as it also plays a role in phagocytic function [48].
As detection techniques become more sophisticated, more reports are providing evidence that microglia are never resting [49 –51]. The ramified morphology is constantly surveying the microenvironment. Indeed, ramified microglia undergo various changes to respond to stimuli to move into what is traditionally referred to as an activated state [14, 49]. In this state they are hypothesized to secrete pro-inflammatory cytokines and express inflammatory markers. However, little is known about whether microglia continue to express these markers as they return from their deramified “activated” state back to their ramified “resting” morphology. Here, we show that ramified microglia do indeed express an array of markers that have traditionally been assigned to deramified states, particularly CD14. This is in line with evidence that ramified microglia have the capacity to phagocytose. It also adds to the growing body of evidence that microglia may become primed through aging and after exposure to insults, disease or infections and never fully return to the naïve ramified state [14 , 53]. Indeed it has been reported tha microglia are primed from middle age [54].
Previous literature investigating the potential role of CD14 in APP/PS1 mice has reported decreased plaque burden when CD14 is knocked out [7]. Further, CD14 knockout mice had increased expression of genes encoding for proinflammatory cytokines and decreased alternative activation markers of microglia, Fizz1 and Ym1. Taken together with the data from the current study, further investigation into the inflammatory pathways mediated by CD14, especially in AD, is warranted as these data suggest CD14 is a critical regulator of the microglial inflammatory response to amyloidosis.
CONCLUSION
Our results demonstrated that microglia cell surface expression present in a mixed inflammatory profile corresponding with increasing plaque deposition. Furthermore, these distinctive profiles were localized to plaque sites. Our data indicate microglial inflammatory profiles are on a continuum throughout disease progression, with the balance being pushed towards pro-inflammatory markers. Further, morphological analysis indicated a characteristic pattern in AD progression compared to wildtype, with the activated morphology being associated with increased mixed inflammation. This research highlights the intricacies of microglial expression and morphological shifts that occur in AD.