
Abstract
Background:
Alzheimer’s disease (AD) is the most prevalent form of dementia with two pathological hallmarks of tau-containing neurofibrillary tangles and amyloid-β protein (Aβ)-containing neuritic plaques. Although Aβ and tau have been explored as potential biomarkers, levels of these pathological proteins in blood fail to distinguish AD from healthy control subjects.
Objective:
We aim to discover potential plasma proteins associated with AD pathology by performing tandem mass tag (TMT)-based quantitative proteomic analysis of proteins from peripheral and central nervous system compartments.
Methods:
We performed comparative proteomic analyses of plasma collected from AD patients and cognitively normal subjects. In addition, proteomic profiles from the inferior frontal cortex, superior frontal cortex, and cerebellum of postmortem brain tissue from five AD patients and five non-AD controls were compared with plasma proteomic profiles to search for common biomarkers. Liquid chromatography-mass spectrometry was used to analyze plasma and brain tissue labeled with isobaric TMT for relative protein quantification.
Results:
Our results showed that the proteins in complement coagulation cascade and interleukin-6 signaling were significantly altered in both plasma and brains of AD patients.
Conclusion:
Our results demonstrate the relevance in immune responses between the peripheral and central nervous systems. Those differentially regulated plasma proteins are explored as candidate biomarker profiles that illustrate chronic neuroinflammation in brains of AD patients.
Keywords
INTRODUCTION
The neuropathological hallmarks of Alzheimer’s disease (AD) are senile plaques of amyloid-β (Aβ) and neurofibrillary tangles made of the hyperphosphorylated form of the microtubule-binding protein tau. Genetic and neuropathologic evidence suggests that AD is caused in part by the overproduction and lack of clearance of Aβ [1 –3], accompanied by enhanced neuroinflammation [4 –6]. Cells bearing familial AD mutant genes (amyloid precursor protein or presenilin genes) produced higher levels of oligomeric Aβ [7], and similar increases of oligomeric Aβ were observed in plasma and postmortem brains of AD patients [8]. It has been documented that the oligomeric form of Aβ seems to be the most toxic species of Aβ as well as the precursor to the fibrillary Aβ found in senile plaques [1 , 9–12]. The second hallmark of AD is tau-containing neurofibrillary tangles. A common characteristic event that disrupts tau microtubule function and precedes tangle formation and neurodegeneration is increased phosphorylation of tau, especially on Ser/Thr-Pro motifs [13 –20]. A combination of measurements of the 42-residue of Aβ (Aβ42), tau, and phosphorylated tau at residue 181 (pTau181) in human cerebrospinal fluids (CSF) has emerged as the best predictor for AD progression [21 –23]. A decrease of CSF Aβ42 is associated with increased brain Aβ plaque load and can be used to predict Clinical Dementia Rating (CDR) scale 0 converting to CDR > 0, mild cognitive impairment (MCI) patients converting to probable AD, and diagnosis of AD [21 –23]. However, peripheral biomarkers would clearly be advantageous over CSF biomarkers due to the invasive nature of CSF collection,
Both plasma Aβ [24 –29] and phosphorylated tau [30 –34] have been reported for their correlation with AD brain pathology, but their implementation in clinical settings needs further validation [35]. Additional plasma proteins are found to associate with AD and brain amyloid deposits [35 –42]. Earlier studies in prodromal AD patients applied untargeted proteomics to compare plasma protein profiles. Participants from the Australian Imaging, Biomarkers and Lifestyle Study (AIBL) were analyzed for their brain Aβ load determined by Pittsburgh Compound B (PiB)-PET and correlated to levels of 176 plasma proteins [43]. Among all these proteins, chemokine ligand 13, immunoglobulin M-1, pancreatic polypeptide (PPY), interleukin-17, and vascular cell adhesion protein (VCAM-1) are found to be associated with people with high Aβ load. This finding was further validated in healthy control subjects enrolled in the Alzheimer’s Disease Neuroimaging Initiatives (ADNI), which indicated that those carrying the above plasma protein profile were more likely to progress to MCI or AD than non-carriers [43]. A large scale validation study using Luminex xMAP and Meso Scale Discovery platforms was performed to identify a plasma biomarker panel to be predictive of in vivo AD pathology: β2-microglobulin (B2M), cathepsin D (CTSD), ficolin-2 (FCN2), complement component 4 (C4), alpha-1 antitrypsin (A1AT), complement factor I (CFI), and apolipoprotein E (ApoE). This panel was found to be consistent in both APOE ɛ4 carriers and non-carriers [44].
Despite significant progress toward the discovery of plasma proteins linked to brain pathology made in the past decade, a consistent set of plasma biomarkers that segregate with AD has not been identified. Among 163 candidate plasma biomarkers identified in 21 published studies, only four common candidate biomarkers are found in five independent cohorts: A2M, complement C3, α-1-antitrypsin, and ApoE [45]. A2M is genetically associated with AD [46], and complement C3 is involved in synaptic dysfunction in AD [47]. Levels of A2M in serum or plasma were found either increased in cognitively normal people with subjective cognitive decline [48] and early stage AD patients [40 , 49–51], no change [52 –54], or decreased in AD subjects [40], with significant correlation found in female AD patients in one report [55].
Some of these proteins are closely associated with neuroinflammation, a process implicated by a number of AD risk factor genes. Genetic mutations found in the microglial receptor TREM2 (triggering receptors expressed on myeloid cells 2) triple a person’s risk for AD [56, 57] and increased expression of CD33, which functions to suppress Aβ clearance and modifies AD risk [58, 59]. Systems analysis of hundreds of AD brains reveals changes in networks related to immunologic molecules and microglial cells, including microglial protein TYROBP that binds TREM2 and may regulate CD33 [60]. Clearly, those proteins play critical roles in AD onset and progression, and proteomics may identify contributors and provide novel insight into AD biomarkers. Therefore, it would be ideal to combine the unbiased proteomic profiling of plasma and CSF in AD patients and control subjects with additional targeted proteomics to identify potential AD-associated biomarkers, which could be analyzed using quantitative MS and a target-specific Enzyme-Linked ImmunoSorbent Assay (ELISA).
In this study, tandem mass tag (TMT)-based quantitative proteomic analysis of proteins from peripheral and central nervous system compartments were performed to discover potential plasma proteins associated with AD pathology. A number of candidate biomarkers involving neuroinflammation, lipid transfer/metabolism, cerebral vascular function and oxidative stress were identified. By comparing the plasma and brain samples, our study reinforces the relevance between peripheral plasma biomarkers and brain pathology in AD. Among them, neuroinflammation pathways constitute the most significant candidate network that is implicated in AD pathogenesis.
MATERIALS AND METHODS
Materials and reagents
Unless indicated, all reagents used for biochemical methods and sample preparation were purchased from Sigma-Aldrich (St Louis, MO, USA). Reagents for BCA protein assay or Nano Drop-based protein concentration determination for liquid chromatography-mass spectrometry (LC-MS)/MS analysis were purchased from Thermo Scientific (Rockford, IL, USA). Pierce top two abundant protein depletion spin columns, Pierce protein concentrators (3 kDa) and TMT reagent ten-plex kits were purchased from Thermo Scientific Pierce (Rockford, IL, USA).
Subjects
Subjects in this study were recruited from the Bedford VA Hospital Dementia Care Unit. The protocol was approved by the Bedford VA Hospital Institutional Review Board and written informed consent for each participant was obtained before initiation of the study. Blood samples were donated by 36 subjects, including 18 patients diagnosed with AD (average age, 75.8±9.8 years) and 18 healthy controls (average age, 72.3±4.1 years). All subjects were male. Montreal Cognition Assessment (MoCA) was used to evaluate enrolled subjects, and healthy control subjects were scored over 27.
Blood and brain samples
Blood was collected in BD Vacutainer cell preparation tubes (CPT, Becton, Dickinson and Company, Franklin Lakes, NJ) and centrifuged at 1500 g relative centrifugal force (rcf) for 20 min at room temperature shortly after collection. Plasma samples were aliquoted and stored at –80°C until analysis. The postmortem brain tissue of three different regions from 5 AD patients and 5 healthy controls with pathological documentation were obtained from Bedford Brain Bank, as described before [61].
Sample preparation for MS
Plasma was first depleted using Pierce™ top two abundant protein depletion spin columns and then concentrated by Pierce™ 3 kDa protein concentrators according to manufacturer’s instructions. Preparation of tryptic peptides for TMT 10-plex labeling was carried out according to the manufacturer’s instructions. Briefly, after quantification of the protein concentrations in each plasma sample by the BCA, 100μg of low abundant proteins from each sample was transferred into a new vial, adjusted to a final volume of 100μL with tetraethylammonium bicarbonate (TEAB), reduced with tris (2-carboxyethyl)phosphine (TCEP) at 55°C for 1 h, and then alkylated with iodoacetamide for 30 min in the dark at room temperature. Proteins were precipitated by pre-chilled (–20°C) acetone overnight. Acetone-precipitated protein was pelleted by centrifuging at 8000 g for 10 min at 4°C. Protein pellets were re-suspended with 100μL of 50 mM TEAB and digested with trypsin overnight at 37°C. A pooled control plasma sample (Cx) was created by combing 10μL of plasma from each healthy participant and was prepared along with all samples from AD and healthy control subjects. Brain tissue was homogenized for TMT 10-plex labeling as described before [61].
TMT-labeling and sample clean up
TMT enables relative quantitation of proteins present in multiple samples by labeling peptides with isobaric stable isotope tags that fragment upon collision-induced dissociation into reporter ions used for quantitation. In this study, 10-plex TMT tags (Thermo Fisher) were used to label tryptic-digested peptides from plasma and brain samples. Labeling of tryptic peptides was carried out according to the manufacturer’s instructions. Briefly, the TMT reagents (0.8 mg) were dissolved in 41μL of anhydrous acetonitrile. Aliquots of samples were incubated with TMT reagents for 1 h at room temperature. Reactions were quenched by 8μL of 5% hydroxylamine solution for 15 min. Totally four sets of TMT 10-plex labeling kits were used. In each set of TMT 10-plex labeling procedure, reagents were divided into two portions, with half labeled with samples from AD patients and the other half labeled with samples from controls. The common control from pooled control subjects was labeled with a specific tag and was used for all tests. The combined TMT labeled samples were dried under SpeedVac and reconstituted by dilute trifluoroacetic acid solution followed by desalting by Oasis HLB 96-well μElution plate (Waters) prior to LC-MS/MS injection.
LC-MS/MS analysis
LC MS/MS was performed on a Q Exactive Orbitrap Mass Spectrometer (ThermoFisher Scientific) coupled with a Dionex Ultimate 3000 HPLC system equipped with a nano-ESI ion source. The TMT-labeled peptides were separated on a C18 reverse-phase capillary column (PepMap, 75μm×150 mm, ThermoFisher) with linear gradients of 2–35% acetonitrile in 0.1% formic acid, at a constant flow rate of 300 nL/min for 220 min. The instrument was operated in the positive-ion mode with the ESI spray voltage set at 1.8 kV. A full scan of MS spectra (300–1800 m/z) was acquired at a mass resolution of 70,000 with an automatic gain control target (AGC) of 3E6. Fifteen peptide ions showing the most intense signal from each scan were selected for higher energy collision-induced dissociation (HCD)-MS/MS analysis (normalized collision energy 32V) in the Orbitrap at a mass resolution of 35,000 and AGC value of 1E5. Maximal filling times were 100 ms in full scans and 120 ms (HCD) for the MS/MS scans. Ions with unassigned charge states and single charged species were rejected. The dynamic exclusion was set to 50 s and an isolation window of 1.2 m/z. The data was acquired using Thermo Xcalibur 3.0.63.
Protein identification and quantification
Raw data were processed using Proteome Discoverer (Version 2.1, ThermoFisher Scientific). Data were searched against the Homo sapiens Universal Protein Resource sequence database (UniProt, August, 2013). The searches were performed with the following guidelines: trypsin digestion with two missed cleavages allowed; fixed modification, carbamidomethyl of cysteine; variable modification, oxidation of methionine, TMT 10-plex (peptide labeled) for N-terminus and Lys; MS tolerance, 10 ppm; MS/MS tolerance, 0.02 Da; false discovery rate (FDR) at peptide and protein levels, <0.01; and required peptide length, ≥6 amino acids. Protein grouping was enabled, meaning if one protein was equal to or completely contained within the set of peptides of another protein, these two proteins were put into the same protein group. At least one unique peptide per protein group was required for identifying proteins. The relative protein abundance ratios (fold changes) were calculated between the average of ADs and the average of controls from duplicate analytical runs in each experiment. The mean and standard deviation (SD) for relative ratios of each protein were computed and a Student two-tailed t test was used to compare these measures. p-values from these tests were recorded and the protein ratios with a p < 0.05 from two independent experiments were considered significant.
Quantification of interleukin 6 (IL-6), SAA, Aβ, and tau by ELISA
To validate findings from the TMT-based proteomic profiling using an independent method, a Meso Scale Discovery (MSD) platform was used to test the same material for MS analysis. Assays for Aβ, tau, IL-6, and SAA were analyzed using V-PLEX Aβ peptide Panel 1, total Tau kit, Neuroinflammation Panel 1 Human Kit, following the manufacturer’ instructions (MSD, Gaithersburg, MD). Antibodies AT270 and HT-7 (Thermo Fisher Scientific, Waltham, MA) were used to capture/detect pTau181 using the same MSD platform.
Data analysis
The list of differentially regulated proteins was submitted to STRING (Version 11.0) to identify protein networks that are based on currently known associations among proteins indicated in the scientific literature. An enrichment analysis was also performed by submitting the list of differentially regulated proteins to open-source software Database for Annotation, Visualization, and Integrated Discovery (DAVID, v6.8) [62, 63]. DAVID extracts biological features and meanings associated with large gene lists. The gene names of the proteins were entered to analyze GO biological process (GOBP), GO molecular function (GOMF), and GO cellular components (GOCCs) and Kyoto Encyclopedia of Genes and Genomes (KEGG) pathways. Statistically significant differences (p < 0.05) were identified using an EASE score, which was provided by DAVID. Metacore is a web-based bioinformatics tool and was used in this study for functional analysis of the most relevant pathways, networks, and cellular process. Metacore uses these proteins and their identifiers to navigate the curated literature database and extracts the biologically relevant information among the candidate proteins. Associated bio-functions were generated, along with a score representing the log probability of a particular process of network.
RESULTS
Upregulation of plasma proteins involved in immune response and downregulation of proteins involved in pallet degranulation and lipid transport in AD
A comparative proteomic analysis of human plasma from 18 AD subjects and 18 healthy controls was performed using TMT labeling and LC-MS/MS. After eliminating those lacking unique peptides, we quantified a total of 373 plasma proteins with at least one unique peptide, with an FDR of <1% and TMT labeling efficiency at 99%. Among these proteins, we identified 42 up- (AD/control ratio >1) and downregulated (ratio <1) plasma proteins from AD patients (Table 1).
Significantly up- and downregulated human plasma proteins from AD patients compared to control subjects
Up- and downregulated plasma proteins in AD group (n = 18) relative to the control group (n = 18) with p < 0.05, two-tailed Student’s T test from two independent studies.
To get a general overview of plasma protein changes in AD and search for the most affected processes and potential interactions among the candidate proteins, GO term enrichment analysis was performed. All differentially regulated (including both up- and downregulated) plasma proteins were submitted for analysis using STRING (Fig. 1). Several clusters were enriched, including the GO biological process of acute-phase response and acute inflammatory response (FDR = 2.25E-14), the KEGG pathways of complement and coagulation cascades (FDR = 2.46E-10), the KEGG pathway of cholesterol metabolism (FDR = 1.13E-6) and the Reactome pathway of platelet degranulation (FDR = 4.94E-13).

Functional enrichment in the networks of up/downregulated human plasma proteins from 18 AD patients using STRING. Results were obtained from two independent experiments. Biological Process (GO) of acute-phase response and acute inflammatory response (red), KEGG pathways of complement and coagulation cascades (blue), cholesterol metabolism (green), and Reactome pathways of platelet degranulation (yellow) were indicated on the plot.
Next, DAVID functional enrichment analysis was applied to up- and downregulated plasma proteins separately (Fig. 2). The identified plasma proteins were classified into different groups according to biological process (Fig. 2A), molecular function (Fig. 2B), and cell components (Fig. 2C). In the category of biological process, the plasma proteins from AD patients revealed enhanced, upregulated immune responses, whereas platelet degranulation and lipid transfer and metabolism were significantly downregulated (Fig. 2A). The top two enriched biological processes were acute-phase response (64% of regulated proteins were enriched in this process with p = 1.9E-19 (64%, 1.9E-19)) and inflammatory response (36%, 1.1E-04). Nine out of 14 upregulated proteins were involved in acute-phase response, including C-Reactive Protein (CRP), serum amyloid P-component (APCS), haptoglobin (HP), mannose-binding protein C (MBL2), alpha-1-acid glycoprotein 1 (ORM1), alpha-1-antichymotrypsin (SERPINA3), serum amyloid A-1 (SAA1), serum amyloid A-2 (SAA2), and serum amyloid A-4 (SAA4). Proteins involved in the inflammatory response included CRP, ORM1, SERPINA3, complement C4-A (C4A), and lysozyme C (LYZ). Other top enriched biological processes included the activation of the classic pathway of the complement cascade. Upregulated C4A, complement component C9 (C9) and MBL2 were enriched in this complement activation process.

Gene ontology enrichment analysis of up- and downregulated plasma proteins in three categories: A) biological processes, B) molecular function, and C) cellular components. The percentages indicate the enriched proteins among all up- or downregulated proteins. The enrichment analysis was performed using DAVID.
The functional analysis of downregulated plasma proteins from AD patients showed that more than one third of the downregulated proteins were enriched in the biological process of platelet degranulation (36%, 3.7E-14), followed by lipid transport and metabolism including reverse cholesterol transport/cholesterol efflux (18%, 6.6E-08), lipoprotein metabolism (18%, 3.68E-07), and positive regulation of lipoprotein lipase activity (14%, 4.4E-07) (Fig. 2A). Proteins enriched in platelet degranulation included tetranectin (CLEC3B), alpha-2-HS-glycoprotein (AHSG), A2M, apolipoprotein A-I (APOA1), beta-2-glycoprotein 1 (APOH), coagulation factor XIII A chain (F13A1), histidine-rich glycoprotein (HRG), selenoprotein P (SELENOP, or SEPP1), kallistatin (SERPINA4), and serotransferrin (TF). Proteins enriched in the processes of lipid transfer and metabolism included APOA1, apolipoprotein A-IV (APOA4), apolipoprotein C-II (APOC2), apolipoprotein C-III (APOC3), apolipoprotein M (APOM), and beta-2-glycoprotein 1 (APOH). Other biological processes, such as phospholipid efflux, high-density lipoprotein (HDL) remodeling, cholesterol/triglyceride homeostasis, were also enriched.
The molecular function analysis showed that among the upregulated plasma proteins, 22% were associated with complement component C1q binding (including CRP, APCS, and C4A), followed by 22% in chemoattractant activity (SAA1, SAA2, and SAA4), virion binding, and serine-type endopeptidase activity (Fig. 2B). Whereas in the downregulated plasma proteins, 18% were associated with serine protease/proteinase inhibitor activity, including A2M, HRG, SERPINA4, plasma serine protease inhibitor (SERPINA5), and pigment epithelium-derived factor (SERPINF1), followed by lipase inhibitor activity and lipid binding (including APOA1, APOA4, APOC2, APOC3, and APOH).
The cellular component analysis of the up- and downregulated plasma proteins were enriched in the extracellular region and extracellular exosome, some were also enriched in blood microparticle, high-density lipoprotein particles as well as in platelet alpha granule lumen (Fig. 2C). Unlike upregulated proteins, downregulated proteins were enriched in very-low-density lipoprotein particles (21%) and chylomicron (18%).
The biological network of altered plasma proteins from AD patients reveals enriched IL-6 pathway
We have used the KEGG pathway analysis to examine our proteomic profiles, and we found that the complement and coagulation cascades pathway was enriched. When upregulated (p = 3.0E-4) and downregulated plasma proteins (p = 4.3E-6) were analyzed separately, or all plasma proteins were analyzed together (p = 8.0E-11), KEGG pathway analysis revealed the common complement and coagulation cascade pathway, with minimum FDR via Benjamini-Hochberg procedure (Benjamini) (Table 2).
KEGG and Reactome pathway analysis of up- and downregulated plasma proteins
Three regulators of complement activation, C4A, C9, and complement factor H-related protein 3 (CFHR3), were found upregulated. Reactome pathway analysis revealed 21% of the upregulated plasma proteins were enriched in regulation of complement cascade (p = 4.1E-4) and another 21% were enriched in amyloid fiber formation (p = 4.9E-3), a key pathological event of abnormal accumulation of amyloid. KEGG and Reactome pathway analysis of downregulated proteins showed that platelet degranulation (p = 1.6E-12), vitamin digestion and absorption (p = 6.3E-4), and retinoid metabolism and transport (p = 1.6E-6) were all enriched.
To investigate any changes in biological network, we uploaded the up- and downregulated plasma proteins from AD patients as the input list for generation of these networks using model canonical pathways from Metacore. Among the top eight most strongly connected networks, four were related to the IL-6 pathway which mainly involved SAA1, APCS, HP, IL-6, ACT, HP, STAT3, IL-6 receptor, and JAK2 (p = 5.1E-42, z Score≥187) (Fig. 3), two networks were enriched in acute-phase response involving LRG, lysozyme, G-CSF, STAT3, STAT5, and JAK1 (p = 6.9E-46, z Score = 181) (Fig. 4), and one network was enriched in regulation of inflammatory response involving C4A, NF-κb, C3Ar, A2M receptor, and CR1.
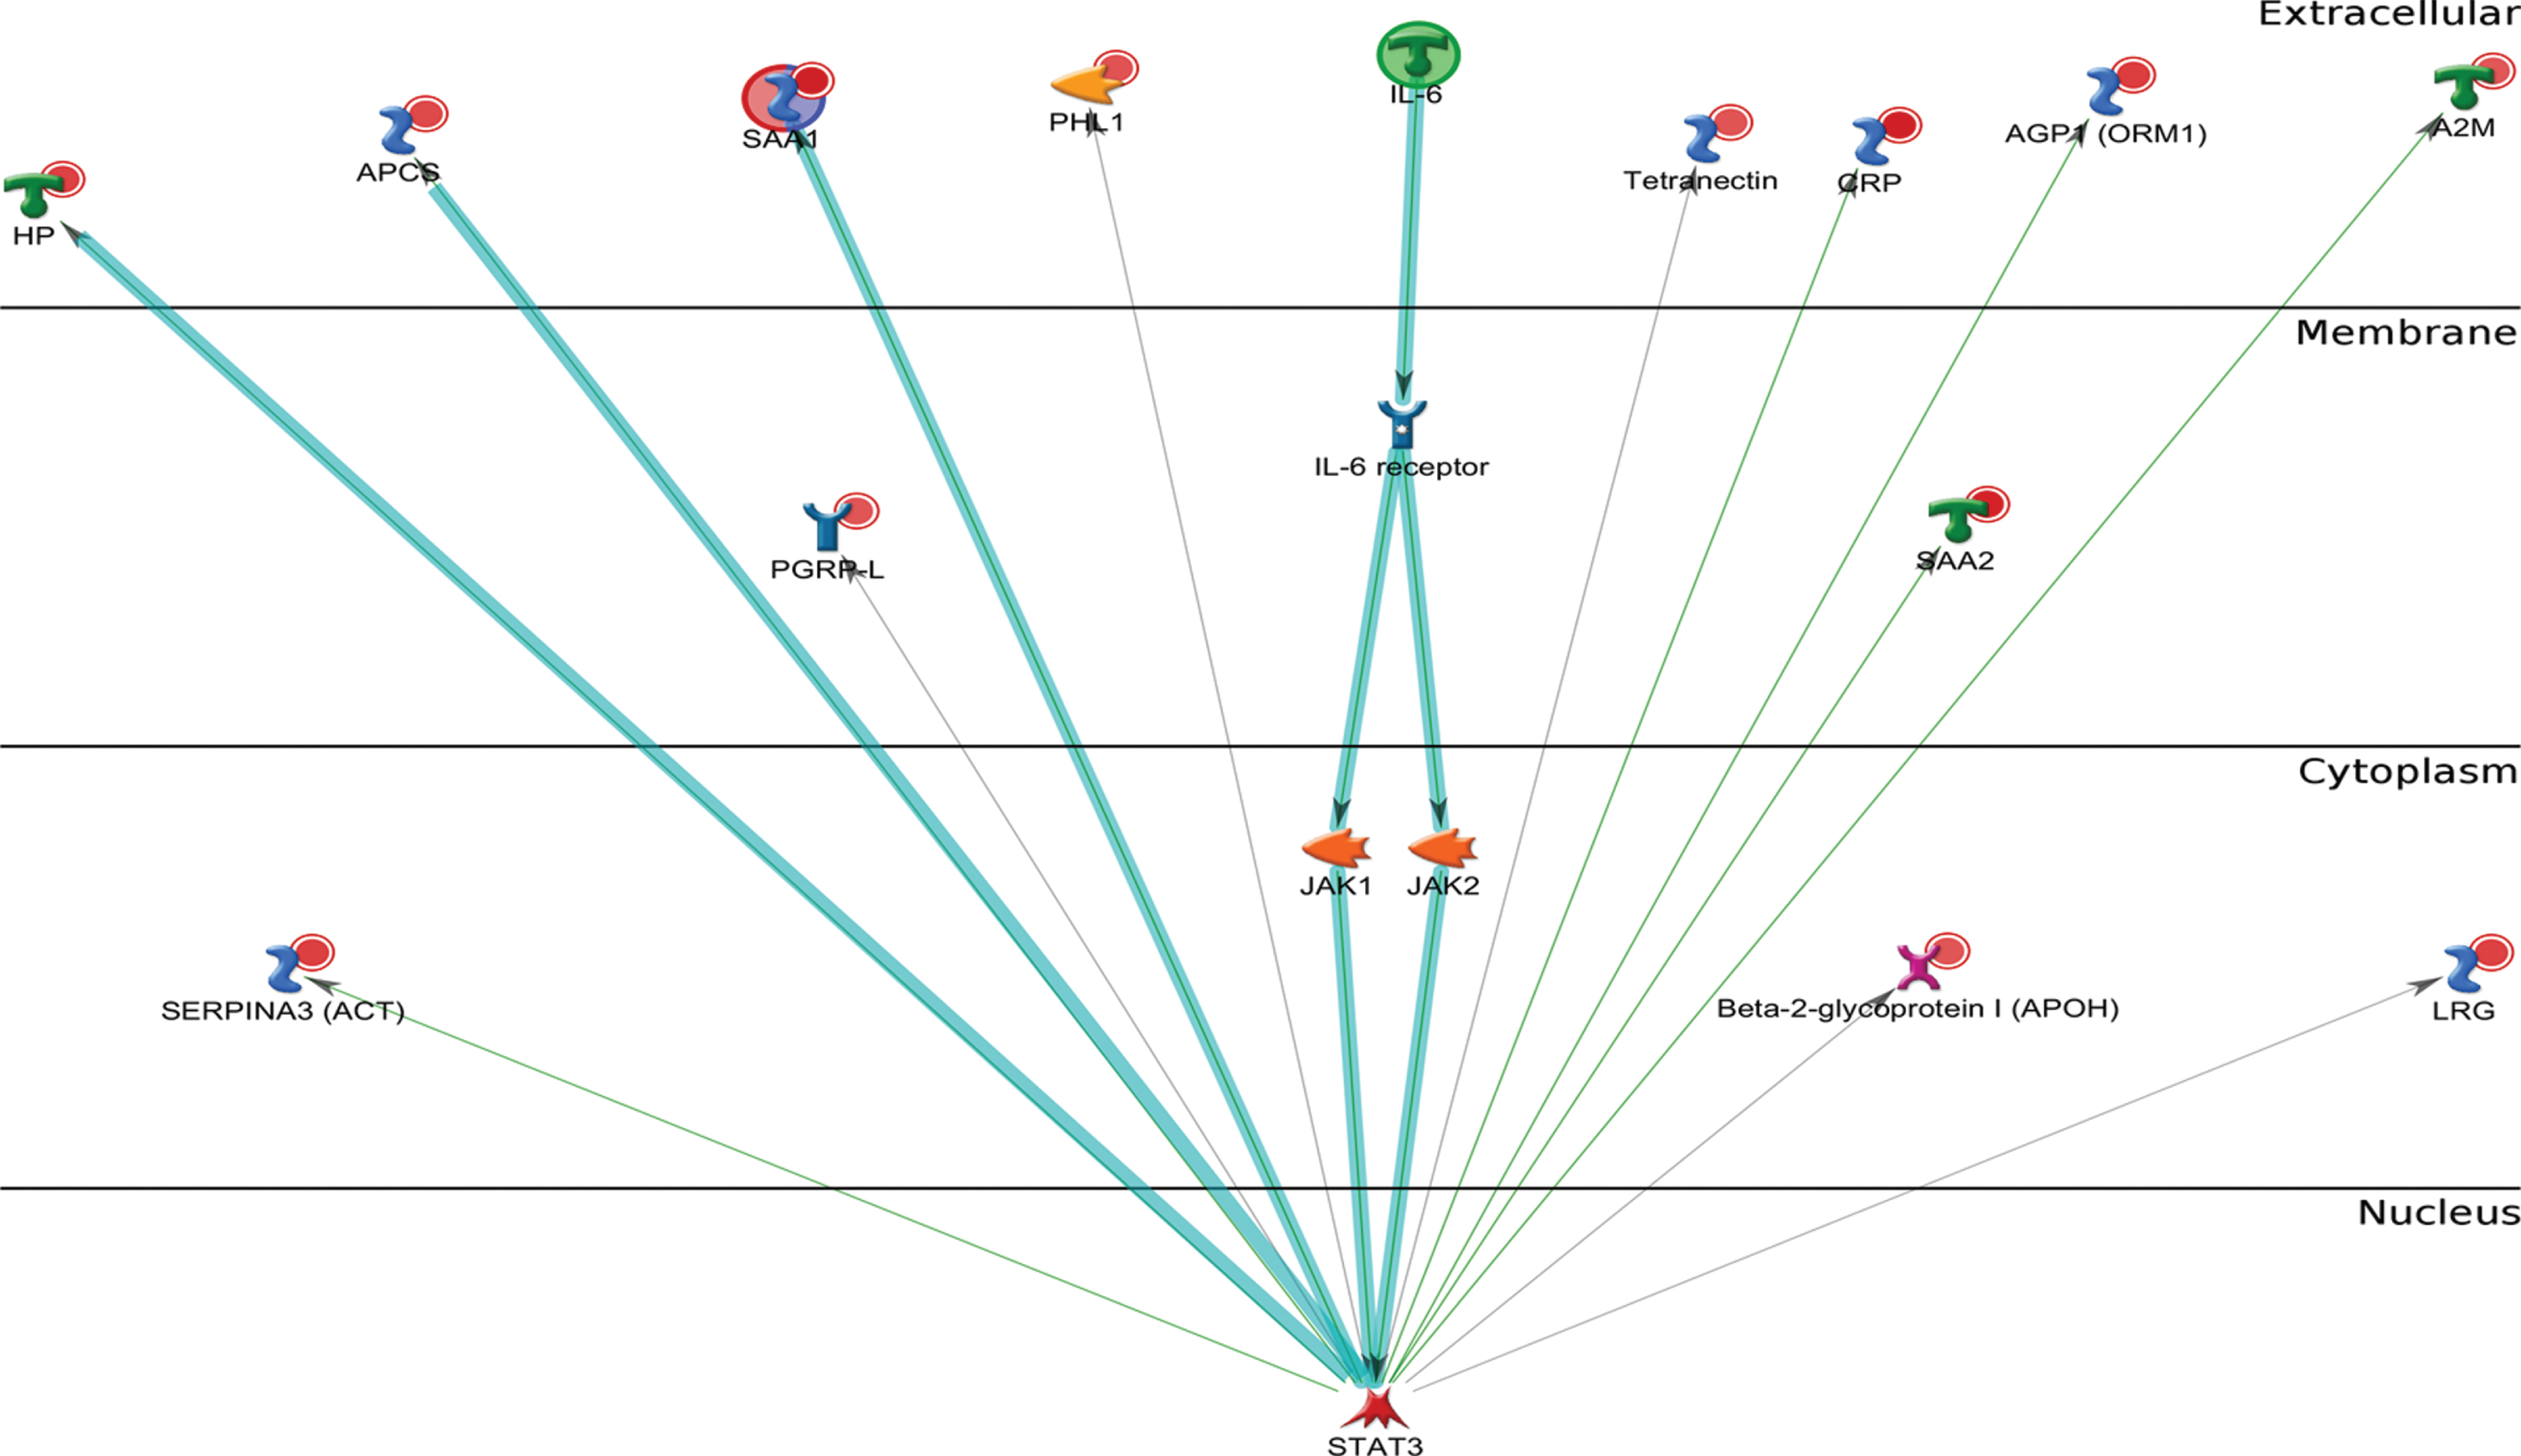
Metacore analysis reveals the top scored network of IL-6 pathway. Thick cyan lines indicate the fragments of canonical pathways. The acute-phase response containing IL-6 pathway was enriched.
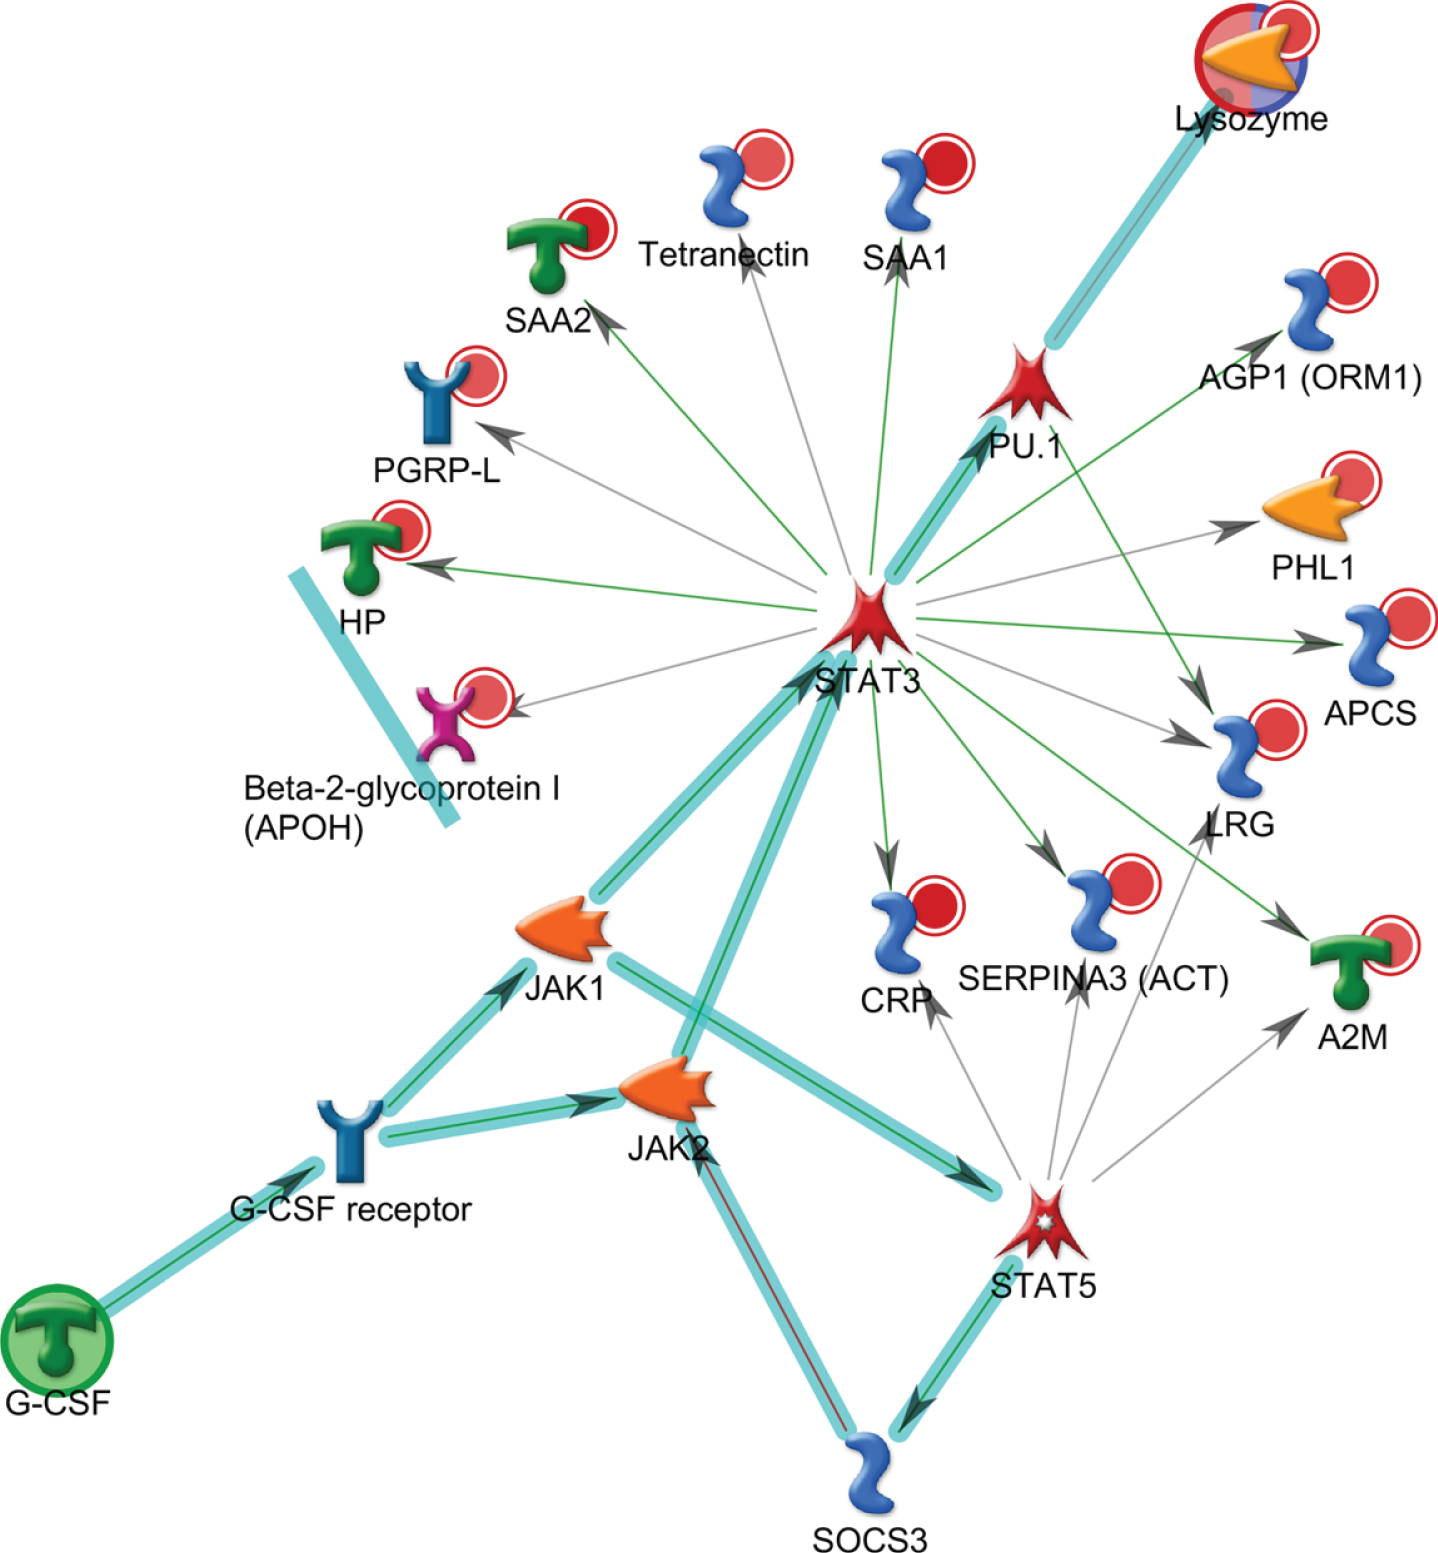
Metacore analysis reveals the top scored network of acute-phase response pathways. Thick cyan lines indicate the fragments of canonical pathways. The acute-phase response containing LRG, lysozyme, and G-CSF pathways was enriched.
Therefore, the IL-6 signaling represents one of the major pathways altered in AD patients.
We next examined whether those proteins were also implicated in other diseases besides AD. Further enrichment analysis using Metacore showed that the downregulated plasma proteins from AD (p = 1.2E-25) were enriched in disease markers related to cerebrovascular disorders, and those upregulated proteins (p = 1.7E-18) were enriched in markers related to macular degeneration (Table 3). Collectively, these up- or downregulated proteins are involved in macular degeneration or cerebrovascular disorders, which include a spectrum of pathological conditions of impaired blood flow in the eye and brain.
Enrichment of the up- and downregulated plasma proteins related to other diseases
Proteomic profiling of AD postmortem brain tissue reveals differentially regulated IL-6 signaling
Our previous studies have reported that enhanced inflammation and complement activation were found in the postmortem brain tissues from five AD patients, with complement and coagulation cascade pathway being significantly enriched in two out of five AD subjects (p < 0.05) [61]. To determine the relevance of proteomic profiles between plasma and brain tissue, all differentially regulated plasma proteins identified from 18 AD patients were compared to the proteins identified from three brain regions of the postmortem brain tissues from five AD patients, including the superior frontal cortex (SF), inferior frontal cortex (IF), and cerebellum (CRLM); CRLM has the least AD pathology compared to SF and IF regions. As expected, levels of Aβ40, Aβ42, and pTau181 were increased in postmortem brain homogenates from AD patients, compared to those from control subjects (Supplementary Figure 1). Results from the comparative enrichment analysis revealed commonly enriched GO processes between up/downregulated proteins in plasma and those from three brain regions of AD patients (Fig. 5A). Besides platelet degranulation, most proteins were related to immune or inflammatory response. Positive regulation of myelination and cellular oxidant detoxification were also commonly enriched. Our analysis also revealed the commonly enriched GO molecular functions of the up/downregulated plasma and brain proteins. The top five enriched molecular activities of up and downregulated plasma proteins were highly similar to those from IF and SF brain regions but not CRLM (Fig. 5B). Other molecular activities of differentially regulated proteins between plasma and three brain regions were similar, such as hemoglobin binding, antioxidant activity and lipid binding.

Comparison of GO functional enrichment analysis between up/downregulated plasma proteins from 18 AD patients and those from three brain regions (SF, IF, and CRLM) of 5 AD patients (p < 0.05). A) GO process. B) GO molecular function (SF, superior frontal cortex; IF, inferior frontal cortex; CRLM, cerebellum).
The enriched process networks of up- and downregulated proteins from plasma and two brain regions (IF and SF) were compared; CRLM was not included as it has the least AD pathology compared to SF and IF regions. Our results showed that inflammation/complement system and inflammation/IL-6 signaling were highly enriched and followed by immune response/phagocytosis (Fig. 6). Plasma proteins enriched in the complement system and IL-6 signaling included CRP, C4a, complement component C8 γ chain (C8γ), MBL2, Ficolin/H-Ficolin, C9, ficolin-3 (FHR-3), ORM1, SAA2, A2M, APCS, HP, ACT, SAA4, and SAA1. Proteins from plasma and SF brain region were enriched in blood coagulation (Fig. 6).

Comparison of the enriched process networks between plasma and brain proteins. Up/downregulated plasma proteins from 18 AD patients were compared to those from two AD brain regions (SF and IF) of five AD patients (p < 0.05). (SF, superior frontal cortex; IF, inferior frontal cortex). Plasma proteins enriched in the inflammation/complement system include CRP, C4a, C8γ, MBL2, Ficolin/H-Ficolin, C9, and FHR-3; IL-6 signal components include ORM1, SAA2, A2M, CRP, APCS, HP, ACT, SAA4, and SAA1; immune response/phagocytosis system include SAA2, CRP, HDL proteins, APOC3, MBL2; blood coagulation components include SAA2, A2M, Coagulation factor XII, Protein C inhibitor, SAA1, and Coagulation factor XIII A.
Our studies illustrated a list of differentially regulated proteins that were commonly presented in both plasma and brain regions (Table 4). Haptoglobin (HP) was commonly upregulated in plasma and IF and SF, but downregulated in the CRLM region. Both A2M and TF were commonly downregulated in plasma and CRLM. Since HP and A2M were among the plasma proteins enriched in the IL-6 signaling pathway, it was apparent that IL-6 signaling was affected in both plasma and three brain regions from patients with AD.
The common up- and downregulated plasma and brain proteins from AD subjects
The up- and downregulated brain proteins were from three brain areas in at least 2 out of 5 AD patients when comparing to the average levels of proteins from 5 control subjects. Up- and downregulated plasma proteins in AD group (n = 18) were compared to the control group (n = 18); with p < 0.05, two-tailed Student’s T test from two independent studies. IF, inferior frontal; SF, superior frontal; CRLM, cerebellum.
To confirm the MS-based quantitative proteomics, we analyzed two key proteins IL-6 and SAA in plasma from AD and control subjects by ELISA. Levels of IL-6 and SAA showed a significant (p < 0.05) increase at 5.3-fold and 3.7-fold in plasma from AD patients, compared to those from control subjects (Fig. 7). The detection of significantly upregulated plasma IL-6 in AD patients by ELISA is consistent with the activation of IL-6 signaling in plasma samples from AD patients, which was demonstrated by MS-based proteomic profiling.

ELISA-based quantification of IL-6 and SAA in plasma from AD and control subjects. The standard error of means (short lines) and means (long middle line) are illustrated for each group. The differences between AD and control subjects are statistically significant (p < 0.05).
The increase of SAA quantified by ELISA (Fig. 7) confirmed MS-based quantification of SAA1, SAA2, and SAA4, which were increased in AD subjects (Table 1). Taken together, this study demonstrated the advantage of MS over immunoassay in its ability to quantitatively differentiate SAA-1 and SAA-2 from SAA4 (Table 1).
DISCUSSION
In this study we compared plasma samples with brain tissue, a design which illustrates an effective approach to identify candidate biomarkers for future validation in a larger number of plasma and postmortem brain samples. Given a lack of a single fluidic biomarkers for AD diagnosis, a composite protein profile may have greater sensitivity and specificity to meet the criteria for an AD biomarker. Furthermore, candidate plasma biomarkers can be easily applied in clinical settings to predict the disease state if they are validated in postmortem brain tissue from AD patients.
Blood-brain barrier leakage and vascular dysfunction in AD
In the current study, we found that several proteins involved in amyloid fiber formation were upregulated in AD. Blood biomarkers potentially reflect pathological alteration in brains partly due to a leaky blood-brain barrier (BBB) [64]. Aβ deposits are found in damaged brain vessels that are a characteristic feature of cerebral amyloid angiopathy (CAA). If this occurs at the early stage of AD, it could induce CAA [65]. The accumulation of Aβ deposits likely disrupts the vessel wall, sometimes leading to microaneurysm formation and fibrinoid necrosis [66]. Since the majority of AD patients have coexisting CAA, and one study reported its presence in up to 80% to 90% of AD patients [67], pathological proteins in brains of AD patients are likely enriched in blood compared to those from control subjects.
This study revealed alteration in platelet degranulation or the release of granule contents [68], which is relevant to Aβ-induced clotting after minor BBB leakage activates blood platelets to repair any damage [69]. Activation of platelets at the lesion sites leads to the healing cascade [70], and deficiency in this step causes subsequent inflammation processes. Vascular lesions increase during AD progression, and platelets gradually become dysfunctional in repairing these lesions. In this study, we found dysregulated platelet function based on proteomic analysis of both plasma and postmortem brain tissues from AD patients. We also identified a number of differentially regulated proteins involved in platelet degranulation process such as A2M and TF (Table 2).
IL-6 inflammation pathway in AD
KEGG and Reactome pathway analyses of our proteomic dataset revealed alteration of complement and coagulation cascades, which is consistent with previous plasma proteomic studies [40 , 54]. The complement and coagulation systems shared certain activators and inhibitors and can be reciprocally activated, and they have been linked with AD pathogenesis [71]. Several studies have reported that complement activation is a key component of neuroinflammation process in AD [72 –74]. The activation of complement systems in AD promotes an Aβ-induced neuroinflammatory response in microglia [75] despite its protective effects toward Aβ clearance. Using iTRAQ-based comparative proteomics analysis, several complement proteins, such as C4b-binding α protein chain, complement factor B, and complement factor H proteins were found up-and downregulated in AD plasma [40 , 54]. In our study, several regulators of complement cascade proteins including C4A, C9, and CFHR3, were found upregulated in plasma from ADs in our study. This is consistent with a previous genetic report of significant increases in the number of copies for both C4A and C4B in AD patients compared with healthy controls [76]. Complement factor H regulates the formation of C3 and C5 convertase and is present in amyloid plaques [77]. The elevated level in plasma correlated with hippocampal metabolic abnormalities in AD patients [49].
In brain samples, the pro-inflammatory cytokines and oxygen radicals released by glial cells are neurotoxic and cause tissue damage and neuronal death [78]. Some studies suggest that inflammatory cytokines such as IL-1β, IL-6, IL-18, and their related receptors were increased in the AD brain [79, 80], other studies suggest that inflammatory markers (including IL-6) were not found to be significantly different among early- and late-onset AD subjects and normal controls, but were found to be associated with age [81]. In our age matched plasma samples, we have identified upregulated IL-6 inflammation signaling pathway in plasma samples from AD patients, supporting the activation of inflammatory processes in brains. Among them, IL-6 is a key player during the transition between acute and chronic inflammation and a main stimulator of the production of acute phase proteins [82]. IL-6 production in cultured glial cells can be triggered by adding Aβ peptides [83]. IL-6 enhances neuronal damage induced by Aβ in cultured rat cortical neurons [84], and facilitates hyperphosphorylation of tau in neurons [85]. Genetic analysis of polymorphisms in specific alleles of IL-6 revealed an association between IL-6 haplotype-tagging single nucleotide polymorphisms (SNPs) and reduced risk of late-onset AD [86].
Our proteomic profiling revealed that elevated IL-6 and several important proteins associated with IL-6 signaling were upregulated, suggesting that IL-6 plays a pivotal role in brain inflammation and AD pathogenesis. IL-6 activates Janus Kinases (JAK) and subsequently a number of proteins including Signal Transducers and Activators of Transcription (STAT) factors like STAT3. In microglial cell lines, JAK/STAT3 signaling mediates neuroinflammatory responses induced by Aβ42 and complement protein C5a. Blocking this pathway reduces the expression of TNF-α, IL-1β, and IL-6 [75]. In an APP/Presenilin1 (PS1) transgenic AD mouse model, knocking out STAT3 caused decreased activation of pro-inflammatory cytokines, reduced Aβ levels and plaque burden, upregulated amyloid clearance pathways, and even improved spatial learning and reduced memory decline [87]. STAT3 is one of the main regulators of the lysozyme pathway. Lysozyme plays an important role in the innate immune system and has been shown to prevent Aβ aggregation in vitro. As increased lysozyme levels have been found in CSF from AD patients, we found increased plasma levels of lysozyme in AD patients, indicating the activation of G-CSF and lysozyme pathways that could be as a compensatory response to Aβ aggregation. Therefore, our human plasma proteomic results suggest that levels of STAT3 and lysozyme could be potential indicators for pathological status of AD in brains.
SAA and immune response in AD
IL-6 as well as IL-1 and TNF-α regulate SAA-1 and SAA-2. Similar to another acute phase protein CRP, SAA1, and SAA2 increase within hours after inflammatory stimulus [89]. While SAA1 and SAA2 are inducible during acute-phase response, SAA4 is constitutively expressed in a variety of tissues and cells [90]. SAA1, 2, and 4 are the main components of SAA family [91]; SAA3, which was not analyzed here, is a pseudogene and detected in human gland epithelial cell lines [90]. Our LC-MS/MS analysis combines quadruple precursor ion selection with high-resolution and accurate mass, which allows us to identify proteins with high specificity and investigate more precisely the MS/MS spectra generated from the plasma samples of AD patients. In the case of SAA1 and SAA2, which are small proteins with 104 amino acids in length, they are >90% identical to each other [89]. Using LC-MS/MS analysis, we were able to specifically discriminate between SAA1 and SAA2 and identify different isoforms of SAA, including SAA1, SAA2 and SAA4. We found that SAA1 and SAA2 were upregulated to a greater extent as compared with SAA4 (Table 1). This shows the high specificity of the mass-based methods over antibody-based immunoassays. Furthermore, quantitative LC-MS/MS produces consistent outcomes with good reproducibility from multiple experiments (Supplementary Table 1).
Elevated SAA has been reported in several chronic diseases, including amyloidosis, atherosclerosis, and rheumatoid arthritis [92], and expression of SAA was identified in AD brains [93, 94] and predominantly localized to neuritic plaques, myelin sheaths, and axonal membrane [95]. In CSF, the SAA concentration is much higher in samples from AD subjects than in those from controls [93]. Besides its role in recruiting immune cells to inflammatory sites, SAA directly regulates lipoprotein metabolism in the plasma, transports cholesterol to the liver for secretion into the bile, and induces CSF-HDL remodeling which may impair Aβ clearance [96].
Other apolipoproteins for lipid transport and their dysfunction in AD
In our study, several Apolipoproteins, such as APOA1, APOA4, APOC2, and APOC3, were found downregulated in the plasma of AD patients. Apolipoproteins transport lipids through the circulatory system and play a crucial role in neuronal development and maintenance of synaptic plasticity. Several dysregulated apolipoproteins and lipid metabolism have been reported in the previous proteomic studies, such as downregulated APOA1, APOA2, and APOB in plasma or serum from AD subjects as compared with the controls [97]. Another report suggests that the expression of APOA1, APOC3, and APOA4 is associated with risk of AD, and low serum levels of these three apolipoproteins are correlated with development of AD based on CDR scores [98]. The apoA1, apoA4, and apoC3 genes are closely linked in the human genome, and the apoA1-apoA4-apoC3 gene cluster may synergistically affect lipid profiles related to AD [98]. ApoE is another protein altered in AD plasma samples [44]. The APOE ɛ4 allele is the strongest genetic risk factor for the development of late-onset AD, and multiple regulatory elements in the region of APOE locus influence expression levels of APOE [99]. The levels of regulatory element methylation in the extended TOMM40-apoE-apoC2 region of the long arm of chromosome 19 were correlated with AD status [100].
APOC3, a component of very low-density lipoprotein particles (VLDL), binds Aβ, decreases in plasma from AD patients, and negatively correlates with MMSE scores [101]. APOA4 has anti-oxidant, anti-inflammatory, and anti-atherosclerotic actions in vivo [102], and its deficiency increases Aβ deposition and cognitive damage in an AD animal model [103]. It appears that alteration of plasma lipid profile (e.g., hyperlipidemia) may cause subtle changes in brain lipid metabolism and composition [104]. Our results suggest these plasma apolipoproteins, as they can be measured directly, can potentially be used as biomarkers to evaluate status of brain lipid profiles related to AD.
Oxidative markers specific to AD
Neuroinflammation and oxidative stress are closely associated, and oxidative stress is a classic aging marker. Oxidative biomarkers in peripheral system for AD diagnosis is difficult to identify, even though they play a significant role in the pathogenesis of AD [105]. In this study, we found several proteins with anti-oxidation function downregulated in plasma from AD patients.
Haptoglobin is an acute-phase protein released in the peripheral blood as a marker for inflammation, and it carries antioxidant and anti-inflammatory activities. In this study, we observed that HP was commonly elevated in both plasma and IF and SF brain regions from AD subjects, consistent with elevated HP levels among AD patients compared to healthy controls observed in previous findings [106, 107].
An essential trace element for the antioxidant defense is Selenium (Se) and its binding protein selenoprotein. Selenoprotein protects cells against oxidative stress damage, and Selenoprotein P is a heparin-binding glycoprotein transporting Se to neurons, functioning as an antioxidant and a contributor to regulation and interaction with redox-active metals (copper, iron, and mercury). Decrease in plasma selenium over time is associated with cognitive decline and AD, as compared with healthy controls [108]. Selenoprotein P plays various roles in cytoskeleton assembly and disassembly with misfolded proteins (e.g., hyperphosphorylated tau-protein and Aβ) [109].
A similar iron-binding protein, Transferrin (TF, or serotransferrin), transports iron from sites of absorption and heme degradation to those of storage and utilization, thus maintaining a relatively non-reactive state to prevent iron from stimulating oxygen radical formation as an important anti-oxidant defense mechanism [110]. While decreased TF levels were found across a wide range of disorders including common infection, inflammation, liver diseases, cancer, and other chronic disease states, lower levels of TF were also found in the blood of AD patients [111] and in the white matter of various cortical regions [112], compared to control subjects. Consistent with these early reports, we found decreased levels of TF in AD plasma and brain samples in this study.
Anti-oxidation agents like Kallistatin have been administered to reduce cardiovascular damage [113], but their role in AD pathogenesis is not clear. Similar to TF, reduced Kallistatin was found in the serum of patients with diabetes, hypertension, or cancer [114]. Experimentally, high H2O2 concentration inhibited Kallistatin expression, while low H2O2 levels induced its expression [114]. In this study, we found that the plasma level of Kallistatin was downregulated among AD patients. Plasma antioxidants like TF and Kallistatin may have neuroprotective effects against neurodegenerative disease like AD, where enhanced oxidative stress and lowered antioxidant defense damage organelles such as the mitochondria and impair brain function. Therefore, biomarkers for oxidative stress could be accompanying components for predicting AD status and ongoing loss of synapses and neuronal death.
Conclusions
The current study presents a novel approach to discovering concordant biomarker profiles indicative of specific pathological processes in both peripheral and central nervous systems. Since the BBB is disrupted in AD, specific proteins that pass between the brain and the bloodstream can be detected and quantified to predict brain pathology. In this study, a large body of candidate proteins in plasma which reflect certain aspects of the disease status of AD were revealed and could be further investigated and validated as peripheral biomarkers for AD. The results suggest that specific plasma proteins in the complement coagulation cascade and IL-6/JAK/STAT3 signaling can be candidate biomarkers to indicate neuroinflammation of AD. Additional proteins involved in lipid processes, cerebral vascular dysfunction, and oxidative stress can also be explored as candidate biomarkers for AD diagnosis.
Footnotes
ACKNOWLEDGMENTS
We thank Drs. Stephen Wong, Clara Velazquez Sanchez, Abby Gelb, Jianting Sheng, and Yuliang Cao for helpful discussions, and Sarah Daley for editorial assistance. This study was supported by the award I21BX002215 and IO1 BX003527 from the Biomedical Laboratory Research and Development Service of the Veterans Affairs Office of Research and Development, RF1AG063913 from National Institute of Aging, and the Cure Alzheimer’s Fund (WX). The views expressed in this article are those of the authors and do not represent the views of the US Department of Veterans Affairs or the US Government.