
Abstract
Background:
Over time, improved cognitive abilities in elderly individuals lead to an overall increase in performance on widely used cognitive screening tests (e.g., Mini-Mental State Examination, MMSE) and impact screening efficacy.
Objective:
We aimed to examine the epoch effect on cognitive function measured using MMSE, in addition to the influence of demographic characteristics on MMSE. We also evaluated the ability of the MMSE in detecting dementia and examined the discrimination ability and measurement precision of the MMSE.
Methods:
In a cross-sectional survey, Chinese veterans aged ≥60 years were interviewed. Multiple linear regression analysis was applied to explore the factors affecting the MMSE. The expected MMSE score was calculated to examine the epoch effect. The diagnostic accuracy of the MMSE was determined via receiver operating characteristic curve analyses. Item response theory methods were implemented using Stata 16.0.
Results:
The MMSE score increased with higher education and decreased with advancing age. The observed MMSE score in this study (26.9) was higher than the expected MMSE score (24.9). It demonstrated 78.3% /84.1% /89.9% sensitivity and 85.8% /79.5% /66.8% specificity in detecting dementia using the cut-off score 25/26/27. The MMSE showed reduced discrimination and provided little information for ability level of −1 and above.
Conclusion:
Improved cognitive ability over time may increase the performance on cognitive screening tests (e.g., MMSE). This impact of epoch in cognitive function emphasizes the importance of regularly updating cognitive screening tests.
INTRODUCTION
The Mini-Mental State Examination (MMSE), proposed by Folstein in 1975 [1], has since been widely used for screening for cognitive dysfunction in the elderly population in clinical and epidemiological studies. The MMSE is reportedly influenced by demographic data (e.g., age, gender, and education level) [2–6]. Age and education level are significantly associated with MMSE performance, as researchers observed an inverse relationship between MMSE scores and age and a positive relationship between MMSE scores and education level. The results from studies on the association between MMSE scores and gender remain controversial. Stein et al. reported that gender indicated no impact on MMSE performance [5], while Zhang et al. observed that the MMSE scores of urban and rural wom en were 1.59 and 0.52 points lower than men’s scores [6].
There was also an impact of epoch on the MMSE scores. Morgado et al. recruited two cohorts of individuals over 49 years old in the same community in 1998 and 2008, respectively [7]. The results showed that the MMSE scores were higher in 2008 than in 1998 for age-matched and education-matched subgroups. According to previous studies, the MMSE scores which discriminated dementia patients increased from 17, 20, and 24 in 1987 [8] to 19, 22, and 26 in 1997 [6] for illiterate Chinese elderly, those with primary school and those with junior high school or higher education, respectively. However, there were significant differences in the demographic characteristics between the two samples. Therefore, there is not sufficient evidence to conclude on the epoch effect on MMSE in Chinese elderly population, which requires further research.
These results of age, education level, and epoch effect on the MMSE performance, required regular re-evaluation of the application of MMSE in different populations. In addition, the MMSE was not developed specifically to be a dementia screening test, and the MMSE has been more useful for staging the progress or severity of dementia rather than as a screening tool [9]. Researchers have noted MMSE as an inadequately reliable screening instruments for dementia. However, this major caveat was quickly forgotten and the MMSE is still widely used in geriatrics research and practice.
Regarding all of the above findings, further research is useful to assess whether there has been an overall improvement in the MMSE performance of elderly individuals in China 20 years later and to determine the diagnostic accuracy of MMSE for detecting dementia. To address these aims, data from this large veteran community-based study of elderly persons were analyzed. In this study, we emphasized examining the epoch effect on the cognitive function measured by MMSE, in addition to the influence of demographic factors on the performance of MMSE. We assessed the sensitivity and specificity of the MMSE in detecting dementia and examined the discrimination ability and measurement precision of the MMSE.
MATERIALS AND METHODS
Sample
The data were collected from Chinese veteran communities with the help of the CVCR Platform. A total of 277 veteran communities, with 9,676 Chinese veterans aged 60 years and older, were recruited via the CVCR Platform. Details of the CVCR design have been reported elsewhere [10]. Among 9,676 veterans, 7,445 veterans who had complete information regarding the neuropsychological tests and clinical diagnoses were included in the analysis. The missing data of MMSE was 325 (4.4%).
Extensively uniformly trained and qualified medical staff from the Departments of Neurology and Geriatrics performed face-to-face surveys with veterans at their homes. The study was approved by the Institutional Review Board of the General Hospital of the People’s Liberation Army, and written informed consent was obtained.
Procedures
A two-stage design was used to investigate the neurocognitive function of veterans, and details of the design have been reported elsewhere [11]. In the first phase, trained investigators surveyed subjects who agreed to be interviewed. The main tools included the Chinese version of the Mini-Mental State Examination (CMMSE) [6] and a revised Chinese version of the Montreal Cognitive Assessment (the PUMCH version of the MoCA, MoCA-P) [11], as well as general surveys including demographic information. The veterans included in the second phase were administered a series of neuropsychological tests.
Diagnostic criteria
The clinical diagnosis of veterans requires a comprehensive consideration of patient history, neuropsychological testing, and physical examination. Mild cognitive impairment (MCI) diagnosis was performed according to the core clinical criteria recommended by the National Institute on Aging and the Alzheimer’s Association Working Group [12]. The diagnosis of MCI required the following conditions: 1) The cognitive level of the subjects decreased compared with the previous level; 2) the neuropsychological test scores were below 1.5 SD in one or more cognitive domains; 3) the ADL score was less than 26, with GDS stage 2–3; and 4) the subjects did not meet the criteria for dementia.
The diagnosis of dementia required the following conditions: 1) The subjects met the diagnostic criteria of the Diagnostic and Statistical Manual of Mental Disorders IV (DSM-IV) [13] and 2) one or more neurocognitive test scores were below 2.5 SD, with ADL score ≥ 26 and GDS stage 4–7.
Statistical analyses
Epidata 3.1 was used for data management, and data analyses were performed using SPSS 20.0. The median and percentages (p25, p75) were used to describe MMSE scores, and frequencies and percentages were used to describe categorical variables. Multiple linear regression analysis was applied to explore the factors (age, gender, and education) affecting the MMSE. The expected mean MMSE score was calculated based on the MMSE distribution in Zhang’s study [6] as the reference. The product of the mean MMSE score and the number of participants were the expected scores in the corresponding group. The total expected score in different groups dividing by the number of the whole sample was the expected mean MMSE score. Receiver operating characteristic (ROC) curve analyses were performed to establish the sensitivity, specificity, and areas under the ROC curves (AUC).
Item response theory (IRT) methods [14] were used to examine the discrimination ability and measurement precision of the MMSE and the subitems (Table 1 shows the subitems of MMSE). A Hybrid IRT model was implemented using Stata 16.0. The test characteristic curves (TCCs) and test information curves (TICs) for the MMSE were evaluated. The item characteristic curves (ICCs) and item information curves (IICs) for the MMSE subitems were evaluated. A TCC/ICC relate latent ability/cognitive function in SD units (0 indicated average ability, 1 indicated 1-SD higher than average, −1 indicated 1-SD lower than average) to the expected total score or the probability of correct response to an item. The TCC/ICC can be very useful in evaluating the discrimination ability at different points of the ability continuum. A TIC/IIC relates latent ability in SD units to the information (measurement precision). The TIC/IIC can be very useful in ascertaining what range of ability levels a test or an item is most discriminating. p < 0.05 was considered statistically significant.
The subitems of the Mini-Mental State Examination
RESULTS
Baseline characteristics
Among 7,445 veterans, 2,311 (31.0%) were diagnosed with MCI, 984 were diagnosed with (13.2%) dementia, and 4,150 (55.7%) had normal neurological cognition. The demographic characteristics of the subjects have been reported elsewhere [11]. There was no gender difference in three groups (p = 0.053). The dementia participants were older and had lower education level than other two groups (p < 0.001).
Factors influencing MMSE score
Demographic characteristics
The MMSE scores of the cognitively normal controls, veterans with MCI, and veterans with dementia were 29 (28, 30), 26 (24, 28), and 21 (16, 25), respectively. The results of the variables age, gender, and education on the MMSE performance were shown in Table 2. It indicated that a 1-year older participant was associated with a 0.029 and 0.228 scores decrease on MMSE in the healthy and whole sample. And for every 1-year increase in education level, the MMSE increased by 0.026 and 0.119 scores, respectively. There was no effect of gender on MMSE performance in the healthy sample. However, female scored lower than male on MMSE in the whole sample (p = 0.004).
The factors influencing MMSE scores in the healthy and whole sample
B, unstandardized coefficients; SE, standardized error; Beta, standardized coefficients.
Epoch effect
The calculated expected mean MMSE score was shown in Table 3. The results showed that 7,018 veterans (who had complete information on age, education, and MMSE) were supposed to gain 174800.6 scores on MMSE. Therefore, the expected mean MMSE score was 24.9 (174800.6/7018) based on the MMSE score distribution in Zhang’s study, which was lower than the observed MMSE score (26.9) in our study population.
The calculated expected MMSE score using the MMSE distribution in Zhang’s study as the reference
Optimal cut-off scores for the MMSE
The AUCs for the MMSE were 0.849 (95% CI: 0.839–0.858) and 0.892 (95% CI: 0.880–0.905) for detecting MCI and dementia, respectively (Table 4). The sensitivity was between 71.2% and 83.9% and the specificity was between 65.3% and 83.9% in detecting MCI using the cut-off score 27/28. The sensitivity was between 78.3% and 89.9% and the specificity was between 66.8% and 85.8% in detecting dementia using the cut-off score 25/26/27. The ROC curves were presented in Fig. 1. There was similar diagnostic accuracy for different age groups, by gender and education level.
The sensitivity and specificity of MMSE in assessing MCI and dementia
MCI, mild cognitive impairment; CI, confidence interval.
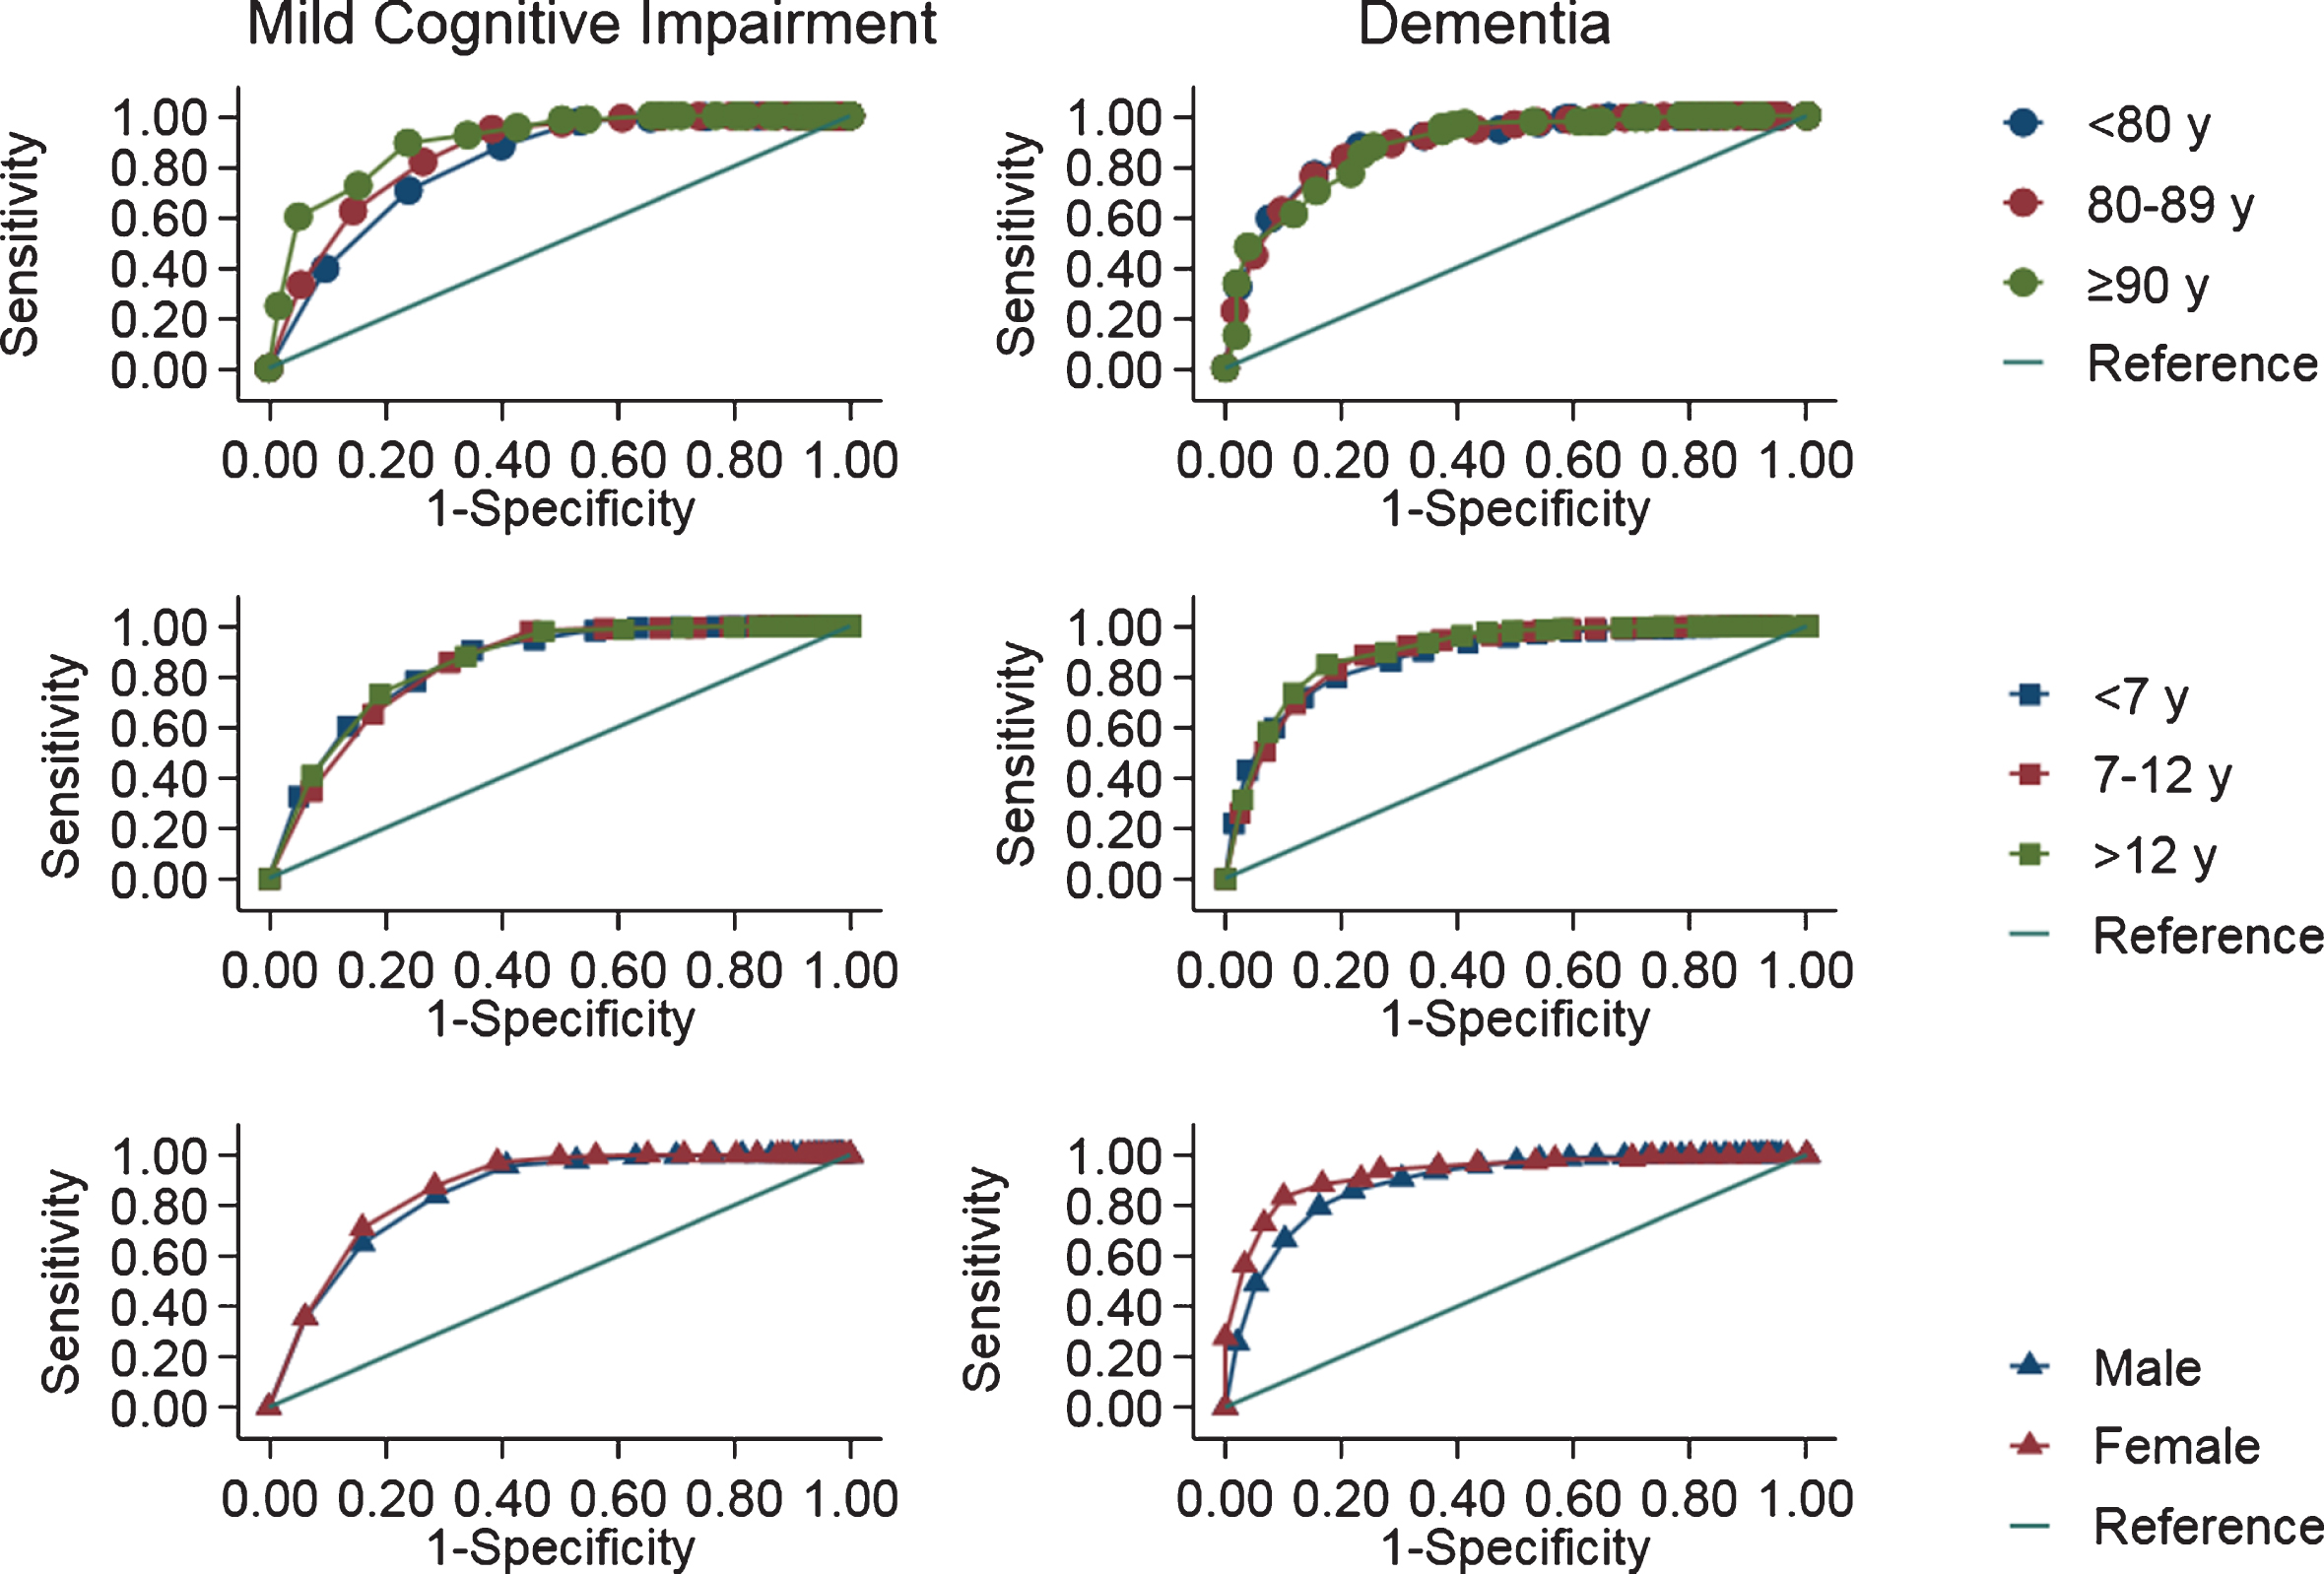
Receiver operating characteristic curves for Mini-Mental State Examination in detecting mild cognitive impairment and dementia.
Zhang reported cut-off scores of 19, 22, and 26 in detecting dementia in groups with different education levels. When the above cut-off scores were applied as the reference standards, the sensitivities were 41.7% and 66.5% in detecting MCI and dementia. The specificities were 98.8% and 87.7% in assessing MCI and dementia.
IRT results
Figure 2 shows the TCC for the MMSE score. The curve describes the relationship between expected total score and cognitive function (in SD units). A change of 2-SD in ability from 4 to 2 corresponded to a loss of 0.5 score in MMSE, while a change in 2-SD in ability from –2 to –4 corresponded to a loss of 15 scores in MMSE.
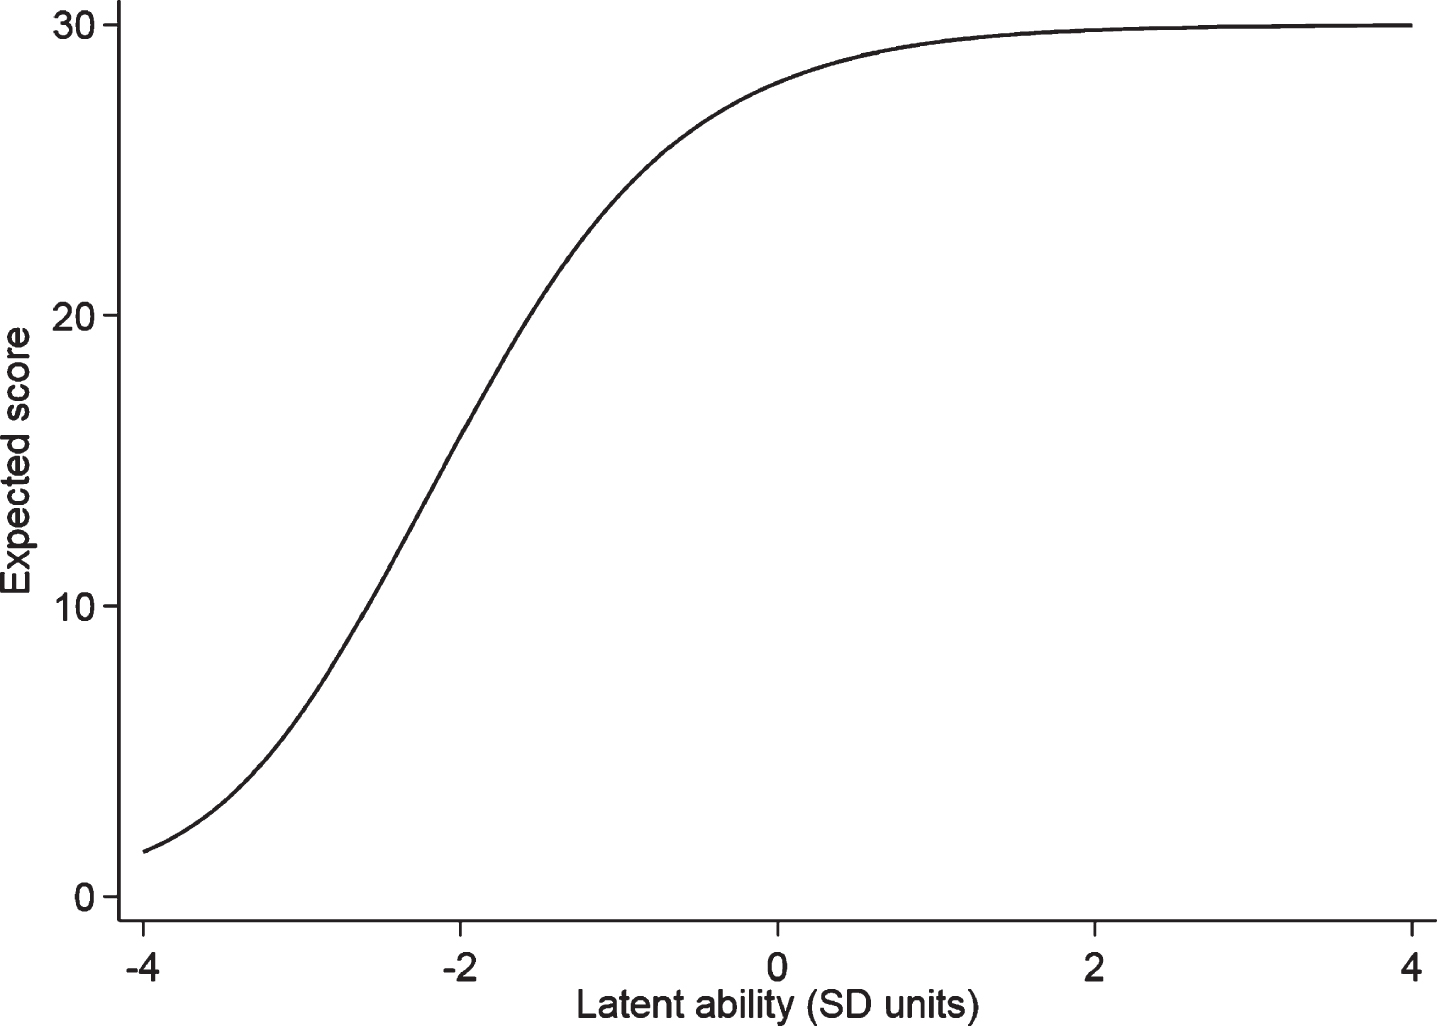
The test characteristic curves for the Mini-Mental State Examination.
As shown in Fig. 2, the MMSE showed reduced discrimination for ability level of −1 and above. There were similar patterns of discrimination ability for the MMSE subitems (Fig. 3). The location orientation domain and the time orientation domain showed the highest discrimination power and the write domain demonstrated low discrimination power.
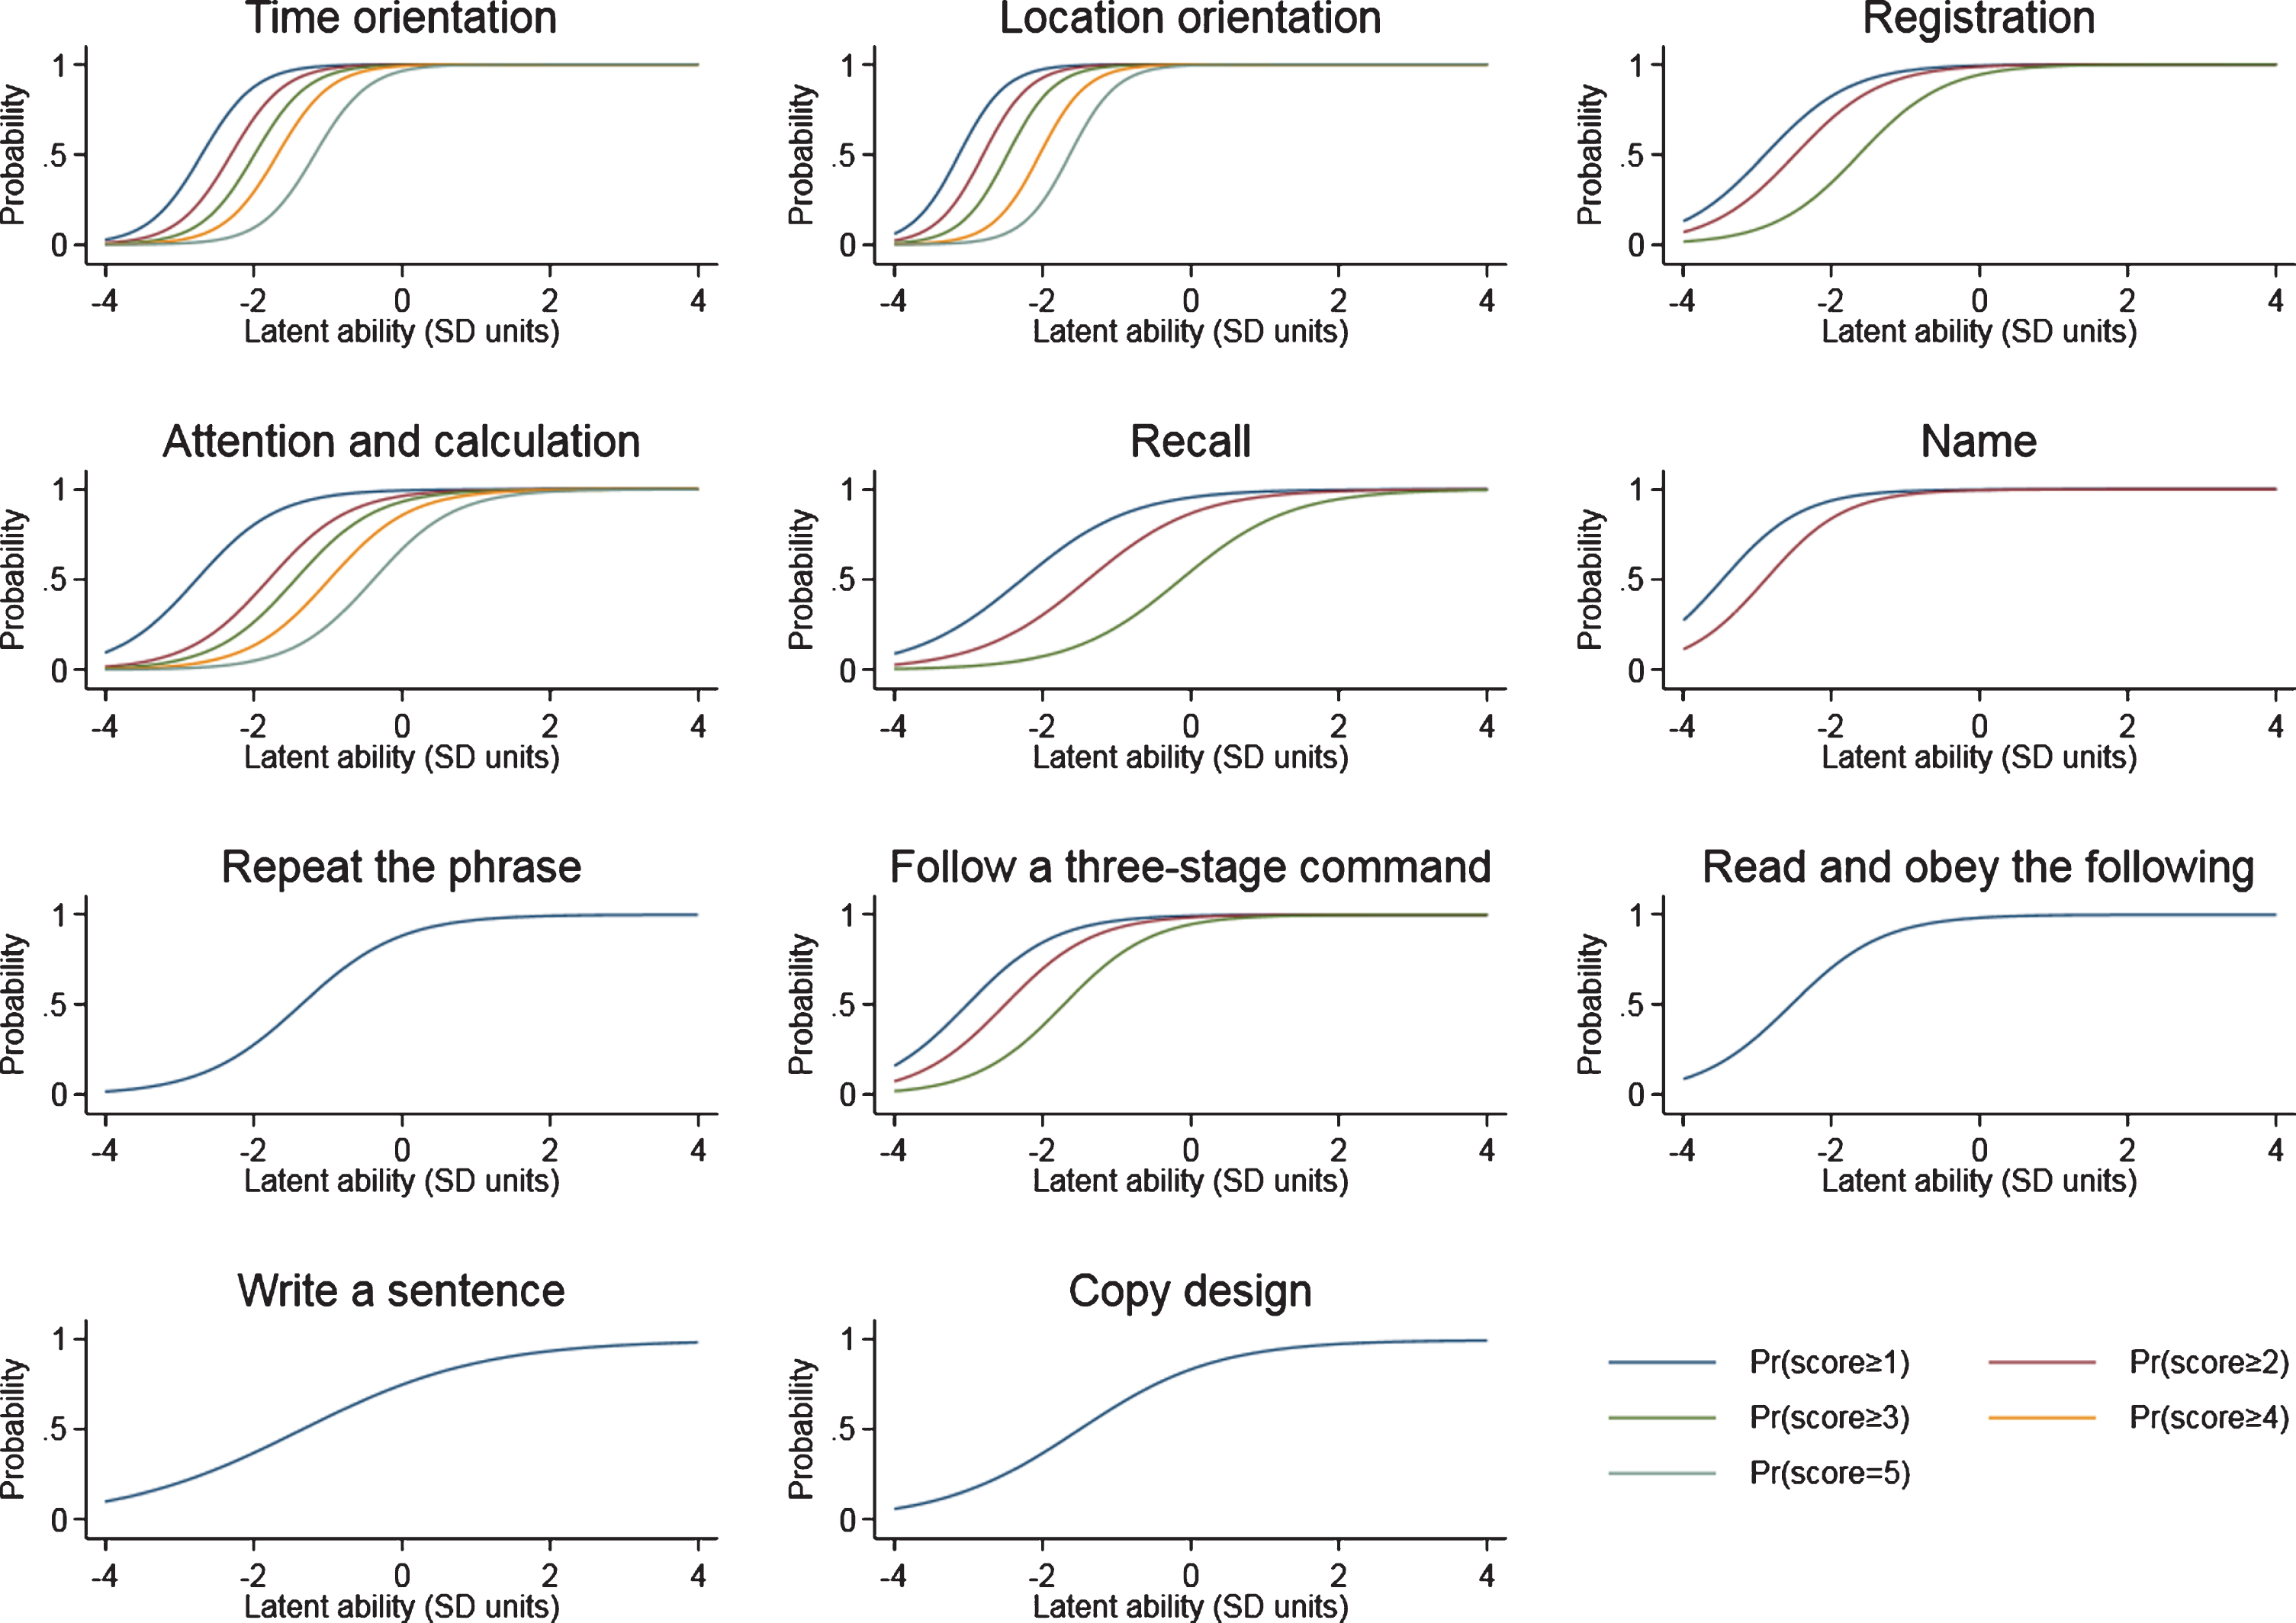
The item characteristic curves for the Mini-Mental State Examination subitems.
Figure 4 shows the TIC for the MMSE score. The curve relates latent ability in SD units to measurement precision of MMSE score. The peak TICs of MMSE was around –2, indicating that the MMSE mainly provides information for low-functioning individuals. There were similar measurement precision properties for the MMSE subitems (Fig. 5). The location orientation domain and the time orientation domain provided the highest precision in the ability range of –3 and –1 (1- or 3-SD lower than average).
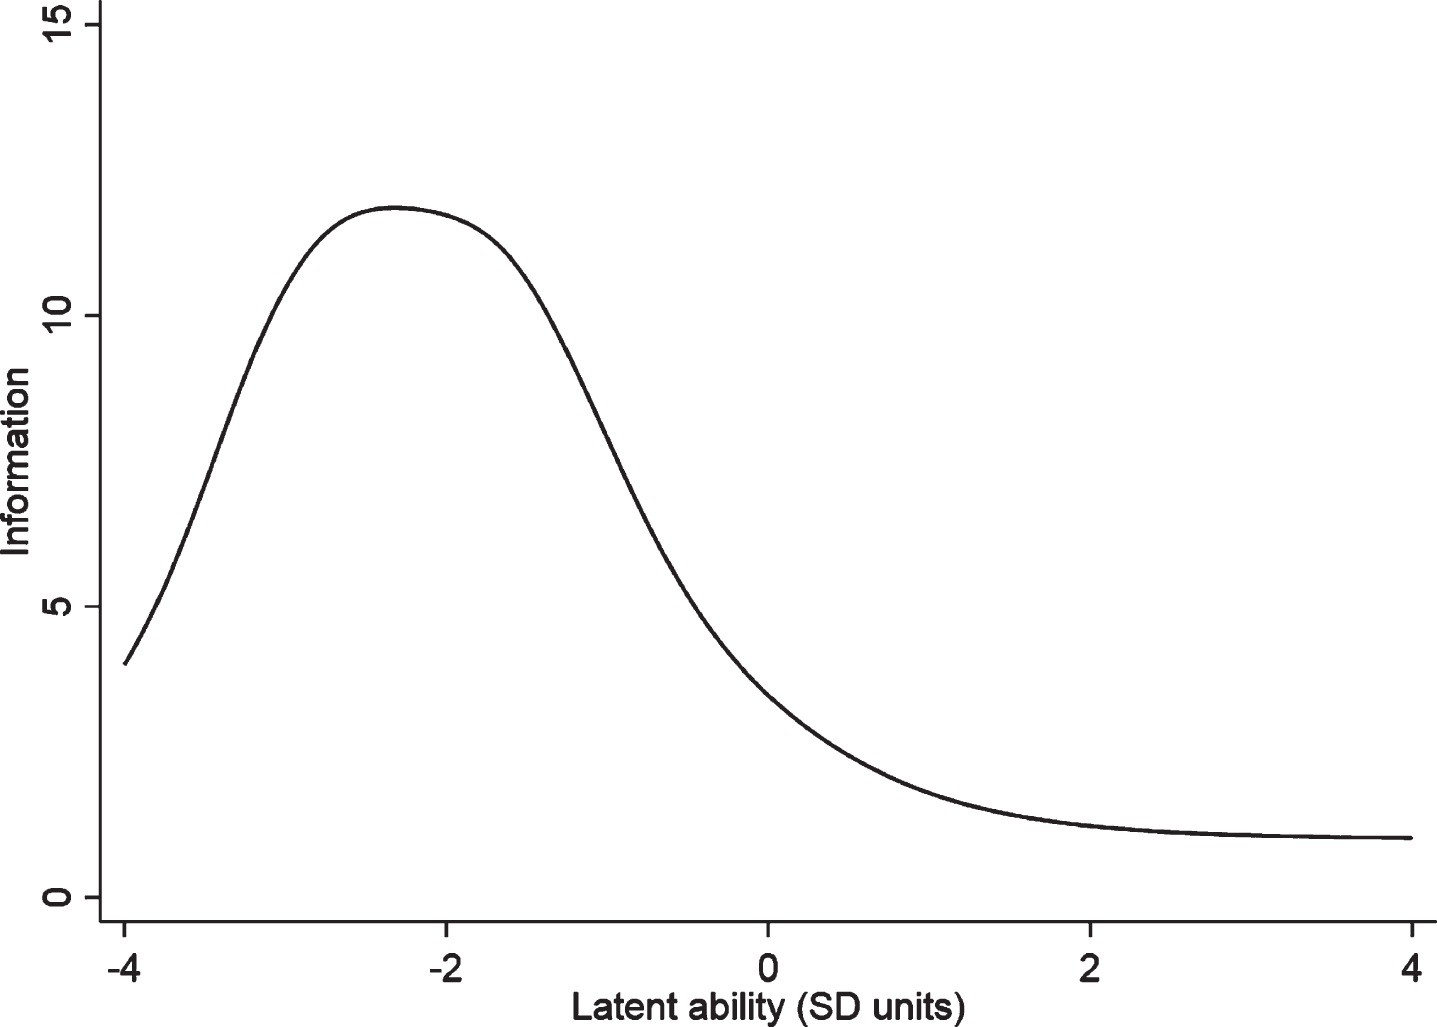
The test information curves for the Mini-Mental State Examination.
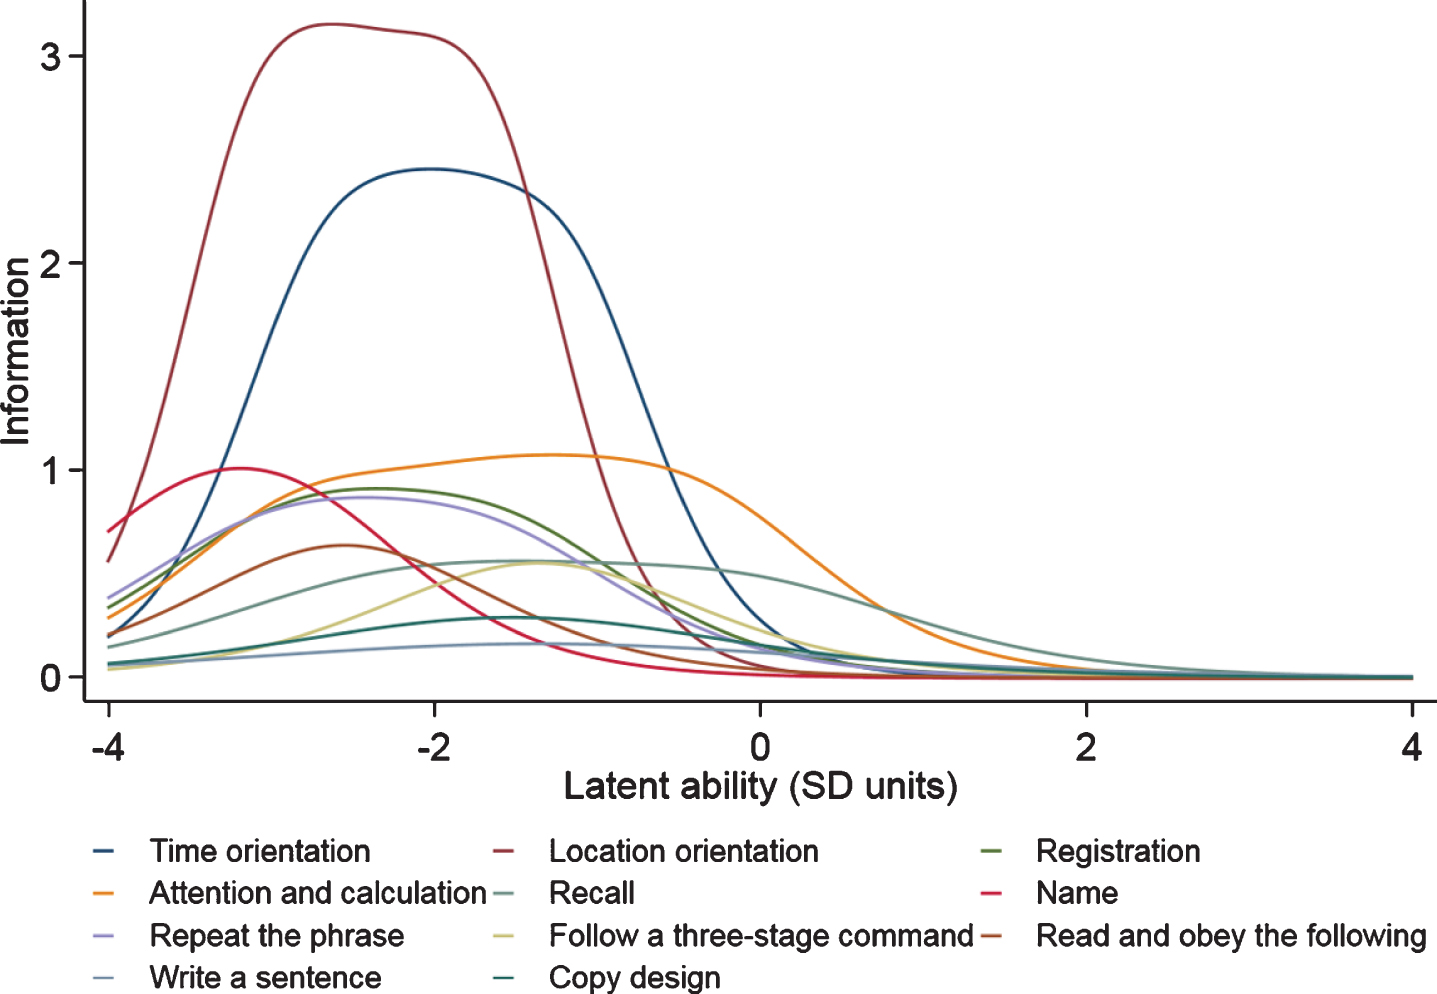
The item information curves for the Mini-Mental State Examination subitems.
DISCUSSION
Consistent with previous studies, our findings indicated that MMSE scores are affected by age and education level [2]. The MMSE score was negatively correlated with age and positively correlated with years of schooling. The results of our study suggested that females had lower MMSE scores than males. However more than 95% of participants in this study were male, which limited the examination of the influence of gender on MMSE. Further research is needed to explore the gender effect on MMSE scores. These findings suggested that we should perform stratified analysis based on the above variables when conducting research using the MMSE as the screening instrument.
The calculated expected mean MMSE score was 24.9 using the MMSE distribution in Zhang’s study as the reference, whereas the observed MMSE score in our study population was 26.9. This result indicated an improvement in MMSE performance over time. This finding was consistent with Morgado’s research, which suggested an epoch effect on MMSE scores when controlling for possible influencing factors [7]. It is possible that the increase in intelligence quotient (IQ) test scores in children persists into late adult life. Additionally, the better MMSE performance may be attributed to the earlier and closer contact with sophisticated technology, access to large amounts of information, and improved general health and cerebral development.
Considering the epoch effect on MMSE scores, we assumed that the previous cut-off scores may be not applicable. The poor sensitivity in detecting dementia was observed, when the cut-off scores proposed by Zhang in 1997 was applied as the reference standard. It is recommended that the cut-off scores of 25/26/27 be used for detecting dementia in the present population.
Despite of the relative high AUC of MMSE in detecting dementia, the sensitivity (78.3% /89.9%) and specificity (66.8% /85.8%) did not meet the requirements for a screening tool for cognitive function. These results suggested that MMSE is a poor screening tool. In addition, the MMSE showed reduced discrimination and provided little information for ability level of –1 and above (below average to high ability) based on IRT model which provided a more powerful approach for test evaluation [15]. These properties support the MMSE as a poor screening test for dementia. And further effort is needed to design better screening tests for dementia.
Researchers noted that the MMSE has been more useful in assessing dementia severity [9]. The results that the high discriminating power and precision of MMSE for participants in the cognitive function range of –3 and –1 (1- or 3-SD lower than average) supported the view. In addition, the location orientation domain and the time orientation domain could be more useful in designing test in assessing dementia severity, because of the highest precision and discrimination power.
This study has some strengths. We adopted a rigorous and scientific design (two-phase, stratified cluster sampling design) and a standardized scientific diagnostic process in a general population. We calculated the expected mean MMSE score to explore the epoch effect. In addition, we determined the discrimination ability and measurement precision of the MMSE, which suggested that the MMSE was a poor screening test for dementia. In addition, these results might provide insight into the application of MMSE in the future elderly population in China. Because the age structure of the future elderly population in China might be similar to the age distribution in this veteran population, with the oldest-old population in China continues growing quickly [16].
This study also has some limitations, the sample consisted of subjects who were from urban areas, who were Han Chinese, and who were veteran residents, and representation from the rural elderly population of different occupational groups was lacking. Future studies should focus on participants from rural and urban communities, different ethnic minority groups and different dialect areas to fully validate the application of the MMSE in detecting dementia.
In conclusion, improved cognitive ability over time may lead to an overall increase in cognitive screening test scores (such as MMSE scores). The reduced discrimination and poor diagnostic accuracy of the MMSE supported the view that MMSE was a poor screening tool. These results demonstrate the need for regular updating of cognitive function screening tools.
Footnotes
ACKNOWLEDGMENTS
We are grateful for the support of the CVCR Platform. Medical staff from all of the participating hospitals contributed to acquisition of data. The authors would like to thank all the participating veterans and their caregivers.
This work was supported by Funding Special Research Project on Health Care, Health Sector of the General Logistics Department of People’s Liberation Army (No: 07BJZ04; 10BJZ19; 11BJZ09; 12BJZ46) and the National Science and Technology Support Program (No: 2013BAI09B14).