
Abstract
The connection between diabetes and Alzheimer’s disease (AD) is not fully determined. Hyperphosphorylation of tau protein is mediated by binding and stabilization of truncated p25 with cyclin-dependent kinase-5 (CDK5) in AD. We recently showed that diabetes-associated hyperglycemia increased the CDK5 levels to promote development of AD. Here, we examined the underlying mechanisms. Hyperglycemia and glucose intolerance were induced in rats that had received a low dose of streptozotocin (STZ) and a high fat diet (HFD). Compared to the control rats that received no STZ and normal diet-fed, the STZ + HFD rats exhibited poorer performance in the behavioral test and showed hyperacetylation of H3K9 histone on CDK5 promoter, likely resulting from upregulation of a histone acetyltransferase, GCN5. Inhibition of acetylation of H3K9 histone by a specific GCN5 inhibitor, MB3, attenuated activation of CDK5, resulting in decreased tau phosphorylation in rat brain and improved performance of the rats in the behavior test. Thus, these data suggest that diabetes may promote future development of AD through hyperacetylation of H3K9 histone on CDK5 promoter.
INTRODUCTION
Both increased deposition of extracellular senile plaques by amyloid-β peptide aggregates (Aβ) and formation of intraneuronal neurofibrillary tangles by hyperphosphorylated tau (p-Tau) are featured pathological changes in Alzheimer’s disease (AD) [1, 2]. Strategies to treat AD through pharmaceutical removal have recently failed clinical trials, leading to the shift of the study focus from Aβ to p-Tau [2].
Diabetes is a susceptibility factor for AD [3, 4], but the underlying mechanisms are poorly understood. Recently, we showed that diabetes-associated hyperglycemia increased the cyclin-dependent kinase 5 (CDK5) levels to promote development of AD [5]. CDK5 is the most important factor that enhances tau hyperphosphorylation [6]. CDK5 is activated equally by p35 and its truncated form p25 [7], but by the higher binding affinity of CDK5 to p25 than p35 causes longer high life of activated form of CDK5, leading to hyperphosphorylation of tau [6, 8–10]. Interestingly, we found that the epigenetic control of CD5 likely occurred in the diabetic status, and seemed to mediate the development of AD [5].
Histone acetylation and deacetylation are conducted by specific enzyme-mediated biological actions, and these enzymes are histone acetyltransferases (HATs) and histone deacetylases (HDACs), respectively [11]. HATs regulate acetylation of specific lysine residues on core histones, leading to uncoiling of the DNA and increased accessibility to transcription factor binding. On the other hand, HDACs regulate histone deacetylation, leading to transcriptional repression through compacting chromatin, thereby limiting access to transcription factors [11]. Thus, a balance between acetylation and deacetylation states is necessary for the proper activation of gene transcription [12]. Histone proteins are highly post-translationally modified, whereas histone H3 is the most extensively modified of the all 5 histones [13]. It has been shown that histone H3 acetylation at a transgenic promoter in a nonpermissive chromatin region is sufficient to activate gene expression [14]. The acetyltransferase GCN5 is typically associated with transcriptional activation through modification of histone H3 [15–17].
Here we studied the diabetes-associated alteration in histone H3 acetylation as well as its influence on future development of AD in a rat model. Hyperglycemia and glucose intolerance were induced in rats that had received a low dose of streptozotocin (STZ) and a high fat diet (HFD). Compared to the control rats that received no STZ and normal diet-fed (ND), the STZ+HFD rats exhibited poorer performance in the behavioral test and showed hyperacetylation of H3K9 histone on CDK5 promoter, likely resulting from upregulation of a histone acetyltransferase, GCN5. Inhibition of acetylation of H3K9 histone by a specific GCN5 inhibitor, MB3, attenuated activation of CDK5, resulting in decreased tau phosphorylation in rat brain and improved performance of the rats in the behavior test.
MATERIALS AND METHODS
Experimental and animal protocols
All experiments were performed in strict accordance with the Care and Use of Laboratory Animal Guideline, issued by Lanzhou University. Male Sprague-Dawley (SD) rats at 18 weeks of age (around 250 g) were obtained from the Experiment Animal Support Center of Liaoning Province, and were kept in cages with free access to fresh water or high-glucose water (10% glucose), injected with 35 mg/kg streptozotocin (STZ, Sigma-Aldrich, St. Louis, MO, USA) or saline control, and then fed with a standard diet (22.5% protein, 5.4% fat, 52% carbohydrates, totaling 3.2 kcal/g energy; from LabDiet, St. Louis, MO, USA) or with a high-fat diet (26.2% protein, 34.9% fat, 26.3% carbohydrates, totaling 5.24 kcal/g energy; from Research Diets, New Brunswick, NJ, USA), as described [5]. MB–3 (M2449, Sigma-Aldrich) was nasal administrated to rats at a dose of 1 mg/kg at a frequency of twice per week.
Glucose, IPGTT, and serum insulin measurement
Fasting blood glucose measurement and intraperitoneal glucose tolerance test (IPGTT) were performed as previously described [5]. Serum insulin was measured using a rat insulin ELISA kit (ERINS; Thermo Fisher Scientific, Inc., Waltham, MA, USA) as described [5].
Behavioral analysis
Spatial reference memory was measured using the Morris water-maze test. Rats were handled 60 s per day for 10 days during the two weeks prior to real test. Pre-handling was designed to condition the rats to manipulations which would be experienced during introduction and removal from the testing pool and included a 20 s exposure to water at a depth of 1 cm. At test, rats received visible platform training for 3 days, 6 trials per day, and hidden platform training for 6 days, 3 trials per day. Four probe trials of 30 s duration were performed 20 h after hidden training trials. The mean target quadrant occupancy of all four probes was calculated. Motor assessment was conducted in parallel. Deficits in limb coordination and accuracy of limb placement as well as general motor coordination of the rats was evaluated in the beam crossing test in which a rat has to walk across a beam to reach a home cage.
Quantitative reverse transcription polymerase chain reaction (RT-qPCR)
TaqMan quantitative PCR (RT-qPCR, two steps) was performed to examine relative gene levels, using GAPDH as an internal control. The total RNA was isolated using TRIzol® reagent (Invitrogen, Beijing, China), according to the manufacturer’s instructions. RNA was then reverse transcribed into cDNA using the High Capacity cDNA Reverse Transcription kit (Applied Biosystems, Foster City, CA, USA). TaqMan Gene Expression Assays were conducted using pre-designed primers on an ABI 7500 Fast Real-time PCR system (Applied Biosystems). Relative quantification of gene expression was performed using the 2–ΔΔCt method.
Western blot
Both isolated cells and rat brain tissue were homogenized in protein lysis buffer (Bio-rad, Beijing, China). The protein concentration was determined using a BCA protein assay kit (R&D systems, Beijing, China). Western blot was performed with the following primary antibodies: rabbit anti-CDK5, anti-H3acK9, anti-H3, anti-GCN5, and anti-GAPDH (Abcam, Cambridge, MA, USA). The secondary antibody was HRP-conjugated anti-rabbit (DAKO, Shanghai, China). Image acquisition and densitometric analysis of the gels were performed using NIH ImageJ software (Bethesda, MA, USA).
Immunostaining and quantification
Immunostaining for insulin or phosphorylated tau (p-Tau) was performed using a rabbit anti-insulin antibody (Abcam) or a goat anti-p-Tau antibody (Santa Cruz Biotechnology, Dallas, TX, USA). Beta cell mass was determined based on insulin staining and calculated by total pancreas weight X (total beta cell area/total pancreas area). Quantification was conducted using 4 slides, each separated by a distance of 100μm.
Chromatin immunoprecipitation (ChIP) Assay
Media was removed before cross-linking for 10 min with 1% formaldehyde in PBS. Formaldehyde solution was removed from the tissue and replaced with 0.125 M glycine in PBS to quench crosslinks reaction for 10 min. Tissue were then washed twice with PBS and homogenized in 1% SDS cell lysis buffer. Chromatin was sheared by sonication. To assess shearing efficiency, a small aliquot of soluble sheared chromatin (∼500 ng) was reverse crosslinked with proteinase K at 62°C for 2 h before column purification (Qiagen) and analysis on MultiNA electrophoresis microchip (Shimadzu, Kyoto, Japan). Sheared chromatin with an optimal size range of 100–1000 bp with a peak at ∼250–300 bp was processed for immune-purification. ChIP on approximately 1 million cells was performed by diluting sheared chromatin to a final SDS concentration of 0.1% with ChIP dilution buffer, followed by addition of 5μg of antibody directed to acetylated H3K9 or H3 (Abcam) and 20μL of Protein A Dynabeads (Invitrogen). Samples were incubated overnight at 4°C with rotation. Beads were washed for 5 min at 4°C with low salt followed by high salt, LiCl, and two further TE buffer washes. Beads were transferred to a clean tube for reverse cross-linking and column purification (Qiagen). Four replicate ChIPs were performed for each sample and then pooled for library preparation. DNA was quantified fluorometrically (Qubit, Invitrogen) using a double strand specific inter-chelating dye (Quant-IT dsDNA, Invitrogen). The specificity of the ChIP was interpreted using TaqMan Gene Expression Assays with pre-designed primers on an ABI 7500 Fast Real-time PCR system (ChIP-Q-PCR).
Statistics
Statistical analysis was performed using GraphPad Prism 7 (GraphPad Software, San Diego, CA, USA). Analysis was performed using one-way ANOVA with a Bonferroni correction, followed by Fisher’s Exact Test upon necessity. All values are depicted as mean±standard deviation from 10 individuals and are considered significant if p < 0.05.
RESULTS
STZ + HFD induces hyperglycemia and glucose intolerance in rats
In order to explore the mechanisms underlying hyperglycemia/diabetes-induced future development of AD, we injected the rats with low dose of STZ or saline, and then fed the saline-treated rats with ND (as controls; ND) and fed the STZ-treated rats with HFD (STZ + HFD) for 8 weeks. We detected significant increases in fasting blood glucose (Fig. 1A) as well as significantly impaired glucose response (Fig. 1B) in STZ + HFD rats, compared to ND rats. Serum insulin was measured by ELISA, showing significantly higher levels in STZ + HFD rats, compared to ND rats (Fig. 1C). Beta cell mass were determined based on insulin staining, showing slight but significant decreases in STZ + HFD rats, compared to ND rats (Fig. 1D, E). The increases in serum insulin but decreases in beta cell mass should be resulting from a modest decrease in beta-cell mass due to STZ but some degree of insulin resistance due to HFD. Thus, STZ + HFD induces hyperglycemia and glucose intolerance in rats, as a good model for studying the mechanisms underlying hyperglycemia/diabetes-induced future development of AD.
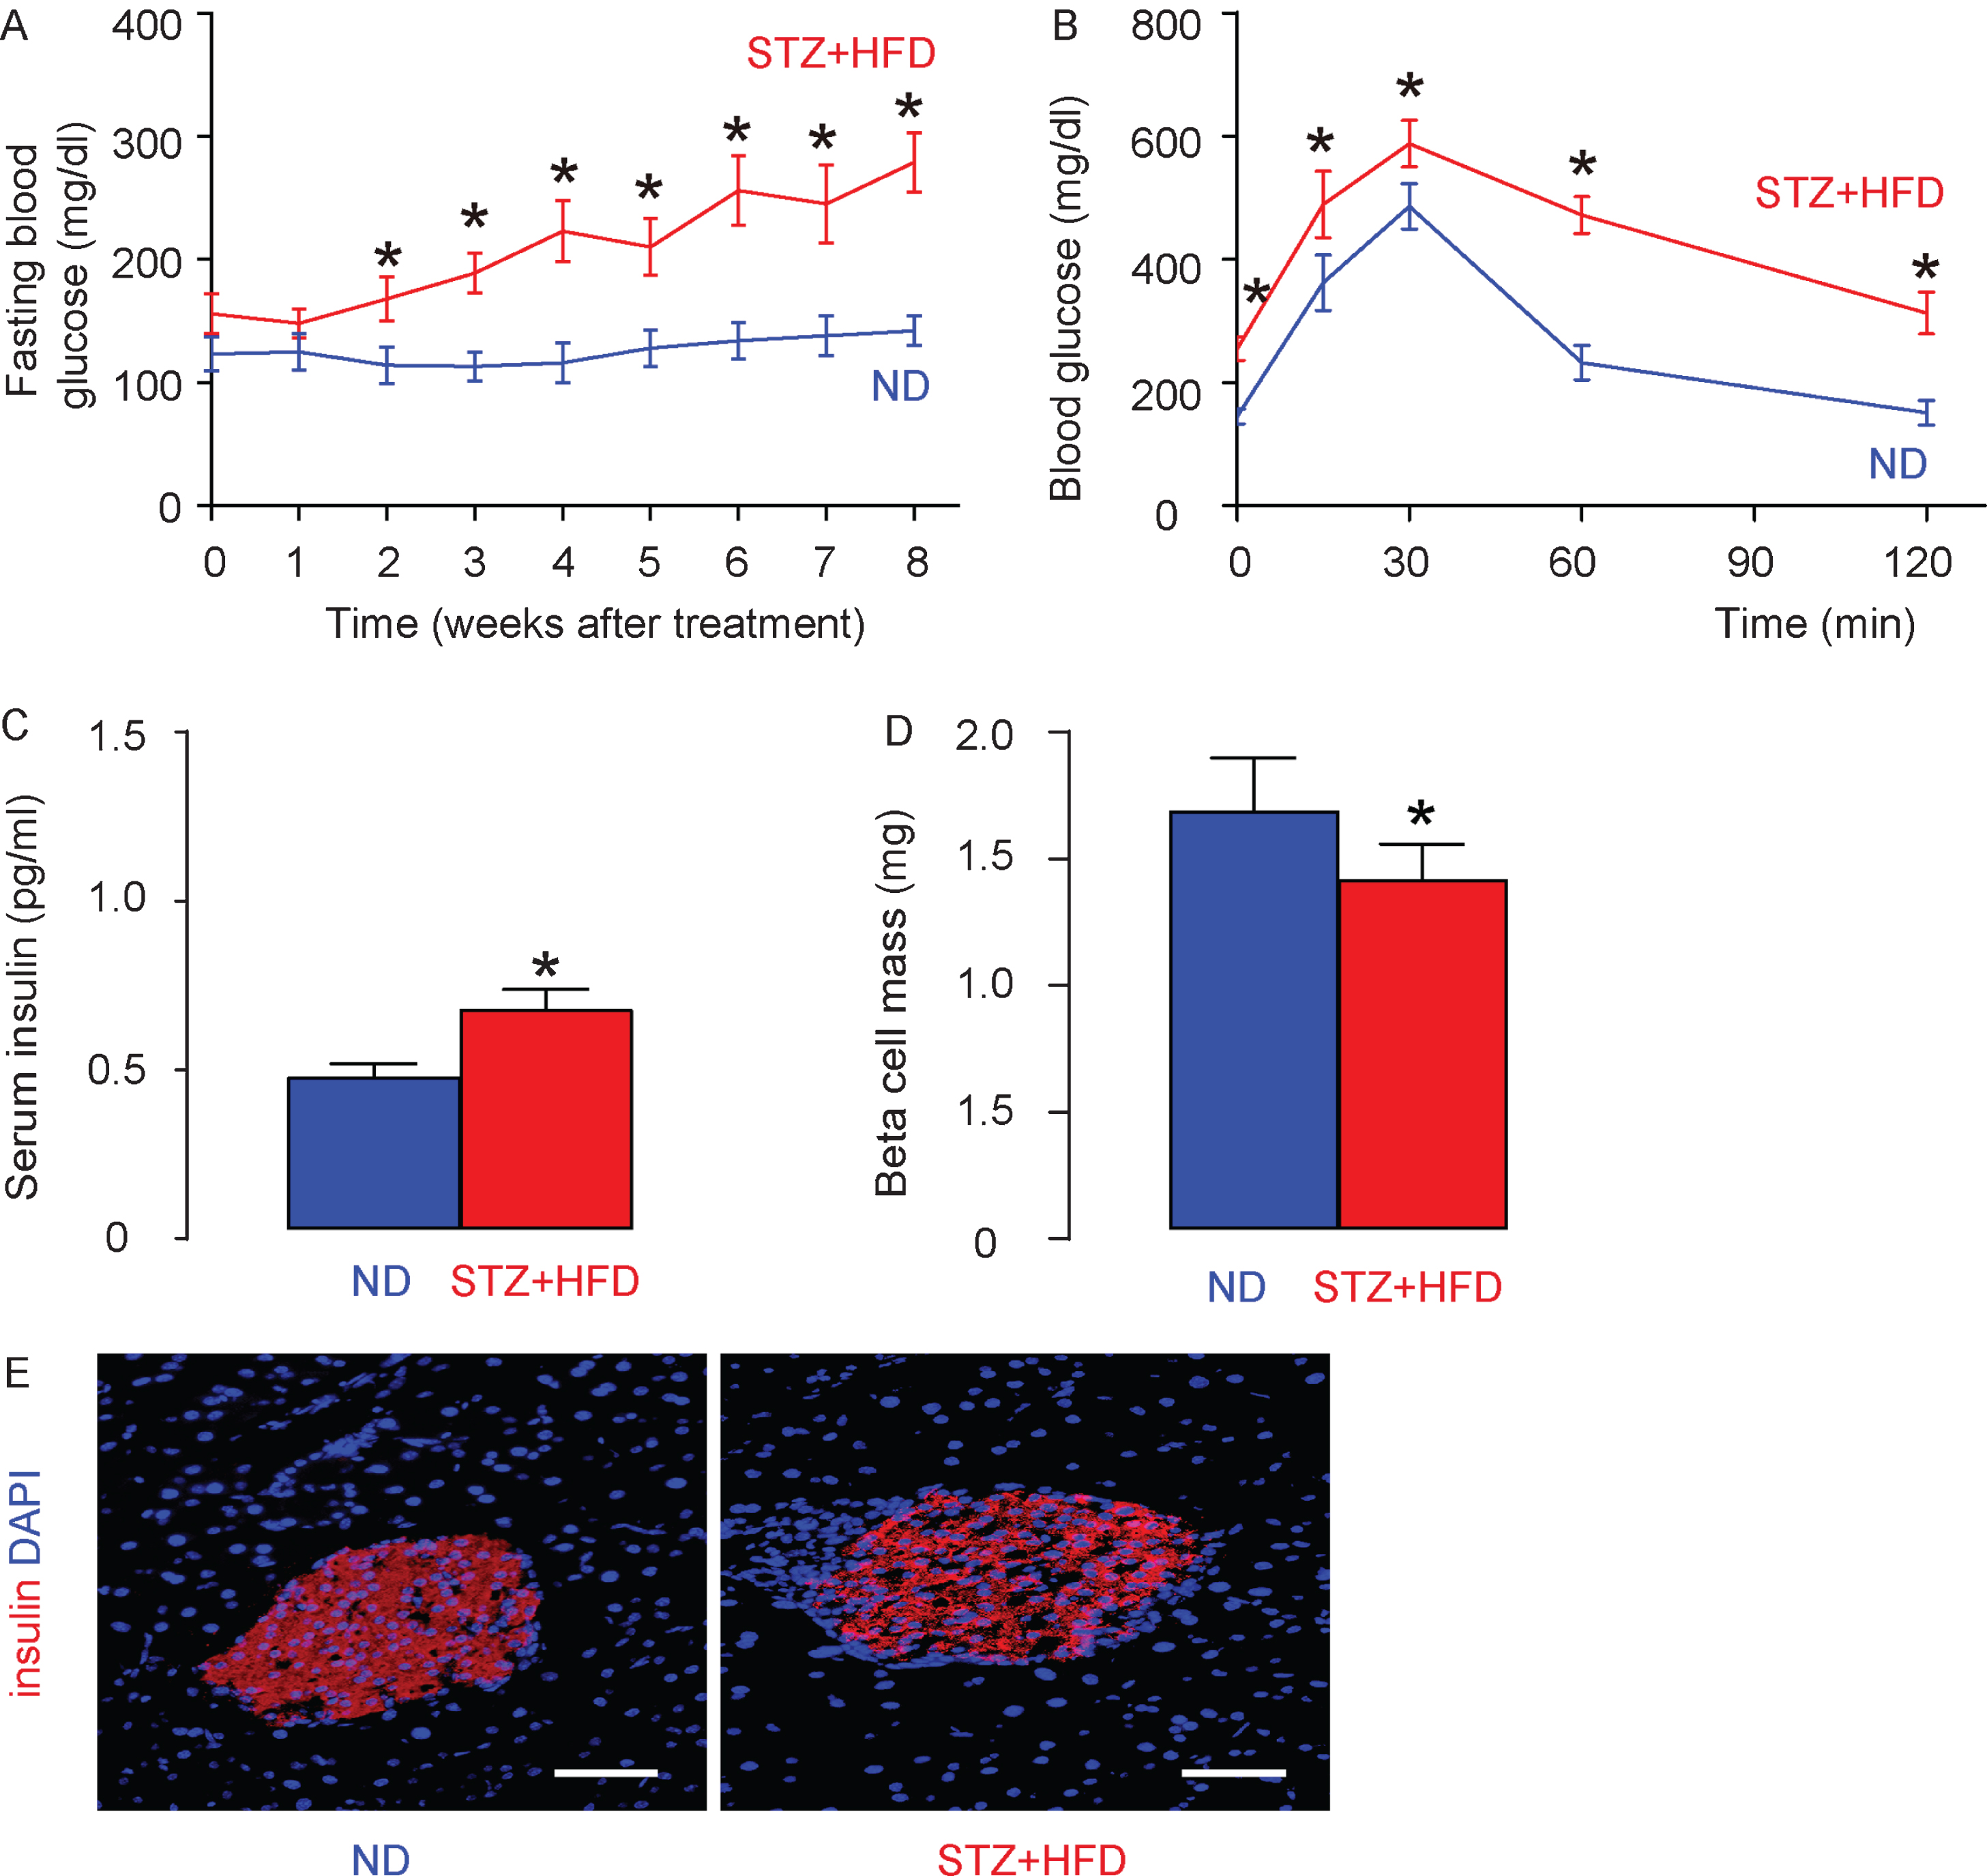
STZ + HFD induces hyperglycemia and glucose intolerance in rats. The rats were given low dose of STZ or saline, and then fed the saline-treated rats with ND (as controls; ND) and fed the STZ-treated rats with HFD (STZ + HFD) for 8 weeks. A) Fasting blood glucose in ND– and STZ + HFD– rats. B) IPGTT in ND– and STZ + HFD– rats at 8 weeks. C) Serum insulin in ND– and STZ + HFD– rats at 8 weeks. D) Beta cell mass. E) Representative insulin staining on rat pancreas at 8 weeks. *p < 0.05. N = 10. Scale bars are 50μm.
Development of AD in STZ + HFD rats
Eight weeks after STZ and diet treatment, the rats underwent two behavioral tests: Morris water-maze test and locomotor test. In Morris water-maze test for assessing spatial reference memory, the STZ + HFD rats showed no difference in the path length in the visible platform phase (Fig. 2A), but required significantly longer path length in the hidden platform phase (Fig. 2B) and significantly increased target quadrant occupancy (Fig. 2C), compared to ND rats. In a locomotor test, the STZ + HFD rats required significantly longer time for crossing a beam (Fig. 2D), compared to ND rats. Thus, hyperglycemia induces poorer memory and locomotor capability in STZ + HFD rats. For assessing the pathological changes behind these behavioral disorders, we analyzed the p-Tau levels in the rat hippocampus in these rats at sacrifice. We detected significantly higher p-Tau density in the hippocampus region in STZ + HFD rats, compared to ND rats, shown by quantification (Fig. 2E), and by representative images (Fig. 2F). Together, these data suggest development of AD in STZ + HFD rats.

Development of AD in STZ + HFD rats. Eight weeks after STZ and diet treatment, the rats underwent two behavioral tests: Morris water-maze test and locomotor test. Path length in the visible platform phase (A), in the hidden platform phase (B), and target quadrant occupancy (C) in the Morris water-maze test. D) Time for crossing a beam in a locomotor test. Phosphorylated tau (p-Tau) was stained in rat brain at 8 weeks, shown by relative p-Tau density (E) and by representative images (F). *p < 0.05. N = 10. Scale bars are 50μm.
H3K9 histone hyperacetylation on CDK5 promoter and increased GCN5 in STZ + HFD rats
Next, we examined the levels of CDK5 in the in the rat hippocampus. We found that both CDK5 mRNA (Fig. 3A) and protein (Fig. 3B) levels were significantly increased in STZ + HFD rats, compared to ND rats. The levels of histone acetylation were analyzed using Q-PCR after ChIP. The results of ChIP-Q-PCR showed that STZ+HFD rats exhibited hyperacetylation of histone H3K9 (H3acK9) on the promoter of CDK5, but not on the promoter of control GAPDH, in brain tissue (Fig. 3C). Western blot showed significantly higher H3acK9 density in total H3 (Fig. 3D). Since General Control of Amino-acid Synthesis 5 (GCN5) is a major regulator for H3 histone acetylation, we thus assessed its level and found that GCN5 significantly increased in the brain tissue from STZ + HFD rats, compared with ND rats (Fig. 3E). Together, these data suggest H3K9 histone hyperacetylation on CDK5 promoter and increased GCN5 in STZ + HFD rats.
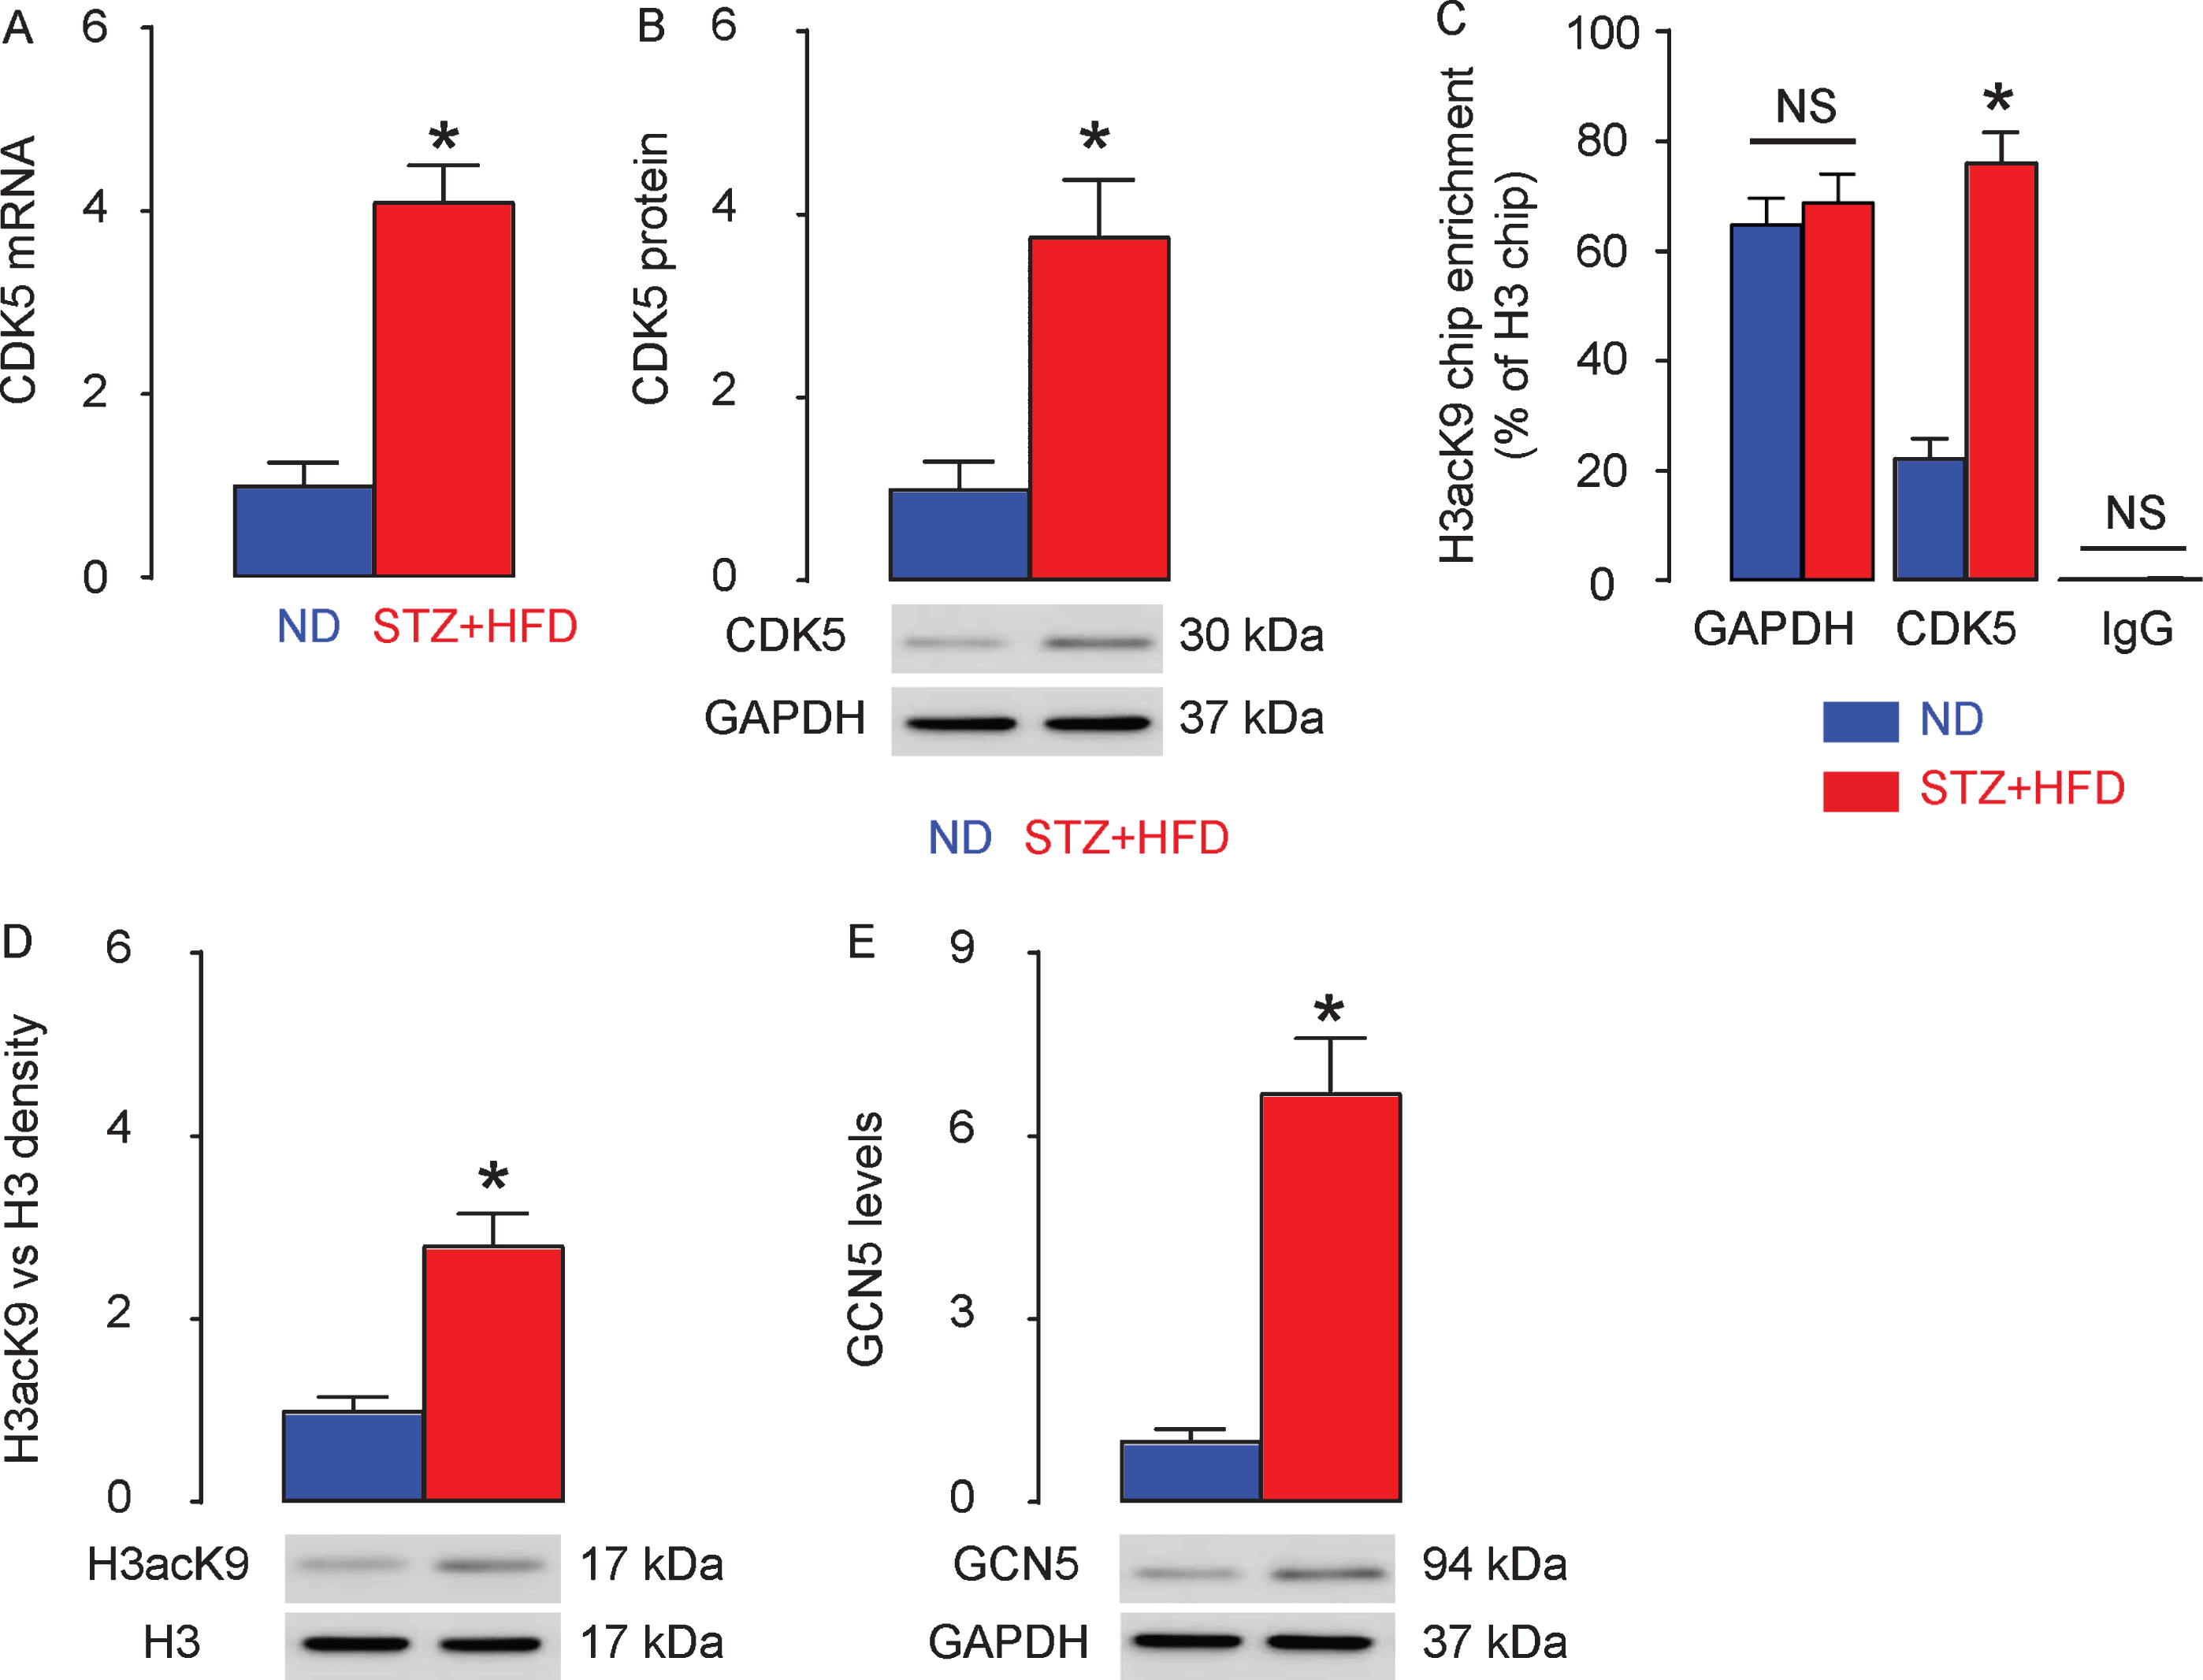
H3K9 histone hyperacetylation on CDK5 promoter and increased GCN5 in STZ + HFD rats. The levels of CDK5 in the in the rat hippocampus, by RT-qPCR (A) and by western blot (B). C) ChIP-q-PCR for H3acK9 levels, compared to H3 levels, on GAPDH promoter and CDK5 promoter. D) Western blot for H3acK9 levels, compared to H3 levels, in rat brain. E) Western blot for GCN5 levels. *p < 0.05. NS, non-significant. N = 10.
MB-3 does not changes diabetes status in STZ+HFD rats
MB-3 is also called Butyrolactone 3, and is a pharmaceutical inhibitor of Histone acetyltransferase GCN5. In order to examine if the STZ + HFD-induced hyperglycemia promotes GCN5-mediated H3K9 histone hyperacetylation of CDK5 promoter, which subsequently increases CDK5 levels to cause AD, we used MB-3 to treat STZ + HFD rats (STZ + HFD + MB-3). The control STZ+HFD rats received saline instead of MB-3 (STZ + HFD). We detected significant and similar increases in fasting blood glucose (Fig. 4A) as well as similarly impaired glucose response (Fig. 4B) in STZ + HFD rats, with or without MB-3 treatment. Serum insulin was measured by ELISA, showing similar levels in STZ + HFD rats, compared to ND rats (Fig. 4C). Beta cell mass were determined based on insulin staining, showing similar levels in STZ + HFD rats, compared to ND rats (Fig. 4D-E). These data suggest that MB-3 does not changes diabetes status in STZ + HFD rats.
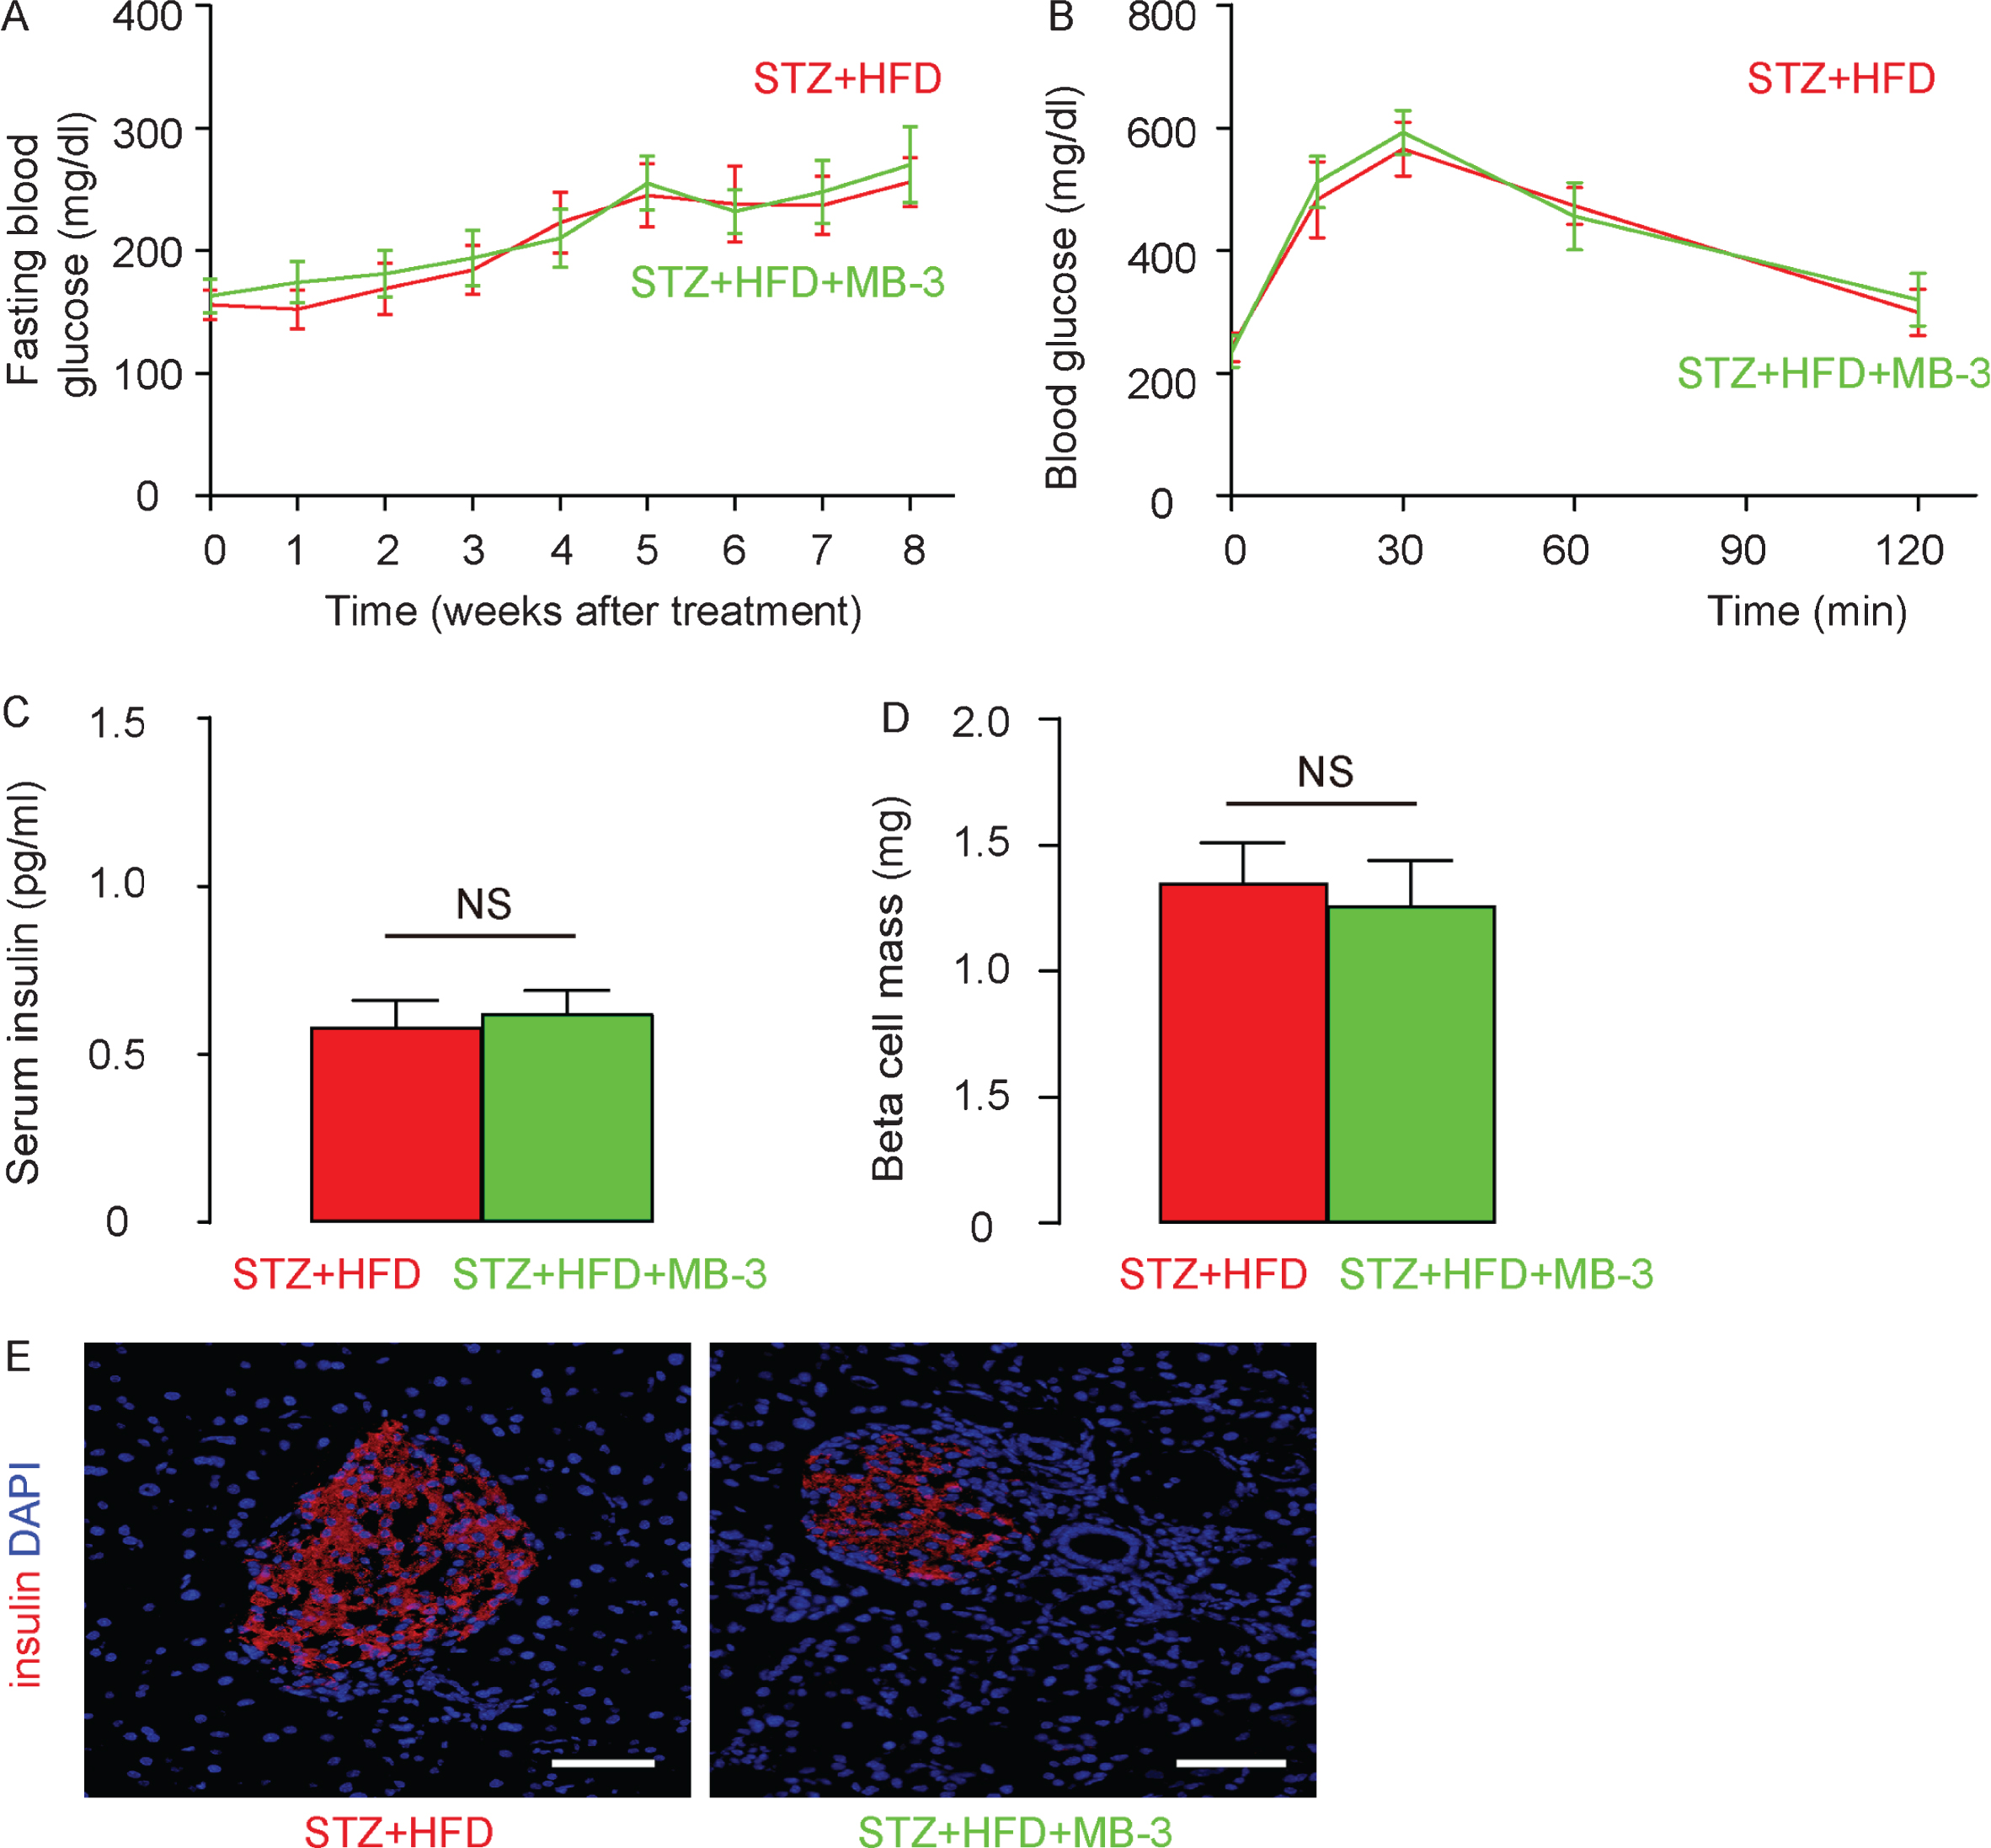
MB-3 does not changes diabetes status in STZ + HFD rats. A specific GCN5 inhibitor, MB-3, was nasally given to STZ + HFD rats (STZ + HFD + MB–3). The control STZ + HFD rats received saline instead of MB–3 (STZ + HFD). The treatment lasted for 8 weeks. A) Fasting blood glucose in STZ + HFD + MB–3– and STZ + HFD–rats. B) IPGTT in STZ + HFD + MB–3– and STZ + HFD–rats at 8 weeks. C) Serum insulin in STZ + HFD + MB–3– and STZ + HFD–rats at 8 weeks. D) Beta cell mass. E) Representative insulin staining on rat pancreas at 8 weeks. *p < 0.05. N = 10. Scale bars are 50μm.
MB-3 attenuates increase in GCN5, H3K9 histone hyperacetylation on CDK5 promoter, and CDK5 upregulation in STZ + HFD rats
Next, we thus assessed GCN5 levels in rat brain and found that GCN5 significantly attenuated in the brain tissue from STZ + HFD + MB-3 rats, compared with STZ + HFD rats (Fig. 5A). The levels of histone acetylation were analyzed using Q-PCR after ChIP. The results of ChIP-Q-PCR showed that STZ + HFD + MB-3 rats exhibited attenuated hyperacetylation of histone H3K9 (H3acK9) on the promoter of CDK5, as well as on the promoter of control GAPDH, in brain tissue (Fig. 5B). Western blot also showed significantly attenuated H3acK9 density in total H3 in STZ + HFD + MB-3 rats, compared to STZ + HFD rats (Fig. 5C). Finally, we examined the levels of CDK5 in the in the rat hippocampus. We found that both CDK5 mRNA (Fig. 5D) and protein (Fig. 5E) levels were significantly attenuated in STZ + HFD + MB-3 rats, compared to STZ + HFD rats. Together, these data suggest MB-3 attenuates increase in GCN5, H3K9 histone hyperacetylation on CDK5 promoter and CDK5 upregulation in STZ + HFD rats.
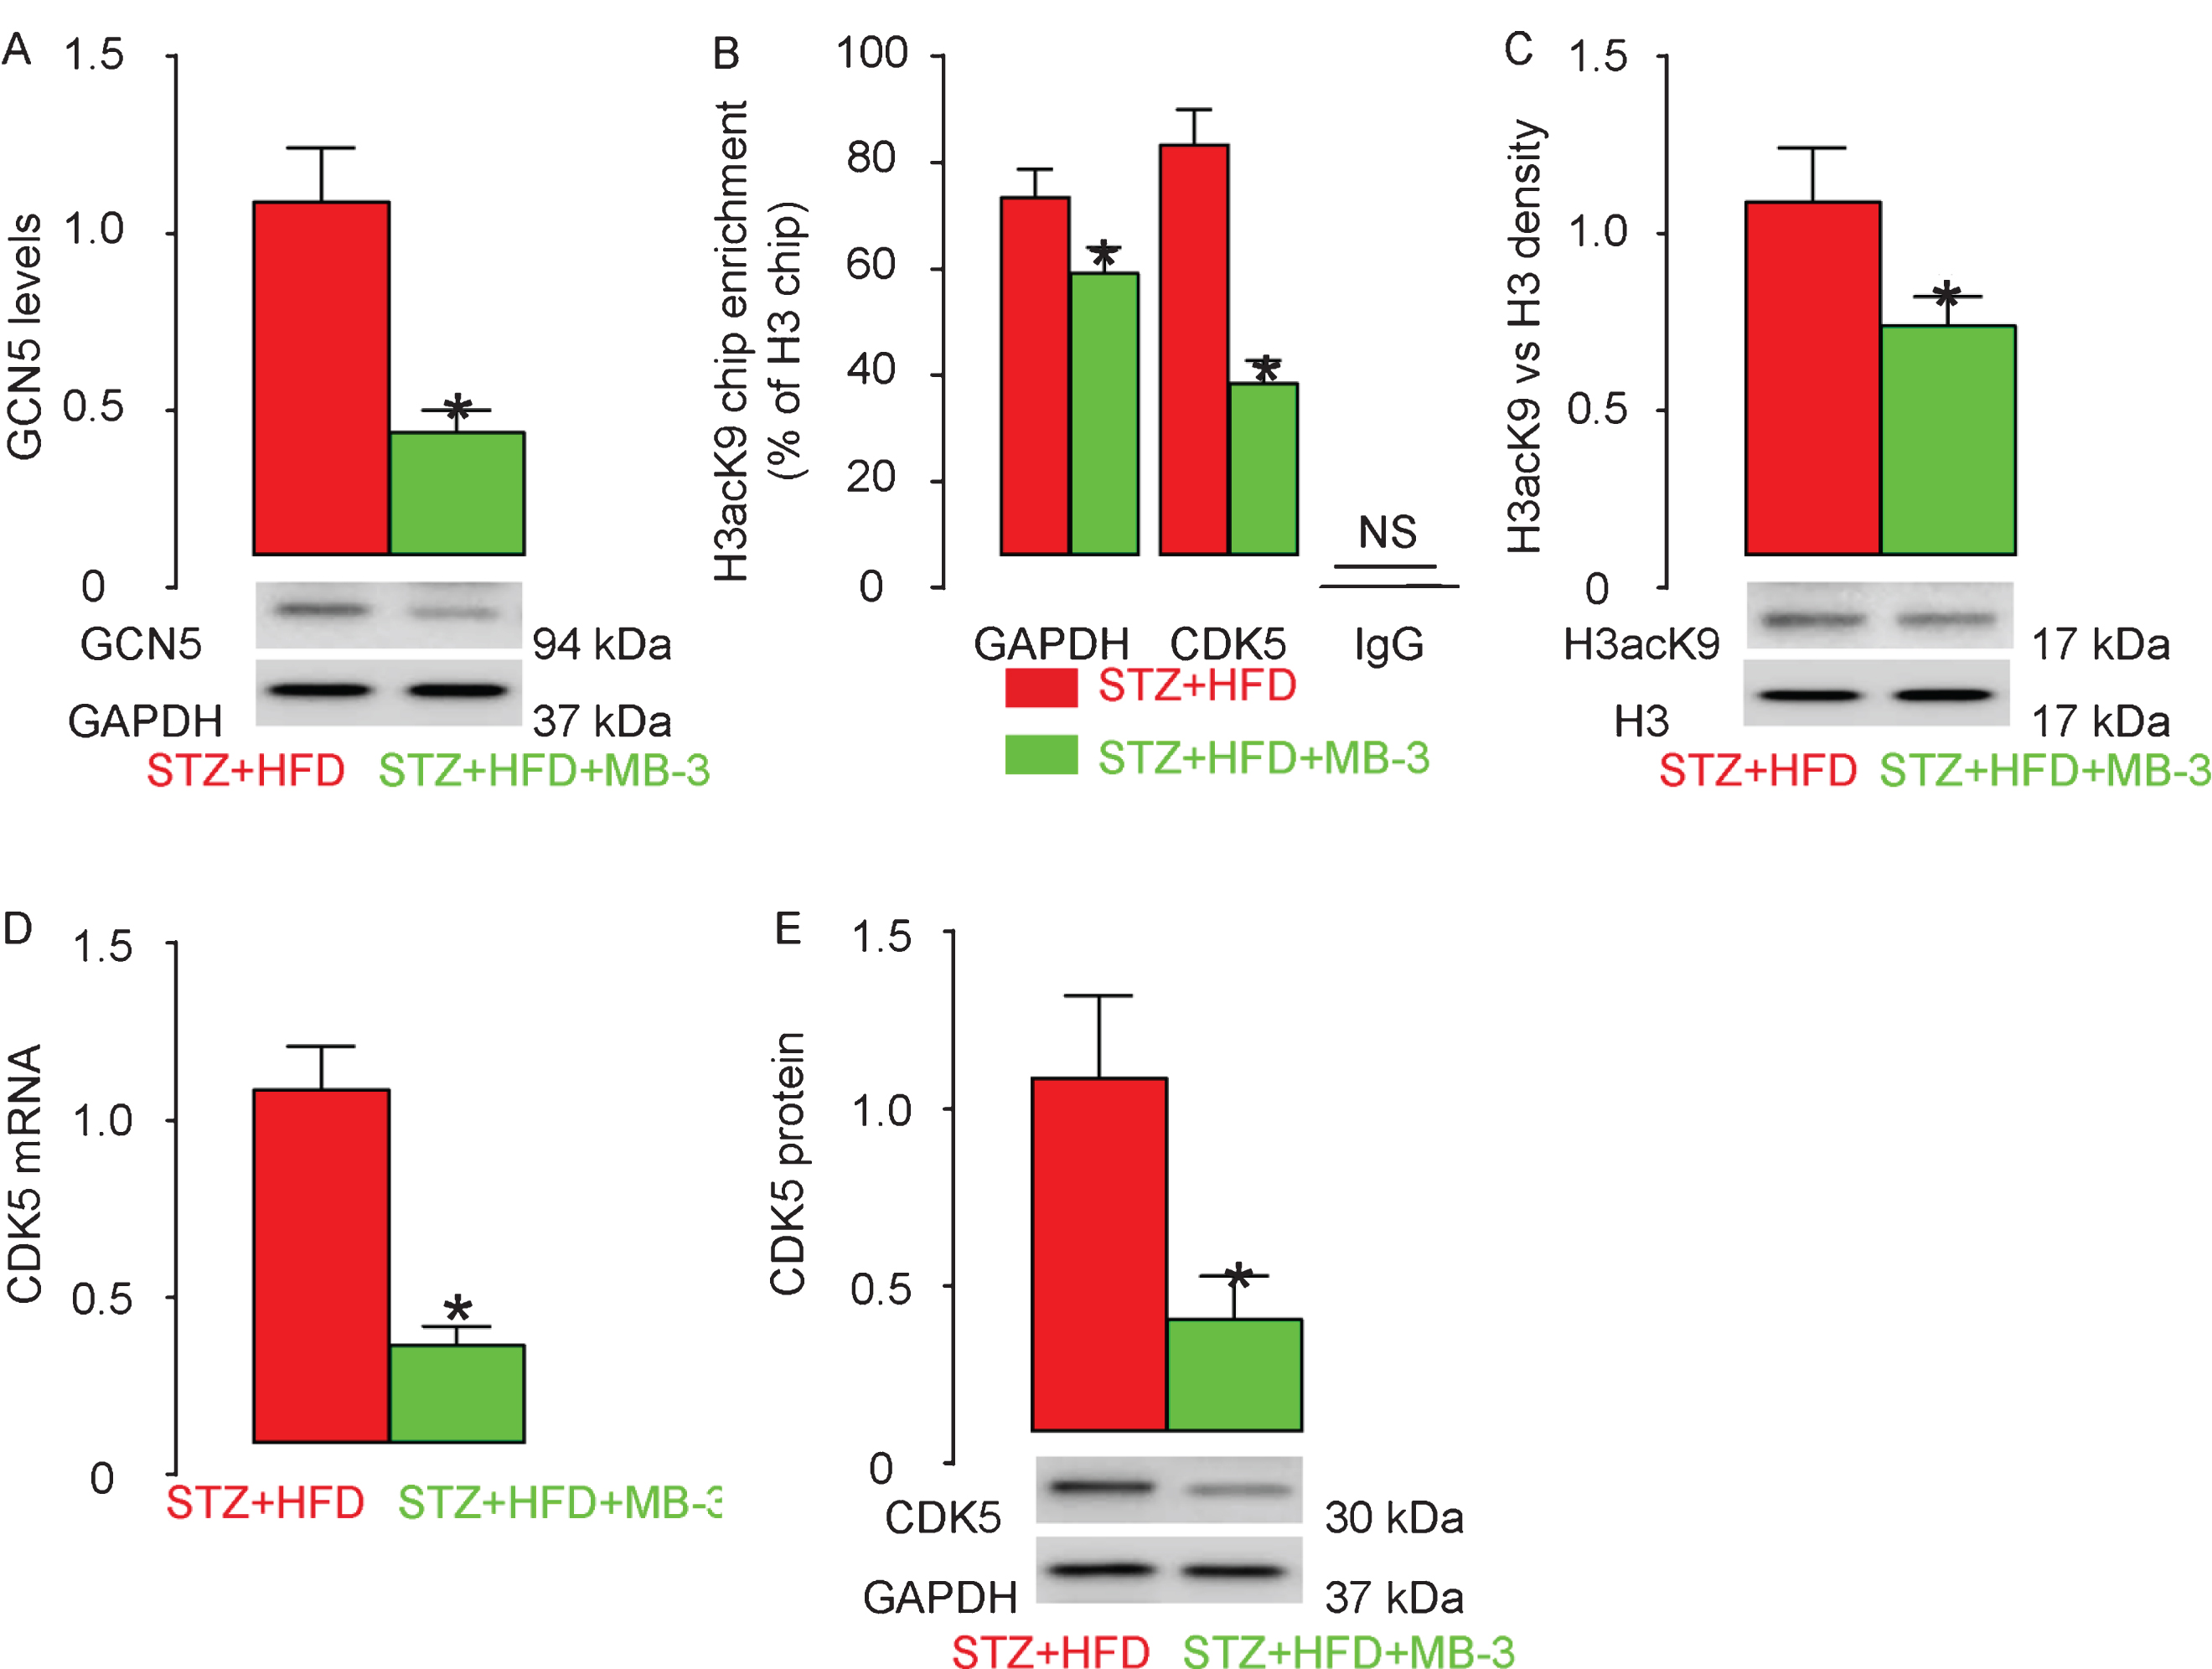
MB–3 attenuates increase in GCN5, H3K9 histone hyperacetylation on CDK5 promoter and CDK5 upregulation in STZ + HFD rats. A) Western blot for GCN5 levels. B) ChIP-q-PCR for H3acK9 levels, compared to H3 levels, on GAPDH promoter and CDK5 promoter. C) Western blot for H3acK9 levels, compared to H3 levels, in rat brain. The levels of CDK5 in the in the rat hippocampus, by RT-qPCR (D) and by western blot (E). *p < 0.05. NS, non-significant. N = 10.
MB-3 inhibits development of AD in STZ + HFD rats
Eight weeks after all treatments, the rats underwent Morris water-maze test and locomotor test. In Morris water-maze test for assessing spatial reference memory, the STZ + HFD + MB-3 rats showed no difference in the path length in the visible platform phase (Fig. 6A), but required significantly shorter path length in the hidden platform phase (Fig. 6B) and significantly decreased target quadrant occupancy (Fig. 6C), compared to STZ + HFD rats. In a locomotor test, the STZ + HFD + MB-3 rats required significantly shorter time for crossing a beam (Fig. 6D), compared to STZ + HFD rats. For assessing the pathological changes behind these behavioral disorders, we analyzed the p-Tau levels in the rat hippocampus in these rats at sacrifice. We detected significantly reduced p-Tau density in the hippocampus region in STZ + HFD + MB-3 rats, compared to STZ + HFD rats, shown by quantification (Fig. 6), and by representative images (Fig. 6F). Together, these data suggest that MB-3 inhibits development of AD in STZ + HFD rats.
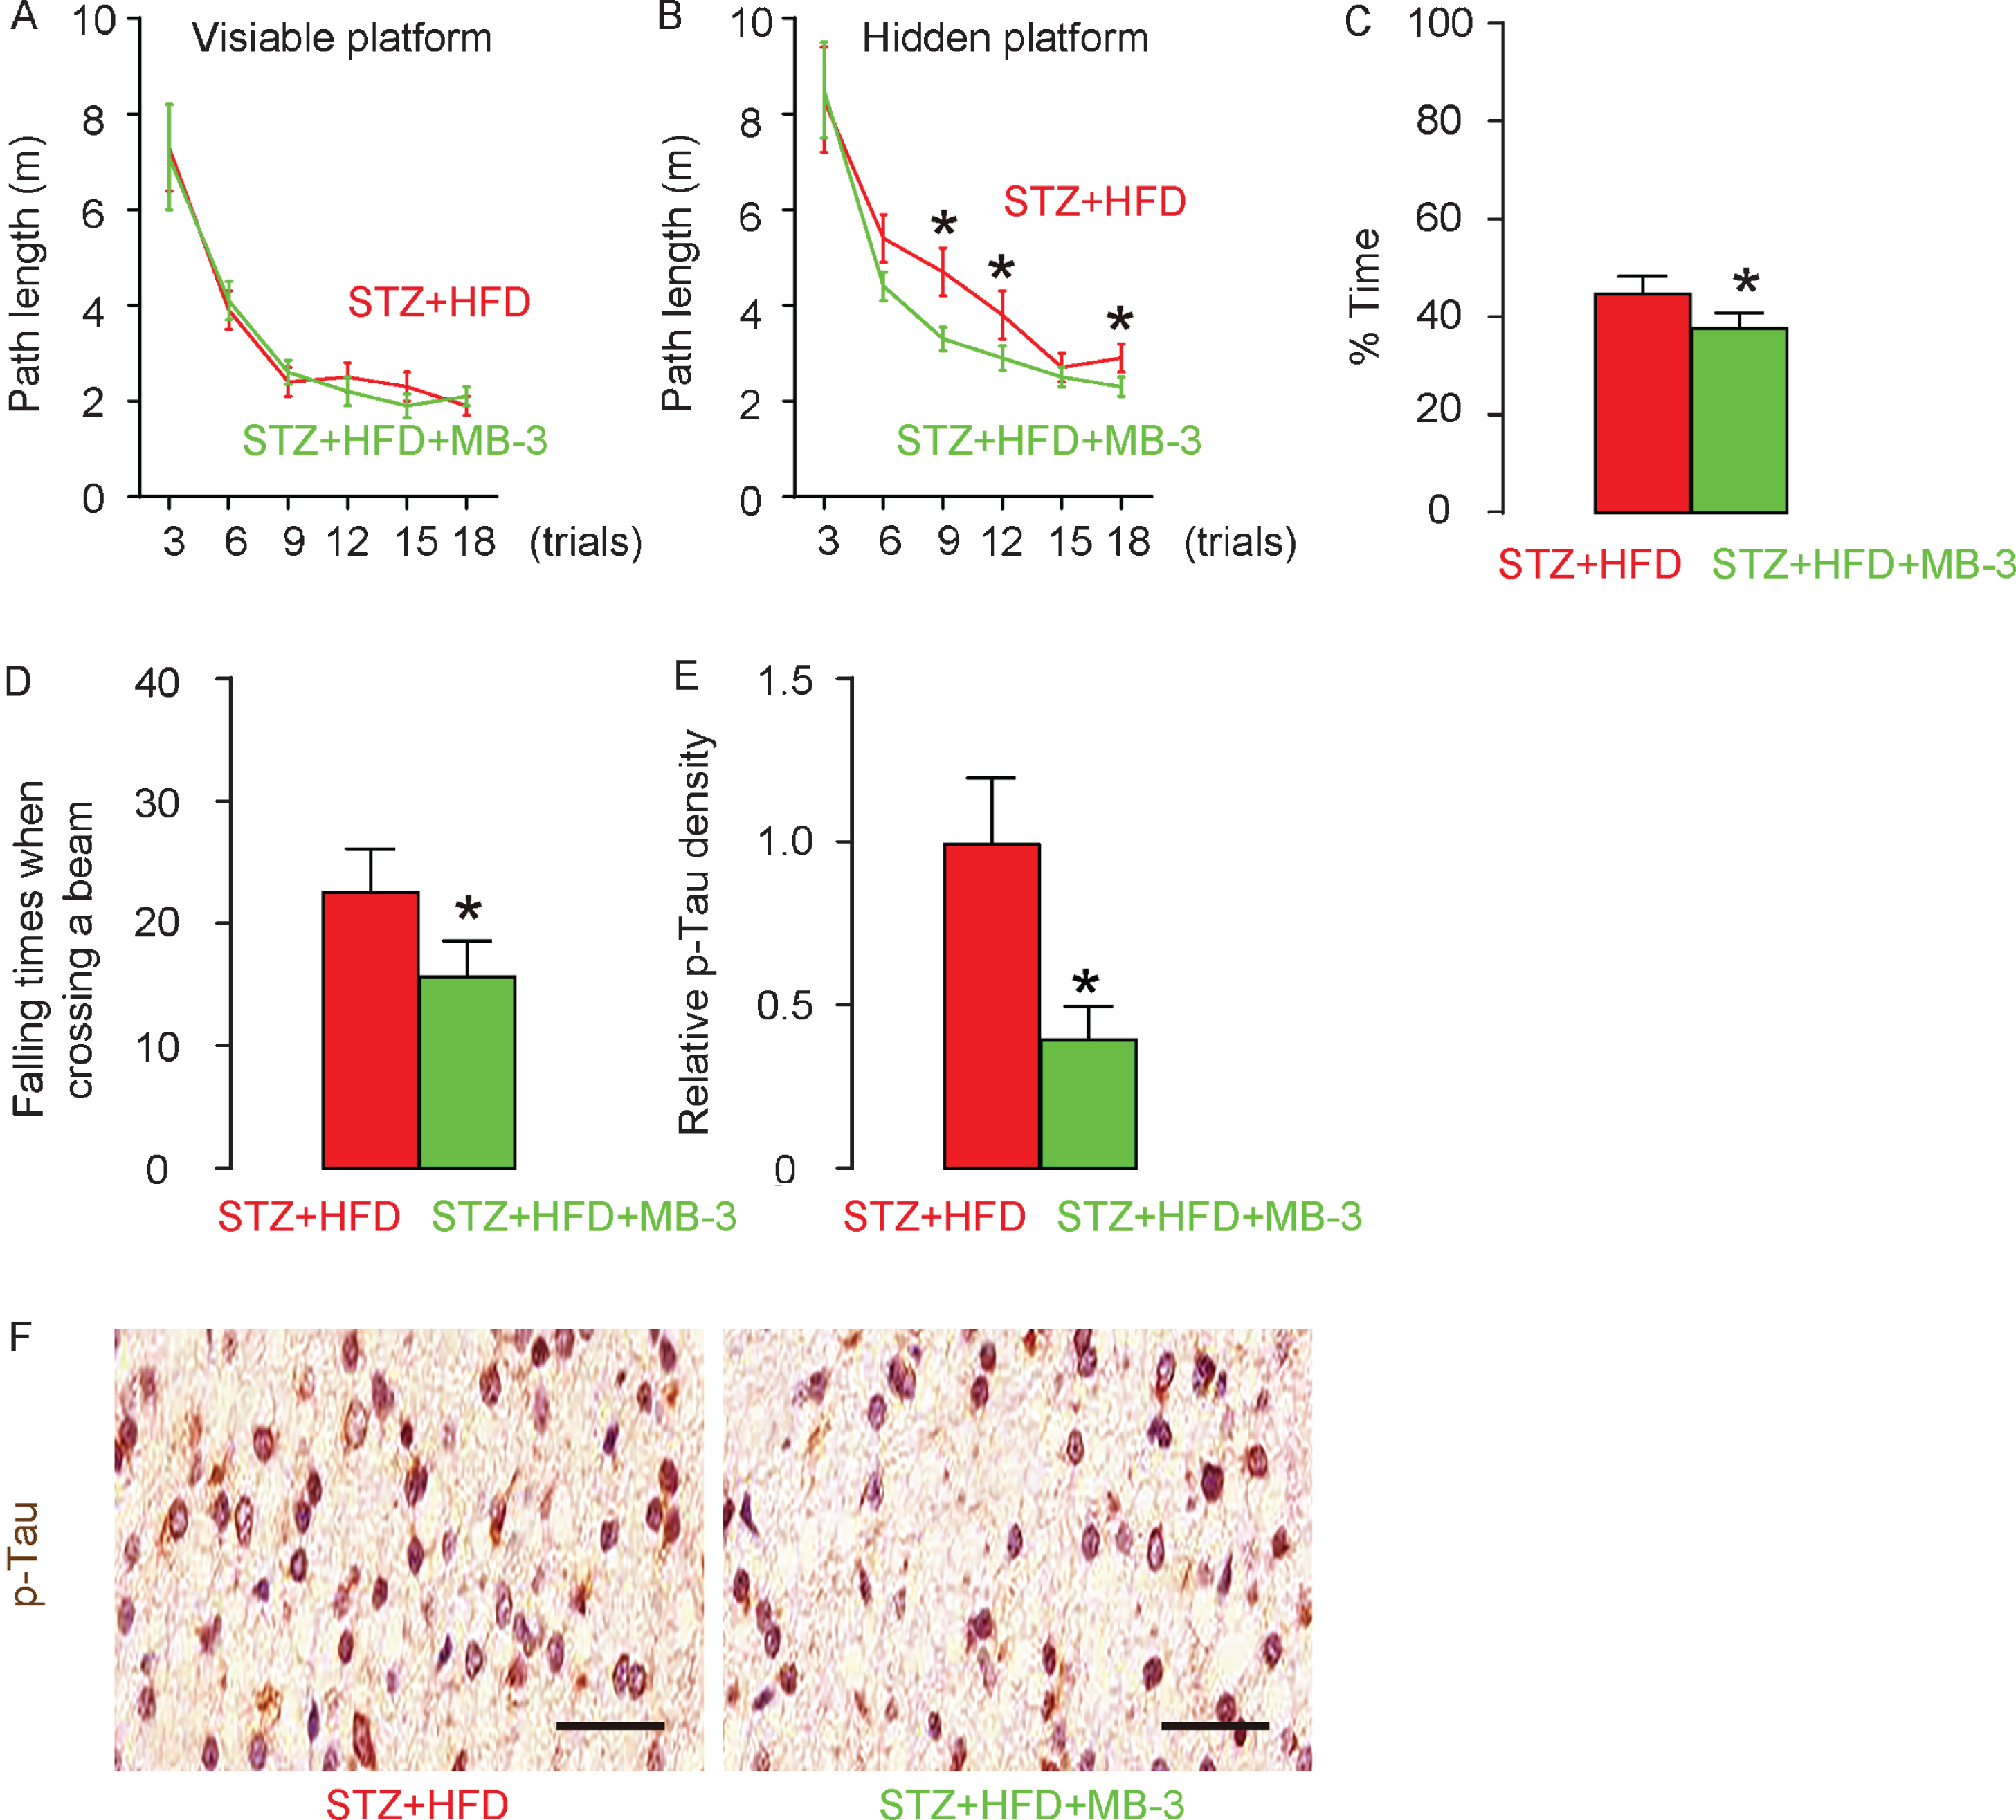
MB–3 inhibits development of AD in STZ + HFD rats. Eight weeks after all treatments, the rats underwent Morris water-maze and locomotor testing. Path length in the visible platform phase (A), in the hidden platform phase (B), and target quadrant occupancy (C) in the Morris water-maze test. D) Time for crossing a beam in a locomotor test. Phosphorylated tau (p-Tau) was stained in rat brain at 8 weeks, shown by relative p-Tau density (E) and by representative images (F). *p< 0.05. N = 10. Scale bars are 50μm.
DISCUSSION
Diabetes patients have higher chances of future development of AD, while the underlying mechanisms remain poorly understood [18–24]. We have previously shown that diabetes-associated hyperglycemia increased the CDK5 levels to promote development of AD [5]. Of note, we found that epigenetic modification of CDK5 may be responsible for the increases in the transcriptional activation of CDK5 [5]. CDK5 is the key regulator of tau hyperphosphorylation [6]. CDK5 in the brain is activated by its natural activator p35, which can be truncated into p25 and p10 [7, 25]. Compared to p35, p25 has a similar binding affinity to CDK5. However, the much longer half-life of p25 renders it a more potent CDK5 activator which causes hyperphosphorylation of tau [6, 8–10].
Here, diabetes increased both CDK5 mRNA and protein, suggesting that CDK5 was induced transcriptionally, rather than by post-transcriptional regulation through control of protein translation or degradation. Next, we found that the transcriptional activation of CDK5 was resulted from hyperacetylation of H3K9. H3K9 turns genes on when it is acetylated, but silences genes when it is methylated [26]. H3acK9 is a particularly important acetylation and highly correlated with active promoters [26]. HATs mediate acetylation and to date, several typical transcriptional cofactors with HAT activity have been discovered, including GCN5, P/CAF, ESA1, CBP/p300, and Rtt109 [27]. Among them, GCN5, which belongs to GCN5-related N-acetyltransferase (GNAT) superfamily, was confirmed as a requirement for histone acetylation modifications with great specificity for lysine 14 on H3 [28]. Since we detected alteration in acetylated H3K9 on CDK5 promoter, we hypothesized that GCN5 may be responsible for the changes in H3caK9, and then confirmed both by examining the levels of GCN5 and by applying a loss-of-function experiment of inhibiting GCN5 through MB-3. Finally, we showed that GCN5-mediated increases in histone acetylation of H3 were necessary for the diabetes-induced, CDK5-triggered development of neurodegeneration.
HFD itself does not induce hyperglycemia but only glucose intolerance as we have shown previously [5]. It also induces peripheral insulin resistance and compensated beta cell proliferation, resulting in increased serum insulin and beta cell mass [5]. Here, we established diabetes model by using a combination of low-dose STZ and HFD [29]. Low-dose STZ destroys a portion of beta cells but allows majority to survive based on our data. It seemed that the HFD-induced increases in beta cell proliferation failed to overcome the loss of beta cells by STZ, according to the quantification of beta cell mass. However, the increases in serum insulin should be resulting from increases in insulin secretion per cell due to HFD-induced insulin resistance [30].
To the best of our knowledge, this is the first study to demonstrative a pivotal role of GCN5 in the diabetes-induced AD through CDK5 promoter hyperacetylation. Future studies should examine the direct effects on GCN5 at both transcriptional level and translational level.
DISCLOSURE STATEMENT
Authors’ disclosures available online (https://www.j-alz.com/manuscript-disclosures/20-0163r1).