
Abstract
Background:
Affective neuropsychiatric symptoms (aNPS: depression, anxiety, apathy, irritability) have been linked to increased dementia risk. However, less is known whether this association is independent of Alzheimer’s disease (AD) pathophysiology.
Objective:
To investigate the contribution of early aNPS to dementia risk in cognitively normal (CN) older adults and mild cognitive impairment (MCI) patients, with and without AD biomarker abnormality.
Methods:
Participants included 763 community-dwelling, stroke-free older adults identified as CN and 617 with MCI at baseline, drawn from the Alzheimer’s Disease Neuroimaging Initiative (ADNI) database. Baseline assessments included a neuropsychological battery, the Neuropsychiatric Inventory (NPI), and apolipoprotein E ɛ4 (ApoE4) genotyping. A participant subset completed cerebrospinal fluid (CSF) AD biomarker assessment. Time to progression to dementia was measured based on months at follow-up when an individual was diagnosed with dementia, over the follow-up period of 48 months.
Results:
Latent class analysis identified 3 subgroups of older adults in CN and MCI, indicated by the baseline profiles of neuropsychiatric symptoms (NPS). Subgroups with higher aNPS were at increased risk of progression to dementia in both CN (HR = 3.65, 95% CI [1.80, 7.40]) and MCI (HR = 1.52, 95% CI [1.16, 2.00]; HR = 1.86 [1.05, 3.30]) groups, adjusting for age, sex, global cognition, and ApoE4, compared with their counterparts with minimal NPS. There was no difference between higher aNPS and minimal NPS subgroups in their CSF AD biomarker profiles.
Conclusion:
Findings suggest that aNPS may represent a neurobiological vulnerability that uniquely contribute to the dementia risk, independent of AD biomarker profiles.
INTRODUCTION
Growing evidence suggests that neuropsychiatric symptoms (NPS) might be an aspect of early presenting problems in Alzheimer’s disease (AD), possibly emerging even before any notable cognitive impairment [1]. In particular, symptoms closely related to depression we refer to as affective NPS (aNPS: depression, apathy, anxiety, and irritability) have been associated with faster progression to AD in older adults with mild cognitive impairment (MCI) [2–12]. However, studies also have reported an inverse relationship between aNPS and the risk of progression to AD in MCI (e.g., [13]). Literature reviews and meta-analyses conducted several years ago examined the association between aNPS and the risk of progression to dementia in MCI [14–16]. Findings indicated that depression had a positive relationship with the risk of progression to AD [15, 16], although no such association was found particularly in amnestic MCI and in clinical studies [14]. Apathy [14, 16] and anxiety [16] did not show any effect on the progression to dementia. The results highlight the need for further evidence, as these non-significant findings were based on a small number of studies (e.g., 5 studies for apathy, 3 for anxiety). Researchers have also demonstrated that aNPS may indicate a higher likelihood of progression to MCI in older adults with normal cognition [17–19]. Leoutsakos et al. [19] have classified cognitively normal older adults from the National Alzheimer’s Coordinating Center (NACC) database, using latent class analysis (LCA) of NPS. They have identified 4 subgroups of older adults with distinct profiles of NPS: 1) asymptomatic, 2) irritable, 3) depressed, and 4) mixed (depression, apathy, irritability, and nighttime behavior). Each of the subgroups with elevated NPS showed a greater risk of progression to MCI or dementia, compared with the asymptomatic subgroup.
Researchers have posited several hypotheses for mechanisms underlying the association between NPS and AD that are direct, indirect, or interactive in nature [20]. Specifically, hypotheses for direct relationship include that 1) NPS lead to the development of AD through their detrimental effects on the brain (e.g., activation of neuroendocrine system) or 2) AD pathology disrupts neural substrates for perception, emotion, and behavior, which clinically manifest as NPS. Hypotheses for indirect relationship include that 3) a third factor, such as cerebrovascular disease or white matter abnormalities, contributes to the development of both AD and NPS. Finally, hypotheses for interactive relationship predicts that NPS may have a synergistic interaction with a biological factor (e.g., carrier of AD susceptibility genes), which then leads to the development of AD. As noted by these researchers, there may be different mechanisms at play, or these mechanisms may transpire simultaneously [20].
The National Institute on Aging - Alzheimer’s Association (NIA-AA) put forth recommendations for using AD biomarkers to facilitate research advances across AD continuum, including “preclinical AD” (abnormal Aβ and tau without cognitive impairment) and “prodromal AD” (abnormal Aβ and tau with MCI) [21, 22]. The research recommendations also indicated a need for further investigations into NPS as part of early clinical changes and their link to pathological processes. Combining aNPS and AD biomarker profile indexed by cerebral amyloid burden on positron emission tomography (PET), studies have shown that Aβ-positive individuals with aNPS have an elevated risk of cognitive decline and progression to dementia, compared with those without aNPS [23, 24].
Cross-sectional investigations have suggested that aNPS may be variably related to AD biomarkers. In MCI, one study of cerebrospinal fluid (CSF) AD biomarkers reported a significant relationship between abnormal Aβ and anxiety, irritability, and agitation, while no association was found between abnormal biomarkers and depression or apathy [25]. In cognitively normal older adults, another study has shown that symptoms of dysphoric mood, apathy, and anhedonia (but not anxiety or poor concentration) were associated with AD-related structural and functional changes in the brain, and this association was not moderated by cerebral amyloid burden on PET [26]. Including evidence from patients with dementia, two recent studies summarized the literature on NPS and AD biomarkers in MCI and AD. A systematic review of NPS and CSF AD biomarkers revealed that findings are mixed for nearly all NPS, as some studies reported positive association while others did not find any relationship [27]. Of note, only depression was linked to some evidence for lower levels of CSF AD biomarkers, and agitation was most consistently associated with elevated levels of CSF AD biomarkers. Another study synthesized evidence for the association between NPS and AD biomarkers (Aβ, tau, and neurodegeneration), indexed by CSF concentrations, PET, and magnetic resonance imaging (MRI) [28]. The authors found largely divergent patterns, to some extent depending on measurement methods (e.g., apathy was associated with cerebral amyloid burden on PET but not with amyloid in CSF). Of note, depression and nighttime behavior were not associated with any of the AD biomarkers.
Incorporating CSF biomarker data in investigating the association between aNPS and progression to dementia may help describe aNPS that likely reflect AD-related changes occurring in the brain. The current study examined non-demented older adults in the Alzheimer’s Disease Neuroimaging Initiative (ADNI) [29]. In the ADNI MCI cohort, researchers have identified a group of older adults who performed within normal limits on cognitive tests, using an empirical clustering method. Compared with others in the MCI cohort, this group of older adults had significantly fewer individuals who carry ApoE4 or who progressed to dementia. Further, they did not differ from normal controls in their CSF AD biomarker profiles [30]. Given this caveat of “false-positive” diagnostic errors in the ADNI MCI, the current study adopted the method used in Edmonds et al. [30] to refine diagnostic groups in the ADNI non-demented older adults.
It is hypothesized that older adults with higher prevalence of NPS would have an elevated risk of progression to dementia. It is also hypothesized that this association would be independent of their CSF AD biomarker profiles, considering the possibility that NPS (aNPS in particular) might add to the disease burden conferring the risk of progression to dementia, differing from the AD pathophysiology itself. Although the current study will not provide any direct evidence for the mechanisms outlined earlier, findings may provide some insight into possible indirect pathways, specifically hypothesis 3). Moreover, the current study would make significant contributions to Leoutsakos et al.’s previous findings based on behavioral data [20], by considering the potential effects of biological factors, such as ApoE4 and AD biomarkers.
MATERIALS AND METHODS
Participants
Data used in the preparation of this article were obtained from the ADNI database (http://adni.loni.usc.edu). The ADNI was launched in 2003 as a public-private partnership, led by Principal Investigator Michael W. Weiner, MD. The primary goal of ADNI has been to test whether serial MRI, PET, other biological markers, and clinical and neuropsychological assessment can be combined to measure the progression of MCI and early AD. For up-to-date information, see http://www.adni-info.org.
Participants were drawn from a sample of 1,394 individuals enrolled in the ADNI [29] between ages 55 and 90 with normal cognition (ADNI CN) or MCI (ADNI MCI) at baseline. In ADNI, cognitively normal participants included individuals with Mini-Mental State Examination (MMSE) score ≥24 and CDR score of 0, who exhibited no sign of major depressive disorder (MDD), MCI, or dementia. Diagnostic criteria for MCI included: 1) memory complaints by participant, corroborated by informant reports; 2) MMSE score ≥24; 3) overall Clinical Dementia Rating (CDR) Scale score of 0.5; and 4) memory impairment evidenced by scoring 0.5–1.5 standard deviation below the normative means on neuropsychological tests of memory. Dementia diagnosis was made at follow-up if participant had MMSE score 20–26 and CDR score of 0.5 or 1.0, and satisfied the NINCDS-ADRDA criteria for probable AD. Exclusion criteria included the following: 1) presence of MDD or 15-item Geriatric Depression Scale score ≥6; 2) Modified Hachinski Ischemia score ≥5; 3) significant neurological or psychiatric illness; 4) use of antidepressant drugs with anticholinergic side effects; and 5) high dose of neurological or psychotropic medications.
Procedures
At baseline and follow-up, all participants underwent standardized physical and neurological examinations, a neuropsychological battery, and blood tests, and their informant participated in interviews. A subset of participants consented to a lumbar puncture procedure for CSF sample collection. Data were downloaded from the ADNI website (http://adni.loni.usc.edu).
Measures
Neuropsychological assessment
Neurocognitive tests included the following domains and measures: Global cognition (MMSE), verbal memory [Rey Auditory Verbal Learning Test (AVLT) Long Delay and Recognition], attention and psychomotor speed [Trail Making Test A (Trails A)], executive control [Trail Making Test B (Trails B)], and language [Boston Naming Test (BNT) and Animals].
Neuropsychiatric assessment
NPS were assessed by the Neuropsychiatric Inventory (NPI) or the NPI Questionnaire (NPI-Q). The NPI is an informant-based instrument, measuring the presence (0 = absent, 1 = present), frequency (1 = occasionally to 4 = very frequently), and severity (1 = mild to 3 = severe) of NPS (delusions, hallucinations, agitation, depression, anxiety, euphoria, apathy, disinhibition, irritability, nighttime behavior, appetite) over the month prior to the evaluation [31]. Clinical significance of each NPS domain is indicated when frequency×severity score is greater than 4. The NPI-Q is adapted from the standard NPI and typically used as a brief screening tool, measuring the presence and severity of NPS [32]. The NPI-Q does not provide information to determine clinical significance. Thus, we used the presence versus absence of NPS as our dichotomous indicator instead of clinically significant versus non-significant symptoms.
CSF AD biomarkers
Of the 1,394 individuals, CSF biomarker data are available for 986 individuals. The ADNI used the fully automated and highly standardized Roche Elecsys immunoassay to provide AD biomarker measurements. The ADNI Biomarker Core published AD-positive threshold values for Aβ1–42 (Aβ< 980 pg/ml), phosphorylated tau181 (p-tau≥21.8 pg/ml), and total tau (t-tau≥245 pg/ml), based on ROC analysis with florbetapir PET assessments as the criterion measure (see “Biomarker Analysis” section in http://adni.loni.usc.edu/methods/). Florbetapir PET is an in vivo molecular imaging technique to capture Aβ aggregation in the brain, shown to have high sensitivity and specificity for pathologically confirmed AD cases [33].
Statistical analyses
Analyses were conducted using Mplus 8.4 (Muthén & Muthén) and SPSS 24 (IBM Statistics). Diagnostic groups were redefined empirically, following the method detailed in Edmonds et al. [30]. Raw neuropsychological scores were converted into age- and education-adjusted z-scores based on regression coefficients derived from a subset of individuals (those with normal cognition at baseline, confirmed at least at 1-year follow-up, and who never had a diagnosis of MCI or AD for the duration of their participation) in the ADNI CN cohort. A hierarchical cluster analysis using Ward’s method for clustering was then conducted on the z-scores to identify four subgroups (“cluster-derived normal controls” and three MCI subtypes) in the ADNI MCI cohort based on the previous findings [30, 34]. In the current study, CN group consisted of ADNI CN and cluster-derived normal controls. MCI group was defined by collapsing three cluster-derived MCI subtypes, as the subtype information is irrelevant to the focus of the current study.
LCA was conducted to identify subgroups (i.e., latent classes based on NPS indicators) of individuals with distinct profiles of NPS, within each of the CN and MCI groups. For every model, 12 NPI domains were entered as dichotomous indicators (1 = presence or 0 = absence). LCA posits that individual’s observed responses are determined by a combination of the individual’s latent class and random error. Each individual has a probability of membership in each latent class, allowing for interpretation and labeling of the latent classes [35]. Model fit indices were evaluated to select the optimal number of classes that best captures the data. Each individual in the sample was assigned to one of the classes based on their most likely class membership.
Independent samples t-test and chi-square tests were conducted to describe baseline characteristics of CN and MCI, with regard to demographic information, ApoE4 carrier status (carriers have one or two ɛ4 alleles), cognitive performance, prevalence of NPS, and CSF AD biomarker profile. One-way AVOVA and chi-square tests with corrections for multiple comparisons were conducted to compare assigned classes within CN and MCI on their baseline characteristics. Cox proportional hazards regression models tested the difference in time to progression to dementia across classes. Time to progression to dementia was determined based on months at follow-up when an individual was diagnosed with AD, over the follow-up period of 48 months. Models were adjusted for age, sex, ApoE4 carrier status, and MMSE.
RESULTS
Of the 1,394 individuals who had baseline assessment in the ADNI, 417 were determined to have normal cognition (ADNI CN) and 977 were MCI (ADNI MCI) per the ADNI diagnostic criteria. Fourteen of the 977 ADNI MCI had missing neuropsychological data and were excluded from hierarchical cluster analysis due to list-wise deletion (resulting in n = 963 ADNI MCI). Within the final sample of 963 ADNI MCI, cluster analysis identified 346 individuals who performed within normal limits across all neuropsychological measures (Cluster CN). This is the group of individuals Edmonds et al. [30] identified in the ADNI MCI cohort, who evidenced cognitive, genetic, AD biomarker, and dementia risk profiles similar to the ADNI CN group and distinct from the rest of the ADNI MCI cohort. The current study sample comprised 1,380 individuals, including 763 participants in CN (ADNI CN plus Cluster CN) and 617 participants in MCI (Fig. 1).
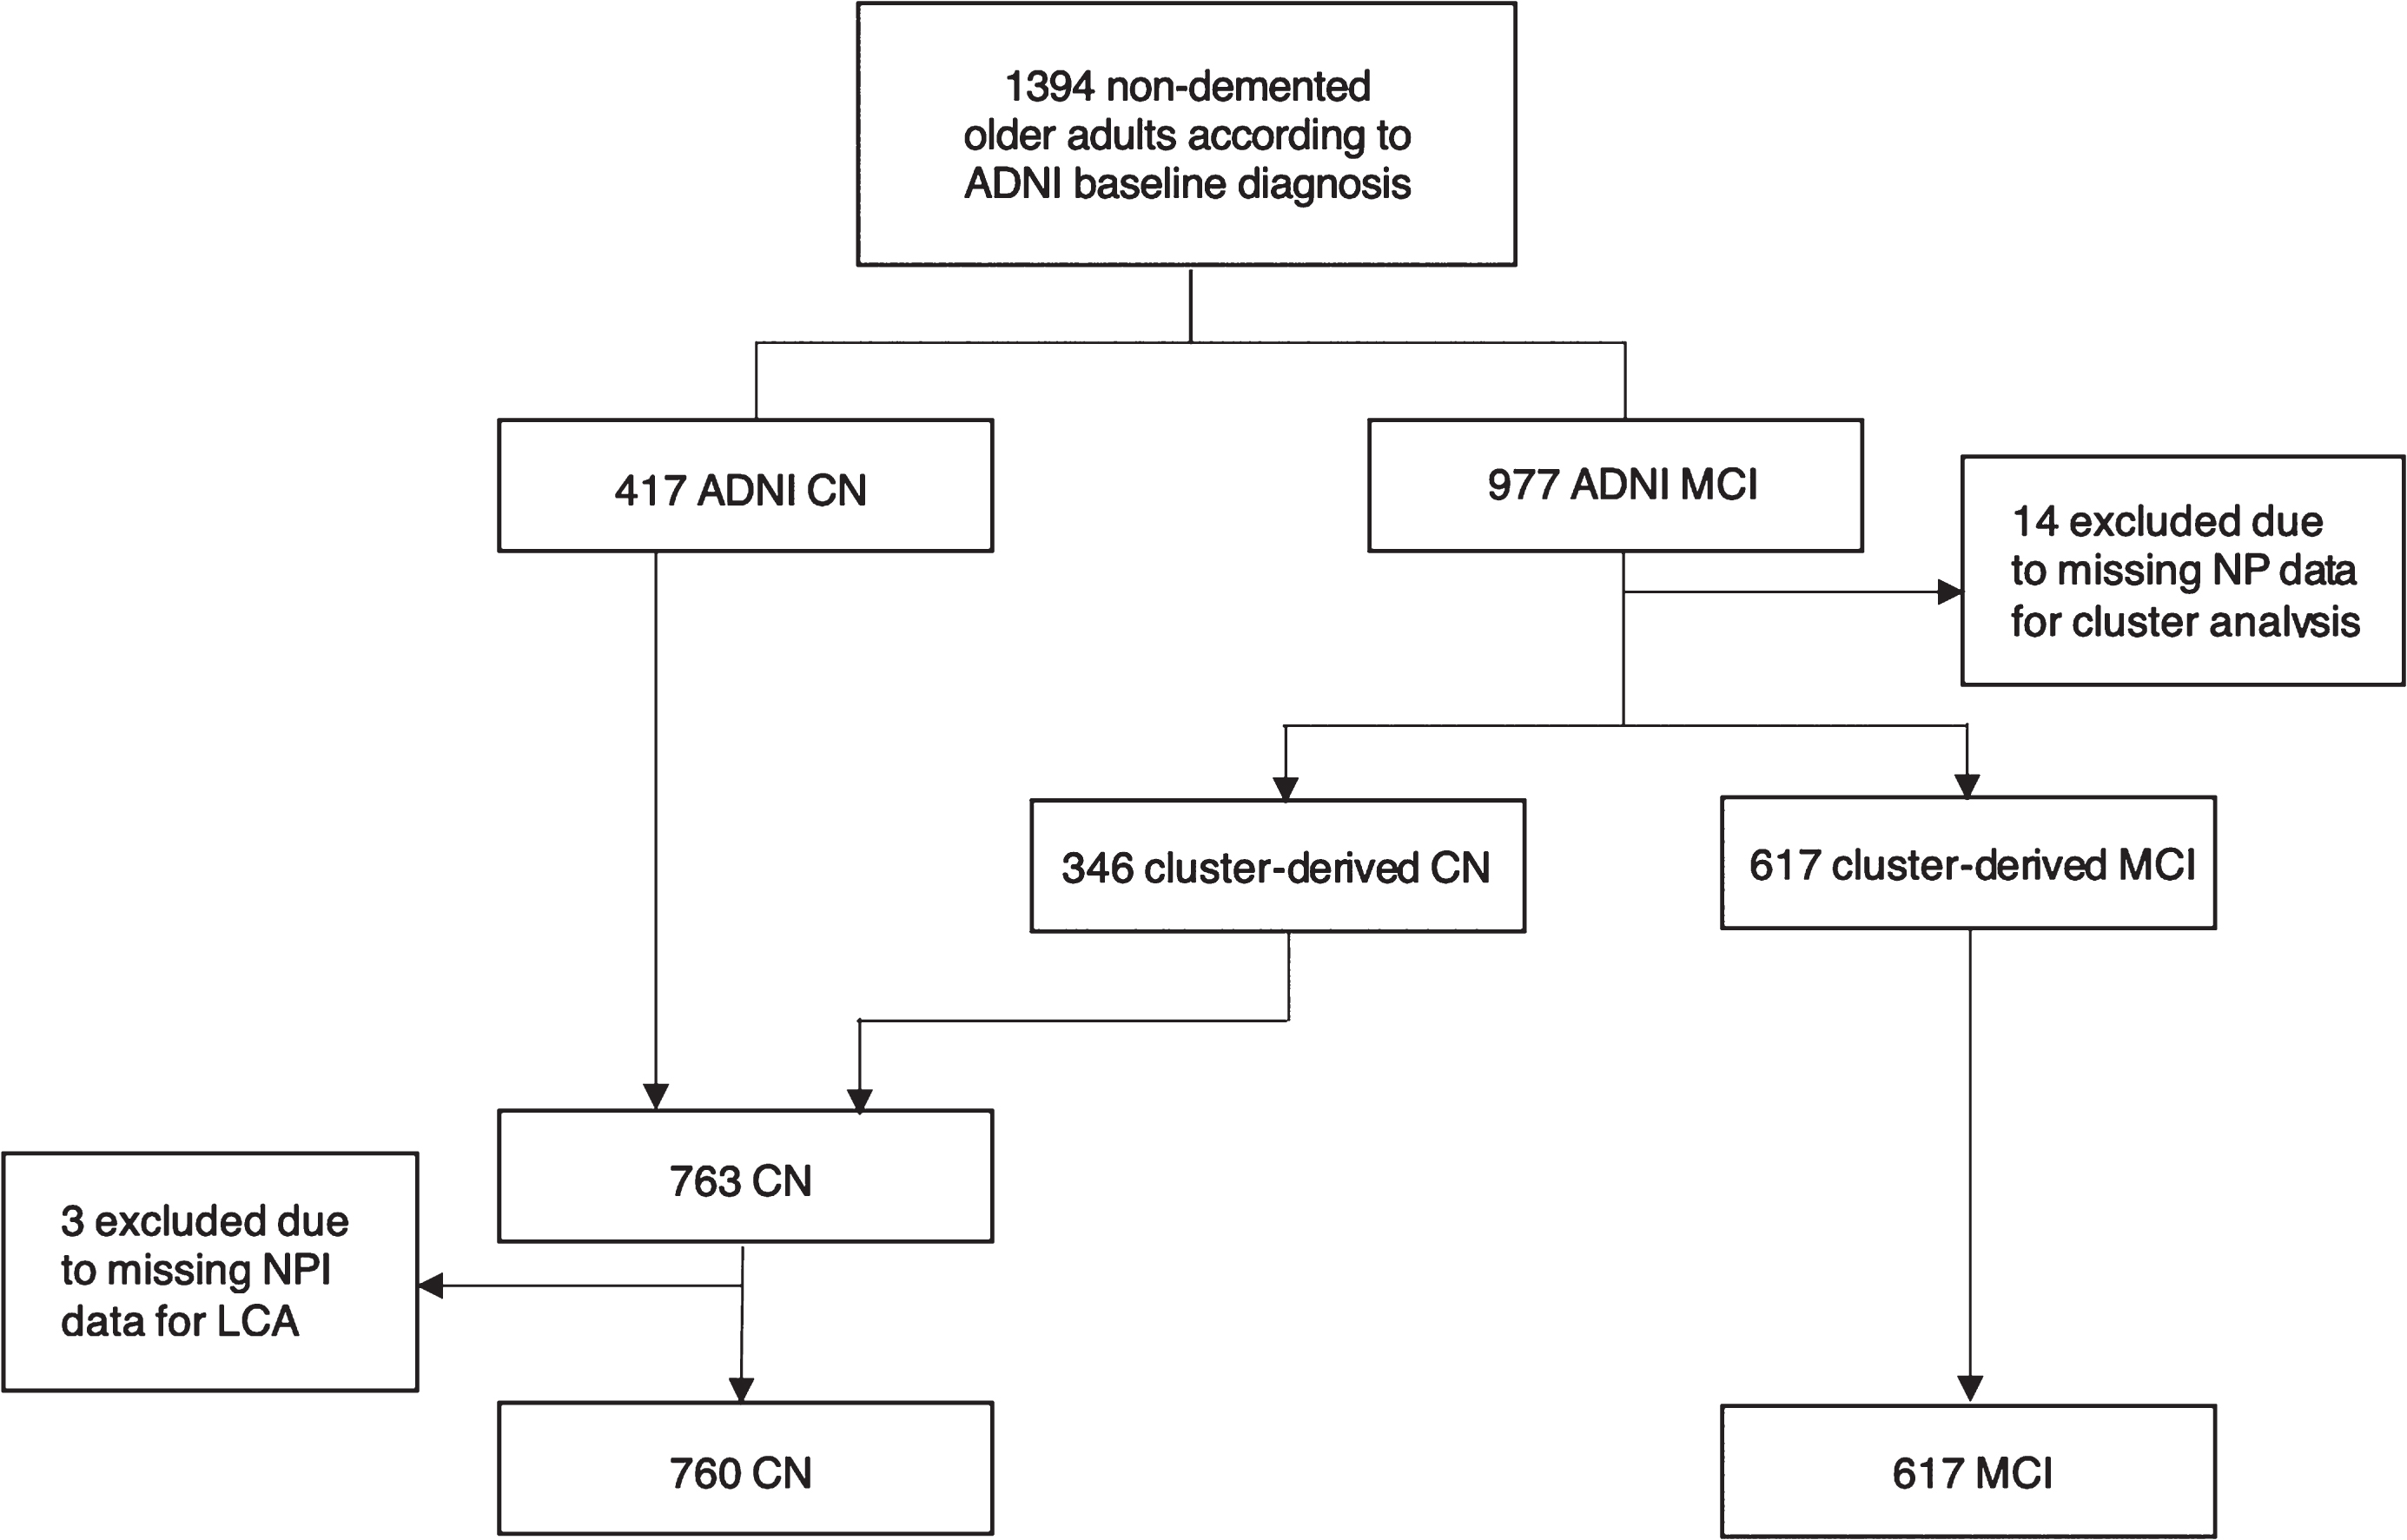
Flow chart of the current study sample. CN, cognitively normal; MCI, mild cognitive impairment; NP, neuropsychological assessment; NPI, neuropsychiatric inventory; LCA, latent class analysis
Compared with CN, participants with MCI were more likely to be men, have less educational attainment, be ApoE4 carriers, and obtain lower scores across all cognitive domains. Overall, individuals with MCI were more likely to experience NPS. There was no difference between CN and MCI in the frequencies of hallucinations and nighttime behavior. A total of 974 individuals (543 CN and 431 MCI) in the sample had CSF AD biomarker data. Compared with CN, MCI had a significantly higher proportion of individuals with abnormal AD biomarkers.
Profiles of neuropsychiatric symptoms
For CN, three participants had NPI data completely missing and were excluded from LCA analysis. Consequently, 760 participants in CN and 617 participants in MCI had class assignment based on their most likely class membership (Fig. 1). Models with 2, 3, and 4 classes were tested, and the best-fitting model was selected based on the bootstrapped likelihood ratio test (BLRT), which compares k and k–1 classes using –2×log likelihood (–2LL) difference for model fit. For both CN and MCI, a 3-class model fit significantly better than a 2-class model (CN: –2LL difference = 48.52, p < 0.0001; MCI: –2LL difference = 40.87, p = 0.02). However, a 4-class model did not fit better than a 3-class model (CN: –2LL difference = 22.32, p = 0.17; MCI: –2LL difference = 29.79, p = 0.15). Thus, a 3-class model was selected for both CN and MCI.
Figure 2A shows estimated probability of each NPI domain given the class membership within CN. “No NPS” subgroup would include the vast majority (80.8%) of the sample, which had very low probabilities of all NPI domains. “Depressed/Anxious” subgroup would include 13.7% of the sample, which had high probabilities of depression (0.48), anxiety (0.42), and nighttime behavior (0.41). “Agitated/Irritable” subgroup would include 5.4% of the sample, which had increased probabilities of multiple NPI domains, with agitation (1.00) and irritability (0.89) as the most likely symptoms.
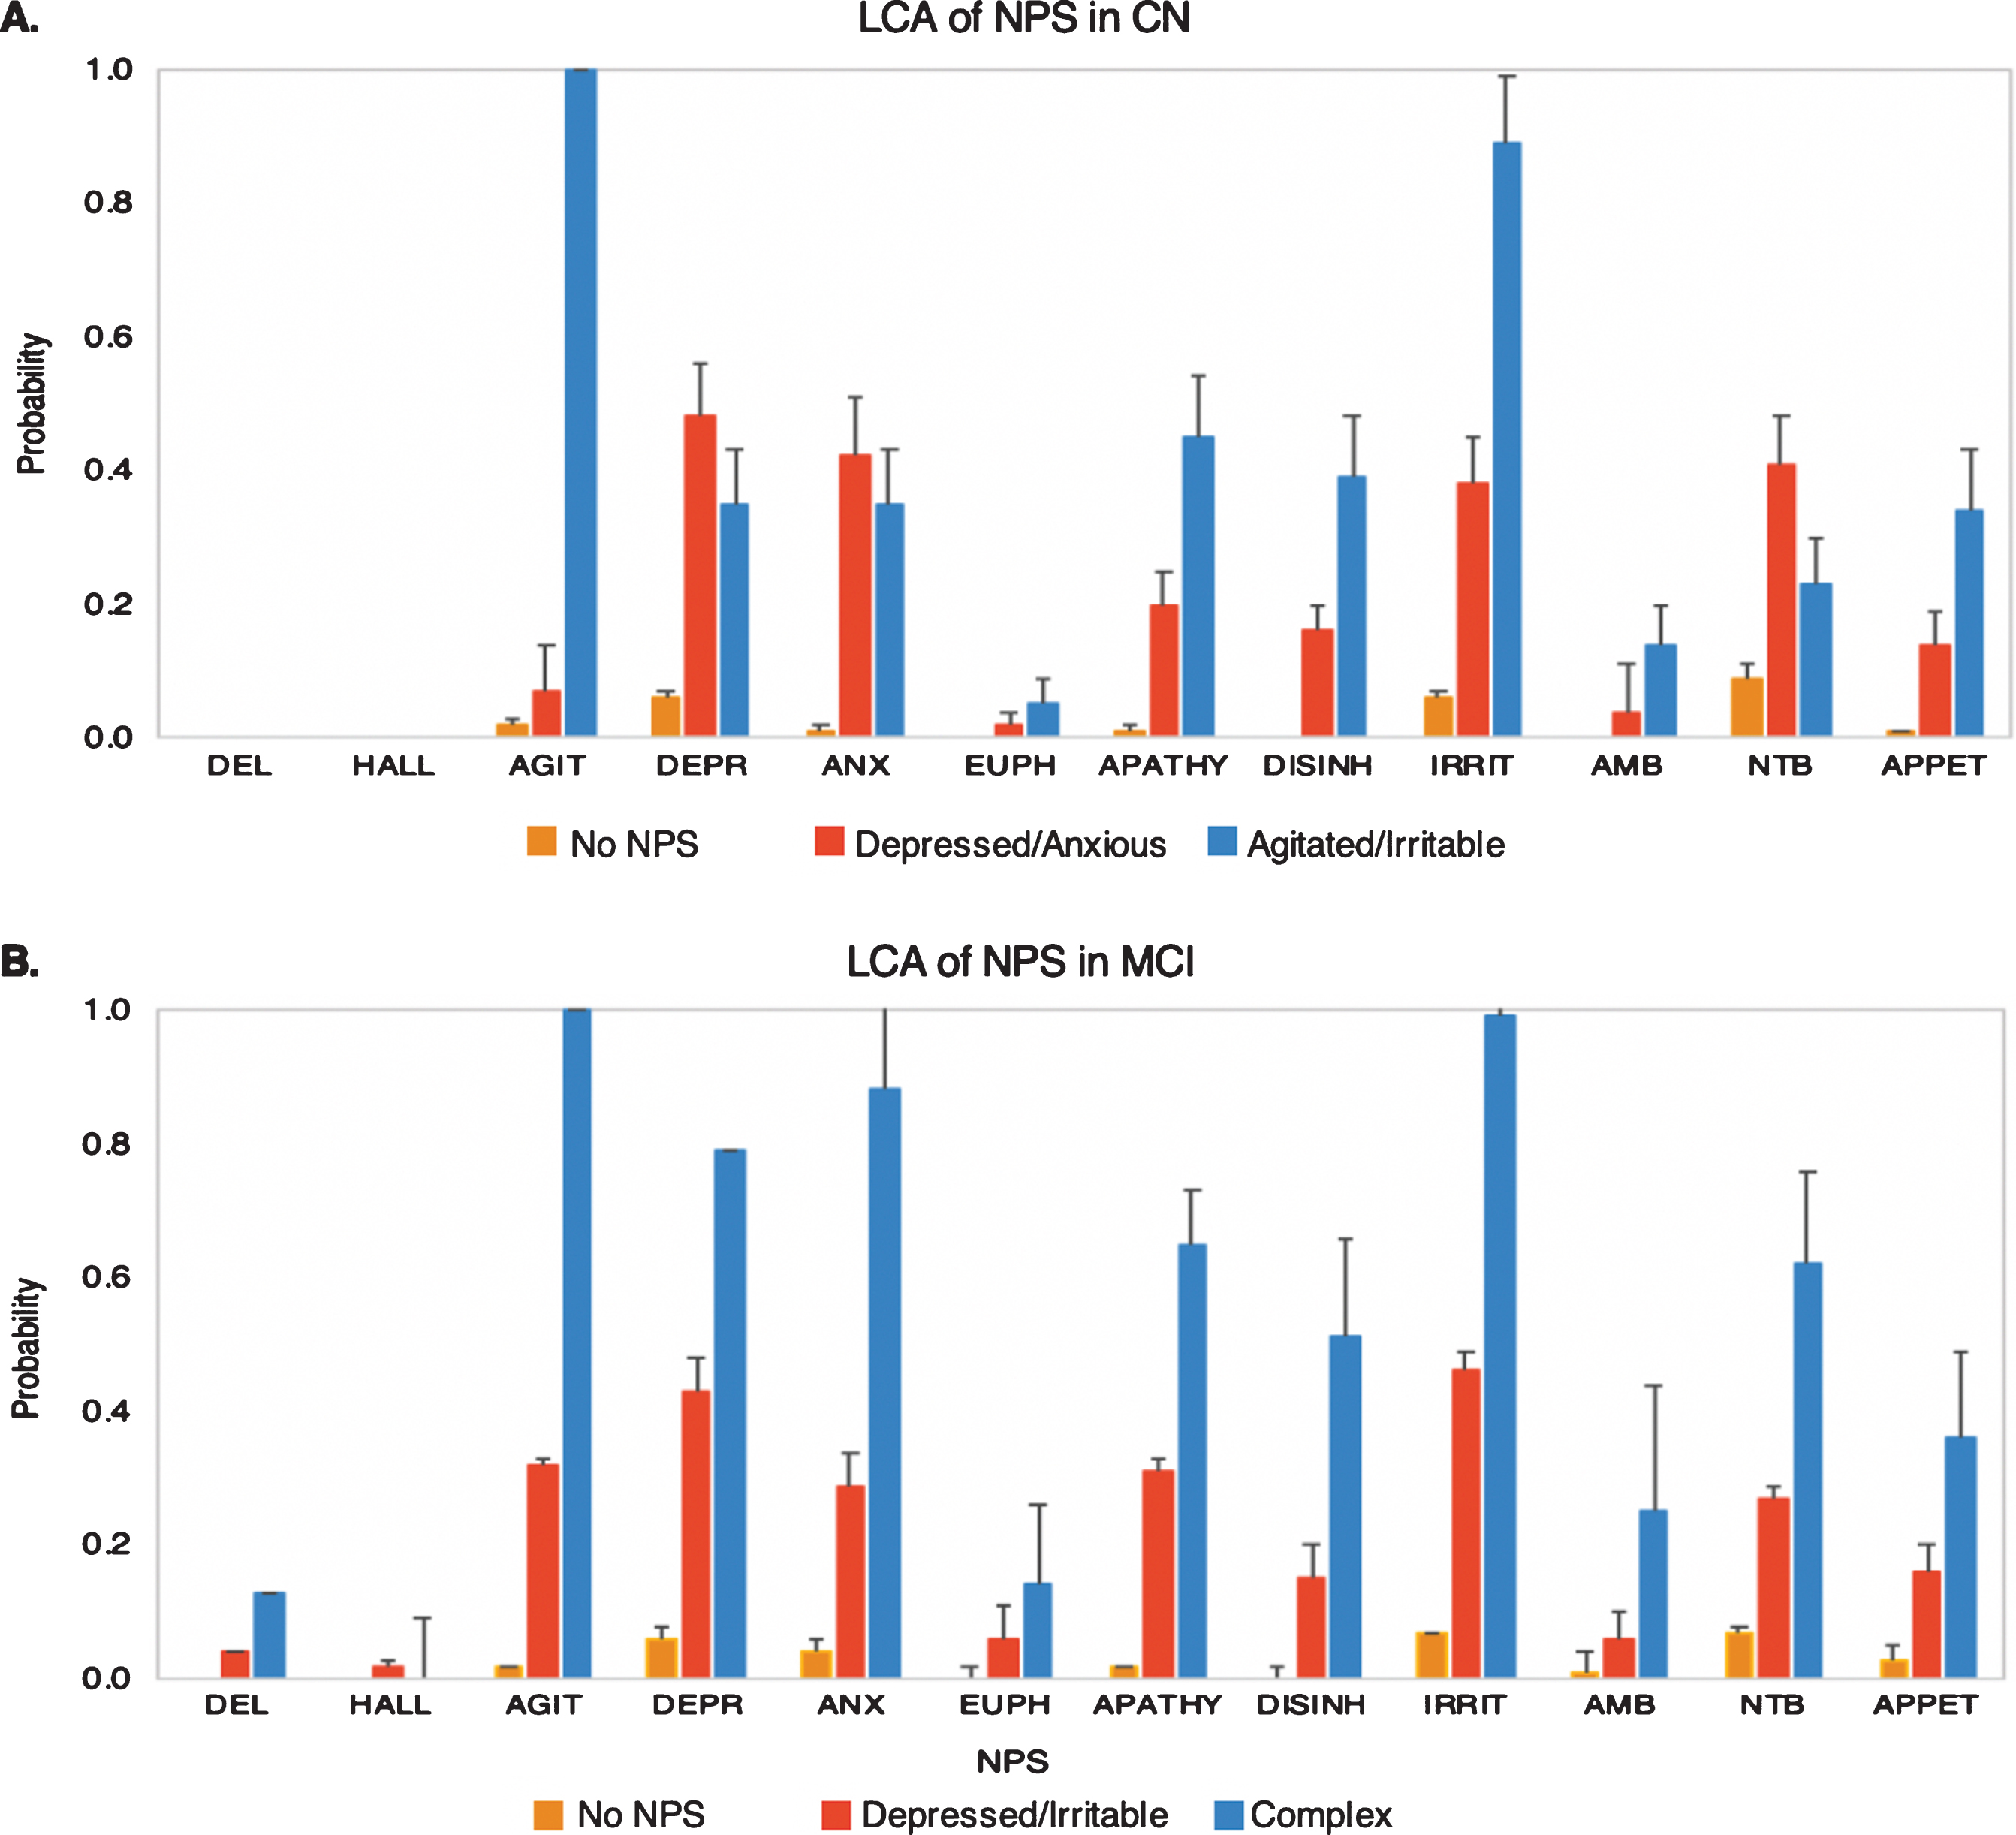
Results from latent class analysis (LCA), showing probability estimates and standard error bars for each of the neuropsychiatric symptoms (NPS) in older adults with normal cognition (CN) and mild cognitive impairment (MCI). A) Three latent classes identified in CN with distinct patterns of NPS based on the probabilities of NPS within each class. No NPS class (80.8%) had minimal NPS. Depressed/Anxious class (13.7%) showed greater probabilities of depression and anxiety, whereas Agitated/Irritable class (5.4%) had prominent agitation and irritability. B) Three latent classes identified in MCI, with distinct patterns of NPS based on the probabilities of NPS within each class. No NPS class (62.7%) had minimal NPS. Depressed/Irritable class (33.4%) showed greater probabilities of depression and irritability, whereas Complex class (3.9%) had multiple prominent NPS. DEL, delusion; HALL, hallucination; AGIT, agitation; DEPR, depression; ANX, anxiety; EUPH, euphoria; APATHY, apathy; DISINH, disinhibition; IRRIT, irritability; AMB, aberrant motor behavior; NTB, nighttime behavior; APPET, change in appetite.
Figure 2B shows estimated probability of each NPI domain given the class membership within MCI. “No NPS” subgroup would include 57.6% of the sample, which had close to zero probabilities of all NPS. “Depressed/Irritable” subgroup would include 38.8% of the sample, which had high probabilities of depression (0.43) and irritability (0.46). “Complex” subgroup would include 3.6% of the sample, which had higher probabilities of multiple NPS domains, including agitation (1.00), depression (0.79), anxiety (0.88), apathy (0.65), irritability (0.89), and nighttime behavior (0.62) as most likely NPS.
Characteristics of CN classes
Cross-sectional comparisons across CN classes are summarized in Table 1A. Participants in Depressed/Anxious subgroup (71.53±6.60) were significantly younger than participants in No NPS subgroup (74.07±6.60). Agitated/Irritable subgroup had a significantly lower proportion of females (24.4%) than No NPS subgroup (53.3%) and Depressed/Anxious subgroup (54.0%). Depressed/Anxious (41.9%) and Agitated/Irritable (46.7%) subgroups both had significantly higher proportions of ApoE4 carriers, compared with No NPS subgroup (31.0%). Classes showed significant differences in neuropsychological performances on tests of global cognition (MMSE), delayed recall (AVLT Long Delay), recognition (AVLT Recognition), and processing speed (Trails A) (see Table 1A for post hoc pair-wise comparisons on neurocognitive tests). Results found no significant difference in the proportion of individuals who had positive CSF AD biomarker profile within each subgroup for Aβ, p-tau, t-tau, or both Aβ and p-tau. There was no significant difference across subgroups in their mean levels of CSF AD biomarker measurements.
Comparisons across 3 classes in CN
Analyses were based on the most likely class membership assignment. Means and standard deviations are provided for age, years of education, neuropsychological measures, and AD CSF biomarker measurements. Proportions are provided for sex, ApoE4 carrier status, and CSF AD biomarker profiles. *Overall ANOVA model was significant; however, post-hoc analyses revealed no significant differences between classes. Post-hoc analyses: aDifference between the two classes is significant at p < 0.001; bDifference between the two classes is significant at p < 0.01; cDifference between the two classes is significant at p < 0.05. CN, cognitively normal; ApoE4, apolipoprotein E ɛ4; MMSE, Mini-Mental State Examination; AVLT, Rey Auditory Verbal Learning Test; Trails A, Trail Making Test A; Trails B, Trail Making Test B; BNT, Boston Naming Test; CSF, cerebrospinal fluid; AD, Alzheimer’s disease; Aβ, amyloid-β; p-tau, phosphorylated tau; t-tau, total tau; ns, not significant
Characteristics of MCI classes
Cross-sectional comparisons across NPS classes for MCI participants are summarized in Table 1. Depressed/Irritable subgroup (71.4%) included a higher proportion of males than No NPS subgroup (59.2%). Classes differed in their performance on a test of executive function (Trails B; see Table 1B for post hoc pair-wise comparisons on this test). Results found no significant difference in the proportion of individuals who had positive CSF AD biomarker profile within each subgroup for Aβ, p-tau, t-tau, or both Aβ and p-tau. There was no significant difference across subgroups in their mean levels of CSF AD biomarker measurements.
Comparisons across classes in MCI
Analyses were based on the most likely class membership assignment. Means and standard deviations are provided for age, years of education, neuropsychological measures, and CSF AD biomarker measurements. Proportions are provided for sex, ApoE4 carrier status, and CSF AD biomarker profiles. Post-hoc analyses: aDifference between the two classes is significant at p < 0.001; bDifference between the two classes is significant at p < 0.05. MCI, mild cognitive impairment; ApoE4, apolipoprotein E ɛ4; MMSE, Mini-Mental State Examination; AVLT, Rey Auditory Verbal Learning Test; Trails A, Trail Making Test A; Trails B, Trail Making Test B; BNT, Boston Naming Test; CSF, cerebrospinal fluid; AD, Alzheimer’s disease; Aβ, amyloid-β; p-tau, phosphorylated tau; t-tau, total tau; ns, not significant.
Risk of dementia in CN classes
In CN, Depressed/Anxious subgroup did not differ from No NPS subgroup in their risk of progression to dementia, HR = 2.10, 95% CI [0.97, 4.54]. However, Agitated/Irritable subgroup had significantly elevated risk of progression to dementia, compared with No NPS subgroup, HR = 3.65, 95% CI [1.80, 7.40] (Table 2, Fig. 3A). Post hoc supplementary analyses were conducted to compare each NPS domain for its association with the risk of dementia, among NPS whose probability of occurrence was greater than 0.25. Apathy (HR = 2.94, 95% CI [1.46, 5.92]), agitation (HR = 2.84, 95% CI [1.48, 5.41]), anxiety (HR = 2.17, 95% CI [1.07, 4.40]), and irritability (HR = 1.97, 95% CI [1.05, 3.67]) predicted progression to dementia, while other NPS domains did not alter the risk of dementia.
Cox proportional hazard regression models comparing time to progression to dementia across classes in CN and MCI
Analyses were based on the most likely class membership assignment. *Reference class; Model 1 = base model; Model 2 = adjusted model; CN, cognitively normal; MCI, mild cognitive impairment; HR, hazard ratio; 95% CI, 95% confidence interval; Sig., significance level.

Survival function showing time to progression to dementia measured in months and survival probability. Survival curves are shown for each class, with No NPS class as the reference class in (A) cognitively normal (CN) and (B) mild cognitive impairment (MCI) groups. All models are adjusted for covariates, including age, sex, Mini-Mental State Exam score (MMSE), and apolipoprotein E–ɛ4 carrier status (ApoE4). A) In CN, after adjusting for covariates, Agitated/Irritable class had significantly elevated risk for progression to dementia, compared with No NPS class. There was no significant difference between Depressed/Anxious and No NPS classes in their risk for progression to dementia. B) In MCI, after adjusting for covariates, both Depressed/Irritable and Complex classes had significantly greater risk of progression to dementia, compared with No NPS class. HR, hazard ratio; CI, confidence interval.
Risk of dementia in MCI classes
In MCI, the Depressed/Irritable subgroup showed increased risk of progression to dementia, compared with the No NPS subgroup, HR = 1.52, 95% CI [1.16, 2.00]. The Complex subgroup also showed significantly increased risk of progression to dementia, compared with No NPS subgroup, HR = 1.86, 95% CI [1.05, 3.30] (Table 2 and Fig. 3B). Results from post hoc supplementary analyses revealed that agitation (HR = 1.76, 95% CI [1.31, 2.36]), changes in appetite (HR = 1.73, 95% CI [1.18, 2.53]), anxiety (HR = 1.71, 95% CI [1.26, 2.31]), irritability (HR = 1.46, 95% CI [1.11, 1.94]) and depression (HR = 1.35, 95% CI [1.02, 1.80]) predicted progression to dementia.
DISCUSSION
The current study sought to describe subgroups of non-demented older adults based on their NPS profile, and to compare their baseline demographic, cognitive, CSF AD biomarker characteristics, as well as the risk of progression to dementia. LCA found that a 3-class model best captures the data for both CN and MCI. A large majority of older adults consisted of an asymptomatic subgroup in both CN and MCI, showing minimal NPS, while small subgroups of older adults exhibited elevated NPS, with aNPS more prevalent than non-affective symptoms. Consistent with our hypothesis, elevated NPS in CN and MCI were associated with increased risk of progression to dementia, above and beyond the effects of age, sex, global cognition, and ApoE4. As predicted, these associations were independent of CSF AD biomarker profiles, as there was no difference in the proportions of individuals who have positive AD pathophysiology.
Our findings provide further evidence linking aNPS and increased risk of progression to dementia in older adults with normal cognition and MCI. Findings highlight the profiles of NPS, rather than focusing on presence or absence of a single NPS, and underscore the importance of agitation and irritability, as they might be more commonly observed symptoms in older adults at greater risk of developing dementia. The overall NPS profiles identified in the CN group are similar to the findings of Leoutsakos et al.’s LCA of NPI in NACC normal controls [19], in that aNPS are prominent in symptomatic classes and associated with greater risk of progression to dementia. Unique to the current study, AD biological markers and genetic risk were included in considering the role of NPS in progression to dementia. Evidence from the current study suggests that aNPS might indicate specific dementia risk, not fully accounted for by the robust predictors of dementia, such as abnormal AD biomarker profile and ApoE4.
Our finding of increased dementia risk in individuals with NPS independent of cognitive and biomarker profiles could imply that NPS represent a unique symptom domain. It is possible that NPS reflect a brain vulnerability capable of lowering the threshold for AD pathophysiology to manifest clinically. Consistent with this notion, researchers postulated that “depression-spectrum symptoms” might be manifestations of neuronal injury due to secondary mechanisms [26]. This secondary source of neuronal injury could increase vulnerability to AD pathophysiology and clinical decline. For instance, secondary disease processes might include chronic neuro-inflammation or disruptions in the monoamine pathways [36]. Given the research evidence supporting the vascular etiology of apathy and depression [37, 38], cerebrovascular dysfunction might be a strong candidate for the common factor in the link between NPS and AD, according to the hypotheses for possible pathways reviewed earlier [20]. Alternatively, NPS might represent psychological and behavioral reactions to cognitive decline. Given the high level of education in ADNI participants, scores on the low end of normal limits on cognitive tests might reflect a significant decline for some individuals. It could also be that NPS have negative functional implications in health behavior or management of dementia risk factors, which might translate into increased disease burden and risk of developing dementia in the long run.
The ADNI has selective inclusion criteria for its participants and excluded individuals with more substantial, clinically significant levels of depressive symptoms (i.e., diagnosis of MDD, GDS score at or above the threshold positive for depression), which potentially limit the ability to investigate the effect of NPS. It is remarkable that the present study observed increased dementia risk in association with such subtle changes in mood and behavior. Given these exclusionary criteria, and the dichotomous approach in capturing NPS (i.e., presence versus absence), we identified a fairly small subgroup with NPS, However, we hypothesize these subtle changes may be part of early presentation of the underlying AD pathophysiology or other secondary mechanisms of neuronal injury, independent of cognitive changes.
The magnitude of impact NPS has on the progression to dementia might vary along the spectrum of preclinical and prodromal AD. Specifically, the impact may be greater in the earlier stages than later when accumulation of AD pathophysiology grows more severe and cognitive impairment is detectable. The current findings provide some insight into this hypothesis, as the risk of progression to dementia associated with the subgroup with elevated NPS in CN had a larger effect size than the risk associated with the corresponding subgroup in MCI.
Investigations into the pattern of NPS might prove informative and useful in clinical practice. For instance, when NPI domains were examined individually, there was no association between depression and the risk of progression to dementia in the CN group, even though it is one of the common NPS in CN. Future investigations might help develop an algorithm that could be utilized in practice to recognize the patterns of NPS estimated to have elevated risk of progression to dementia.
In the current study, apathy was among the more commonly observed NPS in classes that showed increased risk of progression to dementia, along with other affective symptoms, in CN and MCI. Research evidence in the literature suggests the complexity of apathy construct, as it might be conceptualized as an affective process related to depression, but also as a “frontal/hypomanic” process [39] or an entirely separate domain by itself [39, 40].
The current study poses several limitations to consider. Firstly, we constructed our LCA models to reflect our conceptualization of older adult subgroups with distinct NPS profiles, as measured by the NPI. Comparing latent classes this way without accounting for the imprecision in classification may introduce bias in the results, as LCA operates based on probability estimation. Additionally, there were boundary estimates (i.e., probabilities estimated to be exactly 0 or 1) of some indicators, including agitation in CN and MCI, which may suggest problems with model identification or convergence to a local likelihood maximum [41]. Secondly, we used cross-sectional assessment of NPS. Future studies could test if chronic NPS might have a different impact on the progression to dementia or have distinct neural mechanism, compared with NPS with a more variable and episodic course. Thirdly, despite its merits as a screening tool, the NPI/NPI-Q may fall short in serving the purpose of the current study. As Leoutsakos et al. [19] noted, the NPI was designed to capture NPS in individuals with dementia, and some of the questions appear inappropriate or irrelevant for those with normal cognition (e.g., fears of separation from the caregiver as a symptom of anxiety). Other questions might be subject to various interpretation (e.g., behaviors resistive to help and “hard to handle” as a symptom of agitation). Given that participants in the current study have no or only mild cognitive problems and are capable of evaluating their own experience, self-reported ratings likely reflect symptoms more accurately than information provided by a proxy. Finally, given that subgroups with NPS had small percentages of the sample, non-significant findings of CSF AD biomarkers as well as the lack of association between Depressed/Irritable subgroup in CN and the dementia risk may be due to insufficient power. Future studies might consider including history of psychiatric disorders or psychiatric medication use to account for their possible effects on the association between NPS and the dementia risk. Investigations into the association between NPS and progression from CN to MCI in the ADNI, accounting for the potential issues surrounding diagnostic accuracy and stability for the ADNI MCI, might also interest researchers in the future.
The current study also has notable methodological strengths. We used data from a comprehensive analysis of CSF AD biomarker profile, adopted a model-based approach to empirically determine NPS subgroups, and conducted a longitudinal analysis to evaluate the risk of progression to dementia. Our findings make significant contributions to advancing research to characterize early biological and clinical changes that can predict onset of dementia years later. Findings from this study would inform scientists of a possible phenotype of AD, where affective symptoms might be an early emerging problem, and allow for opportunities to consider the underlying mechanism. The current study also highlights that NPS are associated with unfavorable prognosis across the entire spectrum of AD. The clinical focus might include increasing awareness of the importance of emotional and behavioral health in the growing older adult population and facilitating access to interventions before cognitive impairment becomes a barrier.
Footnotes
ACKNOWLEDGMENTS
The current study was supported by NIH/National Institute on Aging (NIA) R01AG064228, R01AG060049, P50AG016573, and the Alzheimer’s Association AARG-17-532905 awarded to Dr. Daniel A. Nation.
Data collection and sharing for this project was funded by the Alzheimer’s Disease Neuroimaging Initiative (ADNI) (National Institutes of Health Grant U01 AG024904) and DOD ADNI (Department of Defense award number W81XWH-12-2-0012). ADNI is funded by the National Institute on Aging, the National Institute of Biomedical Imaging and Bioengineering, and through generous contributions from the following: AbbVie, Alzheimer’s Association; Alzheimer’s Drug Discovery Foundation; Araclon Biotech; BioClinica, Inc.; Biogen; Bristol-Myers Squibb Company; CereSpir, Inc.; Cogstate; Eisai Inc.; Elan Pharmaceuticals, Inc.; Eli Lilly and Company; EuroImmun; F. Hoffmann-La Roche Ltd and its affiliated company Genentech, Inc.; Fujirebio; GE Healthcare; IXICO Ltd.; Janssen Alzheimer Immunotherapy Research & Development, LLC.; Johnson & Johnson Pharmaceutical Research & Development LLC.; Lumosity; Lundbeck; Merck & Co., Inc.; Meso Scale Diagnostics, LLC.; NeuroRx Research; Neurotrack Technologies; Novartis Pharmaceuticals Corporation; Pfizer Inc.; Piramal Imaging; Servier; Takeda Pharmaceutical Company; and Transition Therapeutics. The Canadian Institutes of Health Research is providing funds to support ADNI clinical sites in Canada. Private sector contributions are facilitated by the Foundation for the National Institutes of Health (![]() ). The grantee organization is the Northern California Institute for Research and Education, and the study is coordinated by the Alzheimer’s Therapeutic Research Institute at the University of Southern California. ADNI data are disseminated by the Laboratory for Neuro Imaging at the University of Southern California.
). The grantee organization is the Northern California Institute for Research and Education, and the study is coordinated by the Alzheimer’s Therapeutic Research Institute at the University of Southern California. ADNI data are disseminated by the Laboratory for Neuro Imaging at the University of Southern California.