



Abstract
Background:
Type 2 diabetes is a dementia risk factor, but its relation to Alzheimer’s disease (AD), the most common cause of dementia, is unclear.
Objective:
Our primary objective was to examine the association of pre-diabetes and type 2 diabetes with brain amyloid-β (Aβ), the putative main culprit of AD. Our secondary objective was to examine the association of pre-diabetes and type 2 diabetes with neurodegeneration, cerebrovascular disease (CVD), and memory performance.
Methods:
We conducted a cross-sectional study of 350 late middle-aged Hispanics without dementia in New York City. We classified diabetes status as normal glucose tolerance (NGT), pre-diabetes, and type 2 diabetes following American Diabetes Association criteria. Brain Aβ was ascertained as global Aβ standardized value uptake ratio using PET with 18F-Florbetaben. Neurodegeneration was operationalized as cortical thickness in regions affected by AD using MRI. CVD was operationalized as white matter hyperintensity volume (WMH) on MRI, and memory as performance with the selective reminding test (SRT).
Results:
Mean age was 64.15±3.34 years, 72.00% were women, and 35.43% were APOE ɛ4 carriers. Pre-diabetes, but not type 2 diabetes, was associated with higher Aβ compared with NGT. Type 2 diabetes treatment was related to lower Aβ. Type 2 diabetes was related to lower cortical thickness, higher WMH, and lower SRT score.
Conclusion:
Pre-diabetes, but not type 2 diabetes, is associated with higher brain Aβ in late middle age, and this observation could be explained by the relation of diabetes treatment with lower brain Aβ. Whether type 2 diabetes treatment lowers brain Aβ requires further study.
INTRODUCTION
Eleven percent of people aged 65 years and older have dementia in the United States (US), and the most common cause is Alzheimer’s disease (AD), followed by vascular dementia [1]. One of the most consistent risk factors reported for dementia, including AD and vascular dementia, is type 2 diabetes and its antecedent, pre-diabetes [2]. The role of type 2 diabetes and pre-diabetes in dementia is of significant public health importance because approximately 12% of the US adult population has type 2 diabetes (30.2 million) and 33% has pre-diabetes (84.1 million) [3]. Moreover, the majority of the US population aged 65 years and older, the most susceptible to dementia, has pre-diabetes or type 2 diabetes [3]. Type 2 diabetes is known to be a cerebrovascular risk factor, but neuropathology [4 –10] and biomarker studies [11 –14] are conflicting on whether type 2 diabetes is related to AD neuropathology. Neuropathology studies may be limited by selection bias, and most biomarkers studies have been conducted in elderly subjects, which may be limited by selection and survival bias. Decades of advances in AD research, particularly in AD biomarkers [15, 16], have led to the dominance of three neuropathological constructs: brain amyloid, brain tau, and neurodegeneration [15]. Current understanding of the natural history leading to dementia due to AD can be summarized as follows [15]: the two main proteinopathies underlying AD, amyloid and tau, are separate processes, but amyloid deposition is the main driver of AD and accelerates tau deposition; amyloid and tau deposition precede and cause neurodegeneration, which leads to the clinical syndromes of amnestic mild cognitive impairment (MCI) and dementia. The constructs of amyloid, tau, and neurodegeneration feature prominently in the recent National Institute on Aging (NIA)/Alzheimer’s Association (AA) 2018 research framework [17]. This framework proposes to conduct research in which biomarkers of amyloid, tau, and neurodegeneration are used as outcomes in research for the purpose of better understanding the mechanisms and sequence of neuropathology. Cerebrovascular disease and cognitive performance are secondary constructs in this framework. Our primary objective was to examine whether type 2 diabetes and pre-diabetes are related to brain amyloid-β (Aβ) burden, the main pathological hallmark of AD. Our secondary objective was to examine the relation of type 2 diabetes and pre-diabetes with neurodegeneration, cerebrovascular disease, and memory performance in late middle age. We hypothesized that pre-diabetes and type 2 diabetes compared with normal glucose tolerance (NGT), would be related to higher brain Aβ burden, neurodegeneration, cerebrovascular disease, and memory performance in late middle age.
METHODS
Study design and population
This was a cross-sectional analysis of 350 participants of a study focusing on the relation of type 2 diabetes and brain amyloid in middle-aged Hispanics conducted at Columbia University Irving Medical Center (CUIMC) in New York City, recruited between March 1, 2016 and July 31, 2019. We targeted Hispanics because they are the most common ethnic group in the community surrounding CUIMC [18] and because there is a paucity of AD biomarkers studies in Non-Whites [15]. In addition, Hispanics have a higher prevalence of pre-diabetes and type 2 diabetes compared with Non-Hispanic Whites [3]. Participants were recruited from the community through various outreach activities, including presentations at churches and senior centers, posters at CUIMC and around the community, health fairs, and newspaper ads. Study research staff collaborated with the Community Engagement Core Resource of the Irving Institute for Clinical and Translational Research, the Clinical Translational Science Award at CUIMC, to conduct outreach in the community and promote the study. Recruitment was exclusively community based and did not include recruitment from clinics or using electronic medical records. Inclusion criteria included ages between 55 and 69 years, men and women, able to undergo phlebotomy, clinical and neuropsychological assessments, 3T brain magnetic resonance imaging (MRI), and positron emission tomography (PET) with the Aβ radioligand 18F-Florbetaben. Exclusion criteria included dementia diagnosis, cancer other than non-melanoma skin cancer, and MRI contraindications. We screened 659 potential participants; 114 (17.30%) declined to participate, 178 (27.01%) were ineligible, and 16 (2.43%) did not complete study procedures (Supplementary Figure 1). One additional participant (0.15%) was excluded from analyses due to incomplete data on APOE genotype, the most important predictor of in vivo brain amyloid burden [19]. The interval between amyloid PET and MRI was 15.79±33.41 days. The Institutional Review Board and the Joint Radiation Safety Commission at CUIMC approved this study. Participants provided written informed consent. Funding sources had no role in study design, data collection, data analyses or interpretation.
Study measures
Although this is a cross-sectional study in which temporality can only be assumed, we refer to the independent variables as exposure and the dependent variables as outcomes.
Exposures
The main exposure variable was type 2 diabetes category. Type 2 diabetes categories were normal glucose tolerance (NGT; defined by hemoglobin A1c [HbA1c] < 5.7%), pre-diabetes (HbA1c 5.7 to 6.4%), and unknown type 2 diabetes (HbA1c≥6.5%) following American Diabetes Association guidelines [20]; known type 2 diabetes was ascertained by self-report. We focused on type 2 diabetes categories (NGT, pre-diabetes, and type 2 diabetes) as the exposure because these are clinical entities diagnosed in clinical practice and used in epidemiologic research. HbA1c was measured using a turbidimetric inhibition immunoassay on the automated analyzer Cobas Integra 400 plus (Roche Diagnostics, Indianapolis, IN). We examined HbA1c continuously as a secondary exposure variable.
Outcomes
The primary outcome was brain Aβ burden ascertained as global standardized uptake value ratio (SUVR) measured with 18F-Florbetaben PET. The secondary outcomes were neurodegeneration, focusing on cortical thickness in areas affected by AD [21] obtained from 3T MRI, cerebrovascular disease, a known complication of type 2 diabetes [3], ascertained as white matter hyperintensity volume (WMH) on MRI, and memory performance (verbal learning), the cognitive domain affected earliest in AD [1].
Amyloid PET
Participants underwent 18F-Florbetaben PET imaging in a Siemens Biograph64 mCT/PET scanner (target dose: 8.1 mCi; 4×5 min frames; iterative reconstruction algorithm; voxel size: 1.6×1.6×1 mm3. Images were acquired over 20 min starting 90 min post-injection. Dynamic PET frames (4 scans) were aligned to the first frame using rigid-body registration and a static PET image was obtained by averaging the four registered frames. The static PET image was then registered with the CT scan obtained for attenuation correction during PET imaging reconstruction by rigid-body registration with information theoretic cost function to generate a fused image with skull. The structural T1 image in FreeSurfer space was registered to CT/PET fused image using normalized mutual information and six degrees of freedom. A combination of the two transformation matrices obtained from the two rigid-body registrations was used to transfer all Freesurfer regional masks and the cerebellar gray matter from FreeSurfer space to static PET image space using nearest neighbor interpolation [22]. The standardized uptake value (SUV), defined as the decay-corrected brain radioactivity concentration normalized for injected dose and body weight, was calculated in all FreeSurfer regions. The SUV in each region as well as each voxel was normalized to the SUV in cerebellar gray matter to derive the regional and voxel-wise SUVR. Overall mean Aβ burden was calculated from voxel-based, individual region of interests (ROI), including lateral temporal cortex, parietal cortex, cingulate cortex, and frontal cortex.
The 2018 NIA/AA research framework recommends categorizing AD biomarkers as positive or negative (or high or low), but there is uncertainty about the right approach for categorization [23]. Brain Aβ SUVR has a bimodal distribution and Aβ positivity is usually examined using cutoffs that vary by study [24], but usually represent the point of separation in the bimodal distribution (see Supplementary Figure 2). Aβ positivity in the age group we examined has a prevalence of less than 15% [24], but Aβ levels under the positivity threshold are also clinically significant [25] and should be taken into account. We categorized Aβ as high using a SUVR threshold of 1.34, determined using the K-means clustering method, which identifies the partition between the 2 peaks in the Aβ SUVR distribution, which is usually used to determine Aβ positivity quantitatively (Supplementary Figure 2). Values under this threshold were categorized as intermediate and low using a median split (SUVR = 1.127) of the range of SUVR values under the positivity threshold (SUVR = 1.34), which had a normal distribution. We conducted sensitivity analyses categorizing SUVR by the median (SUVR = 1.134), and examining amyloid SUVR as a continuous outcome for all participants, and restricting analyses to participants with Aβ levels under the positivity threshold.
MRI
MR images were acquired in a General Electric Signa Premier 3T scanner and processed with FreeSurfer (v6.0 http://surfer.nmr.mgh.harvard.edu/). The measure of neurodegeneration was the average cortical thickness from regions typically affected by AD [21], including entorhinal cortex, parahippocampus, inferior parietal lobule, pars opercularis, pars orbitalis, pars triangularis, inferior temporal pole, supramarginal gyrus, superior parietal lobe, and superior frontal lobe. WMH volume was derived with in-house developed software. Briefly, each participant’s T2-weighted FLAIR MRI scan was intensity normalized and brain extracted. A Gaussian mixture model was fit to the log-transformed distribution of voxel intensity values. The voxels included in the Gaussian distribution that comprised the highest intensity values were labeled, summed, and multiplied by voxel dimensions to yield total WMH volumes in cm3. Labeled images were visually inspected and edited if necessary. We used the ratio of total WMH and total cranial volume (TCV) for analyses. Total WMH in cm3 was defined as the sum of the number of voxels that are labeled multiplied by voxel dimensions. We used the ratio of total WMH and TCV for analyses.
Verbal learning was ascertained using total recall in the Buschke Selective Reminding test (SRT) [26].
Covariates
We examined age, education, Hispanic subgroup, APOE ɛ4 genotype, body mass index (BMI), lipids (high density lipoprotein [HDL] and low-density lipoprotein [LDL]), and diastolic and systolic blood pressure, and medications for diabetes, hypertension, and dyslipidemia. Hispanic subgroup was classified following the format of the 2010 Census by country or region of origin (e.g., Mexican, Puerto Rican, Cuban, Dominican) [27]. The rationale for the covariates is as follows. Age, sex, and education are important predictors of dementia. APOE ɛ4 genotype is the strongest risk factor for sporadic dementia due to AD [1], and also the strongest determinant of in vivo amyloid burden [24]. Dyslipidemia (high LDL and low HDL), obesity (high BMI), and hypertension (high blood pressure) tend to cluster with type 2 diabetes [20]. BMI was estimated as weight in kg divided by height in meters squared. Cholesterol, HDL, and triglycerides were measured on an automated immunochemistry analyzer, Integra 400 plus (Roche Diagnostics, Indianapolis, IN) using an enzymatic colorimetric assay with a lower limit of quantitation of 3.09 mg/dL for HDL and 0.1 mmol/L for cholesterol and triglycerides. LDL was calculated using the Friedewald formula [28]. APOE ɛ4 genotyping was conducted by LGC genomics (Beverly, MA) using single nucleotide polymorphisms rs429358 and rs7412. Medication for diabetes included metformin, sulfonylureas, dipeptidyl peptidase 4 (DPP-4) inhibitors, peroxisome proliferator-activator γ (PPAR-γ) agonists, Glucagon Like Peptide 1 (GLP1) agonists, and sodium glucose transport 2 (SGLT2) inhibitors; none of the study participants reported using insulin. Blood pressure medications included betablockers, angiotensin converting enzyme inhibitors, angiotension receptor blockers, diuretics, calcium channel blockers, and vasodilators. Lipid medications included HMG-CoA reductase inhibitors (statins), bile acids, ezetimibe, and fibrates.
Statistical analyses
We examined the distribution of all variables. Global Aβ SUVR and the WMH/TCV ratio were not normally distributed. Aβ SUVR had a bimodal distribution as expected, and no transformation approximated a normal distribution, but the SUVR values under the positivity threshold resembled a normal distribution (Supplementary Figure 2). WMH/TCV ratio required a logarithmic transformation to approximate a normal distribution. Bivariate comparisons were made using analysis of variance for continuous variables, and chi-squared for categorical variables. For Aβ categories (low, intermediate, and high) as the outcome, we used multinomial logistic regression adjusting for covariates. For multivariate analyses examining continuous outcomes, we used linear regression when examining glycemia as a continuous exposure and analyses of covariance when examining type 2 diabetes categories as the exposure. We show results for three models. Model 1 was un-adjusted, model 2 adjusted for, age, sex, and APOE ɛ4, and model 3 was adjusted for risk factor variables that were different among diabetes subgroups. The rationale for Model 2 was to examine adjustment for demographics and for the most important genetic determinant of amyloid burden in sporadic AD. The rationale for model 3 was to adjust for the metabolic, vascular, and treatment factors that accompany type 2 diabetes. This third model has important caveats. First, the covariates are correlated with the main exposure and can be difficult to disentangle independent effects, and second, they may be in the causal pathway between type diabetes and any outcome. Thus, attenuation of results in model 3 could be interpreted as evidence of potential mediation, not confounding, or interpreted as being the result of over adjustment in the face of multicollinearity. Statistical significance was considered at p < 0.05. Analyses were conducted using SAS version 9.4 m5 and R version 3.6.0.
RESULTS
The mean age of participants was 64.15±3.34 years, 72% were women (Table 1), and 35.43% were APOE ɛ4 carriers. All participants were Hispanics and most were Caribbean Hispanics of Dominican descent. The distribution of type 2 diabetes categories was as follows: 39.71% had NGT, 28.57% had pre-diabetes, 3.42% had unknown type 2 diabetes, and 28.28% had known type 2 diabetes. Given the low proportion of persons with unknown type 2 diabetes, they were grouped with known type 2 diabetes. There were no differences between type 2 diabetes categories in age, sex, Hispanic subgroups, and education (Table 1). As expected, use of blood pressure and lipid lowering medications was higher in persons with pre-diabetes and type 2 diabetes compared with persons with NGT. HDL was higher in persons with NGT as compared with persons with pre-diabetes and type 2 diabetes. LDL was lowest among persons with type 2 diabetes, the group with the highest prevalence of use of lipid lowering medications. Use of diabetes medications were reported by 72.97% of persons with type 2 diabetes. Metformin was the most commonly used medication (62.16% of all persons with type 2 diabetes, 85.18% of all diabetes medications).
Demographic and other characteristics for the entire sample and by diabetes status (NGT, pre-diabetes, type 2 diabetes) defined by American Diabetes Association criteria using HbA1c)
NGT, normal glucose tolerance; SD, standard deviation; DPP-4i, dipeptidyl peptidase 4 inhibitors; SGLT2i, sodium-glucose co-transporter 2 inhibitors; GLP-1a, glucagon-like peptide receptor 1 agonist; PPAR, peroxisome proliferator-activated receptor gamma agonist; HbA1c, hemoglobin A1c; HDL, high density lipoprotein; LDL, low density lipoprotein; SBP, systolic blood pressure; DBP, diastolic blood pressure.
APOE ɛ4 genotype was a strong predictor of Aβ burden examined categorically and continuously. As compared with non-carriers, APOE ɛ4 carriers had elevated odds of intermediate (OR: 1.97, 95% CI: 1.18, 3.30, p = 0.0097) and high Aβ (OR: 10.12, 95% CI: 3.90, 26.21, p < 0.0001), adjusting for age and sex. Global Aβ SUVR examined as a continuous outcome was also higher in APOE ɛ4 carriers (age and sex adjusted means, 1.21±0.01 versus 1.13±0.09; p < 0.0001) for all subjects, and among the 322 individuals under the Aβ positivity threshold (SUVR 1.14±0.006 in carriers versus 1.12±0.004 in non-carriers; p = 0.0017).
We compared Aβ categories across type 2 diabetes categories (Fig. 1). Persons with pre-diabetes had a higher proportion of high Aβ (10.00%) and intermediate Aβ (53.00%) as compared with both persons with NGT (8.63% positive, 41.73% intermediate) and type 2 diabetes (5.41% positive, 45.05% intermediate). Persons with pre-diabetes, but not type 2 diabetes, had higher odds of high and intermediate Aβ as compared with persons with NGT, and this result was significant for intermediate Aβ after adjustment for age, sex, and APOE ɛ4, but was modestly attenuated in the model adjusting for other risk factors (Table 2). HbA1c examined continuously was not related to intermediate Aβ (OR = 1.00, 95% CI: 0.84–1.19), but had an inverse relation with high Aβ (OR = 0.57; 95% CI 0.31, 1.03; p = 0.062) that was close to statistical significance after adjustment for age, sex, and APOE ɛ4, consistent with the findings for diabetes categories.
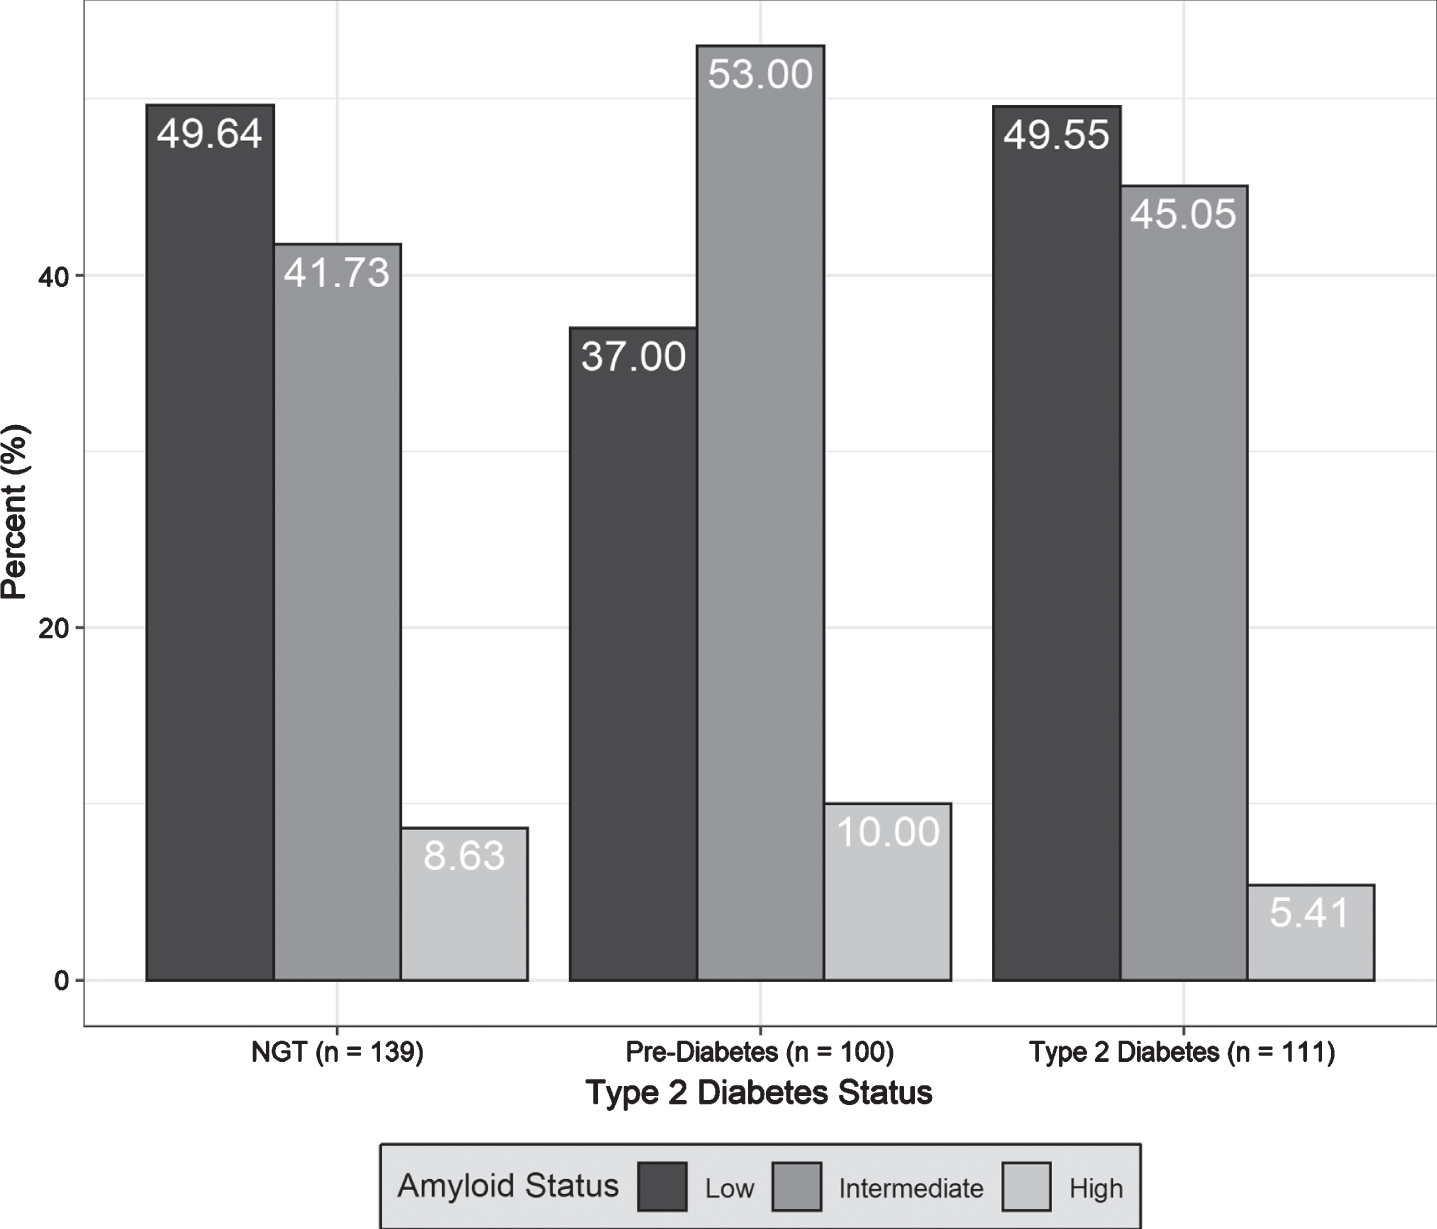
Comparison by type 2 diabetes status (normal glucose tolerance [NGT], pre-diabetes, type 2 diabetes), of the proportion of brain amyloid categories (low, intermediate, high).
Relation of diabetes status categories (NGT [reference category], pre-diabetes, type 2 diabetes), and of glycemia ascertained as HbA1c, with global brain amyloid level categories (low, intermediate, and high). OR were estimated with multinomial logistic regression. OR report the odds of the designated amyloid group compared to low amyloid/Model 1 is unadjusted; Model 2 is adjusted for age, sex, and APOE ɛ4; Model 3 is adjusted for lipids, body mass index, and differences in medication
NGT, normal glucose tolerance; T2D, type 2 diabetes; OR, odds ratios; CI, confidence interval.
We also conducted sensitivity analyses examining high Aβ levels defined by the median SUVR (1.134), and found that prediabetes was related to high Aβ levels after adjustment for age, sex, and APOE ɛ4 as compared with NGT, but type 2 diabetes was not (Table 3).
Relation of diabetes status categories (NGT, pre-diabetes, T2D), and of glycemia ascertained as HbA1c, with high global brain amyloid level by the median SUVR. OR and 95% CI estimated defined by multinomial logistic regression. ORs report the odds of high versus low amyloid defined by the median SUVR. Model 1 is unadjusted; Model 2 is adjusted for age, sex, and APOE ɛ4; Model 3 is adjusted for lipids, body mass index, and differences in medication. For analyses with diabetes categories, NGT is the reference category
NGT, normal glucose tolerance; T2D, type 2 diabetes; HbA1c, hemoglobin A1c; SUVR, standardized uptake value ratio; OR, odds ratios; CI, confidence interval.
We also compared Aβ SUVR examined continuously among diabetes groups (Table 4). Persons with pre-diabetes had higher SUVR as compared with persons with NGT in all models, and Aβ SUVR in persons with diabetes were similar to NGT, although these results were not statistically significant. In analyses restricted to individuals under the positivity threshold (SUVR = 1.34), persons with pre-diabetes (N = 90) still showed higher Aβ SUVR, and the p-values in the model adjusted for age, sex, and APOE ɛ4 was statistically significant (Table 4), supporting our observation that the relation between pre-diabetes and Aβ is driven mostly by intermediate Aβ levels.
Relation of diabetes status categories (NGT, pre-diabetes, T2D), and of glycemia ascertained as HbA1c, with brain amyloid SUVR. Amyloid SUVR adjusted means and SD are compared across T2D categories using analysis of covariance. Coefficients (β) and 95% CI relating HbA1c and amyloid SUVR were estimated using linear regression models. Model 1 is unadjusted; Model 2 is adjusted for age, sex, and APOE ɛ4; Model 3 is adjusted for lipids, body mass index, and differences in medication (lipid, blood pressure, and diabetes)
NGT, normal glucose tolerance; T2D, type 2 diabetes; HbA1c, hemoglobin A1c; SUVR, standardized uptake value ratio; SD, standard deviations; CI, confidence interval.
Since a difference between persons with type 2 diabetes and those with pre-diabetes is the use of diabetes medications, we conducted post-hoc analyses exploring the association of diabetes medication use with Aβ categories among the 211 persons with pre-diabetes and type 2 diabetes using multinomial logistic regression. Three persons in the pre-diabetes group reported using the diabetes medication metformin, which is used for diabetes prevention, and 81 of the persons with type 2 diabetes reported using diabetes medications. The odds of intermediate (OR 0.57; 95% CI 0.30, 1.07; p = 0.079) and high Aβ (OR = 0.20; 95% CI 0.05, 0.81; p = 0.024) was lower in persons taking diabetes medications compared to those not taking diabetes medications after adjustment for age, sex, and APOE ɛ4. When global Aβ SUVR was examined as the outcome, Aβ SUVR was lower in persons reporting medication use (SUVR 1.14±0.014) versus those not reporting medication use (SUVR = 1.18 ± 0.011; p = 0.041) after adjustment for age, sex, and APOE ɛ4.
In terms of the secondary outcomes of neurodegeneration, WMH, and memory performance, Type 2 diabetes was associated with smaller cortical thickness, higher WMH, and lower total recall of words in the SRT (Table 5) in the unadjusted model and that adjusted for demographics and APOE ɛ4. Higher glycemia was also associated with smaller cortical thickness and higher WMH.
Relation of diabetes status categories (NGT, pre-diabetes, T2D), and of glycemia ascertained as HbA1c with the secondary outcomes of cortical thickness in AD signature regions, ratio of WMH to TCV with logarithmic transformation, and total recall of the Selective Reminding Test. Adjusted means and SD are compared across T2D categories estimated using analysis of covariance. Coefficients (β) and 95% CI relating HbA1c and amyloid SUVR were estimated using linear regression models. Model 1 is unadjusted; Model 2 is adjusted for age, sex, and APOE ɛ4; Model 3 is adjusted for lipids, body mass index, and differences in medication (lipid, blood pressure, and diabetes)
NGT, normal glucose tolerance; T2D, type 2 diabetes; HbA1c, hemoglobin A1c; AD, Alzheimer’s disease; WMH, white matter hyperintensities; TCV, total cranial volume; SD, standard deviations; CI, confidence interval; SUVR, standardized uptake value ratio.
DISCUSSION
Contrary to our hypothesis, Aβ burden, the main pathological driver of AD, was higher in persons with pre-diabetes as compared with NGT, while Aβ burden in persons with type 2 diabetes was similar to NGT. Post hoc exploratory analyses showed that use of diabetes medications was related to lower brain Aβ, providing reason to speculate that the lower Aβ seen in type 2 diabetes compared with pre-diabetes could be explained by effects of medication use. Given the cross-sectional nature of our study, the observation that diabetes medication use is related to lower brain Aβ is hypothesis generating, and no causal inferences can be made.
Our secondary outcomes were related to type 2 diabetes as hypothesized. Type 2 diabetes was related to worse neurodegeneration, cerebrovascular disease, and memory performance as compared with NGT.
Type 2 diabetes and its antecedent, pre-diabetes, are strong risk factors for CVD [3]. It is increasingly accepted that cerebrovascular disease interacts with AD pathology to cause dementia [1], and this seems a likely mechanism that links type 2 diabetes to dementia due to AD. However, type 2 diabetes may promote brain Aβ accumulation [29] or impaired clearance [30], but a causal association of type diabetes with AD has not been proven. Studies addressing this issue are conflicting. Neuropathology studies from Finland [5, 10] and the United States [4 , 14] found that type 2 diabetes history was not related to higher AD neuropathology. However, a study of Japanese-Americans found that type 2 diabetes is associated with increased AD neuropathology, [6] and a Japanese autopsy study found that increased glycemia 10 years before autopsy was related to increased AD neuropathology [7]. A study from the Mayo Clinic Study of Aging in the US among 749 persons without dementia and a mean age of 79 years reported that type 2 diabetes was related to an AD brain metabolism pattern on Fluorodeoxyglucose PET, but not with brain Aβ ascertained by PET [11]. The Baltimore Longitudinal Study of Aging [14] found among 197 persons with autopsy at age 88 years that glucose assessed approximately at age 66 was not related to AD neuropathology. The same study had data on 53 subjects with Aβ PET at age 79 years and found no evidence of a relation of type 2 diabetes and brain Aβ. The Atherosclerosis Risk in Communities Study reported that type 2 diabetes was not related to Aβ positivity among 346 participants with a mean age of 75.8 years [13]. A study in the Alzheimer’s Disease Neuroimaging Initiative (ADNI) among 816 persons with a mean age of 74.3 years reported that type 2 diabetes was not associated with in vivo Aβ in PET or cerebrospinal fluid (CSF), but type 2 diabetes was associated with higher tau in CSF, and lower cortical thickness [12]. Another analysis from ADNI relating diabetes status to CSF and cortical Aβ found that persons with diabetes had lower cerebral Aβ in anterior cingulate, precuneus, and temporal lobe than persons with diabetes, and higher levels of CSF Aβ1–42 [31]. Reasons for the discrepancy in the results between these studies and ours is that our study was conducted in a younger age group, differentiated pre-diabetes and NGT among those without type 2 diabetes, and examined intermediate levels of Aβ in addition to examining levels traditionally considered positive.
Few studies have examined the potential relation of diabetes treatment with AD pathology. A recent analysis of data from 900 participants in ADNI who underwent lumbar puncture with a mean age of 73.54 years [32] showed that persons with untreated diabetes had higher biomarkers of AD in CSF (phosphorylated-tau, total-tau, and phosphorylated-tau/Aβ1–42 levels) than the euglycemic, pre-diabetes, and treated diabetes groups, and these subjects also had a faster progression to dementia. As compared with our study, the ADNI analyses focused on CSF biomarkers, primarily tau, in participants in their seventies, whereas our study focused on brain Aβ and neurodegeneration ascertained with brain imaging in a cohort that is almost 10 years younger. As in our study, the main diabetes treatment reported by participants was metformin.
We believe that a major issue with studies examining the association of diabetes with AD is that they have been conducted in persons in the 8th and 9th decades of life, who are subject to selection bias and survival bias related to type 2 diabetes related morbidity and mortality, without complete type 2 diabetes category ascertainment, and subject to the fact that Aβ accumulation plateaus in older subjects and those with cognitive impairment [33], which could preclude observing differences between comparison groups when examined late in the lifespan. We believe that our study overcame these limitations by examining a late middle-aged cohort, in whom Aβ accumulation is not plateauing and is accumulating, with ascertainment of type 2 diabetes categories and glycemia, Aβ, neurodegeneration, CVD, and cognitive function.
Our findings clearly support neurodegeneration and CVD as in vivo neuropathologic correlates of glycemia and type 2 diabetes, and show that these associations are already evident in late middle age. Our finding that prediabetes, but not type 2 diabetes, is associated with increased Aβ burden, was contrary to our hypothesis, and requires further discussion. One clear difference between persons with pre-diabetes and type 2 diabetes is that persons with diabetes are treated with agents that decrease glycemia and persons with pre-diabetes are not. We found that diabetes treatment was related to lower Aβ in post-hoc exploratory analyses. We cannot infer that diabetes treatment is causing the lower Aβ because diabetes treatment itself could be a proxy for another related factor, and because of the cross-sectional nature of our study. The most common type 2 diabetes medication reported in our sample was metformin. Animal and cell culture studies examining the effect of metformin on Aβ have shown conflicting results, some showing an increase in Aβ [34, 35], but metformin has also been found to prevent Aβ accumulation and memory impairment in Alzheimer’s (APP/PS1) mice [36]. Another potential implication of our finding is that diabetes treatment could lower Aβ levels, not just prevent its accumulation, assuming that amyloid levels in persons with type 2 diabetes were similar to those with pre-diabetes before they were treated. One study in db/db mice, a model of hyperglycemia due to obesity and insulin resistance, showed that chronic treatment of db/db mice with glucose lowering drugs including metformin, glibenclamide (a sulfonylurea) and insulin significantly decreased Aβ influx across the blood-brain barrier (BBB) [37]. Insulin, but not metformin or sulfonylurea, the two most reported glucose lowering medications in our study, increased Aβ efflux across the BBB. This particular study does not support the notion that metformin or sulfonylureas lower Aβ through efflux across the BBB, but more studies are needed to examine mechanisms by which glucose lowering medications could lower insoluble Aβ. It is possible that our unexpected findings for pre-diabetes and diabetes treatment are chance findings. However, there are several arguments against this possibility. First, the comparison of vascular and metabolic variables across diabetes categories showed expected differences (e.g., higher BMI and lipid and blood pressure medication use in persons with pre-diabetes and diabetes). Second, we observed that APOE ɛ4 is clearly related higher Aβ burden using our operationalization of Aβ burden, providing face validity for our Aβ measure. Lastly, the relations of diabetes and glycemia with neurodegeneration, cerebrovascular disease, and memory performance followed the expected pattern.
The study’s main limitation is the cross-sectional design. We cannot infer causality. Another relative limitation is the restriction to urban Hispanics in New York City who are able to undergo brain imaging, and the results may not be generalizable to other populations. However, the fact that APOE ɛ4 is related to Aβ as reported in non-Hispanic populations [24], suggests that our results may be generalizable. The relatively high prevalence of pre-diabetes and type 2 diabetes in our sample is similar to that reported for Hispanics nationally [3]. Lastly, we did not report on tau, another important hallmark of AD along with Aβ and neurodegeneration [23], which has been related to type 2 diabetes [12, 32] in biomarker studies. We are currently implementing tau PET in the same participants (NCT03389100) and will report results once we achieve a sample size comparable to the present study.
In conclusion, pre-diabetes, but not diabetes, is related to higher Aβ burden in late middle age, while type 2 diabetes is related to worse neurodegeneration, CVD, and memory. Our results need to be replicated in other cohorts. Whether type 2 diabetes treatment or other factors related to type 2 diabetes account for the lower Aβ in persons with diabetes requires further study.
