
Abstract
Background:
Coordinated calcium influx upon neuronal depolarization activates pathways that phosphorylate CaMKII, ERKs, and the transcription factor CREB and, therefore, expression of pro-survival and neuroprotective genes. Recent evidence indicates that amyloid-β protein precursor (AβPP) is trafficked to synapses and promotes their formation. At the synapse, AβPP interacts with synaptic proteins involved in vesicle exocytosis and affects calcium channel function.
Objective:
Herein, we examined the role of AβPP in depolarization-induced calcium-mediated signaling using acute cerebral slices from wild-type C57bl/6 mice and AβPP–/– C57bl/6 mice.
Methods:
Depolarization of acute cerebral slices from wild-type C57bl/6 and AβPP–/– C57bl/6 mice was used to induce synaptic signaling. Protein levels were examined by western blot and calcium dynamics were assessed using primary neuronal cultures.
Results:
In the absence of AβPP, decreased pCaMKII and pERKs levels were observed. This decrease was sensitive to the inhibition of N- and P/Q-type Voltage Gated Calcium Channels (N- and P/Q-VGCCs) by ω-conotoxin GVIA and ω-conotoxin MVIIC, respectively, but not to inhibition of L-type VGCCs by nifedipine. However, the absence of AβPP did not result in a statistically significant decrease of pCREB, which is a known substrate of pERKs. Finally, using calcium imaging, we found that down regulation of AβPP in cortical neurons results in a decreased response to depolarization and altered kinetics of calcium response.
Conclusion:
AβPP regulates synaptic activity-mediated neuronal signaling by affecting N- and P/Q-VGCCs.
INTRODUCTION
Alzheimer’s disease (AD) is a neurodegenerative disorder characterized by extracellular deposition of amyloid plaques, intracellular accumulation of neurofibrillary tangles, and synapse and neuronal cell loss [1]. Among these neuropathological features, loss of synapses and neuronal death correlate best with cognitive impairment and severity of AD [2, 3]. Several studies have shown that amyloid-β protein precursor (AβPP) is expressed both at the presynaptic and postsynaptic compartment [4–7]. Furthermore, it has been shown that AβPP and its proteolytic fragments are involved in synapse formation and stability, dendritic spine formation, synaptic transmission, neurite outgrowth, motility and development, and learning and memory [8–12]. Some of these functions may be mediated through, for example, the interaction of AβPP intracellular domain with proteins expressed on pre-synaptic vesicles such as the vesicular SNARE Vamp2/Vamp1 and several Ca2+ sensors [8, 13–15], the interaction of AβPP with neurotransmitter receptors such as NMDA receptors [7], the interaction of secreted AβPP derived from α-secretase activity with GABABR1a [16] and with the p75 Neurotrophin Receptor [17]. In-trans interaction between presynaptic and postsynaptic AβPP may also play a role in the synaptic functions of AβPP [11, 19]. In support, there is evidence that AβPP knockdown or over expression affects calcium homeostasis, which plays an integral role in synaptic neurotransmission. Specifically, it has been shown that AβPP knockdown in cortical neurons decreased basal intracellular calcium levels and accelerated the kinetics in the decay of agonist-induced Ca2+ responses [20]. Consistent with that, AβPP over expression has been shown to alter both the expression and the activity of L-type Voltage Gated calcium Channels (L-VGCCs) [21, 22].
Several
studies have revealed dysregulations in almost all
the important aspects of calcium homeostasis by over expression
or down regulation of wild type or mutant AβPP or presenilin1 [23–29]. For
example, it has been shown that AβPP-deficient cells had elevated
resting levels of Ca2+ in the endoplasmic reticulum
(ER) and exhibited delayed translocation of STIM1
to Orai1 upon ER Ca2+ store depletion [27]. Oules
et al. have shown that cytosolic Ca2+ signaling
is increased in AβPPswe- and AβPP695-expressing SH-SY5Y
neuroblastoma cells, due to increased
Ca2+ release through IP3R and RyR and to elevated
ER Ca2+ passive leakage. Noteworthy, this alteration
was associated with increased expression of RyR [30]. Lopez
et al. have shown that resting free Ca2+ concentration ([Ca2+]i) was greatly
elevated in neurons from 3xTg-AD and AβPPswe mouse strains when compared with their respective non-transgenic neurons [31]. Furthermore, it has been shown that AβPPswe transgenic mice (AβPPswe mutation increases 3–4 times the production of amyloid-β (αβ) peptides) are characterized by increased frequency of spontaneous Ca2+ oscillations in the hippocampus as compared to wild type [32]. Regular neuronal activity is invariably associated with mobilization of intracellular calcium which subsequently activates signaling pathways that support neuronal survival [33, 34]. More specifically, neuronal depolarization-induced calcium entry through VGCCs activates the calcium/calmodulin-dependent protein kinase (CaMK) and Ras/MAPK pathways, which lead to induction of CREB-mediated transcription of survival genes including brain-derived neurotrophic factor (BDNF) and neuronal nitric oxide synthase.
Previously [35], we have shown that down regulation of AβPP in neuroblastoma cells results in an increase in cytosolic free calcium levels and thus in the upregulation of calcium signaling. To further elucidate the role of AβPP in Ca2+-dependent signaling pathways, we compared depolarization-induced activation of important kinases, such as ERKs and CaMKII, in cortical brain slices of wild-type C57bl/6 mice (WT) and AβPP–/– C57bl/6 mice (AβPP–/–). We also compared the levels of pCREB, a known target of pERKs, and the kinetics of calcium upon depolarization. Our data indicate that knockout of AβPP causes a statistically significant decrease in depolarization-induced phosphorylation of both CaMKII and ERKs without affecting the levels of pCREB. This decrease was found to be mediated through a decrease in N- and P/Q-type VGCCs (N- and P/Q-VGCCs) whereas L-VGCC activity seems to remain similar between WT and AβPP–/– mice. Finally, calcium imaging revealed a decrease in the amount of calcium entering the cytoplasm after depolarization as well as alterations in the kinetics of calcium influx in AβPP–/– primary cortical neurons as compared to WT.
MATERIALS AND METHODS
Animal care
In this study we used AβPP–/– mice (B6.129S7-Apptm1Dbo/J) purchased from The Jackson Laboratories (Bar Harbor, ME, USA). All animal procedures were carried out according to the Greek Law 56/2013, in conformity with European Union guidelines. Animals were used at ages of 6–9 months.
Perfusion of cortical slices
WT or AβPP–/– male mice were anaesthetized with chloroform and decapitated. Following decapitation, the brain was quickly removed, and the cortex was isolated into ice-cold cutting solution composed of 2.14 mM KCl, 2.2 mM MgSO4, 2 mM CaCl2, 27 mM NaHCO3, 1.47 mM NaH2PO4, 10 mM HEPES, pH 7.4 10 mM glucose, and 200 mM sucrose. Transverse cortical slices, 400μm in thickness, were prepared using a McILWAIN Tissue Chopper (Mickle laboratory engineering Co. Ltd, Ontario, Canada), placed in perfusion chambers and continuously perfused in standard artificial cerebrospinal fluid (ACSF) for 1 h at 37°C, at a flow rate of 3 ml/min. The standard ACSF was composed of 126 mM NaCl, 3.5 mM KCl, 1 mM MgSO4, 2 mM CaCl2, 26 mM NaHCO3, 1.25 mM NaH2PO4, 10 mM HEPES, pH 7.4, and 10 mM glucose, and bubbled with 95% O2/5% CO2 (carbogen gas). The slices were then exposed to conditions of depolarization in the absence/presence of calcium channels inhibitors. Experiments were terminated by the removal of the perfusion medium and the addition of ice-cold stop ACSF solution containing the phosphatase inhibitors NaF (100 mM) and Na3VO4 (100μM) for 10 min at 4°C. Tissue viability was tested with detection of PARP (data not shown) to estimate the rate of apoptosis that was found to be insignificant.
Primary neuronal cultures
At E16, pregnant WT mice were sacrificed by cervical dislocation and fetuses were removed under sterile conditions, placed in ice cold PBS and kept on ice for microscopic dissection of cortices. After digestion with 0.125% trypsin (Sigma-Aldrich, St. Louis, MO, USA) in calcium, magnesium-free PBS containing 5μg/ml DNAse at 37°C for 20 min, the cells were suspended in Neurobasal medium (Gibco BRL, Grand Island, NY, USA) and plated on cover slips (25 mm) previously coated with poly-D-lysine (0.1 mg/ml) (Sigma-Aldrich) in 35 mm plates (Greiner bio-one, Cellstar, Kremsmuenster, Austria), at a density of 5×10⁵ cells, in a 5% CO2 humified incubator at 37°C.
Infection with recombinant lentiviruses
The recombinant lentiviruses expressing the shRNA for AβPP were purchased from Sigma-Aldrich. The target sequence is in the coding region of the APP gene (CCGGGCCATCTTTGACCGAAACGAACTCGAGTCGTTTCGGTCAAAGATGGCTTTTT). 48 h after the infection of primary cortical neurons the levels of AβPP were reduced by 56% as assayed by western blot.
Western blot analysis
Cortical slices were homogenized in lysis buffer containing 50 mM Tris, pH 7.5, 50 mM NaCl, 2 mM EDTA, 1% SDS, protease and phosphatase inhibitors, both purchased from Roche (Basel, Switzerland) at room temperature and then heated at 100°C for 45 min. Cellular debris were removed by centrifugation and supernatant was collected for analysis. Tissue and cell lysates were subjected to SDS-polyacrylamide gel electrophoresis (SDS PAGE), transferred to nitrocellulose membranes, and probed with polyclonal anti-pERKs (Cat#9101, dilution, 1 : 1000), anti-pCREB (Cat#9198, dilution, 1 : 1000), anti-pCaMKII (Cat#3361, dilution, 1 : 1000), anti-total ERKs (Cat#9102, dilution, 1 : 1000), or anti-total CaMKII (Cat#4032, dilution, 1 : 1000) antibodies, purchased from Cell Signaling (Danvers MA, USA). All membranes were stripped and reprobed with an anti-actin monoclonal antibody (Cat#MAB1501, dilution, 1 : 2000) purchased from EMD Millipore (Temecula, CA, USA). Full-length AβPP levels were detected using the R1(57) polyclonal antibody as previously described [34]. Bound antibodies were detected using anti-mouse conjugated with HRP from EMD Millipore (Cat#AP124P, dilution 1 : 2500) and anti-rabbit conjugated with HRP from Jackson ImmunoResearch (Cat#111035003, dilution, 1 : 2500; West Grove, PA, USA). For the quantitation of the results we determined the density of the bands of pERKs and total ERKs, pCaMKII and total CaMKII, and pCREB and actin, by densitometry and then we calculated the ratios of pERKs versus total ERKs, pCaMKII versus total CaMKII, and pCREB versus actin, respectively. The ratios were used to determine the percent change.
Live Ca2+ imaging
For live Ca2+ imaging, 6-day-old post dissection WT mouse cortical neurons were incubated with 2μM Mag-Fluo4 in culture medium for 30 min at 37°C, then returned to culture medium and incubated for 1 h at room temperature. Just before Ca2+ measurements, cells were washed 3 times with microscopy buffer (135 mM NaCl, 5.9 mM KCl, 1.2 mM MgCl2, 1.5 mM CaCl2, 11.6 mM HEPES, pH 7.4 11.5 mM Glucose) and positioned on the microscope stage. Fluorescence images were obtained at 345 nm excitation and 488 nm emission by using a Carl Zeiss Microscope (Carl Zeiss Microscopy GmbH, Germany) equipped with a cooled charge-coupled device (CCD) camera (PTI-IC200) (Princeton Instruments, Trenton, NJ, USA). At the end of each experiment, the signals of Mag-Fluo4 were calibrated with the sequential addition of 10μM Ionomycin (Interchim, Montlucon, France), 1% Triton, and 25 mM EGTA to obtain the maximum and minimum fluorescence. Images were acquired every 800 ms and cells were analyzed using the region of interest tool, to extract the fluorescence ratios. Changes in Ca2+ were determined using the ZEN Software for temporal analyses of single cells to express the data as fluorescence ratios. The baseline fluorescence was determined at the beginning of each experiment. The results were normalized in relation to the baseline fluorescence and the data were expressed as a percent of increase relative to baseline.
Statistical analysis and presentation of the results
Statistical analysis was performed using the student’s t test in Microsoft Excel. Values are indicated as mean±Standard Error of the Mean (SEM). Differences were considered as significant when p < 0.05 (*p < 0.05; **p < 0.01; ***p < 0.001) and the exact p value is indicated on the figure or in the figure legends. For calcium kinetics, we used the non-parametric Mann-Whitney U-test. Using the Levene test, the variances of the two samples were found equal. Thus, the degrees of freedom (d.f.) were calculated using the equation d.f. = 2n–2, where n is the number of observations in each group. The number of independent measurements (n) in each experimental condition are indicated in the figure legend.
RESULTS
Most of the experiments were performed in cortical brain slices continuously perfused at a rate of 3 ml/min. It is considered that perfusion of brain slices at this rate prevents accumulation of AβPP metabolic products in the neuronal environment, thus limiting their biological effects. Therefore, the obtained results are considered to represent the effects of the full-length AβPP.
KCl-induced neuronal depolarization in perfused cortical slices increased phosphorylation of both ERKs and CREB
First, using the perfusion experimental protocol, we searched for the optimal conditions of inducing activation of ERKs and CREB following neuronal depolarization by increased concentrations of KCl. KCl-induced neuronal depolarization results in the opening of VGCCs and influx of extracellular calcium, which subsequently causes the activation of signaling pathways (e.g., ERKs), some of which activate transcription factors, such as CREB. Following depolarization of cortical slices for 5 min in the presence of 25, 45, or 60 mM KCl, protein extracts were analyzed by western blot for pERKs and total ERKs (Fig. 1A) and pCREB and actin (Fig. 1C). Quantification of the results indicates increased phosphorylation of ERKs and CREB in the presence of the highest concentrations of KCl (Fig. 1B, D). The highest increase in the phosphorylation of ERKs was detected at 45 mM KCl (146.59% , ***p = 0.0002 compared to control) and was accompanied by the highest inhibition, of 26.43% , by the L-VGCC inhibitor nifedipine (107.85, &&p = 0.0016 compared to 45 mM KCl treated). The highest increase in the phosphorylation of CREB was detected at 45 mM KCl (137.35% , *p = 0.012 compared to control) and was accompanied by the highest inhibition of 23.26% by the L-VGCC inhibitor nifedipine (105.40, &p = 0.027 compared to 45 mM KCl treated).

Depolarization of perfused cortical slices results in increased pERKs and pCREB levels. Protein extracts from perfused untreated control cortical slices and cortical slices depolarized for 5 min with 25 mM, 45 mM, or 60 mM KCl in the absence/presence of nifedipine, from wild type (WT) mice, were analyzed by western blot using the relevant antibodies. A) detection of pERKs and total ERKs, and C) detection of pCREB and actin. The results shown in 1A and 1C are representative of three independent experiments. The westerns blots from these experiments were used to quantify the ratio of the densitometry values of pERKs to total ERKs, and of pCREB to actin. These ratios were used to calculate the percent increase in pERK and pCREB compared to control, which is expressed as Mean±SEM. B) The weighted values of pERKs: Control 100.00±0; 25 mM KCl, 131.04±3.65, *p = 0.014 compared to control; 25 mM KCl + nifedipine 109.31±0.65, &p = 0.034 compared to 25 mM KCl; 45 mM KCl, 146.59±0.66, ***p = 0.0002 compared to control; 45 mM KCl + nifedipine, 107.85±00.92, &&p = 0.0016 compared to 45 mM KCl; 60 mM KCl, 139.8±4.1, *p = 0.01 compared to control; 60 mM KCl + nifedipine, 129.96±2.8, p = 0.1 compared to 60 mM KCl. D) The weighted values of pCREB: control 100.00±0; 25 mM KCl, 114.43±3.32 *p = 0.049 compared to control; 25 mM KCl+nifedipine, 104.65±1.41 p = 0.074 compared to 25 mM KCl; 45 mM KCl, 137.35±4.21 *p = 0.012 compared to control; 45 mM KCl + nifedipine, 105.40±3.74 &p = 0.027 compared to 45 mM KCl; 60 mM KCl, 132.07±2.02 **p = 0,0039 compared to control; 60 mM KCl + nifedipine, 112.48±8.59, p = 0.099 compared to 60 mM KCl.
The experiments above indicated that depolarization of cortical slices with 45 mM KCl for 5 min is sufficient to study the role of AβPP in transmitting synaptic signals to ERKs and CREB.
Knockout of AβPP causes a significant decrease in depolarization-induced phosphorylation of CaMKII and ERKs but not of CREB
As shown in Fig. 1, depolarization with 45 mM KCl activates ERKs. CaMKII is thought to be the immediate activator of ERKs, which once activated phosphorylate the transcription factor CREB [34, 35]. The activated pCREB sequentially induces the transcription of immediate early genes important for neuronal survival. In order to assess the effect of AβPP knockout on the stimulation of CaMKII, ERK, and CREB phosphorylation, cortical slices from WT or AβPP–/– mice were depolarized for 5 min with 45 mM KCl. Protein extracts from cortical slices were analyzed by western blot using antibodies against pERKs, total ERKS, pCaMKII, total CaMKII, pCREB, or actin (Fig. 2A). We did not observe significant differences in pERKs, pCaMKII, or pCREB between wild type AβPP and AβPP–/– mice under basal conditions (data not shown). Quantification of the results indicates that depolarization of cortical slices from WT mice resulted in a statistically significant increase in the levels of pERKs (Fig. 2C, 176.60% , ***p = 1.28E–05 compared to control), pCaMKII (Fig. 2E, 138.73% , ***p = 6.36E–06 compared to control), and pCREB (Fig. 2G, 131.89% , **p = 0.0074 compared to control). However, the percent increase in pERKs (Fig. 2C, 134.52% , # #p = 0.0014 compared to control), pCaMKII (Fig. 2E, 126.64% , # #p = 0.0005 compared to control), and pCREB (Fig. 2G, 119.22% , p = 0.23 compared to control) following depolarization of cortical slices from AβPP–/– mice was lower than that of cortical slices from WT mice. This decrease was statistically significant for pERKs (Fig. 2D, ***p = 0.00063) and pCaMKII (Fig. 2F, **p = 0.0013) but not for pCREB (Fig. 2H, p = 0.098). Knockout of AβPP was verified by western blot analyses of protein extracts from WT and AβPP–/– mice using an antibody against AβPP (Fig. 2B). In all subsequent experiments, knockdown of AβPP was verified (data not shown).
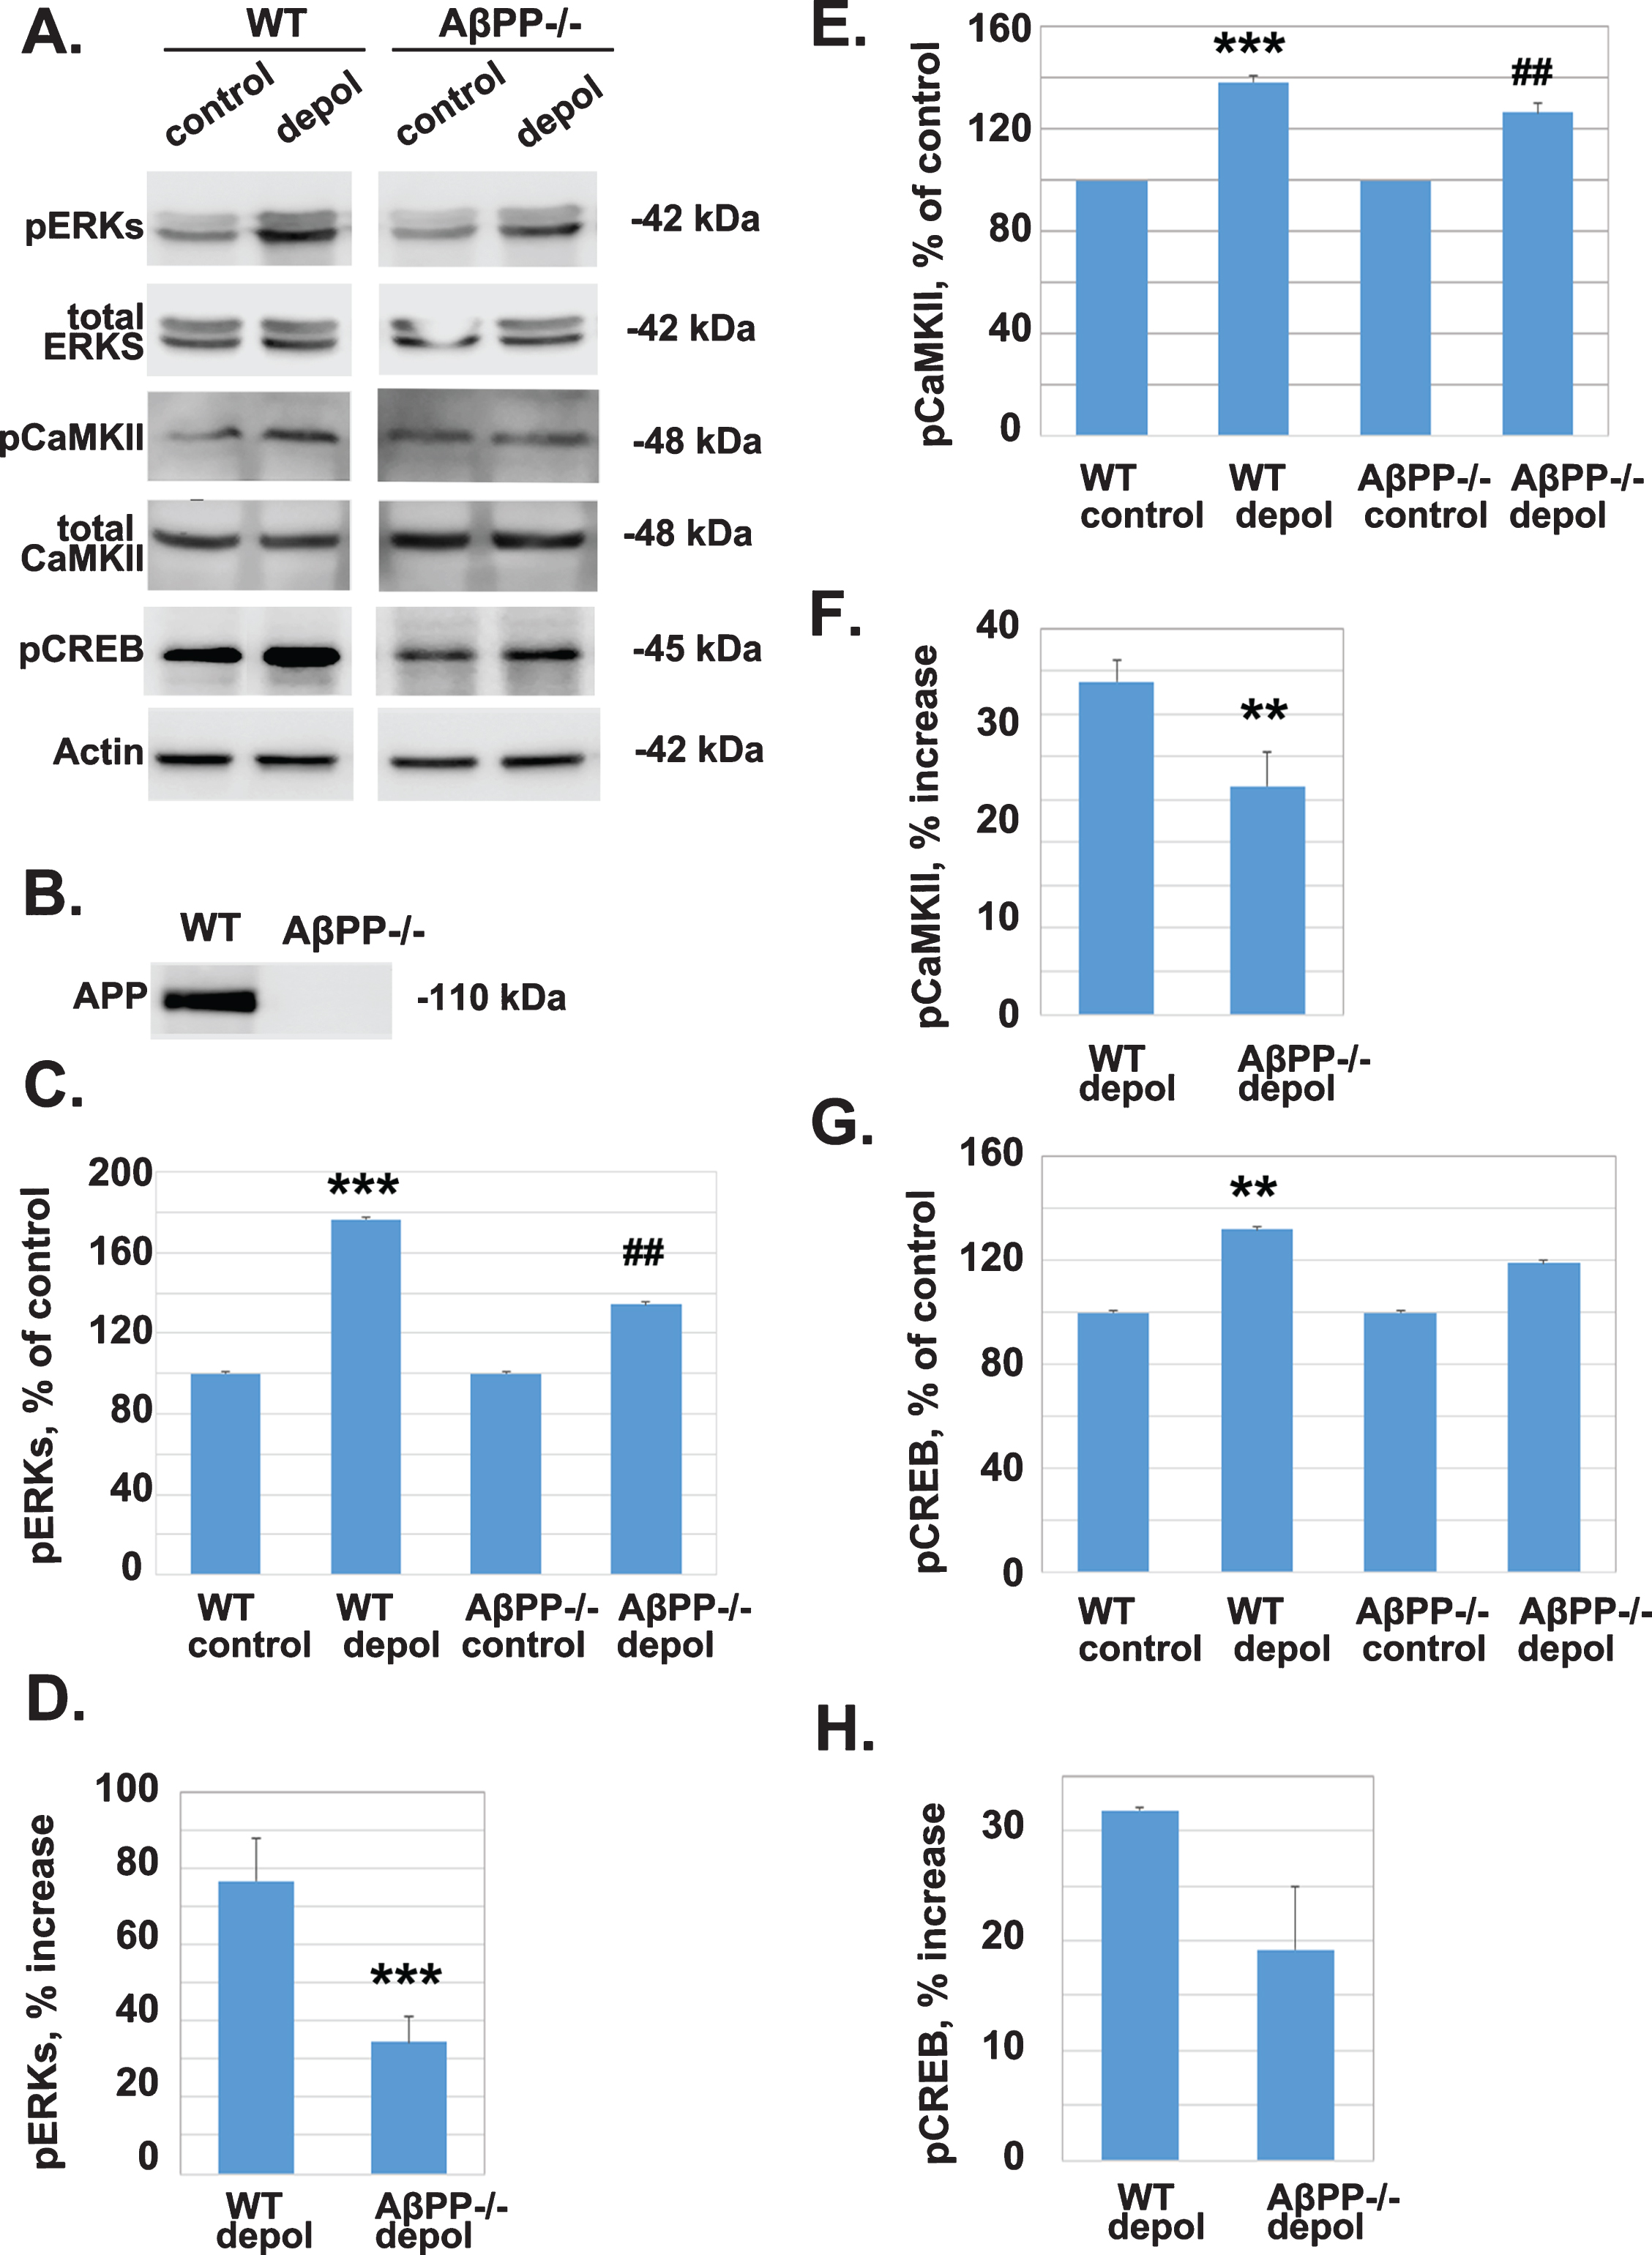
The absence of AβPP reduces significantly the depolarization-induced increase in the levels of pERKs and pCaMKII (activation) but not of pCREB. A) Protein extracts from perfused untreated cortical slices and cortical slices depolarized for 5 min with 45 mM KCl, from WT and AβPP–/– mice were analyzed by western blot using antibodies against pERKs, total ERKs, pCaMKII, total CaMKII, pCREB, and actin. B) Protein extracts from perfused untreated cortical slices from WT and AβPP–/– mice were analyzed by western blot using an antibody against AβPP. Western blot data were quantified by densitometry and the levels of phosphoproteins were normalized for the levels of the corresponding total proteins or actin and the percent increase was calculated. The values are presented as Mean±SEM. C) The weighted values of pERKs after densitometry: Control untreated, 100.00±0; WT depolarization treated, 176.6±6.34, ***p = 1.28E–05 compared to control; AβPP–/– control untreated, 100±0; AβPP–/– depolarization treated, 134.52±6.77, # #p = 0.0014 compared to control. D) Plot for the comparison of pERKs percentage of increase between WT (76.6±10.95% ) and AβPP–/– (34.52±6.85% ) with independent two sample T-test (***p = 0.00063, n = 9). E) The weighted values of pCaMKII after densitometry: WT control untreated, 100±0; WT depolarization treated, 138.73±2.64, ***p = 6.36E–06; AβPP–/– untreated, 100±0; AβPP–/– depolarization treated, 126.64±3.94, # #p = 0.0005. F) Plot for the comparison of pCaMKII percentage of increase between WT (38.73±2.64% ) and AβPP–/– (26.64±3.94% ) with independent two sample T-test (p = 0.00133, n = 7). G) The weighted values of pCREB after densitometry: WT control untreated, 100±0; WT depolarization treated, 131.89±0.28, **p = 0.0074; AβPP–/– control untreated, 100±0; AβPP–/– depolarization treated 119.22±5.64, p = 0.239. H) Plot for the comparison of pCREB percentage of increase between WT (31.89±0.28% ) and AβPP–/– (19.22±5.64% ) with independent two sample T-test (p = 0.09799, n = 3).
AβPP does not affect the sensitivity of pERKs to L-VGCC activity
As we already showed in Fig. 1, L-VGCCs mediate calcium influx following depolarization with 45 mM KCl and the subsequent activation of signaling molecules, since nifedipine reduced effectively the phosphorylation of both ERKs and CREB. Thus, we hypothesized that the absence of AβPP may affect the activity of L-VGCCs and consequently the calcium-dependent phosphorylation of kinases. To test this hypothesis, we compared the effect of nifedipine, a selective inhibitor of L-VGCC, on depolarization induced phosphorylation of ERKs in cortical slices from WT and AβPP–/– mice. Protein extracts of slices, perfused in the absence/presence of nifedipine, were analyzed by western blot (Fig. 3A). Quantification of the results after densitometry indicates that depolarization of cortical slices from WT or AβPP–/– mice resulted in a statistically significant increase in pERKs (Fig. 3B, WT: 170.26% ±6.50, **p = 0.008; AβPP–/– : 117.09±3.75, p = 0.08). Treatment with nifedipine resulted in a decrease in the depolarization-induced increase in pERKs (Fig. 3B, WT: 120.37±4.78, &&p = 0.0012; AβPP–/– : 92.68±3.90, p = 0.051). Then, we compared the percent decrease of pERKs levels between WT and AβPP–/– . No statistically significant difference was observed (Fig. 3C, p = 0.144).
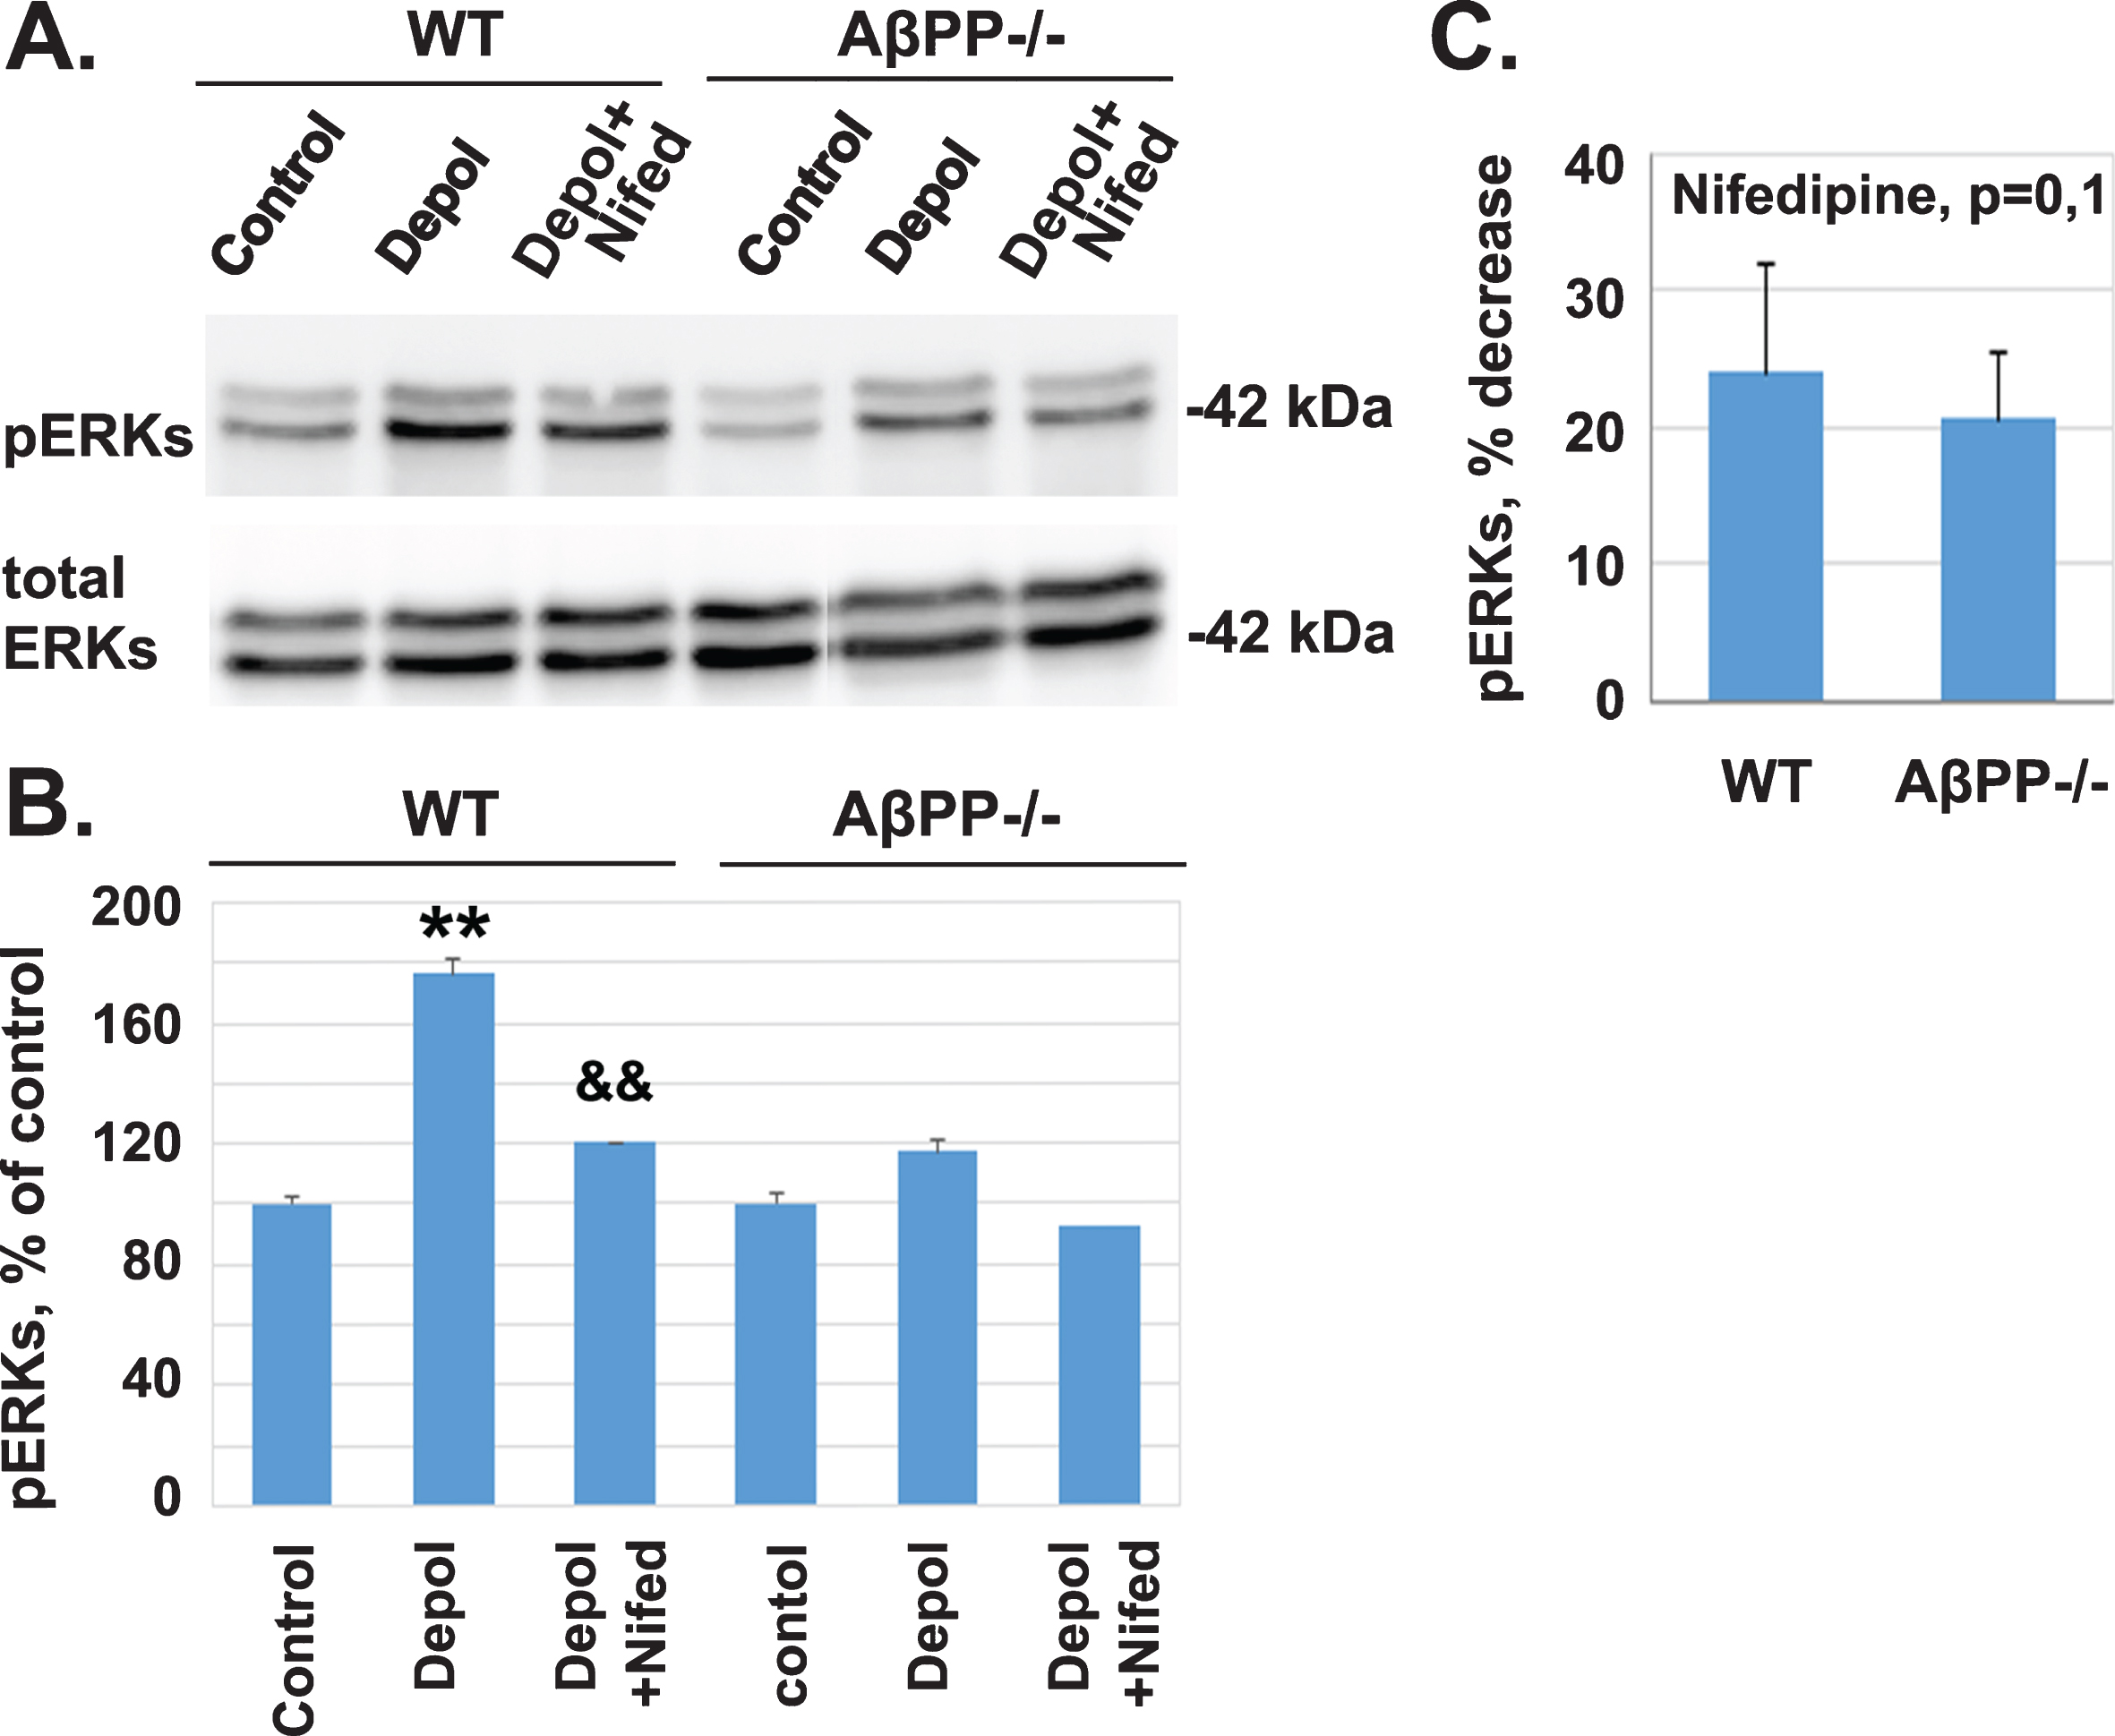
Inhibition of L-VGCCs with nifedipine results in a comparable decrease of the depolarization-induced phosphorylation of ERKs in slices from wild type and AβPP–/– C57bl/6 mice. A) Protein extracts from untreated cortical slices and cortical slices depolarized for 5 minutes with 45 mM KCl, in the absence or presence of nifedipine, from wild type (WT) and AβPP–/– mice were analyzed by western blot using antibodies against pERKs and total ERKs. B) The weighted values of pERKs after densitometry are expressed as Mean±SEM: WT untreated control, 100.00±0; WT depolarization treated, 176.11±2.83, **p = 0.0014; WT depolarization + nifedipine treated, 120.37±4.78, &&p = 0.0012, compared with WT depolarization treated; AβPP–/– untreated control, 100±0; AβPP–/– depolarization treated, 117.08±3.75, p = 0.08; AβPP–/– depolarization and nifedipine treated, 92.68±3.90, p = 0.051. C) Plot for the comparison of pERKs percentage of nifedipine-mediated decrease between WT (23.94±7.95% ) and AβPP–/– (20.71±4.64% ) with independent two sample T-test (p = 0.1449, n = 3).
The decrease of pERKs (activation) in the absence of AβPP is dependent on N- and P/Q-VGCC activity
The results presented in the previous section suggest that L-VGCC activity does not mediate the decrease in the levels of pERKs in the absence of AβPP. Thus, we examined the role of other VGCCs known to be activated following neuronal depolarization such us N- and P/Q-VGCCs, using their specific inhibitors ω-conotoxin GVIA (GVIA) and ω-conotoxin MVIIC (MVIIC), respectively. Protein extracts from cortical slices under control conditions and cortical slices after depolarization with and without the above inhibitors were analyzed by western blot using antibodies against pERKs and total ERKs (Fig. 4A).
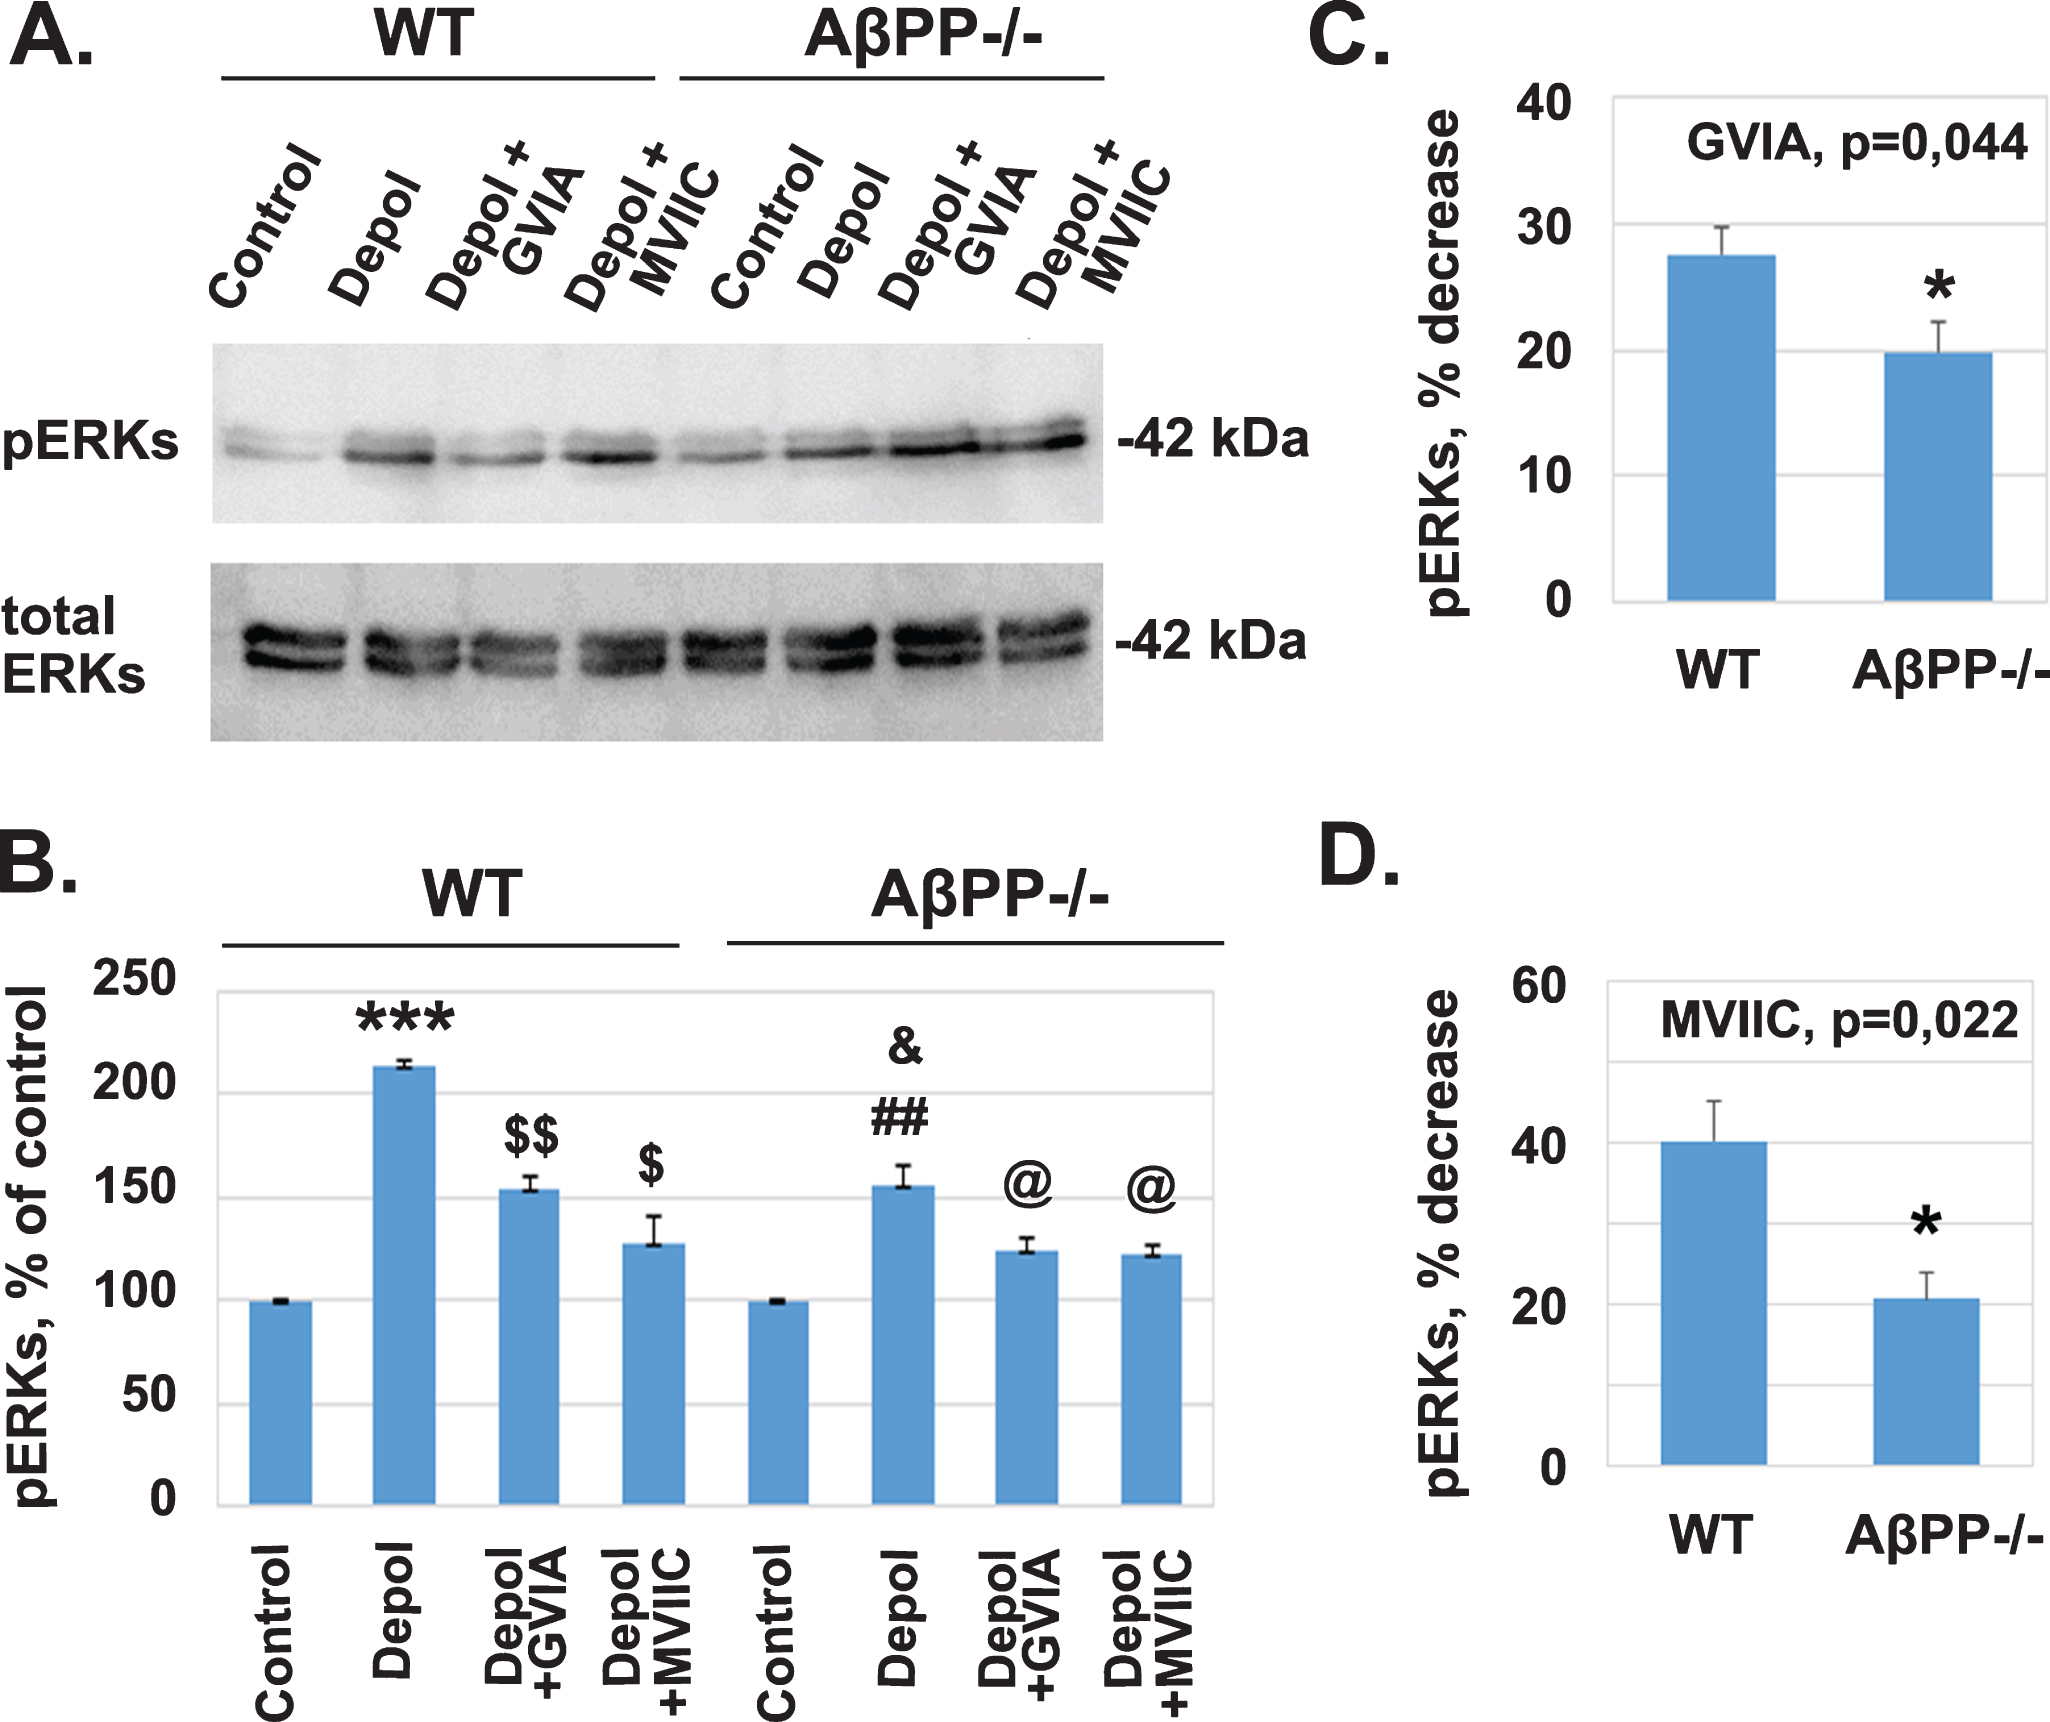
The absence of AβPP reduces the activity of N- and P/Q-VGCCs. A) Protein extracts from perfused untreated cortical slices and cortical slices depolarized for 5 min with 45 mM KCl were analyzed by western blot using antibodies against pERKs and total ERKs. B) The weighted values of pERKs after densitometry are expressed as Mean±SEM: Wild type (WT) untreated control, 100±0; WT depolarization treated, 213.92±1.78, ***p = 0.000245 compared to untreated control; WT depolarization treated + GVIA, 154.99±5.55, $$p = 0.0047 compared to depolarization treated; WT depolarization treated + MVIIC 128.27±12.05, $p = 0.014 compared to depolarization treated; AβPP–/– untreated, 100±0; AβPP–/– depolarization treated, 155.96±9.09, # #p = 0.0014 compared to untreated control; AβPP–/– depolarization treated + GVIA, 124.86±6.16, @p = 0.025 compared to depolarization treated; AβPP–/– depolarization treated + MVIIC, 123.30±2.87, @p = 0.041 compared to depolarization treated. C) Plot for the comparison of pERKs percentage of decrease after the addition of GVIA between WT (27.57±2.06% ) and AβPP–/– (19.78±2.41) mice with independent two sample T-test (*p = 0.044, n = 3). D) Plot for the comparison of pERKs percentage of decrease after the addition of MVIIC between WT (40.12±5.12% ) and AβPP–/– (20.56±3.39% ) mice with independent two sample T-test (*p = 0.022, n = 3). The experiment shown is representative of 3 independent experiments.
In this set of experiments, again it was confirmed that the response of the WT slices was significantly different from the response of AβPP–/– slices (Fig. 4B, &p = 0.033). Treatment with GVIA resulted in a decrease in the depolarization-induced increase in pERKs (Fig. 4B, WT: 154.99±5.55, $$p = 0.0047 compared to depolarization treated; AβPP–/– : 124.86±6.16, @p = 0.025 compared to depolarization treated). The percent decrease in WT was 27.57±2.07 and that in AβPP–/– 19.77±2.41, and the difference between them was statistically significant at *p = 0.044 (Fig. 4C).
Treatment with MVIIC resulted in a decrease in the depolarization-induced increase in pERKs (Fig. 4B, WT: 128.27±12.05, $p = 0.014 compared to depolarization treated; AβPP–/– : 123.30±2.87, @p = 0.041 compared to depolarization treated). The percent decrease in WT was 40.12±5.12 and that in AβPP–/– 20.56±3.39, and the difference between them was statistically significant at *p = 0.022 (Fig. 4D).
Downregulation of AβPP decreases depolarization-induced calcium influx
To assess the activity of VGCCs in the absence or in the presence of AβPP, we used the calcium imaging technique described in Materials and Methods. Cortical neurons from WT mice and cortical neurons transduced with a lentivirus carrying AβPP shRNA were depolarized by the addition of 60 mM KCl. Figure 5A indicates that transduction of cortical neurons with lentivirus carrying AβPP shRNA resulted in significant decrease in the levels of AβPP. In this setup, we measured the increase in [Ca+2]i and we calculated the kinetics of depolarization such as the time required for peak and the time required for 30% recovery to [Ca+2]i basal levels and the mean values of all the above parameters are presented in Fig. 5B. Figure 5C and D show the real time average response to depolarization of cortical neurons from WT mice (Fig. 5C) and cortical neurons in which AβPP is knocked down (AβPP-KD) (Fig. 5D). The calculation of the percentage of increase in [Ca+2]i shows that in WT neurons the amount of calcium entering the cytoplasm after depolarization is higher compared to AβPP-KD (Fig. 5E). Additionally, a statistically significant delay for [Ca+2]i to reach a peak was detected after the addition of KCl in AβPP-KD neurons as compared to WT (Fig. 5F). Consistent with the last result, there is an increase in the time required for 30% recovery to basal levels of cytoplasmic calcium after depolarization in AβPP-KD neurons compared to WT but this difference was not statistically significant (Fig. 5G).
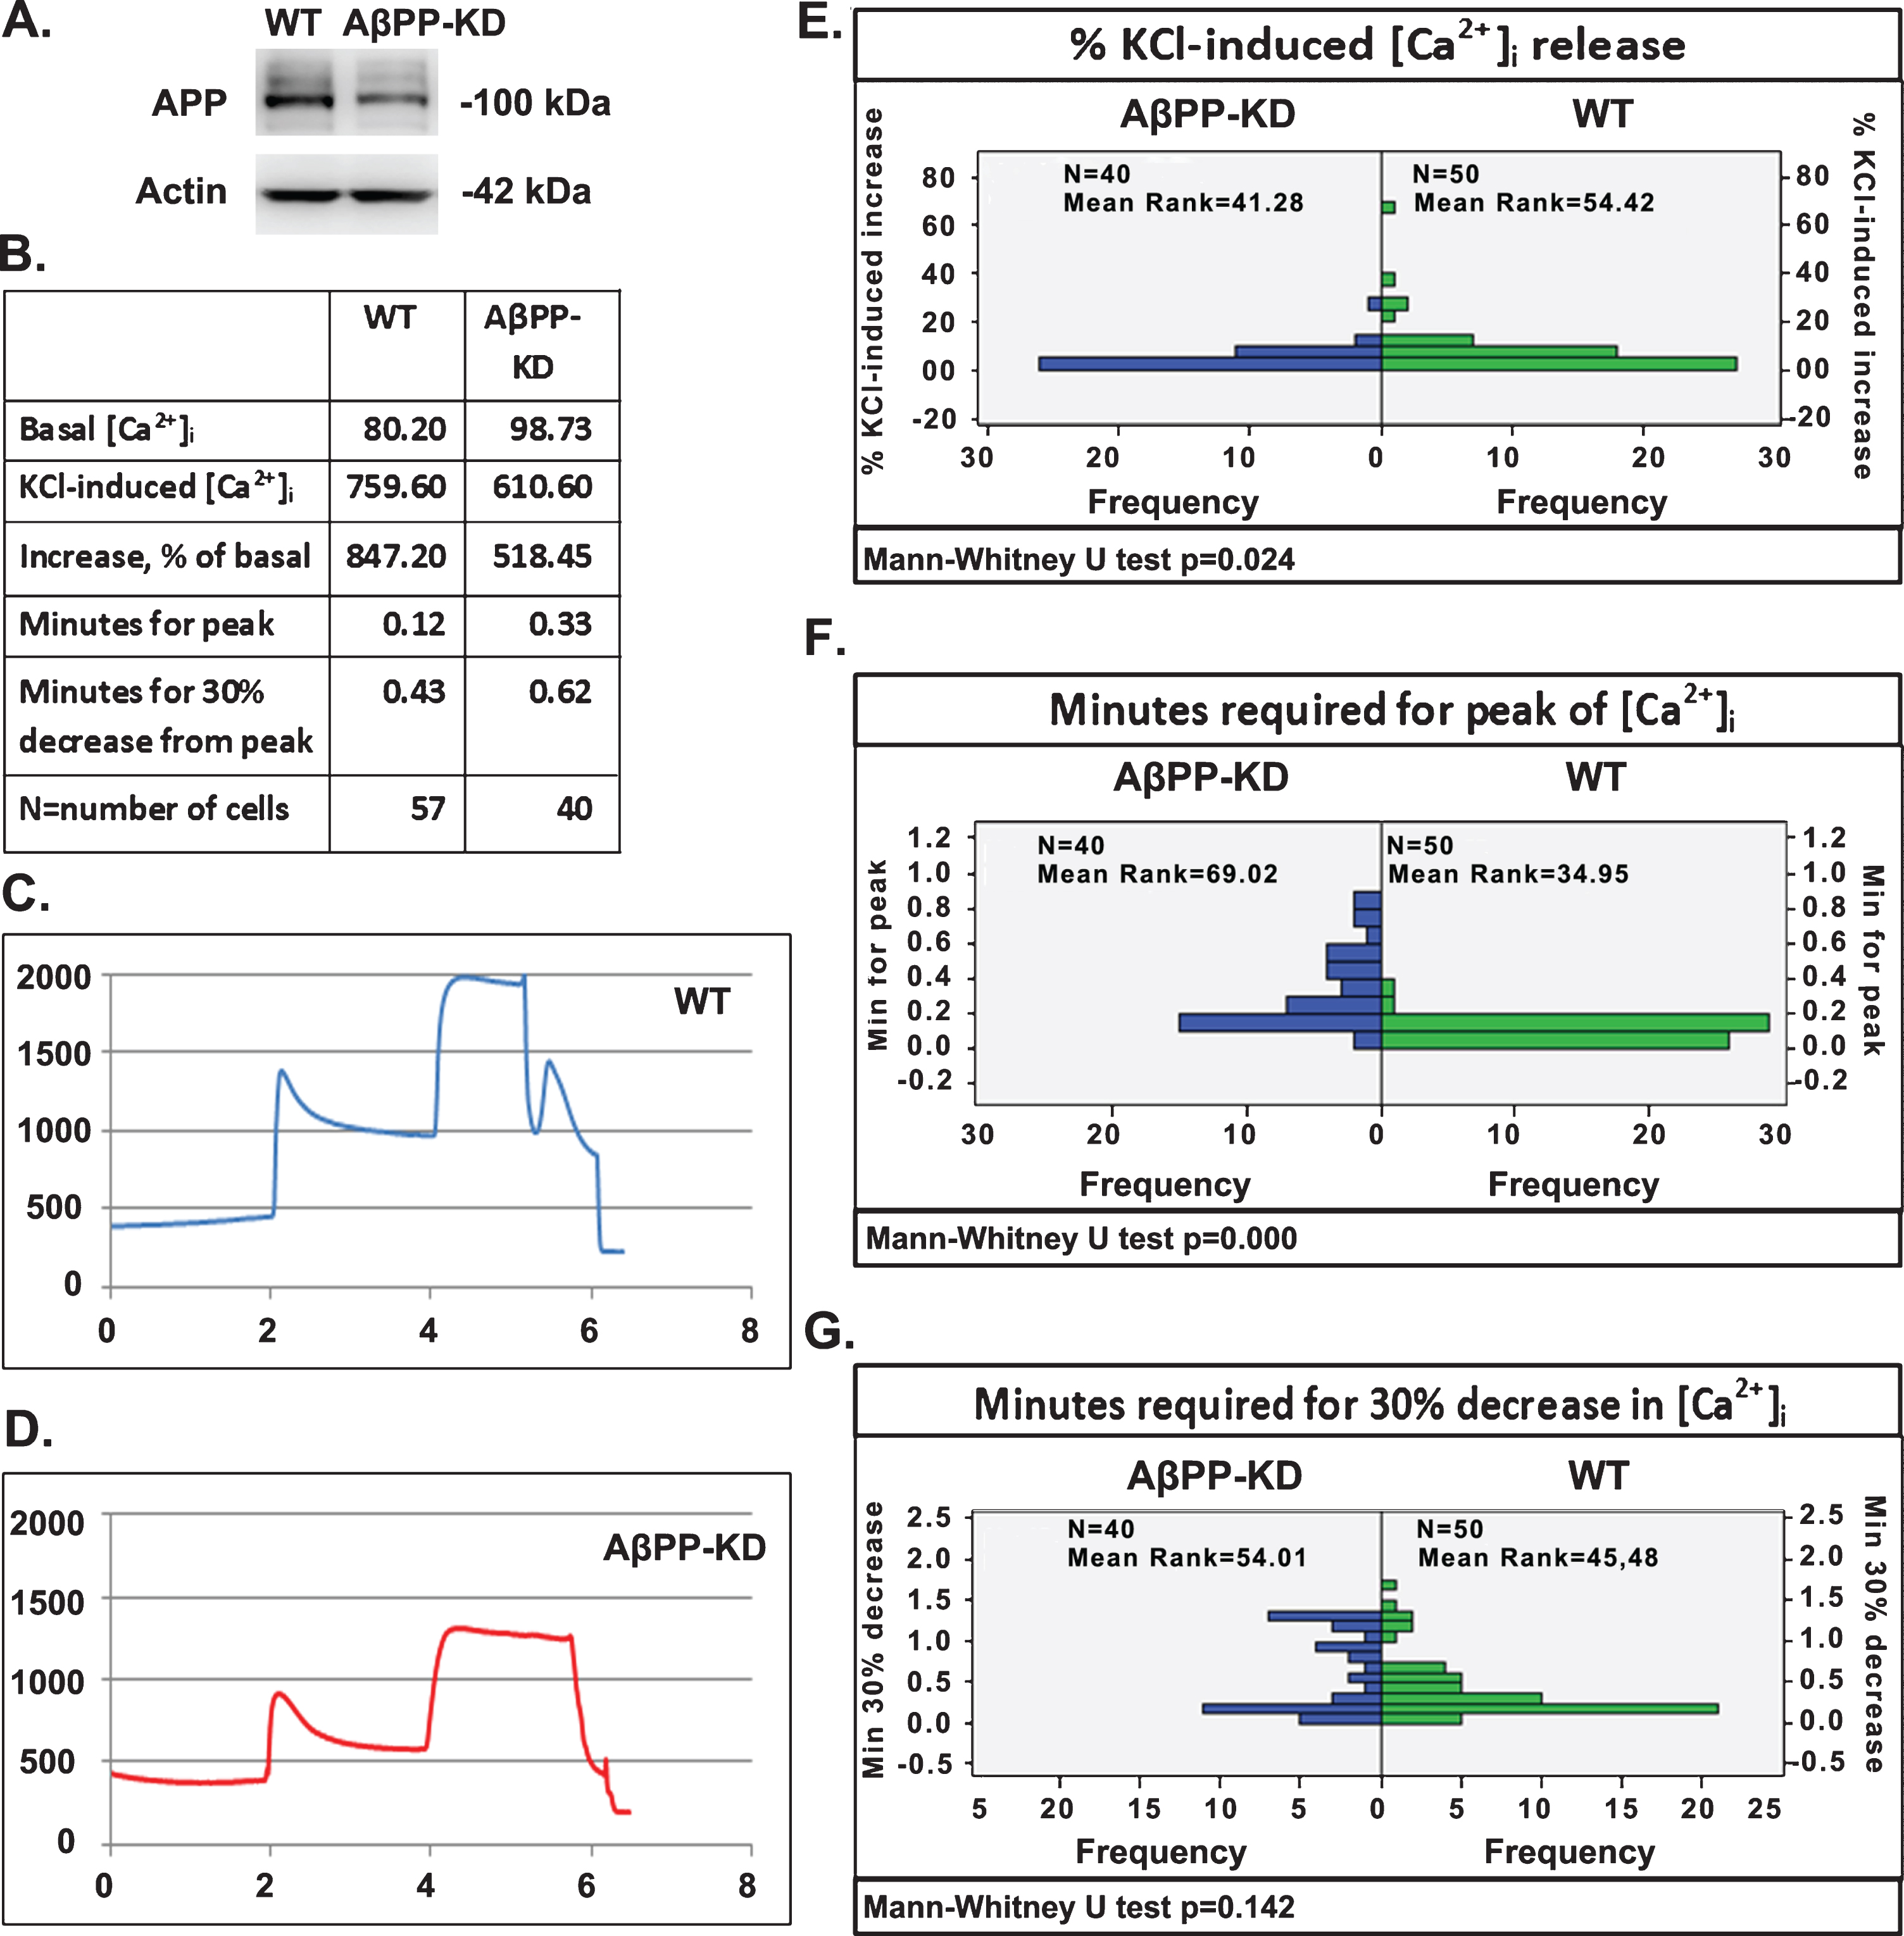
Downregulation of AβPP causes significant changes in the concentration and/or kinetics of calcium influx after depolarization with 60 mM KCl. A) Extracts of primary cortical neurons non-transduced or transduced with a lentiviral vector carrying an shRNA that targets the APP gene were analyzed by western blot using the R1(57) polyclonal antibody raised against the AβPP C-terminus or an anti-actin antibody. B) Quantified mean values of [Ca+2]i in wild type and AβPP knocked down (AβPP-KD) neurons, the percentage of increase after depolarization, the time required for peak after depolarization with KCl, and the time required for 30% decrease after depolarization peak. C, D) Representative graphs showing the response of cortical neurons from WT and AβPP-KD cells respectively, to 60 mM KCl. E) Plot for the non parametric (Mann-Whitney U Test) comparison of [Ca+2]i increase after depolarization between WT cortical neurons and AβPP-KD cortical neurons (p = 0.024). F) Plot for the non parametric (Mann-Whitney U Test) comparison of time required for peak after depolarization between WT and AβPP-KD cortical neurons from (p = 0.000). G) Plot for the non parametric (Mann-Whitney U Test) comparison of time required for 30% recovery after depolarization, between WT and AβPP-KD cortical neurons (p = 0.142).
DISCUSSION
Since 1987, when the gene encoding the AβPP was cloned, the function of AβPP protein is being thoroughly investigated [36, 37]. This has been a difficult task since processing of AβPP produces many AβPP fragments that affect neuronal function independently and in combination with full-length AβPP [37–39]. Knockout or over expression of AβPP does not help because they also result in the knockout or over expression of AβPP proteolytic fragments. This effort is further hampered by the existence of the AβPP like proteins APLP1 and APLP2, which may compensate for AβPP when it is down regulated [38]. Nevertheless, full length AβPP has been shown to be expressed at the presynaptic terminals and post synaptic densities and to interact with major components of the synapse including neurotransmitter receptors [4–8, 40–43]. The physical interaction of full-length AβPP with neurotransmitter receptors, L-VGCCs and other synaptic suggests that full length AβPP affects neurotransmission and calcium signaling [7, 42–47]. It has been demonstrated that expression of human AβPP in rat cortical neurons inhibits calcium oscillations by increasing L-VGCCs activity, independently from Aβ production [21]. Lassek and colleagues [4] have further shown that AβPP deletion disturbs Ca2+ homeostasis, due to a misregulation of calmodulin and neuromodulin but not of the expression of CaMKII or Ca2+ channels.
Based on the above studies, we hypothesized that AβPP plays a regulatory role in synaptic activity through the regulation of both calcium levels and signaling pathways. Importantly, neurotransmission has been shown to activate calcium-, CaMKII-, ERK2-, and CREB-mediated signal transduction pathways leading to neuroprotection [9, 33]. Therefore, maintenance of synaptic signaling could result in neuronal health and delay in neurodegenerative processes operating in AD.
In this study, we aimed at elucidating the effect of AβPP knockout in the activation of important kinases such as CaMKII, ERKs, and the transcription factor CREB, as well as the kinetics of calcium influx upon depolarization. To this end, we compared the response to depolarization of cortical slices derived from WT and AβPP–/– mice. The experiments were conducted in a continuous perfusion system that does not allow accumulation of AβPP fragments, thus limiting their contribution to the observed effects namely the phosphorylation of CaMKII, ERKs, and CREB, which were examined following 5 min of depolarization.
In order to investigate the role of AβPP in the depolarization-dependent activation of ERKs, CaMKII, and CREB, we perfused cortical slices from WT and AβPP–/– mice with ACSF containing 45 mM KCl, determined in preliminary experiments to be the most appropriate concentration. Our results indicate that the absence of AβPP inhibits the depolarization-induced increase in the phosphorylation levels of ERKs and CaMKII (Fig. 2). pCREB levels were also decreased in AβPP–/– as compared to WT mice but this decrease was not statistically significant.
These results showing that the absence of AβPP impairs synaptic transmission are supported by other studies indicating that AβPP is expressed at the synapse where it interacts with synaptic proteins including neurotransmitter receptors [7, 42–47]. They are also supported by studies indicating that AβPP is involved with calcium homeostasis and may modulated the activity calcium channels that mediate calcium influx to trigger synaptic vesicle exocytosis and activation of post-synaptic signal transduction pathways [4, 21]. Specifically, it is known that VGCCs go through a transformational change upon their opening that reveals a specific intracellular site with which calmodulin interacts. This interaction then triggers the activation of Ca/Calmodulin dependent kinases such as CaMKII [48]. It is also known that ERKs represent an immediate substrate of CaMKII and that activated pERKs then phosphorylate CREB in the nucleus [33, 49]. Our results indicate that AβPP when present maintains the physiological function of VGCCs and thus calcium-dependent activation of signaling molecules such as ERKs and CaMKII, while its absence causes a decrease in VGCC activity and the subsequent entry of calcium in the cytoplasm. In order to explain why pCREB levels do not decrease in the same way as pERKs and pCaMKII, we hypothesized that there are other signaling pathways in AβPP–/– cortical neurons which are upregulated. Such pathways could be activated by glutamate receptors and, thus, we examined whether there are alterations in the response of cortical slices from WT and AβPP–/– mice to NMDA but our results did not reveal any significant changes (data not shown). Along with changes in depolarization-induced calcium signaling other groups have shown that down regulation of AβPP in fibroblasts decreases calcium release from the ER after activation of IP3Rs [50]. Therefore, release of calcium from intracellular stores may counteract the effect of calcium entering through the VGCCs. In support, we have previously shown that down regulation of AβPP enhances ER calcium content and alters the dynamics of store operated calcium entry [35].
It has been shown that L-VGCCs selectively signal to the nucleus through the MAP kinase pathway [51]. Thus, we hypothesized that knockout of AβPP could reduce the activity of L-VGCCs and result in a decrease of calcium-dependent depolarization and thus, attenuation of pERKs. To test our hypothesis, we used nifedipine, a selective inhibitor of L-VGCCs and compared the decrease of depolarization-induced phosphorylation of ERKs between WT and AβPP–/– mice. Our results show no statistically significant change between the two groups (Fig. 3, WT = 23.94% decrease in pERKs, AβPP–/– = 20.71% decrease in pERKs). In contrast, another study [21] has indicated that deletion of AβPP alters the levels of L-VGCCs and this alteration was reversed by reintroduction of AβPP. However, in their experiments AβPP was down regulated in primary hippocampal and striatal neurons by lentiviral infection whereas we used knockout mice in which AβPP is completely absent. Furthermore, this study was conducted in primary cultures whereas our experiments were conducted in perfused cortical slices.
Since our results did not reveal any significant changes in the activity of L-VGCCs between WT and AβPP–/– mice, we investigated whether N- and P/Q-VGCCs present alterations after depolarization. For this reason, we used ω-conotoxin GVIA and ω-conotoxin MVIIC, the selective inhibitors of N- and P/Q-VGCCs, respectively. In both WT and AβPP–/– mice the presence of N- and P/Q-VGCC inhibitors caused a decrease in the levels of pERKs after depolarization. In WT mice, though, this decrease was significantly higher than in AβPP–/– mice (Fig. 4, WT = 27.57% and 40.12% decrease by GVIA and MVIIC, respectively, AβPP–/– = 19.77% and 20.56% decrease by GVIA and MVIIC, respectively). In both cases, the difference between WT and AβPP–/– was statistically significant with p values 0.044 and 0.022 for GVIA and MVIIC, respectively. Thus, we can conclude that AβPP when present maintains the activity of N- and P/Q-VGCCs and facilitates the subsequent activation of calcium-dependent signaling pathways leading to ERKs phosphorylation, whereas it does not have the same effect on L-VGCC activity.
Eventually, we used the more sensitive technique of calcium imaging and measured both the amount and the kinetics of calcium entering the cytoplasm upon depolarization with KCl, in WT and AβPP-KD primary cortical neurons. To verify that lentiviral infection with shRNA effectively down regulates AβPP, we used immunocytochemistry. Transduction with a lentiviral vector carrying an shRNA that targets AβPP, resulted in a decrease in the expression of the protein by 56% (Fig. 5A). Our results revealed a significantly higher increase in [Ca2+]i after depolarization in WT cortical neurons as compared to AβPP-KD. Additionally, down regulation of AβPP caused a statistically significant increase in the time required for [Ca2+]i to reach a peak after depolarization (Fig. 5). Our previous work [35] has shown that down regulation of AβPP enhances ER calcium content and alters the dynamics of store operated calcium entry. Taken together with the data showing decreased activity of N- and P/Q-VGCCs in AβPP–/– cortical slices, the calcium imaging results could suggest that the absence of AβPP deregulates the electrophysiological properties of calcium channels and subsequently down regulates calcium signaling. Focusing on AβPP, other groups [52] have shown that transgene suppression of AβPP in a mouse model of AD restores the abnormalities caused by AβPP over expression, and not by Aβ overproduction, and thus normalizes the ratio of excitatory and inhibitory signals in the cortex.
Conclusion
Our study reveals a novel role of full-length AβPP in the regulation of synaptic signaling possibly by modulating calcium channel activity. Given that synaptic transmission provides neurotrophic signaling our results suggest that AβPP mutations and other factors may cause or predispose to AD by altering the synaptic interactome of AβPP and its regulatory effect on synaptic transmission