
Abstract
Background:
While sex hormones are essential for normal cognitive health, those individuals with greater endocrine dyscrasia around menopause and with andropause are more likely to develop cognitive loss and Alzheimer’s disease (AD).
Objective:
To assess whether circulating sex hormones may provide an etiologically significant, surrogate biomarker, for cognitive decline.
Methods:
Plasma (n = 152) and serum (n = 107) samples from age- and gender-matched AD and control subjects from the Wisconsin Alzheimer’s Disease Research Center (ADRC) were analyzed for 11 steroids and follicle-stimulating hormone. Logistic regression (LR), correlation analyses, and recursive partitioning (RP) were used to examine the interactions of hormones and hormone ratios and their association with AD. Models generated were then tested on an additional 43 ADRC samples.
Results:
The wide variation and substantial overlap in the concentrations of all circulating sex steroids across control and AD groups precluded their use for predicting AD. Classification tree analyses (RP) revealed interactions among single hormones and hormone ratios that associated with AD status, the most predictive including only the hormone ratios identified by LR. The strongest associations were observed between cortisol, cortisone, and androstenedione with AD, with contributions from progesterone and 17β-estradiol. Utilizing this model, we correctly predicted 81% of AD test cases and 64% of control test cases.
Conclusion:
We have developed a diagnostic model for AD, the Wisconsin Hormone Algorithm Test for Cognition (WHAT-Cog), that utilizes classification tree analyses of hormone ratios. Further refinement of this technology could provide a quick and cheap diagnostic method for screening those with AD.
Keywords
INTRODUCTION
Following menopause, and during andropause, the contribution of sex steroids from the peripheral circulation to the brain decreases dramatically. In addition to these age-related declines in circulating sex steroids, those individuals with cognitive decline display even lower circulating sex steroid concentrations compared with age-matched controls [1–3]. In this respect, a negative correlation with AD has been demonstrated for serum estradiol (E2) in women [1] and testosterone (T) in men [2, 3]. Conversely, as might be expected given the negative feedback regulation of sex steroids on the hypothalamus and pituitary, a positive correlation exists between serum gonadotropins in both women and men with AD [2–9]. Thus, the more dysregulated the hypothalamic-pituitary-gonadal (HPG) axis, the more likely an individual is to develop AD. In this respect, brain sex steroid concentrations are decreased in women with AD compared to age-matched controls [10]. Similarly, women with AD have lower brain levels of estrogens and androgens after 80 years of age compared to age-matched controls [11]. These changes appear to be progressive, since in men aged 60–79, brain levels of T are lower in cases with mild neuropathological changes as well as with advanced AD neuropathology [11]. Together these results suggest that those individuals with a lower capacity to synthesize steroids are more likely to develop cognitive deficits and exhibit impairment sooner. Conversely, individuals with a higher steroid synthetic capacity post-menopause and during andropause are more likely to be spared the senescent changes induced by low sex steroid concentrations [12, 13]. Thus, changes in circulating sex hormones may provide an etiologically significant, surrogate biomarker for cognitive decline. To test this hypothesis, we measured the concentrations of circulating sex hormones in plasma and serum samples from AD and age-matched control subjects. Given the wide variations in the concentrations of circulating hormones between individuals, and that there are complex interrelationships between the hormones in the HPG axis, we hypothesized that interactions between the hormones of this axis might provide increased predictability for AD. We therefore utilized a classification tree analysis that we have previously demonstrated is an efficient and powerful exploratory tool for uncovering molecular interactions associated with disease etiology [14, 15]. We report here the development of a diagnostic model based on ratios of circulating steroid concentrations that correctly identifies 81% of the AD population.
METHODS
Plasma and serum samples
Plasma (n = 152) and serum (n = 107) samples from age-matched male and female AD and control patients were obtained from the Wisconsin Alzheimer’s Disease Research Center (ADRC), Madison, WI (http://www.adrc.wisc.edu). Blood samples were collected between 8:00 and 10:00 a.m. after an overnight (12–14 h) fast. Plasma samples were collected in 9 mL heparin tubes, inverted 8–10 times, centrifuged at 1700 g at 4°C for 15 min., and then aliquoted into 0.5 mL micro centrifuge tubes. Serum samples were collected in 9 mL tubes with a poly clot activator, allowed to clot for 30 min., centrifuged at 1700 g at 4°C for 10 min., and then aliquoted into 0.5 mL microcentrifuge tubes. Both types of samples were frozen immediately and stored at –80°C until assayed. Number and age of participants (mean±S.D.) are described in Table 1A. All plasma and serum samples were obtained from a Caucasian population.
Sample sizes and mean ages (±S.D.) for subjects included in study. A) Plasma and serum samples used for creating models. B) Plasma samples used for testing the predictive accuracy of our models
Hormone assays
Plasma steroids were assayed by the Assay Laboratory Service of the Wisconsin National Primate Research Center (http://primate.wisc.edu/), within the UW Institute for Clinical & Translational Research, Madison, WI (https://ictr.wisc.edu). Plasma samples, standards, and quality control samples (450μL each) were diluted in ultrapurified bottled water (500μL; Fisher Scientific, Waltham, MA). Internal standards were added to each sample in the following concentrations: 50 pg d5-E2, 200 pg d9-progesterone (P4), 200 pgd5-testosterone, and 1 ng d4-cortisol. The samples were then extracted for steroids by adding methyl tert-butyl ether (1 mL; Fisher Scientific, Waltham, MA), vortexed vigorously, and incubated at room temperature for 5 min. The top organic phase containing steroids was transferred into a new tube with a glass pipette, evaporated to dryness by a stream of air in a heated water bath (60°C), and then resuspended in 100μL of ethanol and 500μL of water. A second liquid–liquid extraction was performed with dichloromethane (Fisher Scientific). The lower dichloromethane organic phase containing steroids was transferred into a clean test tube and evaporated to dryness. Samples were then resuspended in 25μL of NaHCO3 buffer and estrone (E1) and E2 were derivitized with 50μL of dansyl chloride (200 mg/mL in acetonitrile; Fisher Scientific, Waltham, MA), heated at 40°C for 4 min., and transferred into mini-vials for LC/MS/MS analysis. Samples were analyzed on a QTRAP 5500 quadruple linear ion trap mass spectrometer (AB Sciex) equipped with an atmospheric pressure chemical ionization source. The system included two Shimadzu LC20ADXR pumps and a Shimadzu SIL20ACXR autosampler. A sample of 30μL was injected onto a Phenomenex Kinetex 2.6u C18 100A, 100×2.1 mm column (Phenomenex) for separation using a mobile phase: water with 1% formic acid (Solution A) and acetonitrile with 1% formic acid (Solution B) at a flow rate of 200μL/min. Three percent Solution B was held for 3 min. followed by 50% Solution B for the next 0.10 min., then maintained for 2.9 min., followed by an increase to 67% Solution B for 15 min. and an increase to 100% Solution B over the next 3 min. This was held for 7 min. before the system was returned to initial conditions of 3% Solution B over 0.1 min. and held for the final 9.9 min. of each run. Mass spectrometer results were generated in positive-ion mode with the following optimized voltages: corona discharge current, 3 V; entrance potential, 10 V. The source temperature was 500°C. The gas settings were as follows: curtain gas, 30 psi; nebulizing gas, 20 psi; collisionally activated dissociation gas, medium. Quantitative results were recorded as multiple reaction monitoring (MRM) area counts after determination for the response factor for each compound and internal standard. Each steroid had an MRM used for quantitation and 1 or 2 additional MRMs as qualifiers. The concentrations for the calibration curve for glucocorticoids, androgens, and progestins were 3.47, 1.73, 0.87, 0.43, 0.22, 0.11, 0.054, 0.027, 0.014, 0.0068 ng/mL and for estrogens the concentrations were 1.39, 0.69, 0.35, 0.17, 0.087, 0.043, 0.022, 0.011, 0.0054, 0.0027 ng/mL. The linearity was r > 0.9990 and the curve fit was linear with 1/x weighting. None of the compounds of interest were detected in blank or double blank samples.
Serum follicle-stimulating hormone (FSH) was assayed at the Clinical Laboratories of the University of Wisconsin Hospital and Clinics, Madison, WI (http://www.uwhealth.org/lab/uw-hospital-and-clinics-lab-services/11293) using an ADVIA Centaur CP system (SIEMENS; Tarrytown, NY).The sensitivities and intra-assay coefficients of variation for steroid and FSH assays are provided in Table 2.
Assay sensitivity and intra-assay coefficient of variation (CV) for hormones assayed in plasma and serum
When steroid concentrations fell below the minimum detectable value, the minimum detectable amount was substituted for that value [16, 17]. We chose this method because we did not anticipate more bias associated with this method than has been reported for other imputation methods [18].
Data sets
Two separate data sets were created for analyses: the first included all subjects with plasma steroid data available (n = 152); the second included only those subjects for whom both plasma steroid and serum FSH data were available (n = 107). All data for a sample was removed from the data sets when any one of the hormone concentrations was greater than 5 times the standard deviation.
Analytical methodologies
Utilizing analytical methods described in our previous publications [14, 15], we examined circulating hormone concentrations and their association with AD status in well-characterized age- and sex-matched AD and control subjects from the WI ADRC (Table 1A). We first looked for significant differences among groups using single hormones that might be associated with AD status. Significant differences in circulating steroid concentrations between men and women, and between AD and control cases were identified using ANOVA, Tukey’s HSD test, and independent t-tests (where applicable) with the R statistical program, V.2.15.2 (R: A language and environment for statistical computing (program), Vienna, Austria: R Foundation for Statistical Computing, 2008). We next examined correlations between single hormones that might associate with AD status. R2 correlations between individual hormones were determined for male and female AD and control cases using SAS software, version 9 of the SAS System for Linux (SAS Institute Inc., Cary, NC). Next, we looked at the interactions among hormone concentrations that significantly associated with AD, including between single hormone concentrations, single hormones and ratios of hormone concentrations, and pairs of hormone ratios. Interactions were determined using logistic regression (LR) with SAS software, and the Wald chi-square test. All p-values or alpha levels for significance were adjusted for multiple testing using a Bonferroni correction or were generated using Tukey’s HSD test.
Finally, recursive partitioning (RP) was used to create classification trees in order to determine the way in which multiple circulating sex hormone concentrations interact to associate with AD. RP analyses included using single hormones alone, single hormones together with ratios of hormone concentrations, and hormone ratios alone. Furthermore, a RP model was created using only the hormone ratios identified by LR whose interaction with other hormone ratios significantly associated with AD. All RP analyses were completed using the R program, with package ‘rpart’ (rpart: Recursive Partitioning (program), R package version 3.1-55, 2012), based on Breiman’s classification and regression trees algorithm [19]. A 10-fold cross-validation procedure was used for pruning. The RP classification trees were then analyzed as potentially predictive models of AD.
Testing the models
In order to test the predictive power of the model(s) produced by RP analyses, an additional 43 age-matched AD and control plasma samples from the Wisconsin ADRC, Madison, WI (see Table 1B) were assayed for the 11 plasma steroids included in this study. To classify each sample as AD or control, the plasma steroid results were imputed into an algorithm generated from each RP model using the R program. This analysis was performed double-blinded in order to determine the diagnostic value of our models.
RESULTS
Circulating hormone concentrations: gender and disease state comparisons
To understand the relationship between circulating sex hormone concentrations and AD status, we analyzed 11 plasma steroids and the serum gonadotropin FSH in samples from age-matched male and female control and AD patients. Gender-based comparison identified significantly higher concentrations of P4, 17α-OH-P4, DHEA, T, and E2 in males compared with females, but higher concentrations of FSH in females compared with males. Similar results were obtained between age-matched AD males and AD females, and between age-matched control males and control females, with the exception that androstenedione, but not P4, was elevated in control males compared to control females (Fig. 1). Disease-based comparison identified significantly lower concentrations of aldosterone and androstenedione in AD subjects compared with controls, in both males and females separately and with genders combined. Additionally, significantly lower concentrations of DHEA and T were identified among AD males compared with control males, while lower concentrations of E1 were identified among AD females compared with control females (Fig. 1). The wide variation and substantial overlap in the concentrations of all circulating sex steroids across control and AD groups in both genders precluded the use of these single hormones for predicting AD.

Circulating steroid concentrations for 11 steroids measured in plasma and follicle-stimulating hormone measured in serum, for female (pink) and male (blue) AD and control patients. Significant differences among groups were identified using ANOVA, Tukey’s HSD test, and independent t-tests, and are indicated with cross-bars.
Relationship between circulating hormone concentrations
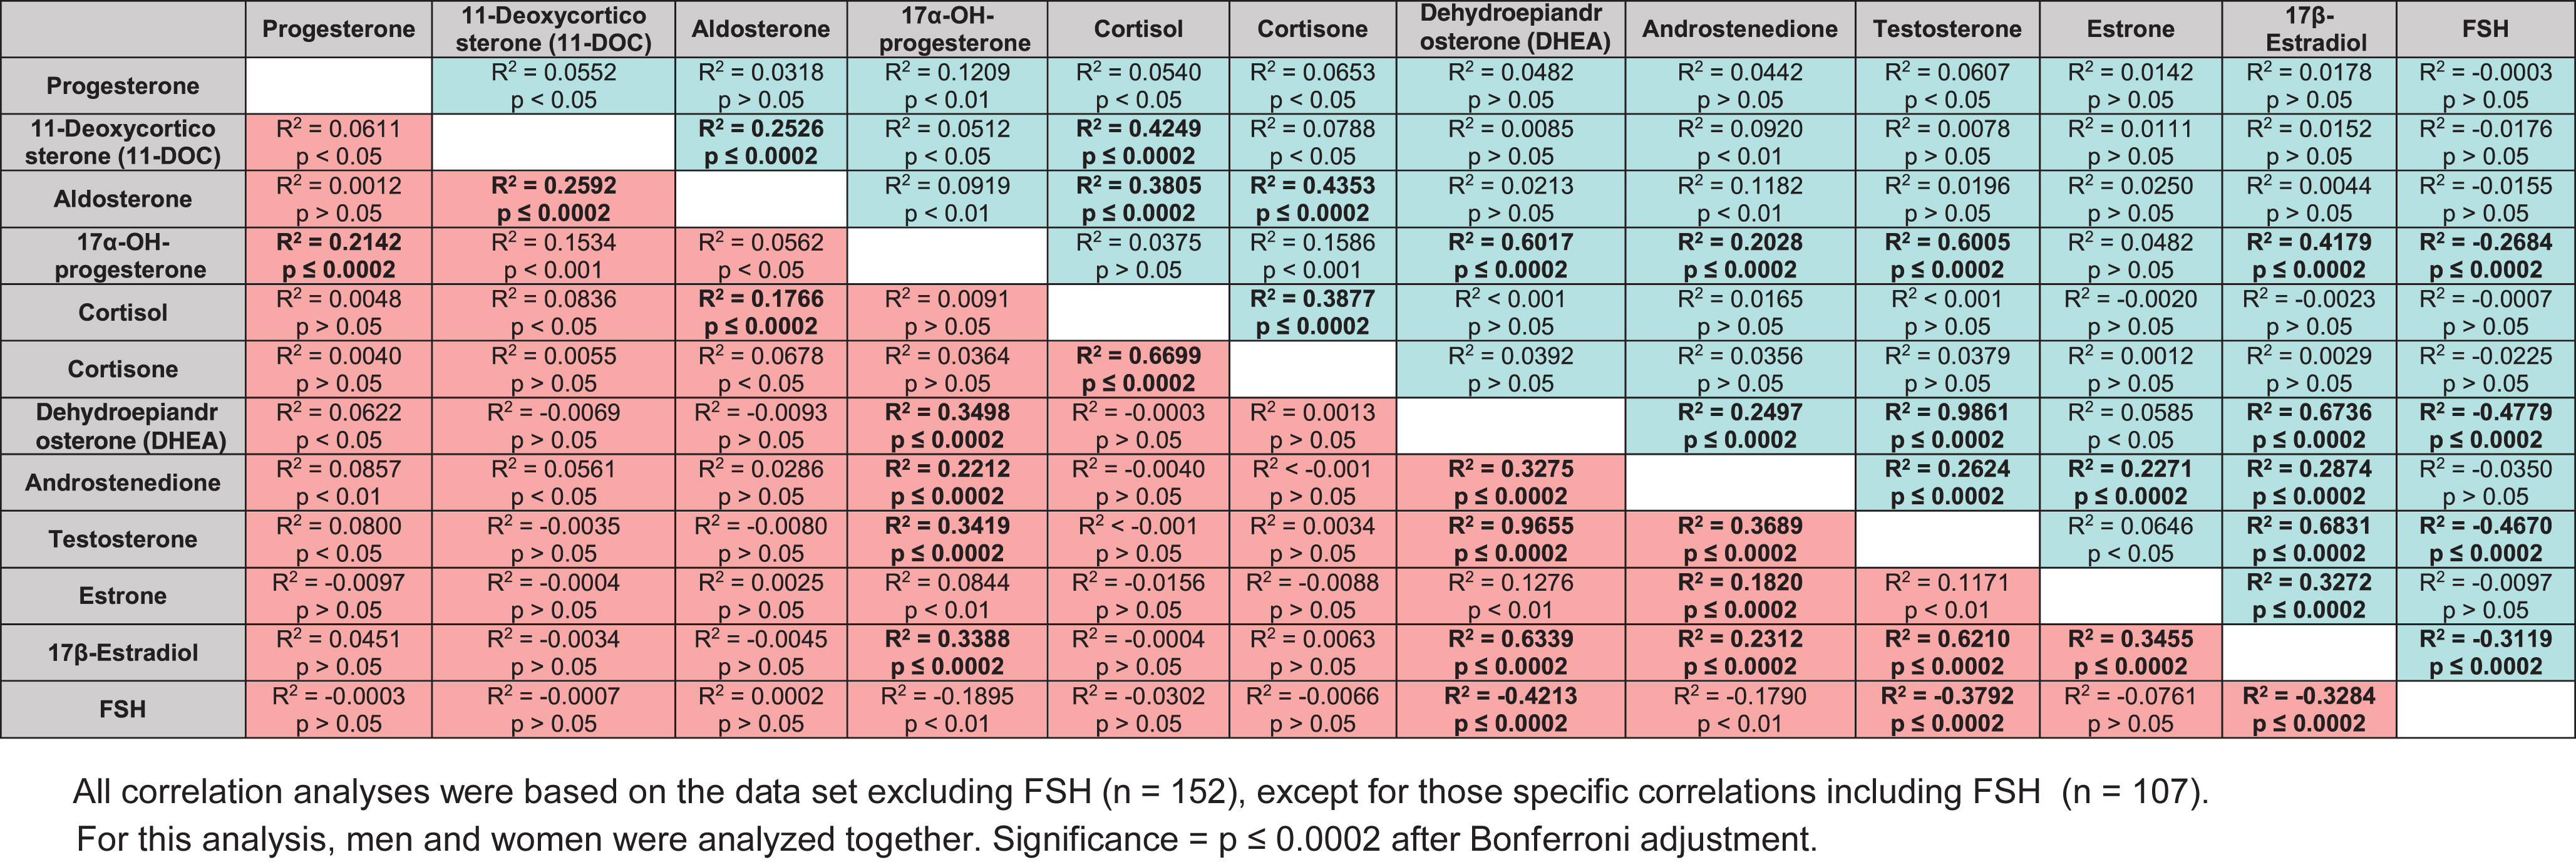
Correlation analyses were next conducted to understand the 1) relationship between the hormones of the steroidogenic pathway, and 2) differences in the flux of steroids through the pathway, between genders and disease state. Highly significant positive correlations between hormone concentrations observed in both genders included: cortisone with cortisol; DHEA, E1, and T with androstenedione; DHEA with T; both 11-DOC and cortisone with aldosterone; and E1 with E2 (Table 3A; p≤0.0002 after Bonferroni adjustment). The strongest correlation observed (R2 > 0.93) in both genders was between T and DHEA. The largest difference in correlation observed between the genders was between E2 and E1, which was much higher in women (r2 = 0.69) than in men (r2 = 0.34). Additionally, in men only significant positive correlations included: DHEA, T, androstenedione, and E2 with 17α-OH-P4; and DHEA, androstenedione, and T with E2. In women only, significant positive correlations included both 11-DOC and aldosterone with both 17α-OH-P4 and cortisol (Table 3A). A greater number of significant correlations were noted among men as opposed to women, and in general higher correlations were seen for men in situations where both genders were significantly correlated. These differences are likely attributable to the more balanced HPG axis in older men compared with older post-menopausal women. No significant negative correlations were observed between genders.
Correlations between circulating steroid concentrations, and significance of correlations in male (blue) and female (pink) subjects. All significant correlations (after adjustment) are indicated with bold type

Similar R2 values were observed across AD and control cases. Significant positive correlations between hormone concentrations observed in both AD and control cases included: both 11-DOC and cortisol with aldosterone; DHEA, androstenedione, T, and E2 with 17α-OH-P4; cortisone with cortisol; androstenedione, T, and E2 with DHEA; T, E1, and E2 with androstenedione; and T and E1 with E2 (Table 3B; p≤0.0002 after Bonferroni adjustment). Significant negative correlations observed in both AD and control cases included DHEA, T, and E2 with FSH. The strongest correlation observed (R2 > 0.96) in both AD and controls was between T and DHEA. The largest differences in correlations between control and AD were between: DHEA and T with 17α-OH-P4, which were much higher in controls versus AD (0.60 versus 0.35; and 0.60 versus 0.34, respectively); and cortisone with cortisol, which was much higher in AD (0.67 versus 0.39). Significant positive correlations identified in only control cases included 11-DOC with cortisol and aldosterone with cortisone, as well as a negative correlation between 17α-OH-P4 with FSH (Table 3B). Unlike controls, a significant positive correlation was observed in only AD cases between 17α-OH-P4 and P4. Although these correlation analyses revealed differences in the relationship between hormone concentrations among our different groups, similarities among the different groups also precluded their use for predictive purposes.
Correlations between circulating steroid concentrations, and significance of correlations in control (green) and AD (red) subjects. All significant correlations (after adjustment) are indicated with bold type
Development of a predictive algorithm for classifying AD from circulating hormone concentrations
In related studies (Hayashi et al., unpublished data), we have determined that lower circulating sex steroid concentrations are better explained by the cumulative effects of genetic alterations in steroidogenic genes than any single factor (single polymorphism). In essence, analyses of gene-gene interactions (the combined effects of multiple polymorphisms) within a discrete pathway provide far greater predictive power in determining circulating hormone concentrations. We have previously demonstrated that gene-gene interactions greatly influence association with AD [20]. These prior findings led us to examine whether multiple changes in circulating hormones might provide a better predictive index for cognitive decline than individual hormonal changes.
Consequently, we next examined whether ratios of hormones might provide a better predictive index of cognitive decline. Our rationale was based on the observation that sex steroid concentrations can vary by as much as 2–4-fold between individuals (see Fig. 1 for example), but that the ratios of sex steroids to gonadotropins for example are similar in normal controls, as might be expected due to the negative feedback regulation of sex hormone production by the HPG axis [21, 22]. However, these ratios might be skewed in individuals with lower sex steroid production capability (e.g., with aging or disease) since the loss of negative feedback by sex steroids on the hypothalamus and pituitary results in elevated pituitary gonadotropin production. This is evident in those following a unilateral orchiectomy, or other forms of hypogonadism (reviewed in [23]). Alternatively, polymorphisms in steroidogenic enzymes might prevent sufficient conversion to a steroid, thereby acting as a ‘bottleneck’. Thus, the absolute level of a sex steroid may not per se be predictive, while ratios of sex steroids may be predictive of those with a low capacity to produce steroids.
Logistic regression analyses
To test whether ratios of hormone concentrations might be more predictive of those with a low capacity to produce steroids, and therefore more likely to associate with AD than single hormone concentrations alone, we first used logistic regression to examine potential interactions among hormones that associate with AD. To accomplish this, three sets of logistic regression (LR) analyses were performed, including: 1) analysis of the interaction between single hormone concentrations (single versus single); 2) analysis of the interaction between single hormone concentrations and ratios of hormone concentrations (single versus ratio); and 3) analysis of the interaction between ratios of circulating hormones (ratio versus ratio). Logistic regression analyses revealed no significant gender interactions between hormone concentration and AD status (when corrected for multiple comparisons; data not shown). Therefore, for association analyses males and females were analyzed together. Wald chi-square values were determined.
Our single versus single LR analysis of steroids indicated no significant associations between single sex steroid concentrations and AD (data not shown). However, our single versus ratio analyses identified 12 interactions between a single hormone concentration and a ratio of hormone concentrations showing highly significant association with AD (Table 4A). Interestingly, 10 of the significant interactions included androstenedione in the ratio term, suggesting that this hormone interacts with other hormones to associate with AD. The single hormones that interacted with androstenedione ratios, showing significant association with AD, were E2, DHEA, T, 17α-OH-P4, 11-DOC, cortisone, P4, cortisol and E1 based on Wald chi-square values, in descending order (Table 4A).
Interactions between single sex steroid concentrations and ratios of sex steroid concentrations significantly associated with AD using logistic regression analysis
*Men and women were analyzed together.
The ratio versus ratio analysis of sex steroids identified 25 interactions between pairs of ratios that significantly associated with AD (Table 4B). Cortisone, cortisol, or aldosterone appeared in every combination of ratios with one exception (androstenedione/E2*E2/P4) that significantly associated with AD in this analysis. This suggests that cortisone, cortisol, and aldosterone interact with multiple hormones to significantly associate with AD. All steroids studied appeared in at least one significant ratio interaction (Table 4B).
Interactions between pairs of sex steroid concentration ratios significantly associated with AD using logistic regression analysis
*Men and women were analyzed together.
Recursive partitioning analyses
Since LR found significant interactions involving hormone concentration ratios that associate with AD, but failed to find significant interactions between single hormones alone, we examined the relationship between hormone concentration ratios and AD. Likewise, our LR analysis identified interactions among hormone ratios, but could not tell us anything about how that interaction affects AD in terms of concentration values. To determine the way in which circulating hormone concentrations and concentration ratios interact to associate with AD, a classification tree approach (recursive partitioning) was used. It was noted that none of the RP models created from the data set included FSH; therefore, only RP trees created using the dataset without FSH are shown.
Analyses of single hormone concentrations alone (Fig. 2A; Model 1) indicated that 89.2% of individuals with an androstenedione concentration <0.681 ng/mL and cortisone <23.11 ng/mL, and 90.0% of individuals with androstenedione <0.681 ng/mL, cortisone ≥23.11 ng/mL, and cortisol ≥122.0 ng/mL, and 76.5% of individuals with androstenedione ≥0.681 ng/mL, cortisone <29.44 ng/mL, and P4 ≥0.1555 ng/mL were classified as AD. Conversely, only 18.2% of individuals with androstenedione <0.681 ng/mL, cortisone ≥23.11 ng/mL, and cortisol <122.0 ng/mL, and 16.0% of individuals with androstenedione ≥0.681 ng/mL, cortisone <29.44 ng/mL, and P4 <0.1555 ng/mL, and 6.5% of individuals with androstenedione ≥0.681 ng/mL and cortisone ≥29.44 ng/mL were classified as AD (i.e., 81.8%, 84.0%, and 93.5% of individuals, respectively, were classified as controls; Fig. 2A). These and the other large splits in the classification tree suggest a high degree of predictability for AD.
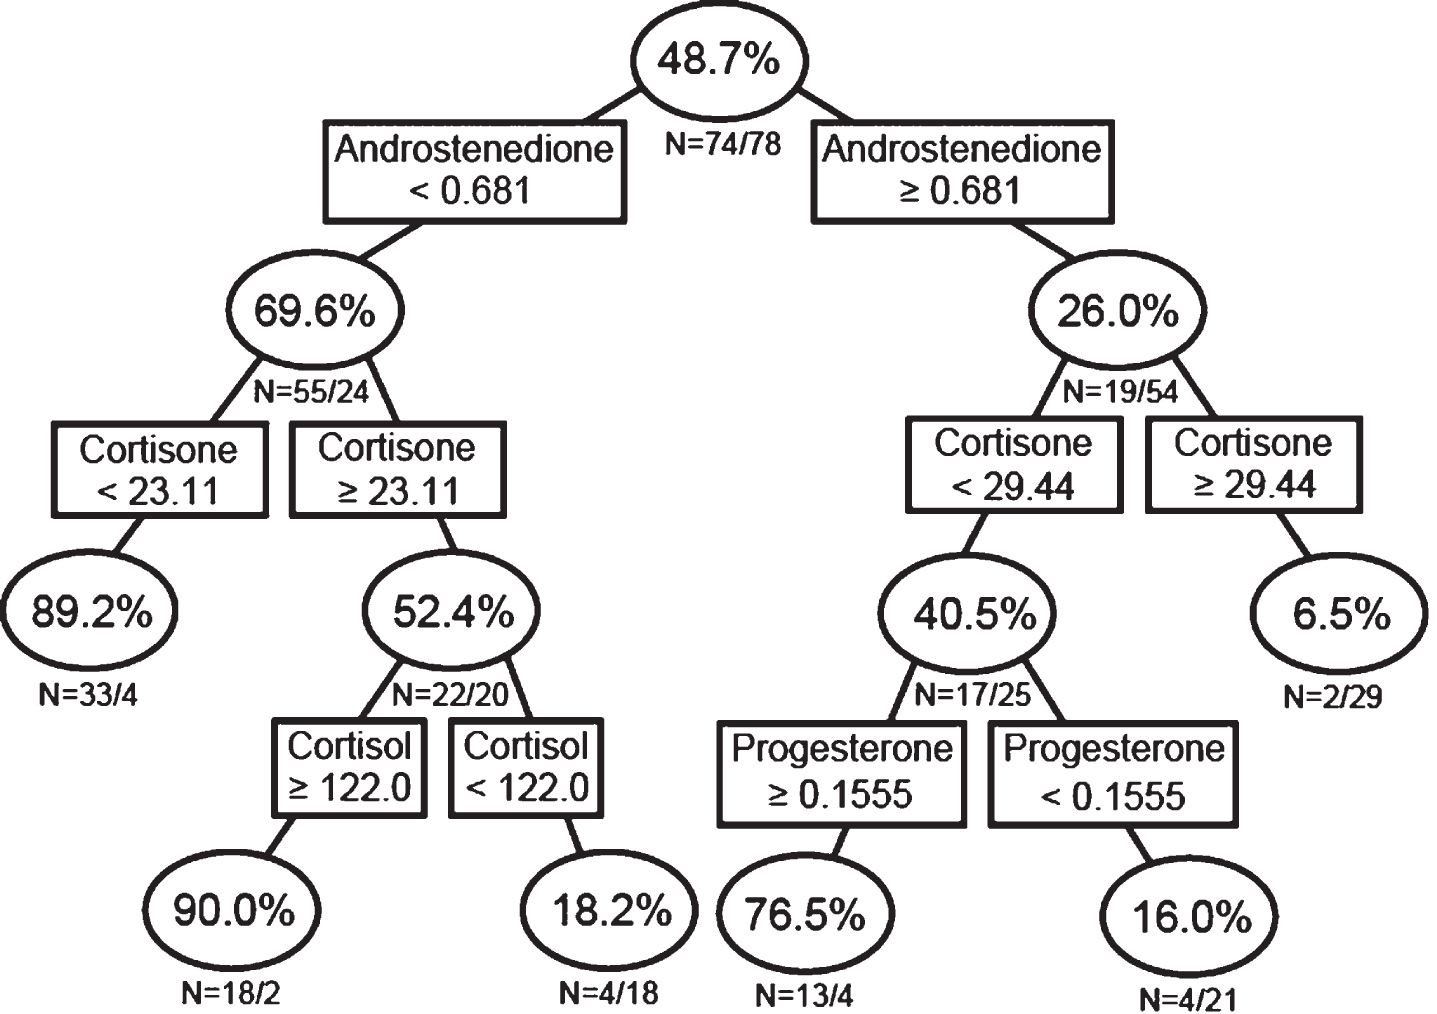
Recursive partitioning analysis using single sex steroid concentrations. Men and women were analyzed together.
Since single steroids alone were not predictive of AD (Fig. 1), we next examined if the interaction of single hormones with hormone ratios associates with AD using RP analysis (Fig. 2B; Model 2). This analysis indicated that 87.0% of individuals with a cortisol/cortisone ratio ≥4.697, and 68.4% of individuals with a cortisol/cortisone ratio <4.697 ng/mL and androstenedione <0.5875 ng/mL, and 71.4% of individuals with a cortisol/cortisone ratio <4.697 ng/mL, androstenedione ≥0.5875 ng/mL, and E2/androstenedione ratio ≥0.0363 ng/mL were classified as AD. Conversely, only 6.2% of individuals with a cortisol/cortisone ratio <4.697 ng/mL, androstenedione ≥0.5875 ng/mL, and E2/androstenedione ratio <0.0363 ng/mL were classified as AD (i.e., 93.8% were classified as controls; Fig. 2B).

Recursive partitioning analysis using single sex steroid concentrations and ratios of sex steroid concentrations. Men and women were analyzed together.
In order to determine whether hormone concentration ratios alone do a better job of predicting AD than combined single hormones and hormone ratios, and to determine in what way the hormone ratios interact to associate with AD, we next performed RP analysis on the data sets utilizing only hormone ratios. The RP analysis using only ratios of different sex steroid concentrations (Fig. 2C; Model 3), indicated that 87.0% of individuals with a cortisol/cortisone ratio ≥4.697 ng/mL, 70.6% of individuals with a cortisol/cortisone ratio <4.697 ng/mL and an E2/androstenedione ratio ≥0.0363, and 66.7% of individuals with a cortisol/cortisone ratio <4.697 ng/mL, E2/androstenedione ratio <0.0363, and an E2/androstenedione ratio <0.0064 ng/mLwere classified as AD. On the other hand, only 7.6% of individuals with a cortisol/cortisone ratio <4.697 ng/mL, E2/androstenedione ratio <0.0363, and an E2/androstenedione ratio ≥0.0064 ng/mL were classified as AD (i.e., 92.4% of individuals with this hormonal profile were classified as controls; Fig. 2C). The hormonal profile (model) based only on hormone concentration ratios was similar to the result from the single hormone and ratios analysis shown in Fig. 2B, except rather than the single hormone androstenedione in the secondary branch of the tree, the E2/androstenedione ratio is present in the second branch (Fig. 2C).
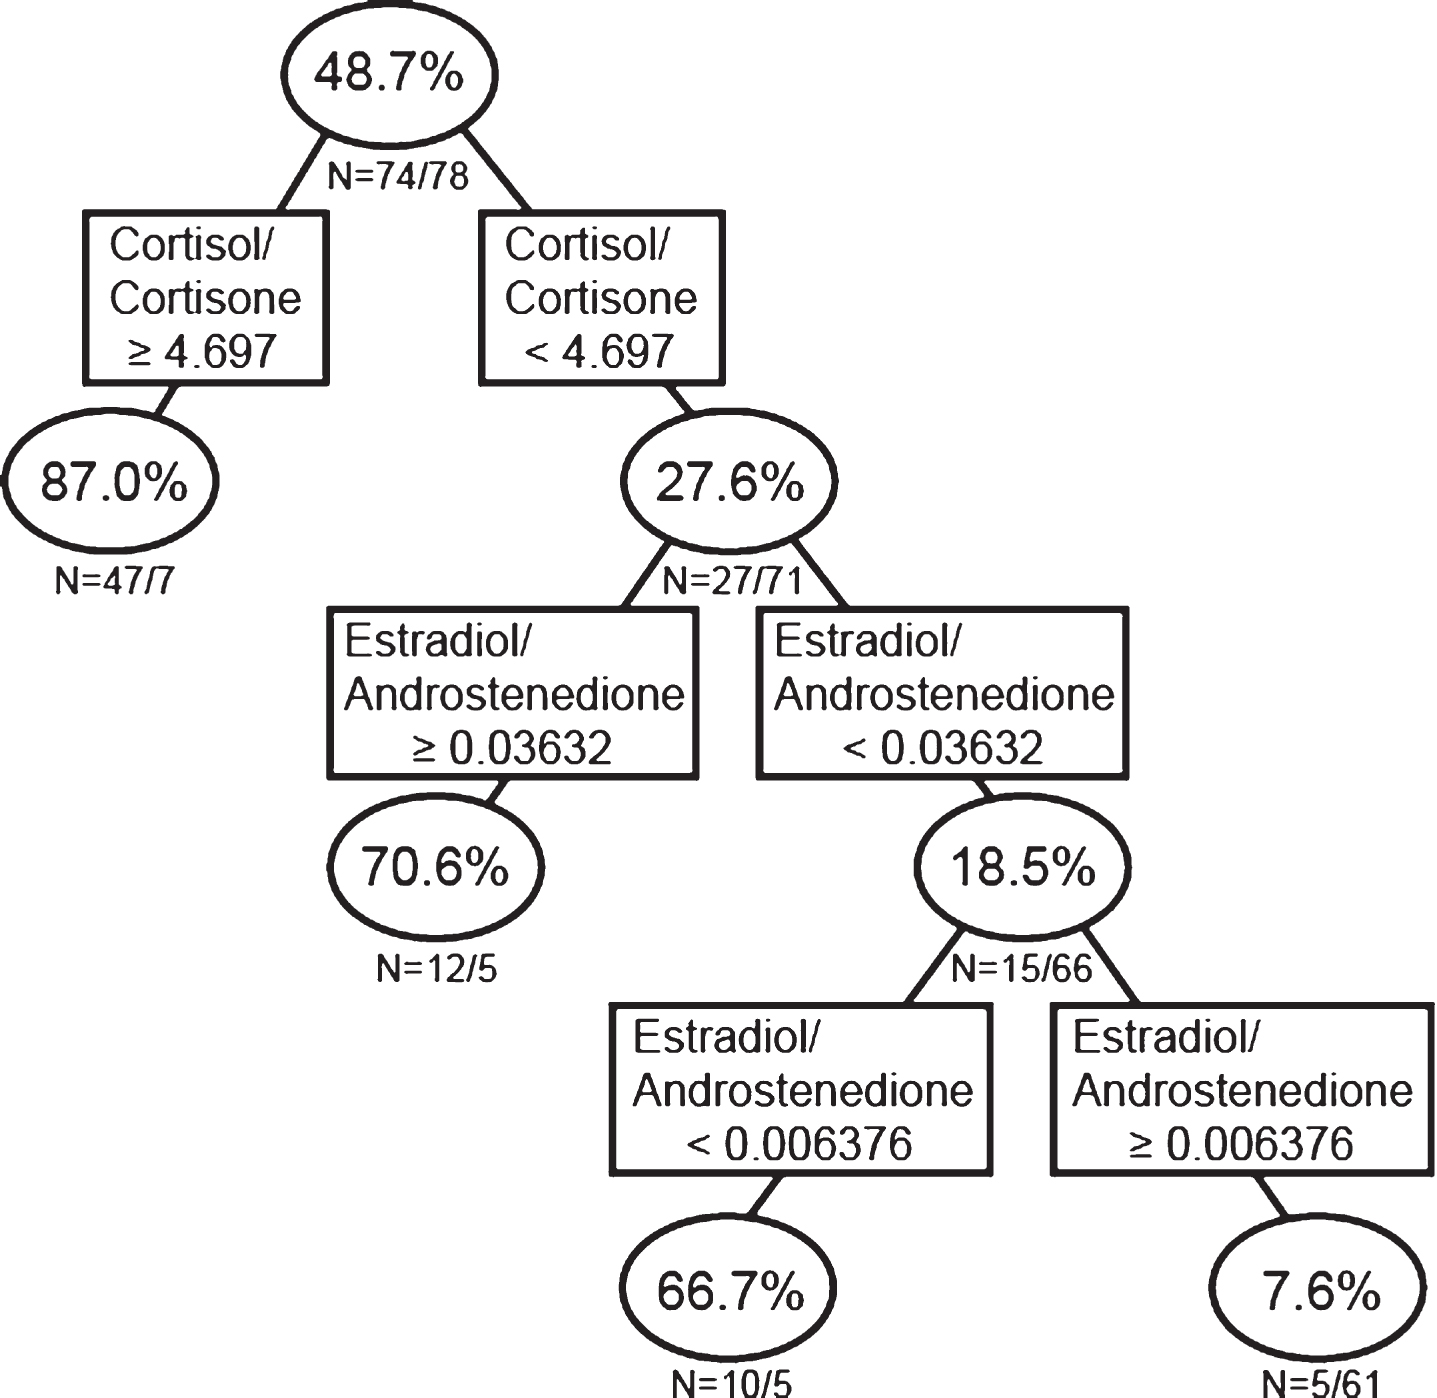
Recursive partitioning analysis using ratios of sex steroid concentrations. Men and women were analyzed together.
Our LR analyses identified 25 hormone ratios that interact to significantly associate with AD (Table 4B). We next examined whether the model among these specific (significant) hormone ratios including only those ratios identified by LR would better predict AD. Recursive partitioning analysis of the LR-significant ratios (Fig. 2D; Model 4) indicated that 90.0% of individuals with a cortisone/P4 ratio <106.6 ng/mL, and 92.0% of individuals with a cortisone/P4 ratio ≥106.6 ng/mL and androstenedione/cortisol ratio <0.0042 ng/mL, and 72.2% of individuals with a cortisone/P4 ratio ≥106.6 ng/mL, androstenedione/cortisol ratio ≥0.0042 ng/mL, and androstenedione/E2 ratio <27.85 ng/mL were classified as AD. Conversely, only 13.9% of individuals with a cortisone/P4 ratio ≥106.6 ng/mL, androstenedione/cortisol ratio ≥0.0042 ng/mL, and androstenedione/E2 ratio ≥27.85 ng/mL were classified as AD (i.e., 86.1% of individuals with this hormonal profile were classified as controls; Fig. 2D). Similar to the results indicated by our LR analyses, the RP results all suggest a strong association between cortisol, cortisone, and androstenedione with AD, and some association with P4 and E2.

Recursive partitioning analysis using only the ratios of sex steroid concentrations identified as significantly associated with AD using logistic regression methods. Men and women were analyzed together.
Model test results
To test the predictive power of our classification-based RP trees (models) to predict AD status based on hormone concentrations and concentration ratios, we measured hormone concentrations in an additional 43 age-matched AD and control samples from the Wisconsin ADRC. With this dataset, we tested each of the models described above. Cases on branches ending in nodes ≥70% AD were classified as AD, while those ending in nodes ≤30% AD were classified as controls. All branches ending in nodes between 30%–70% were classified as ‘undetermined’. The model which produced the most accurate classification of AD cases was the model which included only the 25 sex steroid ratios which interacted to significantly associate with AD using LR (Fig. 2D; see RP section above). Utilizing this model, we were able to correctly predict 81% of AD test cases (19% misclassified; n = 21) and 64% of control test cases (36% misclassified; n = 22). None of the 43 test cases was identified as ‘undetermined’ using the selected model. Overall, these results indicate that ratios of circulating hormone concentrations are better predictors of AD risk than single hormone concentrations alone, and that the interaction of hormones in the body greatly influences their effect on AD risk.
DISCUSSION
We have developed a classification tree algorithm utilizing steroid ratios that provide 81% sensitivity and 64% specificity for the diagnosis of AD (Fig. 2D; ‘Wisconsin Hormone Algorithm Test for Cognition’ (WHAT-Cog)). Although significant differences in individual hormone concentrations were detected between control and AD cases (female: E1, androstenedione, aldosterone; male: T, androstenedione, DHEA, aldosterone), the wide variation in circulating concentrations precluded their use for predicting AD (Fig. 1). The utilization of hormone ratios and their associations has the benefit of negating the individual variation observed with the single steroid concentrations while identifying meaningful changes in steroid flux through the steroidogenic pathway. Although the sensitivity and specificity of our model is below that required for a clinical diagnostic procedure for AD, further refinement of WHAT-Cog with additional cases is expected to improve sensitivity and specificity.
Single hormone differences between gender
Gender-based comparison identified significantly higher concentrations of P4,17α-OH-P4, DHEA, T, and E2 in males compared with females, but higher concentrations of FSH in females compared with males. Similar results were obtained between age-matched AD males and AD females, and between age-matched control males and control females, with the exception that androstenedione, but not P4, was elevated in control males compared to control females (Fig. 1). In men, since androstenedione/T are precursors for E2 synthesis, the higher plasma E2 concentrations observed in males is likely due in part to the higher T levels in aged men relative to T concentrations in post-menopausal women of the same age [24].
Although it is well known that there is a high degree of variability in hormone concentrations in humans [25], we compared our circulating concentrations for post-menopausal women and andropausal men to those measured in previous studies. Concentrations of steroids and FSH measured in our study were comparable to previous studies for these hormones measured in plasma and serum for both older men and women: P4 [26–30], 17α-OH-P4 [31, 32], cortisol [17, 31–36], cortisone [31, 34], DHEA (although women in our study showed slightly lower concentrations than previous studies examined) [27, 37], androstenedione [17, 38], E1 [1, 39–42], E2 [1, 38–45], and FSH [2, 44]. Concentrations for plasma T were slightly higher in men, but comparable in women [6, 46]. Our concentrations of aldosterone were about 4.5× higher than that reported by others [29, 47–49], perhaps due to methodological differences of our LC-MS/MS assay compared with the antibody-based enzyme methods of previous studies. We were unable to find any other studies that measured 11-DOC in either aged controls or AD subjects. However, our values were 10× that noted for middle-aged adults in prior studies [50, 51], and half that noted in neonatal infants [52]. Body mass index and other lifestyle factors (smoking, alcohol intake, and exercise) have been shown to affect hormone levels [44, 53–56], factors that were not taken into account in the current study. A lack of standardization among assays also could affect hormone concentrations [25, 57–60].
Single hormone differences between disease state
Analyses of circulating steroid concentrations and their ratios (i.e., fluxes through the pathway) between control and AD indicate that there is, in general, 1) an overall decrease in circulating steroids, 2) with a specific shift in the steroidogenic pathway away from the production of aldosterone, androstenedione, and cortisone (increased cortisol to cortisone ratio) in both sexes, 3) in women, a decrease in both E1 and E2, and 4) in men, a decrease in both DHEA and T (Figs. 1, (2D; Tables 3 and (4).
Although our study noted a non-significant increase in P4 levels in AD subjects, when genders were combined, the increase in P4 levels among those with AD was significant before Bonferroni correction for multiple testing, which holds with what prior studies have found [30]. We found no significant differences in 17α-OH-P4 between AD and control subjects, which is consistent with prior studies [32], although 17α-OH-P4 was non-significantly decreased in AD subjects, specifically in males. We identified a non-significant increase in cortisol levels in AD subjects, as found in one prior study [32]; however, the increase in cortisol levels among AD subjects was significant before Bonferroni correction, as was found in another prior study [36]. Although we found significantly lower levels of DHEA in AD males as compared with controls, we identified no significant differences in DHEA among females, which is supported by one previous study [37], but stands in contrast to another study which found significantly higher levels of DHEA in women with AD [61]. E1 levels were found to be significantly decreased among AD women in our study, which is supported by prior studies which identified non-significant decreases in E1 among AD women [1] and found that higher E1 levels were significantly associated with reduced cognitive impairment [62]. Although lower levels of E1 were also observed in AD men in our study, these results were not statistically significant, and we were unable to identify any additional studies that compared E1 levels in AD males versus control males. However, when genders were combined, the reduction in E1 levels among AD subjects was statistically significant before Bonferroni correction. Our study identified significantly lower levels of androstenedione in AD subjects when compared to controls, for both men and women. However, prior studies have given mixed results, with studies identifying significantly higher levels of androstenedione in subjects with AD [17, 61], and no significant differences in androstenedione between control and AD [32]. We demonstrated a reduction in E2 levels among AD men and to a greater extent among AD women, although neither of these results was statistically significant. Previous results are mixed, with studies finding a significant decrease in E2 levels among AD women[1] or no significant differences [17], and no clear consensus about whether higher estrogen levels increase or decrease a man’s risk of AD [45, 63]. We also identified a significant decrease in T levels among AD males as compared with controls, as supported by previous studies [6, 45], but no similar association among women [17]. One prior study found a significant association between free T and AD in men, but not between total T and AD [46]. Holland et al. [64] note in a review that some studies suggest AD onset may be preceded by low free T, and that there may be an optimal level of T for retaining certain cognitive functions [64]; however, this optimal level would be dependent on age and type of cognitive function assessed. We could not find studies which compared 11-DOC, aldosterone, or cortisone levels in AD versus control patients. However, when genders were combined, the decrease in cortisone levels among AD subjects was significant before Bonferroni correction.
The decline in gonadal sex hormone production (steroids and protein hormones) after menopause and during andropause leads to a loss of negative feedback on the hypothalamus and pituitary and the elevation in LH, FSH, and gonadotropins production [22, 65]. As might be expected given the negative feedback regulation of sex steroids on the hypothalamus and pituitary, a positive correlation exists between serum gonadotropins in both women and men and AD [2–9]. Conversely, we (Fig. 1) and others [6, 66] have observed a non-significant increase in FSH levels among AD subjects compared with controls. Taken together with the declines in serum estrogens in women [1] and testosterone in men [2, 3] with AD, these results suggest that the more dysregulated the HPG axis, the more likely an individual is to develop AD. The loss of negative feedback of sex steroids on the HPG axis was reflected in the significant negative correlations observed in both AD and control cases between FSH and DHEA, T, and E2 (Table 3).
In women, ovarian steroid production is low post-menopause resulting in low circulating steroid concentrations equivalent to circulating steroid concentrations post-oophorectomy. Circulating post-menopausal steroid concentrations therefore reflect non-reproductive tissue steroid production (i.e., adrenals, brain, adipose, liver [67]). Since sex steroid concentrations are overall lower in those with AD, this suggests that the non-reproductive tissues of those with AD produce less sex steroids than controls (or that controls metabolize steroids more slowly). A number of non-gonadal tissues have been reported to produce sex steroids, including the brain [68–71], adipose tissue, and skin. Following menopause, and during andropause, the contribution of sex steroids from the peripheral circulation to the brain decreases dramatically. In addition to these age-related declines in circulating sex steroids, those individuals with cognitive decline therefore display even lower circulating sex steroid concentrations compared with age-matched controls (see Fig. 1; [1–3]). In this respect, brain sex steroid concentrations are decreased in women with AD compared to age-matched controls [10]. Similarly, women with AD have lower brain levels of estrogens and androgens after 80 years of age compared to age-matched controls [11]. These changes appear to be progressive, since in men aged 60–79, brain levels of T are lower in cases with mild neuropathological changes as well as with advanced AD neuropathology [11]. Together, these results suggest that those individuals with a lower capacity to synthesize steroids are more likely to develop cognitive deficits (sooner). Conversely, individuals with a higher steroid synthetic capacity post-menopause and during andropause are more likely to be spared the senescent changes induced by low sex steroid concentrations. Thus, changes in circulating sex hormones may provide an etiologically significant surrogate biomarker for cognitive decline.
Interestingly, there is a hyperactivity of the hypothalamic-pituitary-adrenal (HPA) axis in those with AD. Although circulating cortisol and cortisone concentrations were not different between controls and AD, the ratio of cortisol to cortisone was significantly increased in AD. Elevated circulating and CSF cortisol concentrations have been previously reported for AD [61, 72–75], and hyperactivity of the HPA axis, denoted by adrenal cortisol hypersecretion, is becoming a recognized feature of the disease [76]. Elevated cortisol is a classic inflammatory marker produced to suppress inflammation [77]. Cortisol has been proposed as a marker of prognostic relevance because the highest cortisol levels are seen in the most severely demented patients [75] and increased plasma cortisol has been associated with more rapid disease progression in AD [78]. The ratio of cortisol to cortisone alone might serve as a prognosticator of AD.
Changes in steroidogenic fluxes and ratios with disease state
The slight increase in steroid precursors (P4, 11-DOC) in those with AD compared with controls may be due to decreased conversion of these steroids (decreased steroidogenic enzyme expression and/or activity), or increased precursor steroid production due to elevated LH and FSH. The alteration in the ratio of cortisol/cortisone between those with AD and control might be due to abnormalities in the HPA axis: altered CRH/ACTH concentrations and/or response [79] may result in altered 11β-hydroxysteroid dehydrogenase (11β-HSD) conversion of cortisone to cortisol, although further research is required to delineate these potential associations [32, 80–82]). The decline in aldosterone on the other hand, a mineral corticoid that regulates sodium and potassium homeostasis in the kidneys, between AD and control may be attributed to the decline in angiotensin-converting enzyme (ACE) [83, 84] which converts angiotensin I to angiotensin II, required for the secretion of aldosterone from adrenal glands. ACE also degrades Aβ and prevents the accumulation of amyloid plaques in vivo. Moreover, it has been reported that treatment with angiotensin receptor blockers is associated with less AD-related pathology on autopsy evaluations [86].
Utilization of LR and classification tree analyses for generation of diagnostic models
Our results indicate that the change in the ratio of sex hormones is more predictive of the development of AD than any one hormone. Few studies have utilized hormone ratios as a predictor of cognitive decline [87]. Our study demonstrates the utility of LR and RP in developing predictive analyses as illustrated by our previous studies in depression [14, 15]. Additional well-characterized age- and gender-matched control and AD subjects are required to further refine the models developed in this study. Addition of other biomolecular or neuroimaging biomarkers of AD to hormone datasets has the potential to further improve the predictability of WHAT-Cog. Future studies might also assess different clinical classifications of cognitive loss such as those with mild cognitive impairment or subjective memory complainers where certain hormones have shown correlations with conversion or with AD neuroimaging markers [88]. It should be noted however that the tree-based RP method has two possible limitations. First, it can be numerically unstable, and second it is greedy, so it may fail to identify certain interaction patterns [19].
Summary
The wide variation and substantial overlap in the concentrations of all circulating sex steroids across control and AD groups in both genders precluded the use of these individual hormones for predicting AD. LR analysis of steroids also indicated no significant associations between single sex steroid concentrations and AD. However, single hormone versus ratio and ratio versus ratio analyses identified 12 and 25 interactions, respectively, that were significantly associated with AD. The interactions of cortisone, cortisol, androstenedione, and aldosterone were most prevalently associated with AD. The most predictive model of AD proved to be a RP tree including only the hormone ratios identified by LR as significantly associated with AD. Similar to LR analyses, the RP results all suggest a strong association between cortisol, cortisone, and androstenedione with AD, with contributions from P4 and E2. Utilizing this model, we correctly predicted 81% of AD test cases and 64% of control test cases. By comparison, the10 genetic loci identified from GWAS only account for ∼33% of the genetic risk attributable to AD [89]. Our data indicate that hormone x hormone interaction analyses allow for enhanced predictability of AD above that of individual hormone analyses. RP combined with LR therefore provides an important analytical method for the identification of well-supported hormone x hormone interactions that associate with diseases of aging.
Footnotes
ACKNOWLEDGMENTS
The authors thank the Wisconsin Alzheimer’s Disease Research Center for providing serum and plasma samples. This material is the result of work supported with resources at the William S. Middleton Memorial Veterans Hospital, Madison, WI. The opinions expressed herein are those of the authors. The contents do not represent the views of the Department of Veterans Affairs or the U.S. government. ): This article is Geriatrics Research, Education and Clinical Center VA paper 010-2020.