
Abstract
Background:
Higher late-life body mass index (BMI) was associated with reduced risk of Alzheimer’s disease (AD), which might be explained by a reverse causal relationship.
Objective:
To investigate whether weight loss was a preclinical manifestation of AD pathologies and could be a predictor of cognitive impairment.
Methods:
A total of 1,194 participants (mean age = 73.2 [range: 54 to 91] years, female = 44.5%) from the Alzheimer’s Disease Neuroimaging Initiative (ADNI) were grouped according to AD biomarker profile as indicated by amyloid (A) and tau (TN) status and clinical stage by clinical dementia rating (CDR). BMI across the biomarker-defined clinical stages was compared with Bonferroni correction. Pearson correlation analysis was performed to test the relationship between the amyloid change by PET and the BMI change. Multiple regression models were used to explore the influences of amyloid pathologies on BMI change as well as the effects of weight loss on longitudinal changes of global cognitive function.
Results:
BMI was significantly decreased in AD preclinical stage (amyloid positive [A+] and CDR = 0) and dementia stage (A+/TN+ and CDR = 0.5 or 1), compared with the healthy controls (A–/TN–and CDR = 0, p < 0.005), while no significant differences were observed between preclinical AD and AD dementia. Amyloid PET change was inversely correlated with BMI change (p = 0.023, β= –14). Individuals in amyloid positive group exhibited faster weight loss (time×group interaction p = 0.019, β= –0.20) compared to the amyloid negative group. Greater weight loss predicted higher risk of developing cognitive disorders.
Conclusion:
Elders who experienced greater weight loss might belong to preclinical stage of AD and could be targeted for primary prevention of the disease.
INTRODUCTION
Alzheimer’s disease (AD) is pathologically characterized with abnormal amyloid deposition, which could be reflected by brain amyloid PET imaging or cerebrospinal fluid (CSF) amyloid-β (Aβ) biomarkers. As a promising modifiable risk factor, body mass index (BMI) had been associated with AD risk, for which the effects depended upon the population age [1]. We and other groups reported that obesity in midlife could elevate AD’s risk, while high BMI in late-life was protective [1, 2]. It was proposed that these paradoxical associations might be explained by the reverse causal relationship between late-life BMI and AD pathology [1]. To validate this hypothesis, researchers explored the influences of Aβ deposition on BMI in late-life, for which the results are conflicting and mostly limited to cross-sectional evidence [3]. The Knight Alzheimer Disease Research Center (ADRC) [4] and Harvard Aging Brain Study [5] reported that cognitively normal individuals with higher BMI in late-life (> 60 years) had lower cortical Aβ burden by PET imaging. The Alzheimer’s Disease Neuroimaging Initiative (ADNI) also provided cross-sectional evidence showing that presence and burden of in vivo biomarkers of cerebral amyloid were associated with lower BMI in non-demented elderly [6, 7]. Blautzik and colleagues indicated that BMI was inversely associated with cortical amyloid load only in APOE4 carriers (mean age > 70 years) [8]. Data from Multi-domain Alzheimer’s Preventive Trial (MAPT) reached seemingly opposite conclusion, such that elders (aged 75.7±4.2 years old) with greater fat mass had higher cerebral Aβ load [9].
Till now, there is little evidence supporting that Aβ burden could influence dynamic change of late-life BMI. Herein, we hypothesized that greater Aβ burden could contribute to faster weight loss in older adults, especially those who belonged to preclinical AD. We also explored whether weight loss could be a predictor of developing cognitive impairments.
METHODS
ADNI participants
The data used in the present study were downloaded from the Alzheimer’s Disease Neuroimaging Initiative (ADNI) database (http://www.adni-info.org/). As a multicenter study, ADNI is designed to develop clinical, imaging, genetic, and biochemical biomarkers for the early detection and tracking of AD. The participants are older adults aged 55–90 years with cognition (HC), mild cognitive impairment (MCI), or mild AD dementia. Further information can be found in previous reports [10–12]. The participant underwent an in-person interview for general health and function at the time of study entry, including the anthropometry measurement. Follow-up data were collected during evaluations at sequential intervals of approximately 12 months. In ADNI, 1,209 participants had data of baseline covariates (including age, gender, education, APOE4 status, and dementia severity score) and CSF AD biomarkers. Among them, 1,194 (98.8%) with anthropometric measures (weight and height) were included. In order to lower the heterogeneity due to tauopathy-related cognitive impairments, we constrained our analyses to 706 who were healthy controls or belonged to AD continuum, including “healthy controls”, “preclinical AD A+/TN–”, “preclinical AD A+/TN+”, “AD CDR = 0.5”, and “AD CDR = 1”.
Standard protocol approvals, registrations, and patient consents
The study was approved by the institutional review boards of all participating centers, and written informed consent was obtained from all participants or authorized representatives after extensive description of the ADNI according to the 1975 Declaration of Helsinki (for the full list of participating centers, see http://adni.loni.usc.edu/) [13].
Measurement of BMI
Height and weight were measured by standard anthropometric methods. BMI was calculated as weight in kilograms (kg) divided by height in meters squared. Unit transformations were conducted in advance using the following equations: 1 inch = 2.54 centimeters (for the height) and 1 pound = 0.454 kg.
CSF measurements of AD core biomarkers
CSF procedural protocols have been described previously [14]. CSF Aβ1–42, p-tau181, and t-tau were analyzed by the electrochemiluminescence immunoassays (ECLIA) Elecsys on a fully automated Elecsys cobas e 601 instrument and a single lot of reagents for each of the three measured biomarkers (provided in UPENNBIOMK9.csv file). These measurements are for explorative research use only.
PET imaging of amyloid deposition
Florbetapir data in the most fully pre-processed format was downloaded from LONI (http://adni.loni.usc.edu). The data preprocessing is accessible via adni.loni.ucla.edu/about-data-samples/image-data/. The mean florbetapir AV45 uptake within each region was calculated by co-registering the florbetapir scan to the corresponding MRI. Florbetapir SUVRs were created by averaging across four cortical grey matter regions (frontal, cingulate, lateral parietal, lateral temporal) and dividing the summary by reference region. Further details of PET acquisition and the region-of-interest protocol have been summarized previously [15].
Cognitive measures
Each participant received neuropsychological assessments at baseline and during follow-up at sequential intervals of approximately 12 months. The Alzheimer’s Disease Assessment Scale (ADAS) [16] - cognition section was used to represent the global cognition, which comprised of memory, language, and executive functions. The Clinical Dementia Rating (CDR) [17] was used to evaluate the severity of the dementia.
Classification methods
The classification methods were in line with those proposed by Marc Suárez-Calvet et al. [18, 19] according to 2018 NIA-AA “research framework” for AD diagnosis [20]. In brief, participants were categorized into specific groups based on both biomarker profile (as described by the A/T/N scheme [21]) and clinical stage (as defined by the CDR score). The A/T/N scheme includes three biomarker groups: “A” aggregated amyloid pathology (as indicated by CSF Aβ1–42), “T” aggregated tau (as indicated by CSF p-tau181), and “N” neurodegeneration or neuronal injury (as indicated by CSF t-tau). “A+” participants refer to those with CSF Aβ1–42 < 976.6 pg/ml; “T+” those with CSF p-tau181 > 21.8 pg/ml; and “N+” those with CSF t-tau >245 pg/ml. The CSF biomarker statuses established by these cutoffs were proven to be highly concordant with PET classification in ADNI [22]. Given that T and N groups were highly correlated, we merged them together to facilitate the analyses, producing a TN group: “TN+” indicates T+ or N+ and “TN–” indicates T–and N–.
Statistical analyses
Chi-square tests (for categorical variables), one-way ANOVA (for continuous variables with normal distributions), and Mann-Whitney U test (for continuous variables with skewed distributions) were used to compare the baseline characteristics. All analyses were controlled for age, gender, education, APOE4 status, and CDR score at baseline.
We first asked whether BMI decreases in relation to the biomarker-defined clinical stages. For this purpose, we compared the “healthy control” group with those groups that belong to the AD continuum. namely (i) “Preclinical AD A+/TN–”, (ii) “Preclinical AD A+/TN+”, (iii) “AD CDR = 0.5”, and (iv) “AD CDR = 1”. To further test the influences of amyloid burden on BMI change, we conducted the following analyses based on longitudinal data: a) linear mixed-effects (LME) models were used to explore the influence of amyloid deposition (A+ versus A–) at baseline on longitudinal change of BMI. The linear mixed effects models had random intercepts and slopes for time and an unstructured covariance matrix for the random effects and included the interaction between time (continuous) and amyloid deposition (A+ versus A–) as predictor; b) Pearson correlation analysis was performed to test the relationship between the amyloid PET change (2 years) and the BMI change (4 years).
Classification of participants based on their biomarker profile and clinical stage
A, amyloid-β biomarker status; AD, Alzheimer’s disease; CDR, clinical dementia rating; N, neurodegeneration biomarker status; T, tau pathology biomarker status. ADNI participants were classified based on their CSF biomarker profile and their clinical stage, which yielded 12 different categories. Columns depict the clinical stage (C) as defined by the clinical dementia rating (CDR) scale. Rows depict the biomarker profiles. Each of the three biomarker groups (A/T/N) was binarized into positive or negative (+/–). T and N were merged to simplify the classification: TN indicates that both T and N biomarkers are normal, and TN+ indicates that T and/or N biomarkers are abnormal. The bold font indicates the grouping used for comparisons in the main text. Bold text indicates the groups analyzed in the main analysis, namely “healthy controls”, “Preclinical AD A+/TN–”, “Preclinical AD A+/TN+”, “AD CDR = 0.5”, and “AD CDR = 1”.
We finally examined the longitudinal influences of BMI changes within four years since baseline on cognitive functions. First, participants were categorized into two groups, including progression group (conversion from HC to MCI or from MCI to dementia) and stable group according to their cognitive outcomes at the fourth follow-up. Logistic regression was conducted to compare the group difference of BMI change. Next, LME models were used to investigate the longitudinal influence (up to 10 years) of weight loss (three groups by tertiles of BMI change) on global cognition.
R version 3.5.1 and GraphPad Prism 7.00 software were used for statistical analyses and figure preparation. The “nlme”, “ggplot2”, “arm”, “lme4”, “lmerTest”, and “car” packages were used to perform the above analyses. p < 0.05 was considered significant except where specifically noted.
RESULTS
The combination of A/TN classification and clinical stage divided 1,192 ADNI subjects into 12 different groups that are summarized in Table 1. A total of 706 participants who were cognitively healthy (n = 142) or belonged to the AD continuum (n = 564) were included for subsequent analyses. For this sample, the mean age was 73.5 (standard deviation (SD) = 6.9) years old, female accounted for 46.6%, and BMI was averagely 26.5 (SD = 4.7) (Table 2).
Characteristics of ADNI participants at baseline
BMI, body mass index. *The significance of difference among groups was examined by Mann-Whitney U test when appropriate (for continuous variable) and Pearson’s Chi-squared test (for categorical variable).
After Bonferroni correction, BMI was significantly decreased in AD preclinical stage and dementia stage, compared with HC (Fig. 1A), suggesting that cerebral amyloid deposition might contribute to loss of weight. No significant difference of BMI was observed between preclinical AD and AD dementia. Amyloid PET change in the past 2 years was inversely correlated with BMI change during four-year follow-up (p = 0.023, β= –14), indicating greater cerebral amyloid rising was associated with faster weight loss (Fig. 1B). Moreover, compared with A–group, individuals in A+ group showed faster weight loss (time×group interaction p = 0.019, β= –0.20) (Fig. 1C).
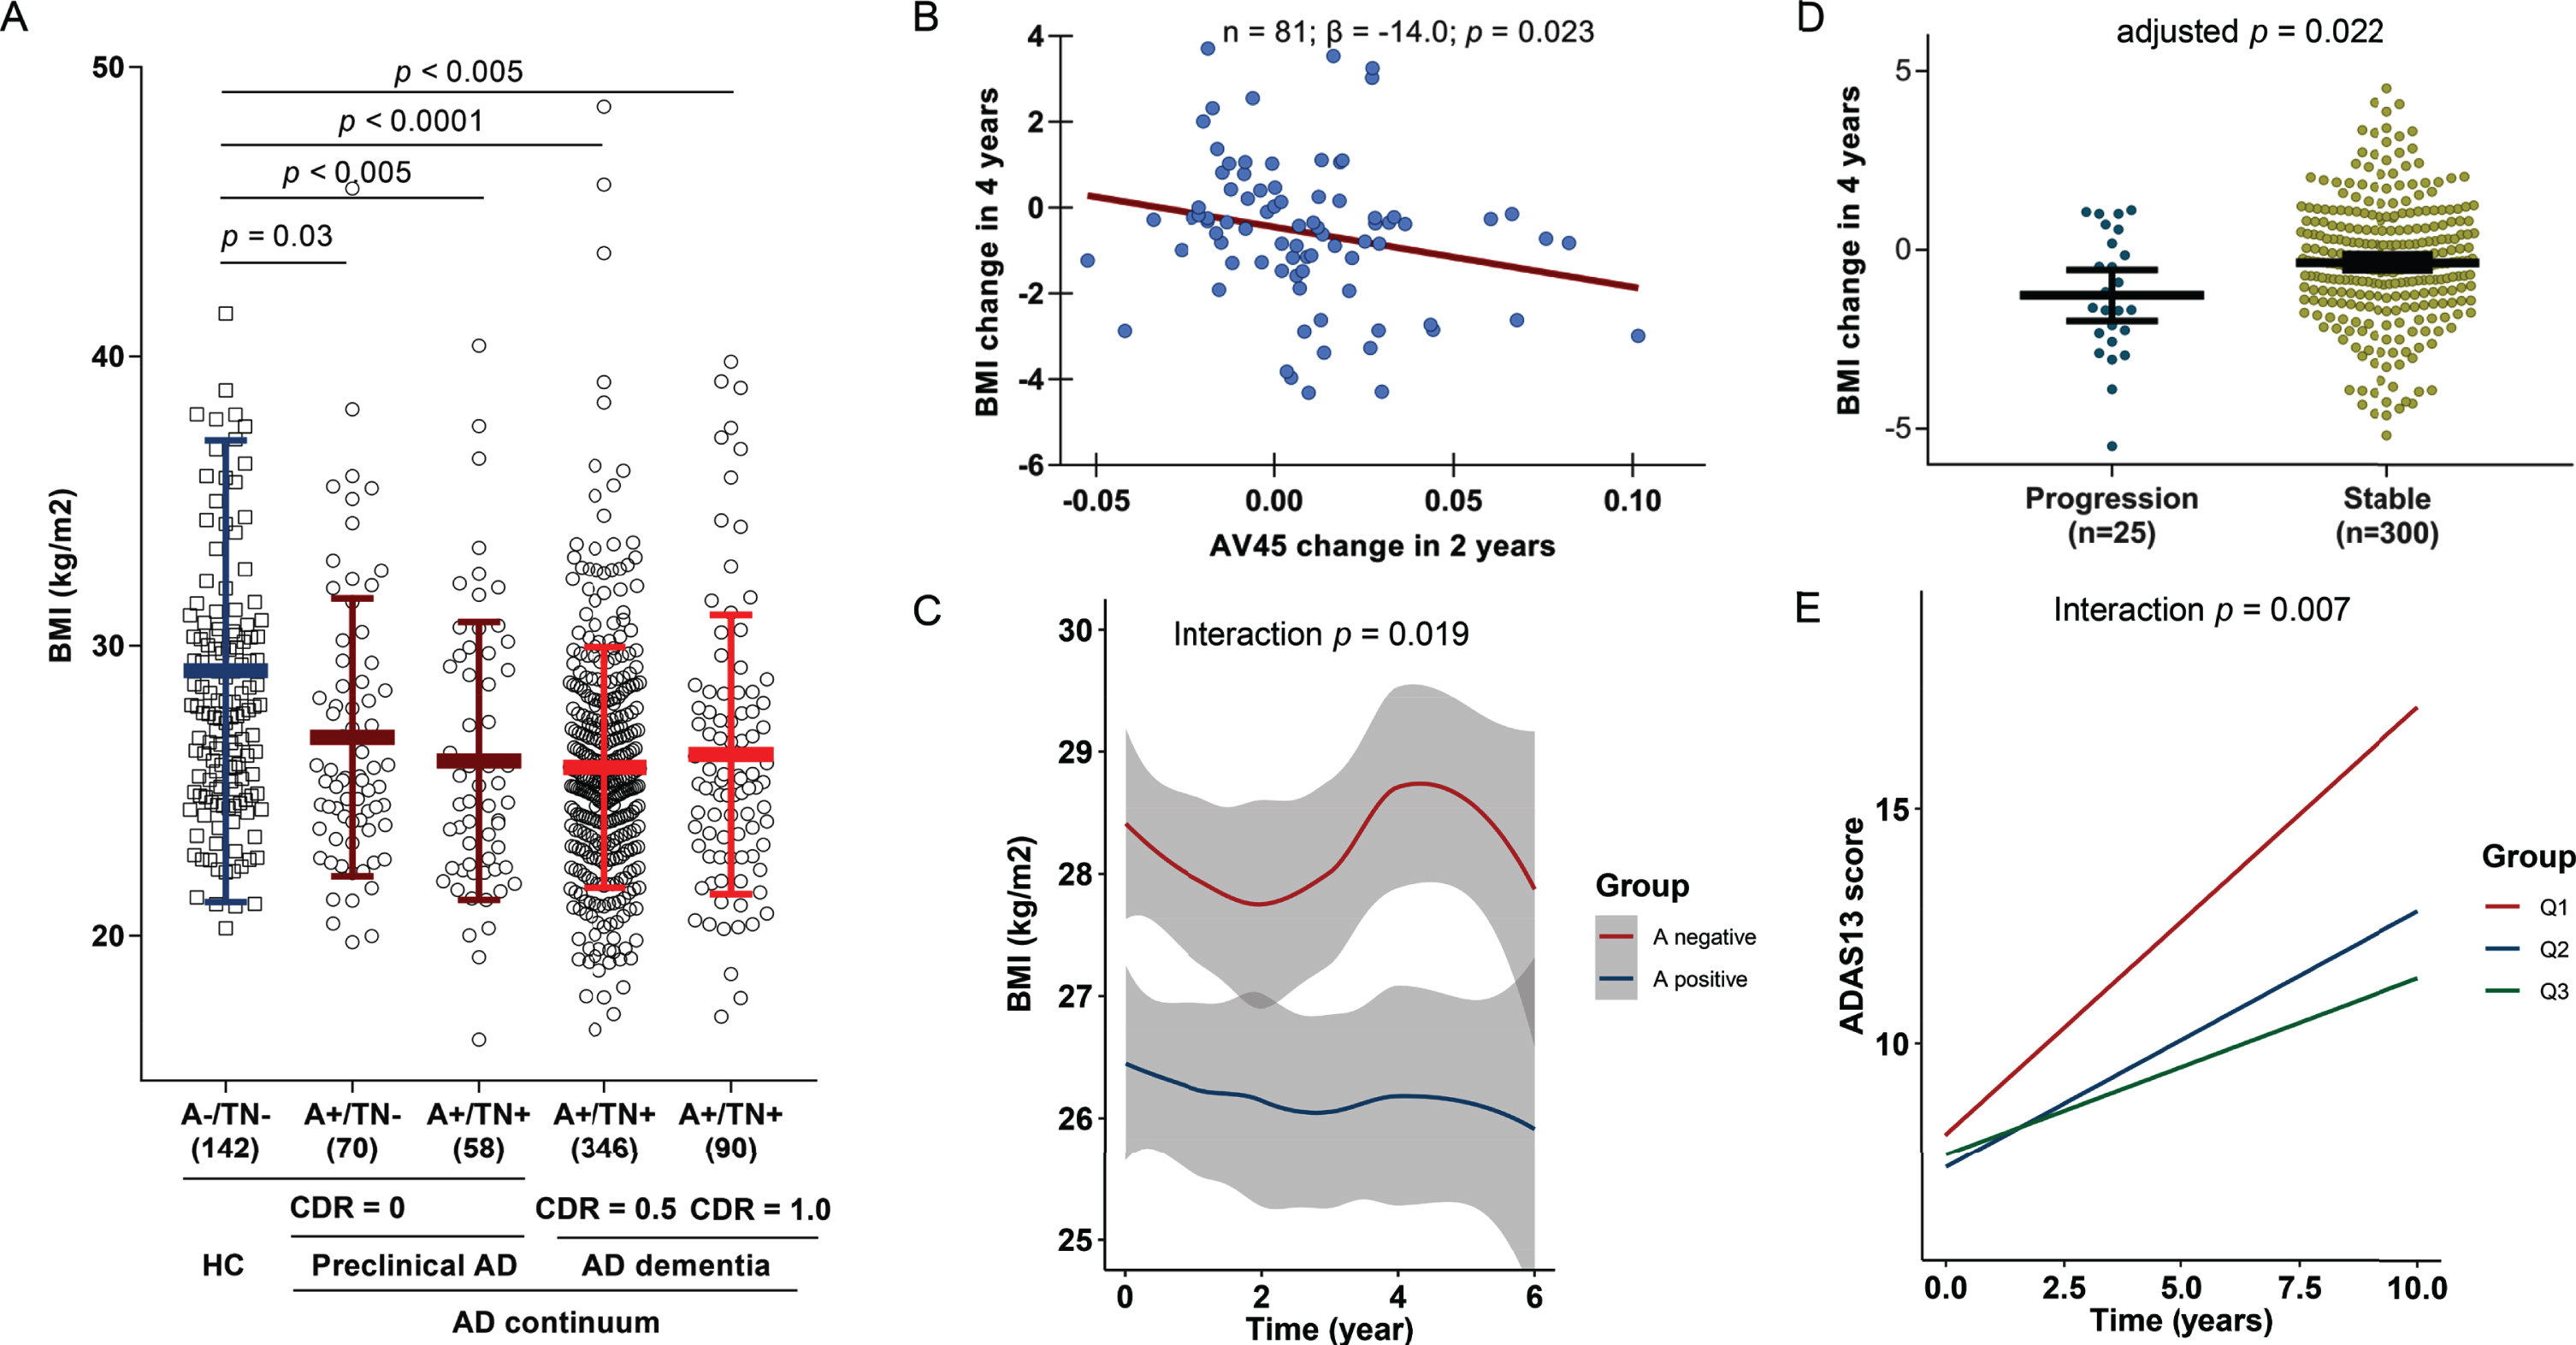
Weight loss is a signal of preclinical AD and could predict poorer cognitive endpoints. BMI was significantly decreased in AD preclinical stage and dementia stage, compared with HC (A). Greater cerebral amyloid rising was associated with faster weight loss (B). Compared with A–group, individuals in A+ group showed faster weight loss (C). The progressors tended to have greater weight loss compared to those who were stable (D). Non-demented individuals who had faster BMI loss would have greater impairment of global cognition, values of BMI change were categorized into three groups according to the tertiles: Q1 indicated the group with greatest BMI decrease (E).
We further tested whether greater weight loss could predict poorer cognitive endpoints. In the 4-year follow-up, 25 participants were categorized as progressors (conversion from HC to MCI or from MCI to dementia). These individuals tended to have greater weight loss compared to those who were stable (Fig. 1D). Furthermore, non-demented individuals who had greater BMI loss had greater impairment of global cognition in the subsequent follow-up up to 10 years (Fig. 1E).
DISCUSSION
The present study showed that late-life weight loss might be an early symptom of greater amyloid burden in preclinical AD. Hence, weight loss could be a valuable predictor of cognitive impairments due to AD. These findings supported the hypothesis that there exists a reverse causal relationship between late-life BMI and AD, which could help explain the paradoxical findings that individuals with higher late-life BMI showed lower risk of the disease.
This longitudinal study is consistent with previous cross-sectional studies. It was found that cognitively normal individuals with higher BMI in late-life had lower cortical Aβ burden [4, 23] and data from ADNI also suggested that BMI was significantly lower in the AD biomarker-positive group [6, 7]. These findings together revealed a negative correlation between BMI and amyloid burden, but cannot indicate the causal relationship. The present longitudinal study added valuable clues which help explain this phenomenon, such that increased cerebral amyloid burden early in preclinical stage of the disease might somehow contribute to weight loss. In addition, our findings also help explain the longitudinal relationship between late-life weight loss and AD risk, such that elders with weight loss exhibited higher risk of AD [24–26]. We found weight loss was a preclinical manifestation of AD and there was no significant decrease of BMI after clinical onset of AD, which is consistent with previous studies [27–29]. In addition, the National Alzheimer’s Coordinating Center’s Uniform Data Set and Neuropathology Data Set found lower late-life BMI predicted increased odds of autopsy-confirmed AD neuropathology in non-demented sample [30].
Though weight loss was constantly linked to higher risk of AD dementia [29, 31], late-life BMI might not be an effective intervention target of preventing AD. Mendelian randomization studies in three large samples revealed no evidence that late-life BMI could increase AD risk [32]. Though the evidence supporting late-life BMI management as an approach to preventing AD is still less robust, weight loss in older adults could still be a promising predictor of cognitive decline, as indicated by our study and other teams [24–26]. Also, the possibility that late-life weight loss was due to cognitive impairment itself was constrained, because the influences of Aβ burden by PET on weight loss remained significant in cognitively normal individuals according to ADNI and the Harvard Aging Brain Study [33]. Notably, the generalizability of the present findings might be influenced by other factors, such as intentional weight loss or population characteristics such as obese/overweight people [34].
The biological mechanisms underpinning the longitudinal relationship of high amyloid burden with faster weight loss were still to be clarified. It was hypothesized that Aβ pathology might lead to the hypothalamus-related hormonal (such as leptin [35, 36]) changes, which contribute to metabolic homeostasis (such as insulin-degrading enzyme [37]) and thus body weight loss [38]. Another explanation is mediation effect via mediator (such as depressive moods) which modulated the relationship between amyloid pathology and weight loss possibly due to reduced intake of protein or fat nutrients. In fact, we recently found mild depressive symptoms were manifestations of amyloid pathology in preclinical AD (unpublished data).
Limitations exist in the present study. The generalizability of our conclusions might be restricted by sources of studied populations of ADNI which recruited volunteer participants. More large community-based longitudinal studies are warranted to validate these associations. Height data was seen as stable during follow-up, which might not reflect the accurate change. However, the potential measurement bias might be negligible considering that the average follow-up length is moderate (6 years). ADNI participants were majorly in their late-life stage and the sample size constrained us from exploring the association between amyloid burden and midlife BMI change.
These findings suggested that a reverse causal relationship existed between late-life BMI and AD amyloid pathology. Late-life weight loss might be a preclinical manifestation of AD. Elders who experienced unintentional weight loss might be a promising target population for early prevention of AD.
Footnotes
ACKNOWLEDGMENTS
The authors thank contributors, including the staff at Alzheimer’s Disease Centers who collected samples used in this study, patients, and their families whose help and participation made this work possible. This study was supported by grants from the National Natural Science Foundation of China (91849126).
Data collection and sharing for this project were funded by the Alzheimer’s Disease Neuroimaging Initiative (ADNI) (National Institutes of Health Grant U01 AG024904) and DOD ADNI (Department of Defense award number W81XWH-12-2-0012). ADNI is funded by the National Institute on Aging, the National Institute of Biomedical Imaging and Bioengineering, and through generous contributions from the following: AbbVie, Alzheimer’s Association; Alzheimer’s Drug Discovery Foundation; Araclon Biotech; BioClinica, Inc.; Biogen; Bristol-Myers Squibb Company; CereSpir, Inc.; Cogstate; Eisai Inc.; Elan Pharmaceuticals, Inc.; Eli Lilly and Company; EuroImmun; F. Hoffmann-La Roche Ltd and its affiliated company Genentech, Inc.; Fujirebio; GE Healthcare; IXICO Ltd.; Janssen Alzheimer Immunotherapy Research & Development, LLC.; Johnson & Johnson Pharmaceutical Research & Development LLC.; Lumosity; Lundbeck; Merck & Co., Inc.; Meso Scale Diagnostics, LLC.; NeuroRx Research; Neurotrack Technologies; Novartis Pharmaceuticals Corporation; Pfizer Inc.; Piramal Imaging; Servier; Takeda Pharmaceutical Company; and Transition Therapeutics. The Canadian Institutes of Health Research is providing funds to support ADNI clinical sites in Canada. Private sector contributions are facilitated by the Foundation for the National Institutes of Health (![]() ). The grantee organization is the Northern California Institute for Research and Education, and the study is coordinated by the Alzheimer’s Therapeutic Research Institute at the University of Southern California. ADNI data are disseminated by the Laboratory for Neuro Imaging at the University of Southern California.
). The grantee organization is the Northern California Institute for Research and Education, and the study is coordinated by the Alzheimer’s Therapeutic Research Institute at the University of Southern California. ADNI data are disseminated by the Laboratory for Neuro Imaging at the University of Southern California.