
Abstract
Background:
Whether the epidemiological association of amyloid-β (Aβ) and tau pathology in late-onset Alzheimer’s disease (LOAD) is causal remains unclear.
Objective:
We aimed to investigate the shared genetic background between the cerebrospinal fluid (CSF) biomarkers for Aβ and tau pathology and the risk of LOAD.
Methods:
We conducted a two-sample Mendelian randomization (MR) analysis. We used summary statistics of genome-wide association studies for CSF biomarkers (Aβ1–42 [Aβ], phosphorylated tau181 [p-tau], and total tau [t-tau]) in 3,146 individuals and for LOAD in 21,982 cases and 41,944 controls. We tested the association between changes in the genetically predicted CSF biomarkers and LOAD risk.
Results:
We found a decrease in LOAD risk per one-standard-deviation (SD) increase in the genetically predicted CSF Aβ (odds ratio [OR], 2.87×10⁻³ for AD; 95%confidence interval [CI], 1.54×10⁻⁴–0.05; p = 8.91×10⁻⁵). Conversely, we observed an increase in LOAD risk per one-SD increase in the genetically predicted CSF p-tau (OR, 19.46; 95%CI, 1.50–2.52×10²; p = 0.02) and t-tau (OR, 33.80; 95%CI, 1.57–7.29×10²; p = 0.02). However, only the association between p-tau and the risk for LOAD remained significant after the exclusion of the APOE variant (rs769449).
Conclusion:
We found the causal association between CSF biomarkers and the risk for LOAD. Our results suggest that the etiology of LOAD involves multiple biological processes, including the pathways of Aβ and tau proteins. Further MR studies using large-scale data of multiple candidate biomarkers are needed to elucidate the pathophysiology of LOAD.
INTRODUCTION
Alzheimer’s disease (AD), a leading cause of dementia, is the largest cause of morbidity and mortality in older adults. According to a study in 2007, one in every 85 individuals is expected to develop AD, and at the time, the authors suggested that even delaying the onset by 1 year could reduce the number of patients with AD worldwide by up to 9 million by 2020 [1]. Given that eight times as many individ-uals have preclinical AD at risk of progression, the development of disease-modifying therapies is urge-ntly required. Amyloid-β (Aβ) peptides are derived from the proteolytic degradation of transmembrane amyloid-β protein precursor, and tau is a microtu-bule-associated protein. Decades of research have accumulated evidence on the pathophysiology of Aβ and tau proteins, indicating that they interactively form plaques and tangles and lead normally functioning neurons into a disabled state. Two-thirds of the novel treatment pipelines targeting AD are based on the current understanding of abnormal proteins, extracellular amyloid plaques, and intraneuronal neurofibrillary tau tangles, and 90%of the drugs in clinical trials are anti-amyloid and anti-tau protein agents [2].
However, numerous trials aiming to develop disease-progression modification therapies targeting amyloid plaques have recently failed. These failures could cast reasonable doubt regarding the role of Aβ in the pathophysiology of AD. One possible explanation for the failure of clinical trials targeting amyloid plaques is that the intervention was performed too late in the disease course to reverse the pathology in the trial participants [3]. However, the poor efficacy of amyloid-targeting therapy may also suggest that amyloid plaques are a downstream result, rather than a cause of AD [4]. Hence, tau protein has gained attention recently as a target for disease-modifying therapies. Although a previous animal study showed that the suppression of tau gene expression was protective against cognitive impairment, this impact requires the accompanying regulation of Aβ [5]. In addition, a previous study related to the association between premortem cognitive function and AD neuropathology, including tau protein changes, showed vague results [6]. These results also led to doubts as to the contribution of pathological changes in tau to AD. Thus, further research is required to determine whether Aβ or tau proteins are causal to AD or whether they are surrogate markers for AD. This issue is crucial for the successful development of disease-modifying drugs.
One promising approach for investigating causality is Mendelian randomization (MR) using genetic variants as instrumental variables (IVs) [7]. The association between genetic variants and disease outcomes can provide evidence of causation while, subject to certain assumptions, minimizing confounding factors, including age, sex, education, or other environmental exposures. This method may be useful to find the shared genetic background between candidate drug targets and AD [8], and elucidate the causal relationship of Aβ or tau proteins with AD without confounding factors and reverse causality.
Herein, we hypothesized that Aβ or tau protein biomarkers in the cerebrospinal fluid (CSF) would have a shared genetic background with late-onset AD (LOAD), and these biomarkers would have a causal effect on the risk for LOAD. We tested the hypothesis using two-sample MR (TSMR) methods with summary statistics from large-scale genome-wide association studies (GWASs) of CSF biomarkers (Aβ 1–42 [Aβ], phosphorylated tau 181 [p-tau], and total tau [t-tau]) and LOAD [9, 10].
METHODS
Exposure
In this study, we used three CSF biomarkers for AD, Aβ, p-tau, and t-tau, as measures to investigate the causal relationship with the outcome of interest. Meta-analyzed GWAS summary statistics of these CSF biomarkers were obtained from 3, 146 individuals of European ancestry in nine different studies (Knight ADRC, the Charles F. and Joanne Knight Alzheimer’s Disease Research Center; ADNI1, Alzheimer’s Disease Neuroimaging Initiative phase 1; ADNI2, Alzheimer’s Disease Neuroimaging Initiative phase 2; BIOCARD, Predictors of Cognitive Decline Among Normal Individuals; HB, Saarland University in Homburg/Saar, Germany; MAYO, Mayo Clinic; SWEDEN, Skåne University Hospital; UPENN, Perelman School of Medicine at the University of Pennsylvania; UW, the University of Washington) [9].
To combine nine different datasets without potential batch effects, this study log-transformed CSF protein levels for normality and adjusted for age, sex, and the first two principal components in each of the nine datasets. The sample size of these GWASs is the largest at present with respect to Aβ, p-tau, and t-tau collected from CSF.
The AD diagnostic protocol was consistent at the nine different sites in accordance with the protocol of the Alzheimer’s Disease Neuroimaging Initiative (ADNI) [11]. CSF sampling, storage, and assays including Aβ, p-tau, and t-tau, which were applied in the meta-analyzed GWAS, were also performed according to the ADNI protocol. Considering different platform appliances for measuring CSF protein levels, the raw values were log10-transformed to approximate the normal distribution and centralized by each study mean. These processes are described in detail in a previous study [9]. Its validity was confirmed in other studies [12, 13].
The effect per single-nucleotide polymorphism (SNP) in the GWAS summary statistics was defined as a standardized beta coefficient since each phenotype was converted using log-transformation to follow the normal distribution.
Outcome
Our outcome of interest was LOAD, defined as AD with an onset at 65 years of age or older. We utilized the summary-level data from the stage 1 meta-analysis of the GWASs for LOAD in the National Institute on Aging Genetics of Alzheimer’s Disease Data Storage Site [10]. The meta-analysis result was obtained from the four consortia (Alzheimer Disease Genetics Consortium; European Alzheimer’s Disease Initiative; Cohorts for Heart and Aging Research in Genomic Epidemiology Consortium; and Genetic and Environmental Risk in AD Consortium Genetic and Environmental Risk in AD/Defining Genetic, Polygenic and Environmental Risk for Alzheimer’s Disease Consortium). It consisted of 46 case-control studies that included 63,926 individuals of European ancestry (21,982 LOAD cases and 41,944 cognitively normal controls).
Selection of instruments for MR
We performed the following procedures to select appropriate genetic variants that preferentially satisfy three IV assumptions of the MR analysis [14].
First, we selected top SNPs with a relaxed threshold (p < 1×10⁻⁵), which was considered in recent MR analyses when GWAS for exposure traits only yielded a small number of genome-wide significant SNPs [15]. The sample size of the data used in the present study is the largest for CSF biomarkers to date [9]. Measuring CSF biomarkers is expensive, as they are acquired through an invasive procedure that requires skilled professionals, which results in difficulty in gathering a sample size sufficient to identify many independent SNPs passing a genome-wide significance level (p < 5×10⁻⁸). We relaxed the threshold (p < 1×10⁻⁵) to compensate for the moderate sample size.
Second, we selected independent genetic variants among those that passed the relaxed threshold, using the cutoff of linkage disequilibrium (LD) value (r2 < 0.001) to ensure that the IVs for exposure were independent [16]. We used the default setting of the TwoSampleMR package for LD clumping, with a 10 Mb window size.
The LD between SNPs was calculated based on European individuals from the 1000 Genomes Project. If a certain SNP was not available in the summary statistics of the outcome, we substituted the SNP with its LD proxy SNP having a high correlation coefficient (r2≥0.8) based on the European ancestry using the LDlink (https://ldlink.nci.nih.gov/). If such an LD proxy SNP was not found, the SNP was excluded from the IV set.
Third, we eliminated SNPs with ambiguous alleles from the IV set when the alleles in the exposure and the outcome were not identical. For example, we excluded an SNP if the effect and non-effect alleles of the exposure and outcome were T/C and T/G, respectively [16].
Fourth, to test whether the genetic variants are strong instruments, we calculated the F-statistics for each SNP according to a previous study and excluded the weak instruments (F-statistics < 10) [17].
Fifth, we excluded SNPs that had a known direct pleiotropic effect on LOAD, the outcome of interest. Numerous studies have reported multiple pleiotropic effects in the apolipoprotein E (APOE) region [18, 19]. When the MR analysis is performed with variants in the APOE region, including the pleiotropic SNPs in the instruments, it may result in a positive bias or a negative bias due to horizontal pleiotropy and induce an inaccurate causal relationship [20]. Among the IVs of three CSF biomarkers, rs769449 is only one variant in the APOE region that directly affects LOAD with the strongest association (p = 10–200, see Supplementary Tables 1–3). The other variants in different regions were unknown to have a directional horizontal pleiotropic impact as strongly as rs769449. Therefore, we performed MR analysis after excluding the APOE variant (rs769449) as a sensitivity test. Similar to our analyses, there have been several studies that performed a sensitivity analysis excluding variants in the APOE region in MR analysis [21–24].
Subsequently, to confirm the absence of horizontal pleiotropy, we performed an MR-Egger intercept test with the intercept unconstrained. The intercept of the MR-Egger regression represents a statistical estimate of the directional pleiotropic effect, which can be a confounding factor in MR. The selected genetic variants are listed in Supplementary Tables 1–3.
Two-sample MR method
TSMR utilizes GWAS summary statistics obtained from two large sample sets, allowing the use of more robustly associated genetic instruments compared with one-sample MR [7]. TSMR in the present study was performed using the Two-Sample MR R package (version 0.4.22) from the MR-Base platform [16]. The codes for obtaining our MR results are publicly available from the TwoSampleMR Github repository (https://github.com/MRCIEU/TwoSampleMR/).
To confirm that the findings of the estimation of the causal effect of the exposures on the risk for LOAD are robust, we used several methods, including inverse-variance weighted (IVW), MR-Egger regression, simple median, weighted median, and weighted mode. These methods differ from each other in terms of sensitivity to heterogeneity, bias, and power. We selected the IVW method as our primary MR method because it provides reliable results in the presence of heterogeneity in an MR analysis and is appropriate when using a large number of SNPs. The standard error (SE) of the IVW effect was estimated using a multiplicative random effects model. Because the results of the IVW may be biased even though only one IV is invalid, we performed MR-Egger regression, which allows all IVs to be invalid under the instrument strength independent of the direct effect (InSIDE) assumption [25]. The intercept term in the MR-Egger regression represents an estimate of overall pleiotropy. The null hypothesis for the MR-Egger intercept test is that the intercept term is equal to zero; therefore, we can trust the result of MR-Egger regression if the null hypothesis of the MR-Egger intercept test is rejected. We also tested two median-based estimators: simple median and weighted median that do not require the InSIDE condition and assume that more than 50%of the IVs are valid. The weighted mode provides a single causal estimate based on the largest subset of IVs that have similar causal effects [26].
We used a forest plot to visualize the heterogeneity between the instruments due to horizontal pleiotropy and the contribution of each instrument to the overall estimate [16].
Power calculation
We calculated the statistical power of MR using an online tool (https://sb452.shinyapps.io/power/) based on the proportion of variance in the exposure (R2) explained by genetic instruments, the true causal effect of the exposure on the outcome, sample size, and ratio of cases to controls of the outcome [27]. R2 was obtained from the MR-Steiger directionality test. We estimated the true causal effect based on the observed odds ratios (ORs) between CSF biomarkers and the risk for LOAD.
Gene set enrichment analysis
To interpret the potential mechanisms underlying the causal relationship, we performed gene set enrichment analysis for a shared biological background between CSF biomarkers and AD using functional mapping and annotation of genome-wide association studies (FUMA GWAS) [28]. FUMA identified independent genome-wide significant SNPs associated with each trait from GWAS summary statistics and their neighboring genomic loci based on the 1000 Genomes Project European data. Next, FUMA mapped genes for SNPs using the information of multiple functional annotations (positional mapping for exonic and splicing SNPs, expression quantitative trait loci mapping based on the GTEx V8 expression quantitative trait loci, and chromatin interaction mapping using the PsychENCODE database). Using the gene set enrichment test of FUMA GWAS, we aimed to identify gene sets in which the mapped genes were significantly enriched for both CSF biomarkers and AD (Benjamini-Hochberg false discovery rate < 0.05).
RESULTS
Of the three CSF biomarkers studied, CSF Aβ and t-tau showed weak evidence of a causal effect on LOAD risk; however, all methods pointed toward the same direction of effect. The IVW odds ratio (OR) for LOAD per one-standard-deviation (SD) increase in the genetically predicted CSF Aβ was 2.87×10⁻³, 95%confidence interval [CI] was 1.54×10⁻⁴–0.05, and the p value was 8.91×10⁻⁵. The values for CSF t-tau were 33.80, 1.57–7.29×10², and 0.02, respectively (Table 1, Fig. 1A, and Fig. 1C). The MR tests after removing the APOE variant (rs769449) provided limited evidence for the causal effects of CSF Aβ and t-tau on the risk for LOAD (CSF Aβ, IVW OR = 0.81, 95%CI = 0.46–1.41, p = 0.45; CSF t-tau, IVW OR = 1.22, 95%CI = 0.91–1.65, p = 0.19) (Table 1, Fig. 1B, and Fig. 1D).
Two-sample Mendelian randomization for the causal relationship of amyloid-β, phosphorylated tau, and total tau with the risk for late-onset Alzheimer’s disease
IVW, inverse-variance-weighted; OR, odds ratio; CI, confidence interval; SNP, single-nucleotide polymorphism; NA, not available. Significant values at the p < 0.05 level are highlighted in bold. aIndicates the OR for AD per one-standard-deviation increase in genetically predicted amyloid-β, phosphorylated tau, or total tau. bTop SNPs with p < 1×10⁻⁵ were included in the analysis.
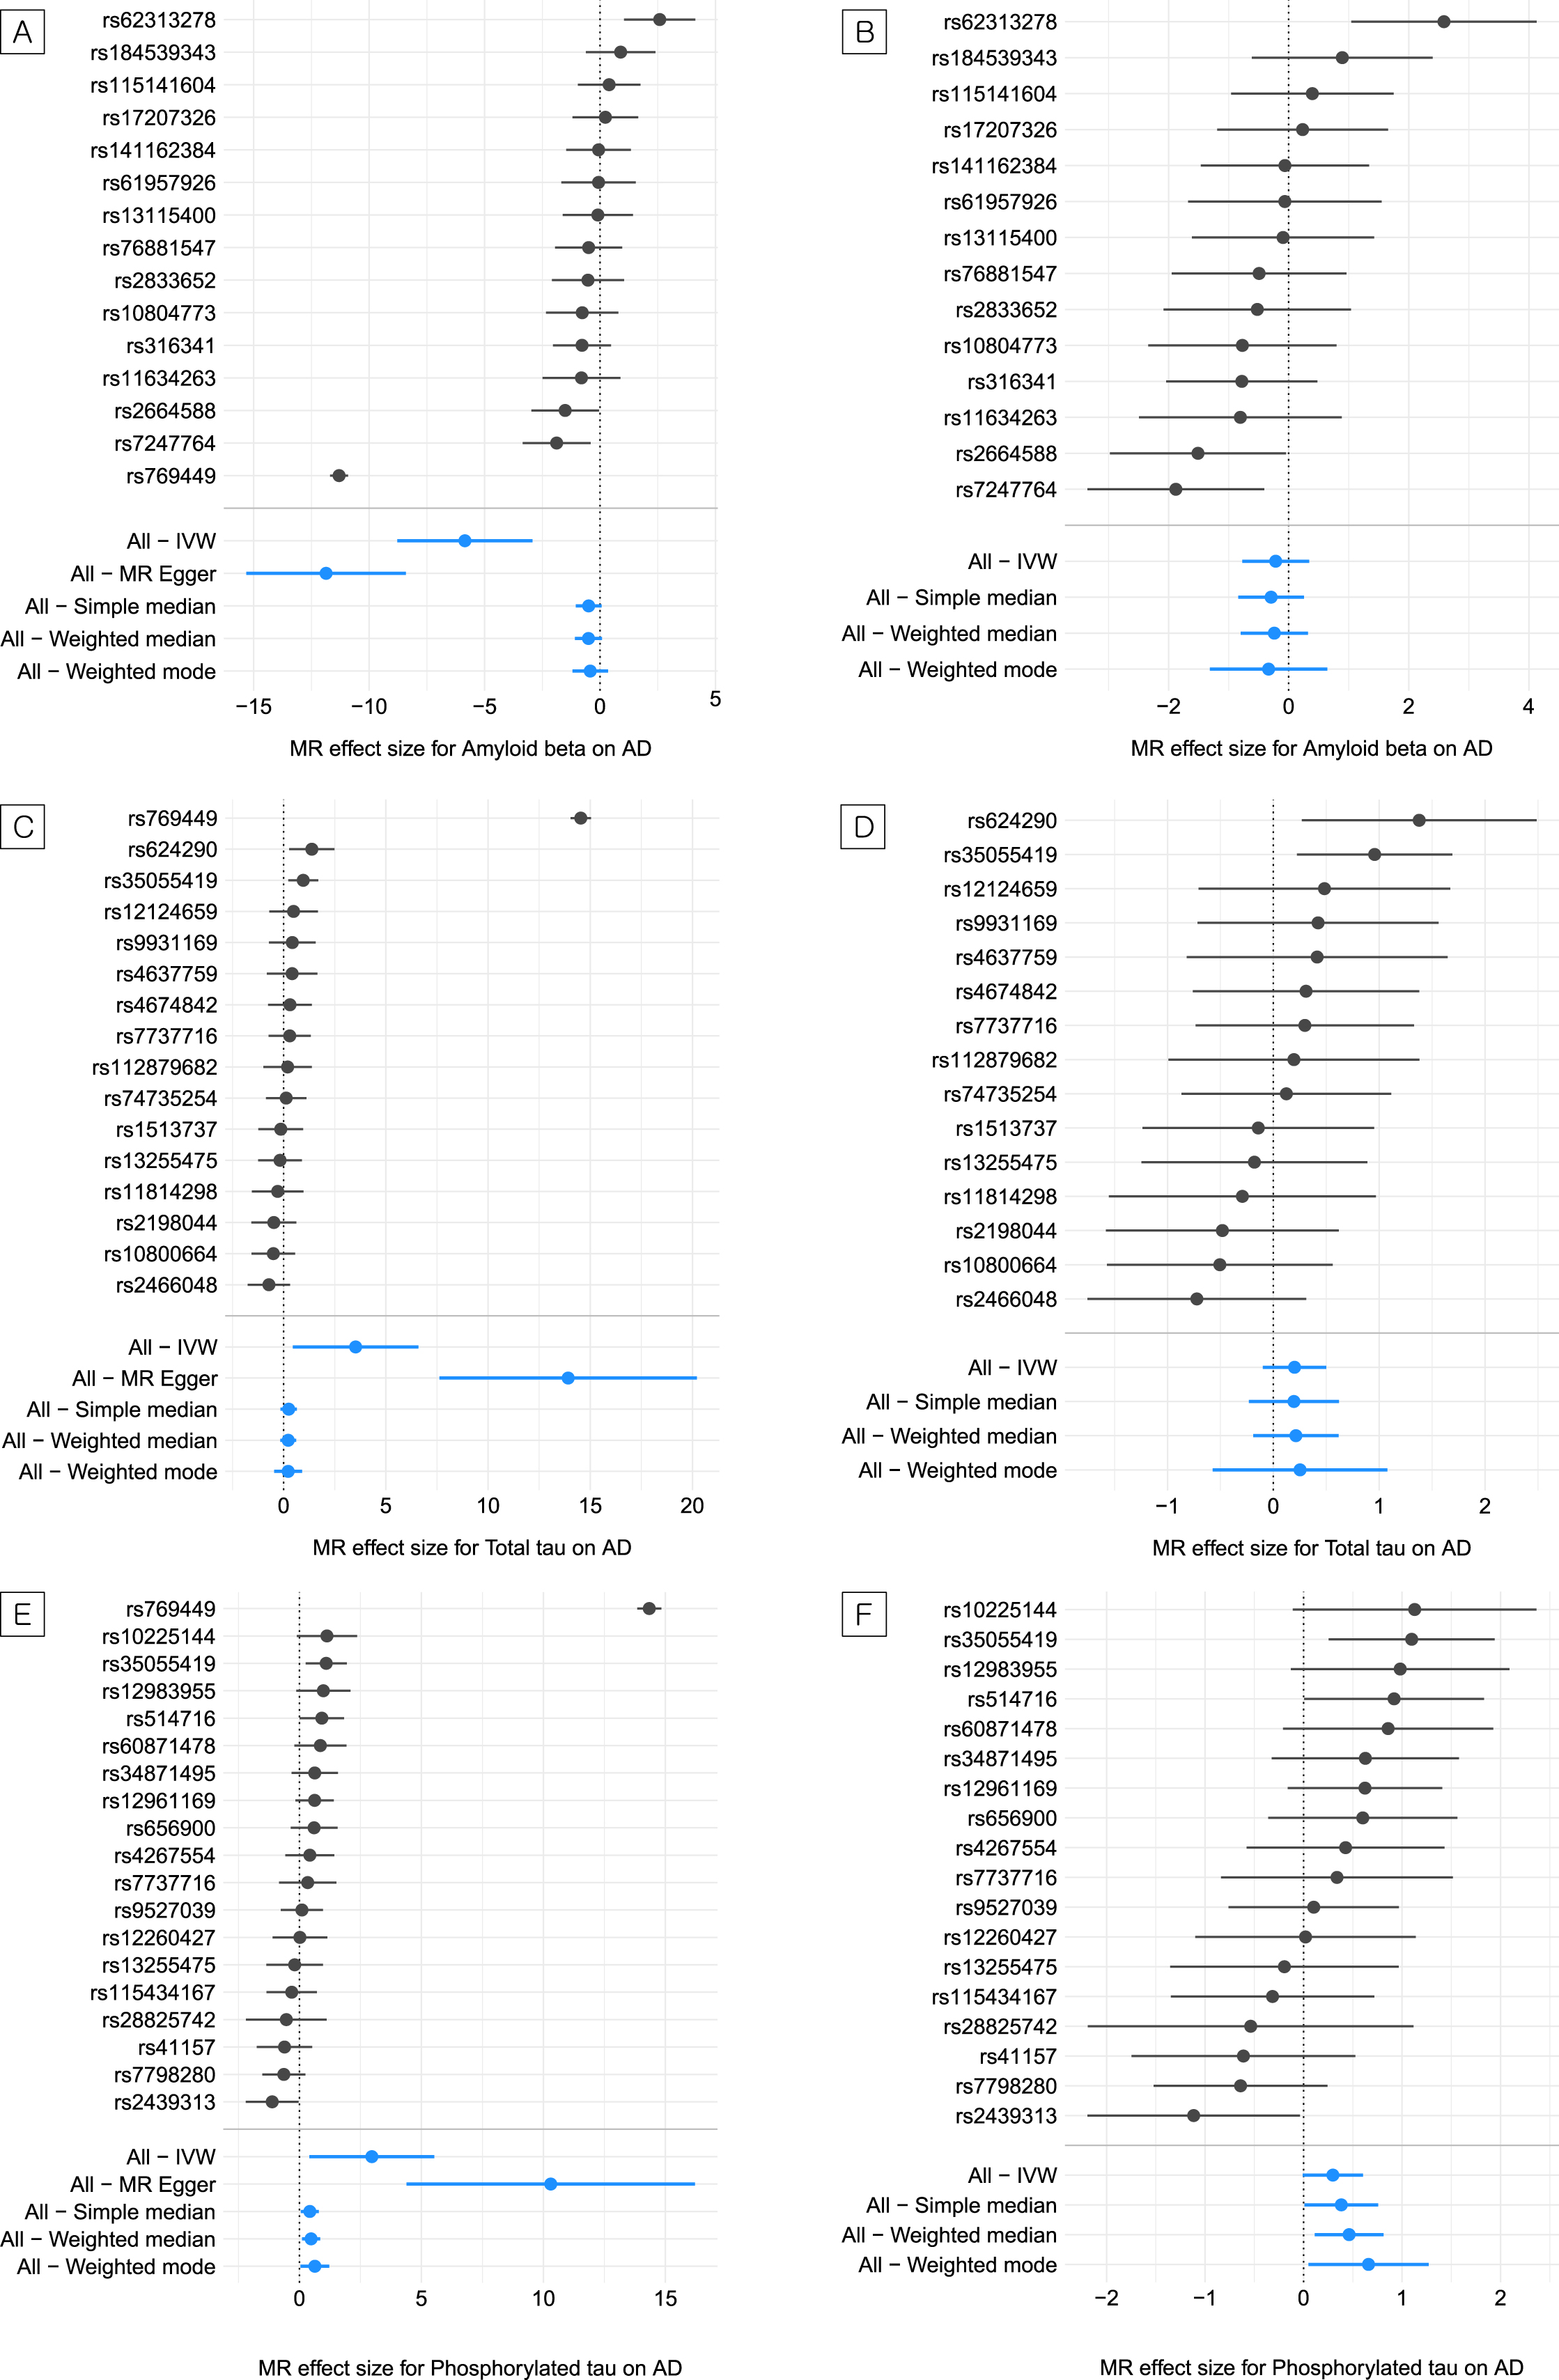
Estimated causal effects (logarithm of the odds ratio) of amyloid-β, phosphorylated tau, and total tau on the risk for late-onset Alzheimer’s disease. A) Forest plot of the estimate of amyloid-β on the risk for Alzheimer’s disease for each or all variants. B) Forest plot of the estimate of amyloid-β on the risk for Alzheimer’s disease for each or all variants except the apolipoprotein E (APOE) variant (rs769449). C) Forest plot of the estimate of phosphorylated tau on the risk for Alzheimer’s disease for each or all variants. D) Forest plot of the estimate of phosphorylated tau on the risk for Alzheimer’s disease for each or all variants except the APOE variant (rs769449). E) Forest plot of the estimate of total tau on the risk for Alzheimer’s disease for each or all variants. F) Forest plot of the estimate of total tau on the risk for Alzheimer’s disease for each or all variants except the APOE variant (rs769449).
We found a prominent association between CSF p-tau and the risk for LOAD (IVW OR, 19.46 for LOAD per one-SD increase in the genetically predicted CSF p-tau; 95%CI, 1.50–2.52×10²; p = 0.02) (Table 1 and Fig. 1E). Unlike CSF Aβ and t-tau, the causal effects of p-tau on the risk for LOAD were significant and consistent in the direction of multiple MR methods. Even in the MR test for CSF p-tau without the APOE variant, the casual effects of all methods except MR-Egger regression were marginally associated with the risk for LOAD (IVW OR, 1.35 for LOAD per one-SD increase in the genetically predicted CSF p-tau; 95%CI, 0.99–1.83; p = 0.0565) (Table 1 and Fig. 1F). MR-Egger was shown to yield minimally biased estimates regardless of the pleiotropic SNPs in the instruments [29]. As we excluded the potential pleiotropic APOE variant in our MR test for the APOE sensitivity analysis, the IVW had a greater power and derived a more precise estimate than the MR-Egger regression. In addition, there was no evidence of horizontal pleiotropy in the MR-Egger intercept test (intercept = –0.01, SE = 0.02, p = 0.45). Therefore, we did not perform MR analysis using MR-Egger for all three CSF biomarkers. We confirmed that there was moderate heterogeneity between IVs (Q = 28, p = 0.05, I2 [%] = 39) after removing the APOE variant for CSF p-tau (Supplementary Table 4).
Given the observed ORs between measured CSF biomarkers and the risk for LOAD, our MR analysis, including primary, secondary, and sensitivity analyses, showed sufficient statistical power (> 90%) to detect the causal effects of CSF biomarkers on the risk for LOAD with a level of significance of 0.05. Supplementary Table 5 presents the estimates of the statistical power for our MR analysis.
We tested whether the corresponding genes of the instrumental genetic variants were enriched in specific biological pathways to elucidate the potential mechanisms of the causal association. Twelve lipid-related pathways were found to be significant (Benjamini-Hochberg false discovery rate < 0.05) in CSF biomarkers and AD. For example, independent gene set analyses for AD and CSF biomarkers based on GWAS summary statistics showed significant enrichment of the mapped genes in lipid transporting particles, including chylomicron, lipoprotein metabolism, and protein-lipid complex formation. The significant pathways are presented in Supplementary Tables 6–8.
DISCUSSION
Using TSMR with genetic instruments from large-scale GWASs, we investigated the shared genetic background between CSF biomarkers and the risk for LOAD. In the present study, we found a shared genetic background between CSF p-tau and the risk for LOAD, even after removing the APOE variant (rs769449). The CSF Aβ and t-tau instruments supported the shared genetic background between these biomarkers and the risk for LOAD at first, but the association vanished after the exclusion of the APOE variant (rs769449). Our results are not only consistent with those of recent reports but also support the causal effect of these biomarkers, especially p-tau, in the risk for LOAD [30].
Although Aβ, p-tau, and t-tau in CSF have been reported to be useful as disease progression markers, randomized clinical trials (RCTs) have provided limited evidence on their causal relationship with LOAD [31, 32]. Recent RCTs on the elimination of accumulated Aβ or tau proteins could not provide solid evidence for improvement of the symptoms of LOAD [33, 34]. While clinical trials with small sample sizes have shown that eliminating Aβ elements led to symptomatic improvement, larger studies have failed to produce consistent results [33]. Agents reducing tau phosphorylation showed promising benefits in pilot clinical studies but failed to show significant improvements in a cohort study [35]; tau aggregation inhibitors showed a similar pattern [36]. Although another approach for clarifying the causality for LOAD is the induced pathologic accumulation of Aβ and tau proteins in RCTs, such intervention in humans is not allowed due to ethical issues. Instead, the development of AD phenotypes has been attempted with numerous animal models with accumulating Aβ and tau proteins, but these still have various limitations [37, 38]. Transgenic animal models generally represent familiar AD rather than sporadic LOAD because they target a specific pathologic substance; therefore, they cannot provide a full explanation of LOAD. In addition, animal models can not represent the complex symptomatology of dementia that is present in humans.
In consideration of these perspectives, the principles of MR can be applied to clearly evaluate the shared genetic background between these biomarkers and the risk for LOAD, which provides clues for the causality of these biomarkers in the etiology of LOAD. This approach, which is conceptually similar to that of RCTs, is based on Mendel’s law of segregation in which genetic variants are randomly allocated during meiosis, and these genetic variants are consequently independent of many confounding factors or reverse causation. Thus, an MR analysis could advance the inference regarding the risk for LOAD driven by the genetically determined risk for amyloid accumulation and tau pathology. Our results suggest the potential causal relationships between Aβ, p-tau, and t-tau proteins in CSF and the risk for LOAD. We also attempted to clarify this association between p-tau and the risk for LOAD after exclusion of the impact of the APOE variant, using MR with genetic instruments selected from large-scale GWASs.
The causal estimates in our analysis were based on the largest GWASs to date, which may increase the precision of the estimates. The sample size (3, 146 participants) of the GWASs for CSF biomarkers used in this study was twice as large as that (1,269 participants) in a previous study [12]. As the power to detect the significant genetic variants increased by the larger sample size, more genome-wide significant and suggestive SNPs associated with CSF levels (Aβ, p-tau, and t-tau) were identified. Therefore, the number of available genetic variants as IVs for MR analysis was increased compared to those in the previous study, potentially leading to a more robust MR analysis.
We estimated a 1.35-fold increase in the risk for LOAD per one-SD increase in the CSF p-tau. These directions of association are consistent with those in previous reports [33]. Markedly increased levels of p-tau proteins and decreased levels of Aβ in CSF are represented as specific findings in LOAD [30].
Aβ accumulation in neuronal plaques and their binding to various receptors are known LOAD hallmarks. Aβ binding to receptors is a process leading to neuronal toxicity, inducing mitochondrial dysfunction and oxidative stress [39]. The pathologic process of tau in LOAD consists of the development of phosphorylated pre-tangles and the formation of neuropil threads. After a process of hyperphosphorylation, acetylation, N-glycosylation, and truncation, tau forms tangles in LOAD [40]. The observed shared genetic background of Aβ and p-tau observed in our MR analysis supports that Aβ and p-tau may play important roles in the pathophysiology of LOAD. In addition, the further elaborate approach, which excluded the APOE variant and led to maintained significant results, suggests that there is an independent implication of the level of p-tau on the risk for LOAD. Further studies investigating the biological mechanisms are needed.
CSF t-tau and the risk for LOAD were consistently associated with white-matter hyperintensity changes, placing greater emphasis on neurodegenerative change [41]. While CSF p-tau levels are increased specifically in LOAD, CSF t-tau levels can be increased in various conditions of neurodegeneration, including LOAD and other brain disorders [42]. Our results may support a recent proposal emphasizing tau hyperphosphorylation in AD versus excessive production of tau proteins [40].
In this study, we observed that genes of the instrumental genetic variants were enriched in the metabolism of lipid and lipoprotein pathways such as lipid transportation, lipoprotein metabolism, and protein-lipid complex formation. Lipids have been suggested to be involved in blood-brain barrier function, amyloid-β protein precursor processing, neural plasticity, receptor signaling, and neuroinflammation [43]. Altered transportation of cholesterol and sphingolipids was also previously observed in both CSF and plasma in AD [44]. These pathways may support the shared genetic background between CSF biomarkers and AD and could suggest the importance of alteration in lipid-related processes in AD etiology.
The measured CSF biomarkers in AD reflect both the production and clearance of these markers at a given time. In contrast, neuroimages represent the neuropathologic load or damage accumulated over time directly in the brain. Thus, imaging GWAS, such as amyloid or tau deposition in the brain measured by positron emission tomography as phenotypes [45], could provide additional information for the association between these biomarkers and the risk for LOAD. However, the sample size of the current imaging genetic studies for these biomarkers has been limited. Further studies with larger samples of genetic and imaging data could be helpful.
A recent TSMR study reported an insignificant association between CSF biomarkers and broad AD phenotypes (clinically diagnosed AD and parental diagnosis of AD) [46]. However, there are few methodological differences between our study and the study by Yeung et al. We selected IVs with a focus on clinically diagnosed AD, while Yeung et al. included both family history of AD and diagnosed AD. This discrepancy in phenotype definition could affect the significance of TSMR results. Specifically, our results showed that p-tau was marginally significant even after removing the APOE variant, subsequent to the results of the primary analysis. In contrast, it was not significant in Yeung et al. In addition, we provided a possibility for lipid metabolism as a biological pathway from CSF biomarkers to AD through GSEA analysis.
This study has several limitations. First, our causal estimates may be affected by several factors, including horizontal pleiotropy, which was not detected by the applied MR sensitivity analysis methods, and the possibility of misclassified LOAD cases. Unlike the balanced or positive bias induced by horizontal pleiotropy, the misclassified cases may lead to null results. However, the estimates were statistically significant and consistent for the various methods applied in our analysis. Second, our GWAS data included samples of Caucasian ancestry, which may limit the generalization of our findings. Third, it is difficult to identify the exact sample overlap between the CSF and AD GWAS. However, we can evaluate the magnitude of participant overlap using the concept of Burgess et al., 2016 [17]. The key concept in understanding the bias due to sample overlap is the covariance between the association estimates. The estimated overlap proportion was less than 5%; therefore, a bias due to sample overlap would be minimal. Finally, even though we employed summary statistics from the largest GWASs for CSF biomarkers to date [9], only a few SNPs passed the conventional GWAS threshold (p < 5×10⁻⁸) and were not sufficient to perform MR analysis. Therefore, we applied a relaxed threshold to include more IVs, as performed in other psychiatric MR studies. Despite using instruments with a less stringent threshold, which may lead to null findings, our MR power analysis showed a statistical power greater than 90%, and our analysis derived significant causal estimates.
CONCLUSIONS
In conclusion, we found a shared genetic background between CSF biomarkers (Aβ, p-tau, and t-tau) and the risk for LOAD using TSMR analysis. The association between CSF p-tau and the risk for LOAD was robust after excluding the APOE variant. Our results suggest that there is a causal association between CSF biomarkers and the risk for LOAD, and the etiology of LOAD involves multiple biological processes, including amyloid and tau proteins, in the pathophysiology of AD. This complex nature of LOAD could partly explain the multiple recent failures of clinical trials of anti-amyloid monotherapy. Further MR studies for multiple candidate biomarkers could be helpful to identify appropriate drug targets for LOAD, and large-scale GWAS data with a sufficient number of IVs are necessary to validate the causality of CSF Aβ and p-tau in the risk of LOAD.
AVAILABILITY OF DATA AND MATERIALS
These data do not belong to the authors, and the authors are not permitted to share them. The GWAS summary statistics for LOAD that support the findings of this study are openly available on the National Institute on Aging Genetics of Alzheimer’s Disease Data Storage Site (https://www.niagads.org/). The GWAS summary statistics of Aβ, p-tau, and t-tau are available from the corresponding author (Dr. Deming, Y) of the CSF biomarker GWAS study upon reasonable request.
ETHICS APPROVAL AND CONSENT TO PARTICIPATE
This study was approved by the Institutional Review Board of the Samsung Medical Center (IRB no. SMC 2016-12-064). Informed consent was waived by the board.
Footnotes
ACKNOWLEDGMENTS
The authors thank the researchers at the Washington University School of Medicine for providing the summary statistics of GWAS for CSF biomarkers.
This work was supported by a National Research Foundation (NRF) of Korea Grant, funded by the Korean government (NRF-2018R1C1B6001708 and 2021R1A2C4001779; WM and NRF-2019R1A2C4070496; HHW). This work was also supported by the National Research Foundation of Korea Grant funded by the Korean Government (NRF-2012S1A6A3A01033504).