
Abstract
Background:
As Alzheimer’s disease (AD) and cerebral small vessel disease (CSVD) commonly coexist, the interaction between two has been of the considerable interest.
Objective:
We determined whether the association of Aβ and tau with cognitive decline differs by the presence of significant CSVD.
Methods:
We included 60 subcortical vascular cognitive impairment (SVCI) from Samsung Medical Center and 82 Alzheimer’s disease-related cognitive impairment (ADCI) from ADNI, who underwent Aβ (florbetaben or florbetapir) and tau (flortaucipir, FTP) PET imaging. They were retrospectively assessed for 5.0±3.9 and 5.6±1.9 years with Clinical Dementia Rating-sum of boxes (CDR-SB)/Mini-Mental State Examination (MMSE). Mixed effects models were used to investigate the interaction between Aβ/tau and group on CDR-SB/MMSE changes.
Results:
The frequency of Aβ positivity (45% versus 54.9%, p = 0.556) and mean global FTP SUVR (1.17±0.21 versus 1.16±0.17, p = 0.702) were not different between the two groups. We found a significant interaction effect of Aβ positivity and SVCI group on CDR-SB increase/MMSE decrease (p = 0.013/p < 0.001), and a significant interaction effect of global FTP uptake and SVCI group on CDR-SB increase/MMSE decrease (p < 0.001 and p = 0.030). Finally, the interaction effects of regional tau and group were prominent in the Braak III/IV (p = 0.001) and V/VI (p = 0.003) not in Braak I/II region (p = 0.398).
Conclusion:
The association between Aβ/tau and cognitive decline is stronger in SVCI than in ADCI. Therefore, our findings suggested that Aβ positivity or tau burden (particularly in the Braak III/IV or V/VI regions) and CSVD might synergistically affect cognitive decline.
Keywords
INTRODUCTION
The interaction between Alzheimer’s disease (AD) and cerebral small vessel disease (CSVD) has been of the considerable interest. In fact, many pathologic studies demonstrated that AD pathology and CSVD could contribute to cognitive impairment [1–7]. However, some studies suggested that minimal degree of CSVD is not critical for cognitive decline in advanced AD despite its importance in dementia development [8–10].
Advance in molecular imaging has enabled in vivo detection of AD pathologic hallmarks (Aβ and tau) in subcortical vascular cognitive impairment (SVCI), which is characterized by extensive CSVD [7, 12]. In fact, we demonstrated that Aβ+ SVCI had less frequent tau positivity than Aβ+ AD related cognitive impairment (ADCI) even at similar level of cognition [13]. Given that tau is related to cognitive impairment, this finding indicates that CSVD burden in SVCI patients has an additive or synergistic effect on cognition with AD pathologies. Furthermore, similar level of tau may have a greater influence on cognitive decline in SVCI than in ADCI, considering that both tau [14, 15] and CSVD [16, 17] are associated with cortical atrophy, that precedes cognitive impairment. In fact, given current therapeutic trials targeting disease-specific pathologic molecules, the relationship of Aβ or tau with CSVD are worth to be explored.
In the present study, we determined whether the association of Aβ and tau with cognitive decline differs by the presence of significant CSVD using two retrospective cohorts with different levels of CSVD burden: ADCI and SVCI. We hypothesized that the association of Aβ or tau and cognitive decline is stronger in SVCI than in ADCI.
MATERIALS AND METHODS
Subjects
We included two independent cohorts: 1) SVCI group with significant CSVD burden from Samsung Medical Center (SMC), and 2) cognitively impaired group without significant CSVD burden from Alzheimer’s Disease Neuroimaging Initiative (ADNI) cohort, which we referred to as ADCI in this study although some of them are Aβ negative. All participants underwent Aβ PET imaging, tau PET imaging, and brain MRI.
Cohort 1: SVCI patients from SMC cohort
We recruited a total of 63 patients with SVCI at SMC between August 2015 and December 2016 and all of them underwent neuropsychological tests, brain MRI, Aβ (18F-florbetaben) and tau (18F-flortaucipir [FTP]) PET imaging at baseline. Patients had to meet the following criteria to be diagnosed with SVCI: 1) subjective cognitive complaint by the patient or caregiver, 2) objective cognitive impairment below the 16th percentile in any domain including language, visuospatial, memory, or frontal function on neuropsychological tests, 3) severe ischemia on brain MRI, defined as periventricular white matter hyperintensities (WMH)≥10 mm and deep WMH≥25 mm, as modified from the Fazekas ischemia criteria [18], and 4) focal neurologic symptoms or signs. As we excluded three SVCI patients due to segmentation error during FTP analysis, the final sample included 60 SVCI patients, among whom 30 were diagnosed with subcortical vascular dementia (SVaD) and 30 with subcortical vascular mild cognitive impairment (MCI) according to the limitation of activity of daily living at enrollment.
All participants were assessed through clinical interviews and neurologic examinations, and clinical diagnosis was established by consensus among a multidisciplinary team. Blood tests included complete blood count, blood chemistry test, vitamin B12/folate measurement, syphilis serology, thyroid function test, and APOE genotyping. Patients were excluded if they had territorial infarctions, cortical stroke, brain tumor, or vascular malformation on MRI. Patients having WMH due to radiation injury, multiple sclerosis, vasculitis, or leukodystrophy were also excluded.
We obtained written informed consent from each patient, and the institutional review board of Samsung Medical Center approved the study protocol.
Cohort 2: ADCI patients from the ADNI cohort
We included ADNI participants who underwent the 3.0T brain MRI, 18F-florbetapir and 18F-FTP PET scans. As of 14 January 2018, a total of 225 patients met this qualification, of whom 83 were MCI and 21 were AD (remaining 121 subjects with clinically normal cognition) according to the clinical assessment done closest to the time of FTP PET scanning. The diagnostic criteria for MCI and AD in ADNI were previously described [19]. Among MCI and AD participants, three MCI and five AD patients were excluded due to segmentation error during FTP analysis. Further, we excluded 11 MCI and three AD patients who have intervals between FTP and florbetapir PET scans larger than 3 years. Although there were more ADNI3 participants who underwent florbetaben instead of florbetapir PET, we only included flobetapir PET in this study to be able to apply the same standard for amyloid positivity, and we considered that newly recruited ADNI3 participants who did not have at least two retrospective assessments would not affect the study results.
The ADNI was launched in 2003 as a public-private partnership, led by Principal Investigator Michael W. Weiner [20]. Full inclusion/exclusion criteria are described in detail at http://adni.loni.usc.edu/methods/documents/. Briefly, all subjects were between the ages of 55 and 90 years, had completed at least 6 years of education, were fluent in Spanish or English, and were free of any other significant neurologic diseases.
Neuropsychological tests
All patients from SMC cohort underwent standardized neuropsychological tests at baseline using the Seoul Neuropsychological Screening Battery (SNSB), which contains tests for attention, language, visuospatial function, verbal memory, visual memory, frontal-executive function, Mini-Mental State Examination (MMSE), and clinical dementia rating sum of boxes (CDR-SB) [21–23]. All participants from ADNI cohort underwent neuropsychological tests at least once prior to FTP PET imaging. In this study, we used CDR-SB and MMSE as cognitive outcome measures, because out of all neuropsychological tests performed, those were the only tests performed in the both groups. Therefore, we obtained retrospective CDR-SB and MMSE scores from the time point of FTP PET scanning (= baseline) in all study participants. The mean retrospective assessment periods were 5.0±3.9 and 5.6±1.9 years, and the numbers of cognitive assessments were 4.6±3.3 and 10.5±3.2 for the SVCI and ADCI groups, respectively. Among 60 SVCI patients, 11 patients had only one neuropsychological assessment which was not included in the longitudinal analysis.
MRI acquisition
For participants from SMC cohort, we acquired standardized T2, 3-dimensional T1 turbo field echo images, 3-dimensional FLAIR, and T2×-weighted gradient echo (GRE)-MRIs at SMC using the 3.0T MRI scanner (Philips 3.0T Achieva; Philips Healthcare, Andover, MA, USA) as previously described [24]. For ADNI participants, MRIs were acquired at ADNI sites equipped with 3.0T MRI scanners using a 3D MP-RAGE or IR-SPGR T1-weighted sequences, as described online (http://adni.loni.usc.edu/methods/documents/mri-protocols). Measurement of WMH volume was performed on a combination of FLAIR and 3D T1 images using a modified Bayesian probability structure based on a previously published method of histogram fitting at University of California at Davis [25].
18F-florbetaben and 18F-florbetapir PET acquisition and imaging processing
All patients from SMC cohort completed 18F-Florbetaben PET scans at SMC using Discovery STe PET/CT scanner (GE Medical Systems, Milwaukee, WI, USA) in three-dimensional scanning mode that examined 47 slices of 3.3 mm thickness spanning the entire brain. CT images were acquired using a 16-slice helical CT (140 KeV, 80 mA; 3.75 mm section width) for attenuation correction. A 20 min emission PET scan with dynamic mode (consisting of 4×5 min frames) was performed 90 min after injection of approximately 300 MBq 18F-Florbetaben. Three-dimensional PET images were reconstructed in a 128×128×48 matrix with 2×2×3.27 mm voxel size using the ordered-subsets expectation maximization (OSEM) algorithm (iteration = 4 and subset = 20).
All ADNI participants underwent 18F-florbetapir PET scans at least once. We obtained global standardized uptake value ratios (SUVRs) from ADNI dataset (ADNIMERGE.csv). Details of imaging acquisition and analysis for global SUVRs are described in detail elsewhere [26, 27]. Briefly, 18F-florbetapir PET images consisted of 4×5 min frames acquired at 50–70 min post-injection, and these were realigned, averaged, resliced to a common voxel size (1.5 mm×1.5 mm×1.5 mm), and smoothed to a common resolution of isotropic 8 mm full-width-at-half-maximum. MPRAGE images acquired at the time of 18F-Florbetapir PET scanning were used as a structural template to define cortical and reference regions. 18F-Florbetapir PET scans for each participant were coregistered to structural MRI scans, which were subsequently used to extract weighted cortical retention means from frontal, cingulate, parietal, and temporal regions that were averaged and divided by a whole cerebellum reference region to establish a global SUVR according to ADNI protocol.
18F-flortaucipir imaging processes
SMC cohort patients underwent 18F- FTP PET at Gangnam Severance Hospital using a Biograph mCT PET/CT scanner (Siemens Medical Solutions, Malvern, PA, USA). At 80 min after intravenous bolus injections of approximately 280 MBq 18F- FTP, tau PET images were acquired for 20 min. Prior to the PET scan, we applied a head holder to minimize head motion and acquired brain CT images for attenuation correction. Three-dimensional PET images were reconstructed in a 256×256×223 matrix with 1.591×1.591×1 mm voxel size using the OSEM algorithm (iteration = 6 and subset = 16). ADNI participants underwent 18F-FTP PET scans, which were acquired at 75 min post-injection, for 30 min (6×5 min frames).
PET images were co-registered to individual MRIs, which were normalized to a T1-weighted MRI template. We applied normalized parameters to transform co-registered PET images into the MRI template. SUVR were calculated using cerebellar gray matter as a reference region. Then, SUVR images were spatially smoothed with an 8 mm Gaussian kernel. Data processing was performed using SPM version 8 (SPM8) through Matlab 2014b (MathWorks, Natick, MA, USA).
In this study, we used FTP SUVR as continuous variables to represent tau burden. For the regional PET uptake analysis, we used Freesurfer software version 5.1 (http://surfer.nmr.mgh.harvard.edu/) to delineate region of interest (ROI) masks on the native space. We measured regional SUVR for 25 cortical regions (which consisted of the following: inferior, middle, and superior frontal, orbitofrontal, paracentral, precentral, inferior and superior parietal, postcentral, precuneus, supramarginal, medial and lateral occipital, lingual, insula, inferior, middle, and superior temporal, fusiform, entorhinal, parahippocampal, anterior and posterior cingulate, amygdala and hippocampus) and then created bilateral Braak stage ROIs. The partial volume effect (PVE) was not corrected.
Definition of Aβ and tau burden
We defined Aβ positivity if florbetaben scans were positive (when visual assessment was scored as 2 or 3 on the brain Aβ plaque load scoring system [28]) in SVCI patients, and if the global florbetapir PET SUVR was higher than cutoff of 1.11 in ADCI patients [29, 30]. Further, to quantify Aβ burden on two different PET scans, we also transformed SUVR to centiloid unit using Klunk method [31].
We then used the global and regional FTP SUVR values as a marker of tau burden in both groups. For regional SUVR measurement, we used freeSurfer-derived ROI that approximates the anatomical definitions of the Braak stages, as suggested by UC Berkeley [32, 33].
Statistical analysis
We compared demographics and baseline (= at the time point of FTP PET scanning) clinical or imaging characteristics between SVCI and ADCI groups using chi-square tests or student’s t-tests, appropriately. We used an analysis of covariance to compare WMH volumes between the two groups after adjusting for age and total cerebral volume.
We used linear mixed effects models to investigate the interaction effects of Aβ or tau burden with CSVD burden on longitudinal CDR-SB/MMSE changes. Therefore, the outcome was the time-varying CDR-SB/MMSE scores at each follow-up point. We included fixed effects as below: age, gender, education years, baseline Aβ positivity, global tau burden (global FTP SUVR), baseline CDR-SB or MMSE scores, time interval (t) between baseline and each follow-up time point, and the two-way and three-way interaction terms of Aβ positivity or global tau burden, time interval (t), and group (SVCI versus ADCI). (age, gender, education, group, time interval (t), Aβ positivity, global FTP SUVR, baseline CDR-SB or MMSE scores, Aβ positivity×t, Aβ positivity×group, global FTP SUVR×t, global FTP SUVR×group, t×group, Aβ positivity×group×t, global FTP SUVR×group×t). Patients were included as random effects. Further, we investigated the interactive effects of global tau burden with CSVD burden on CDR-SB/MMSE changes, with subgroup analysis performed in the Aβ+and Aβ–groups; therefore, we included time-varying CDR-SB/MMSE scores at each follow-up point as outcome, and age, gender, education, group, time interval (t), baseline CDR-SB or MMSE scores, global FTP SUVR, global FTP SUVR×t, global FTP SUVR×group, t×group, global FTP SUVR×group×t as fixed effects. As a sensitivity analysis, we used centiloid instead of Aβ positivity to see the effect of quantitative Aβ burden in the model. Then, we investigated the above analyses including regional (Braak I/II, Braak III/IV, or Braak V/VI regional) FTP SUVR instead of global FTP SUVR to investigate the interaction effects of Aβ positivity or regional tau burden with CSVD burden (group) on CDR-SB/MMSE changes. For all the above analyses, we included the presence of APOE4 genotype as the fixed effect. All statistical analyses were performed with STATA/SE version 14.0. Statistical significance was defined as two-tailed p < 0.05.
RESULTS
Patient characteristics
Mean age was not significantly different between the SVCI and ADCI group (p = 0.059). The SVCI group had a higher ratio of female gender (p < 0.001) and lower education years (p < 0.001) compared to the ADCI group. The frequency of APOE4 carriers was not significantly different between the two groups (p = 0.449). SVCI group showed about 7-fold higher WMH volume compared to the ADCI group (p < 0.001), which confirms that SVCI group had obviously greater CSVD burden. The SVCI group had worse baseline cognition in terms of CDR-SB (p < 0.001) and MMSE scores (p < 0.001) compared to the ADCI group. However, the frequency of amyloid PET positivity (45% versus 54.9%, p = 0.556), mean global FTP SUVR (1.17±0.21 versus 1.16±0.17, p = 0.702) and mean regional FTP SUVR were not significantly different between the two groups (Table 1). Additionally, we compared the average CDR-SB and MMSE scores (at 2, 4, and 6 years before the baseline) between SVCI and ADCI groups after adjusting for age (at that time point), sex, and education. They were not significantly different between two groups (Supplementary Table 1).
Subjects demographics
Values are expressed as means±standard deviations, numbers (%), or median (interquartile range). aadjusted for age and total brain volume. SVCI, subcortical vascular cognitive impairment; SMC, Samsung Medical Center; ADCI, Alzheimer’s disease related cognitive impairment; ADNI, Alzheimer’s Disease Neuroimaging Initiative; n, number; CSVD, cerebral small vessel disease; WMH, white matter hyperintensity; CDR-SB, cognitive dementia rating-sum of boxes; MMSE, mini-mental status examination; PET, positron emission tomography, FTP, flortaucipir; SUVR, standardized uptake value ratio.
Interaction effects of Aβ and CSVD burden on cognitive decline
SVCI and ADCI were retrospectively assessed for 5.0±3.9 and 5.6±1.9 years, respectively. We found a significant interaction effect between Aβ positivity×group (SVCI versus ADCI) on CDR-SB (p = 0.013) or MMSE (p < 0.001) changes (Table 2, Fig. 1). We also found a significant interaction effect between centiloid×group (SVCI versus ADCI) on CDR-SB (p = 0.005) or MMSE (p < 0.001) changes (Table 3, Fig. 3). That is, Aβ burden is associated with worse cognitive decline, but its impact is higher in the SVCI than in the ADCI group, regardless of global tau burden (= global FTP SUVR). The results remained the same after including the presence of APOE4 genotype as the fixed effect (Supplementary Table 2).
Results of mixed effect models to investigate the interactive effect between Aβ or global tau and CSVD burden on cognitive declines
CSVD, cerebral small vessel disease; SVCI, subcortical vascular cognitive impairment; SUVR, standardized uptake value ratio; CDR-SB, cognitive dementia rating-sum of boxes; MMSE, mini-mental status examination; FTP, flortaucipir.

Interaction effects of Aβ positivity and CSVD group on (a) CDR-SB and (b) MMSE changes. Y axis represents the predicted scores for each follow up year derived from the predicted model equation using a linear mixed effect model. CSVD, cerebral small vessel disease; ADCI, Alzheimer’s disease-related cognitive impairment; SVCI, subcortical vascular cognitive impairment; CDR-SB, Cognitive Dementia Rating-sum of boxes; MMSE, Mini-Mental Status Examination.
Results of mixed effect models to investigate the interactive effect between Aβ (centiloid) or global tau and CSVD burden on cognitive declines
CSVD, cerebral small vessel disease; SVCI, subcortical vascular cognitive impairment; SUVR, standardized uptake value ratio; CDR-SB, cognitive dementia rating-sum of boxes; MMSE, mini-mental status examination; FTP, flortaucipir.
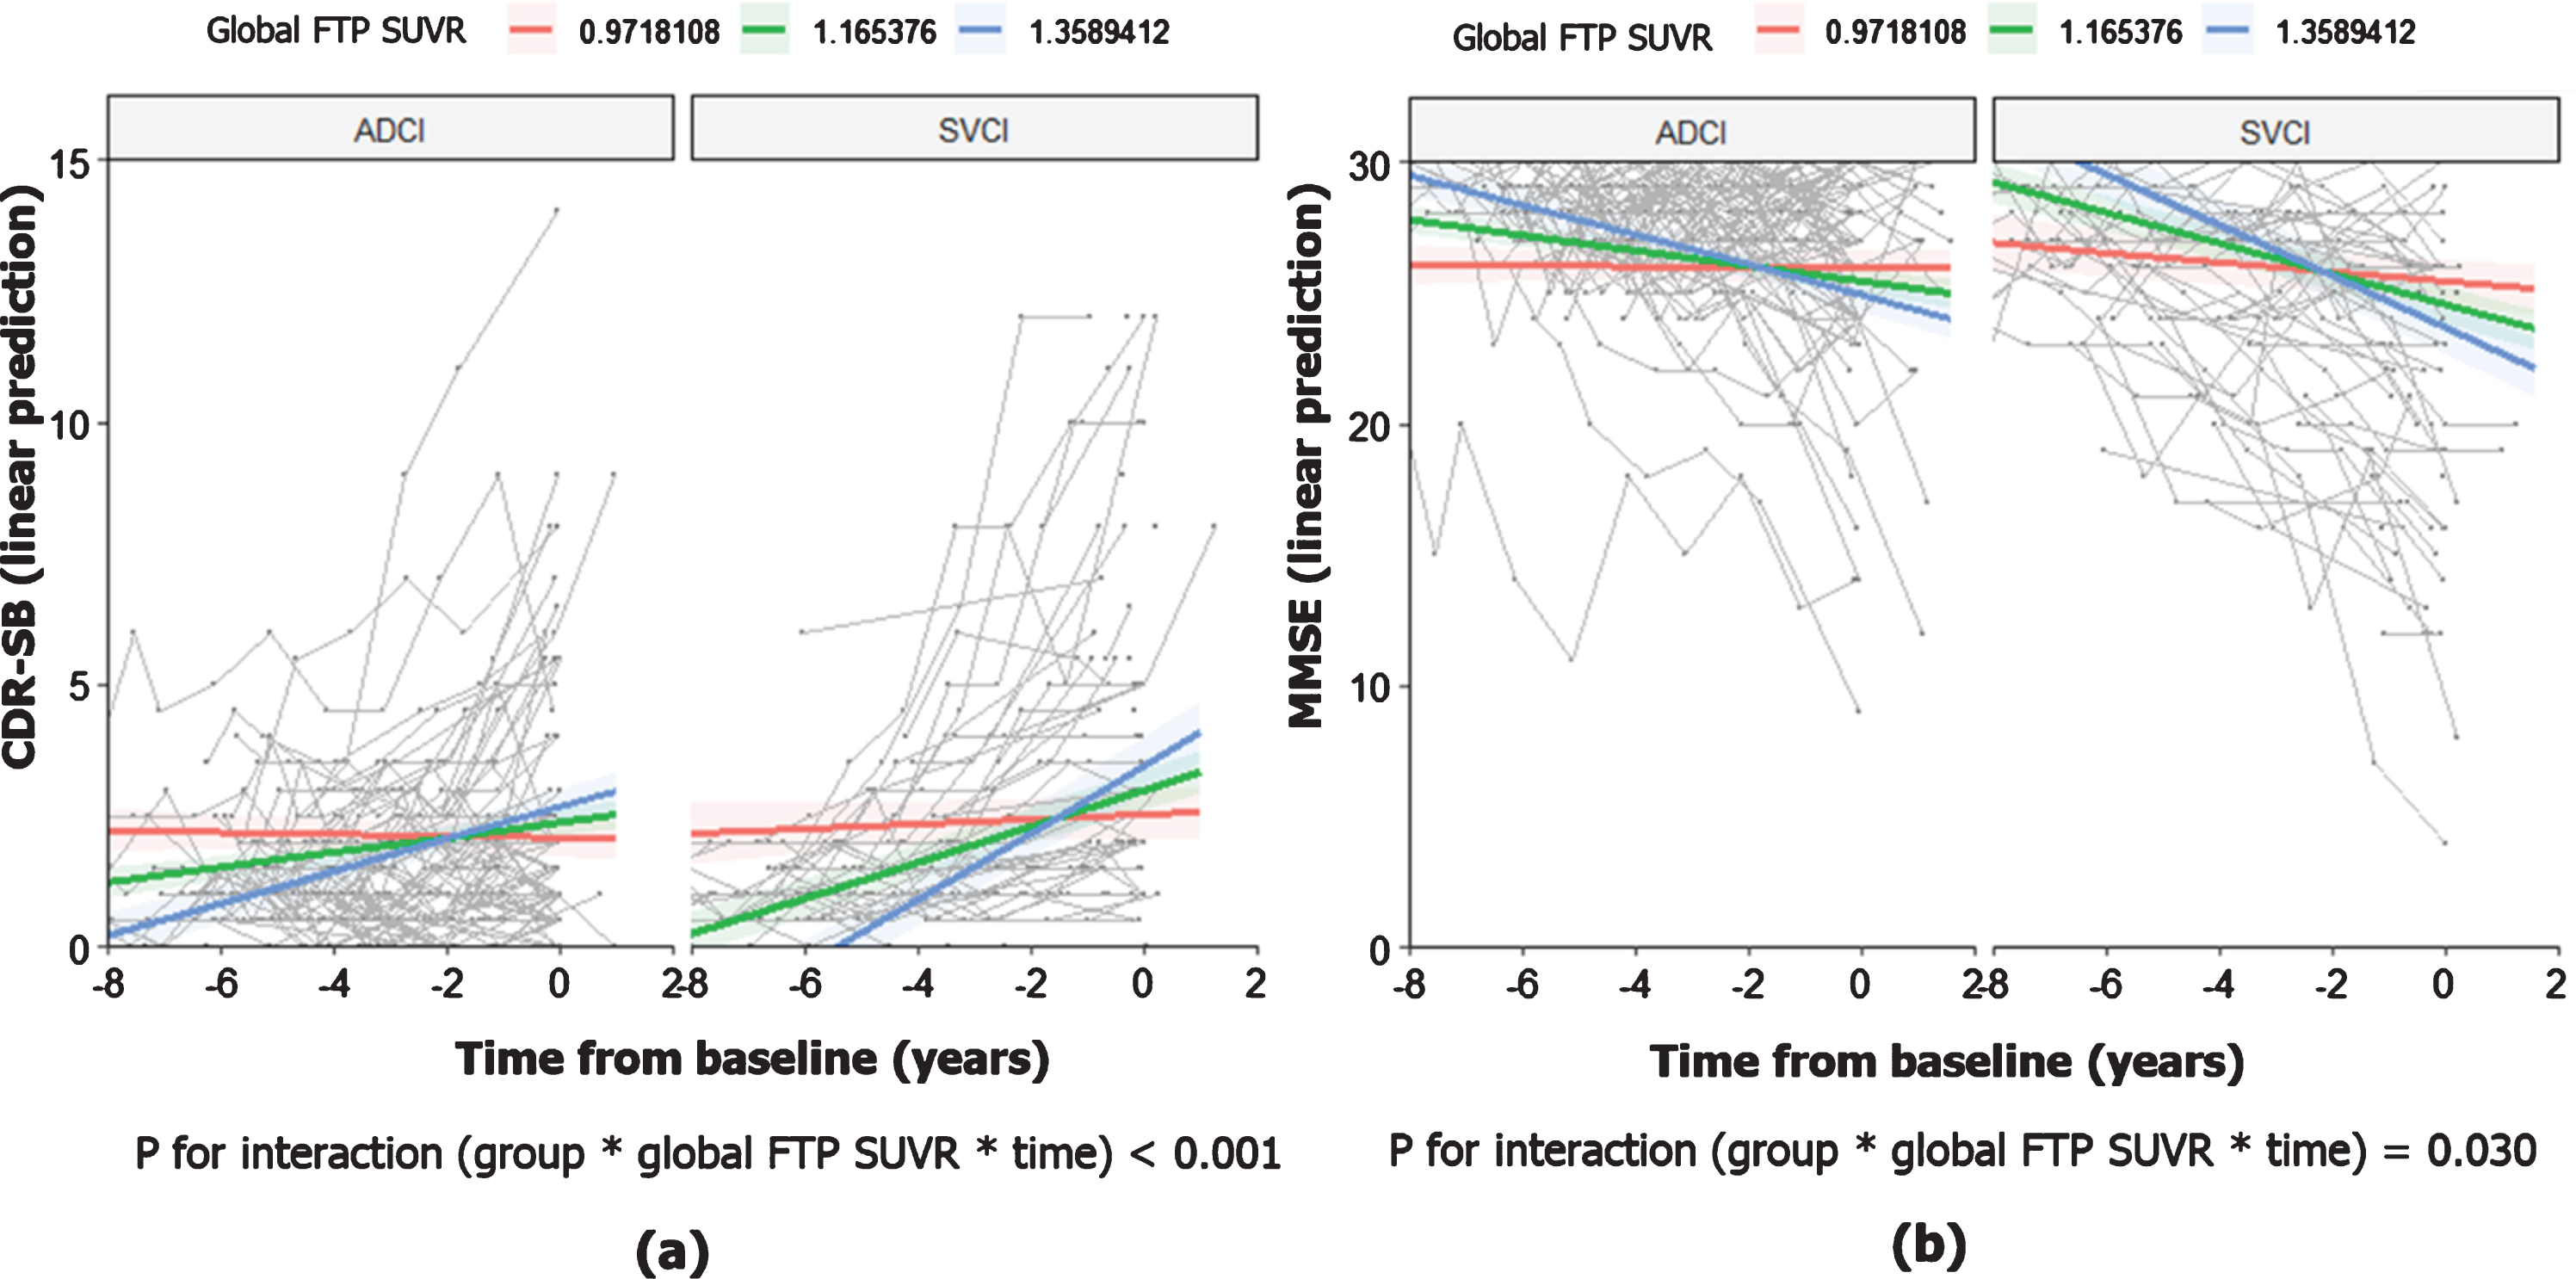
Interaction effects of tau and CSVD group on (a) CDR-SB and (b) MMSE changes. Y axis represents the predicted scores for each follow up year derived from the predicted model equation using a linear mixed effect model. Blue, green and red lines indicate the trend of predicted scores when global FTP SUVR is mean + SD, mean, and mean –SD, respectively. CSVD, cerebral small vessel disease; ADCI, Alzheimer’s disease-related cognitive impairment; SVCI, subcortical vascular cognitive impairment; CDR-SB, Cognitive Dementia Rating-sum of boxes; MMSE, Mini-Mental Status Examination; SD, standard deviation; FTP, flortaucipir; SUVR, standardized uptake value ratio.
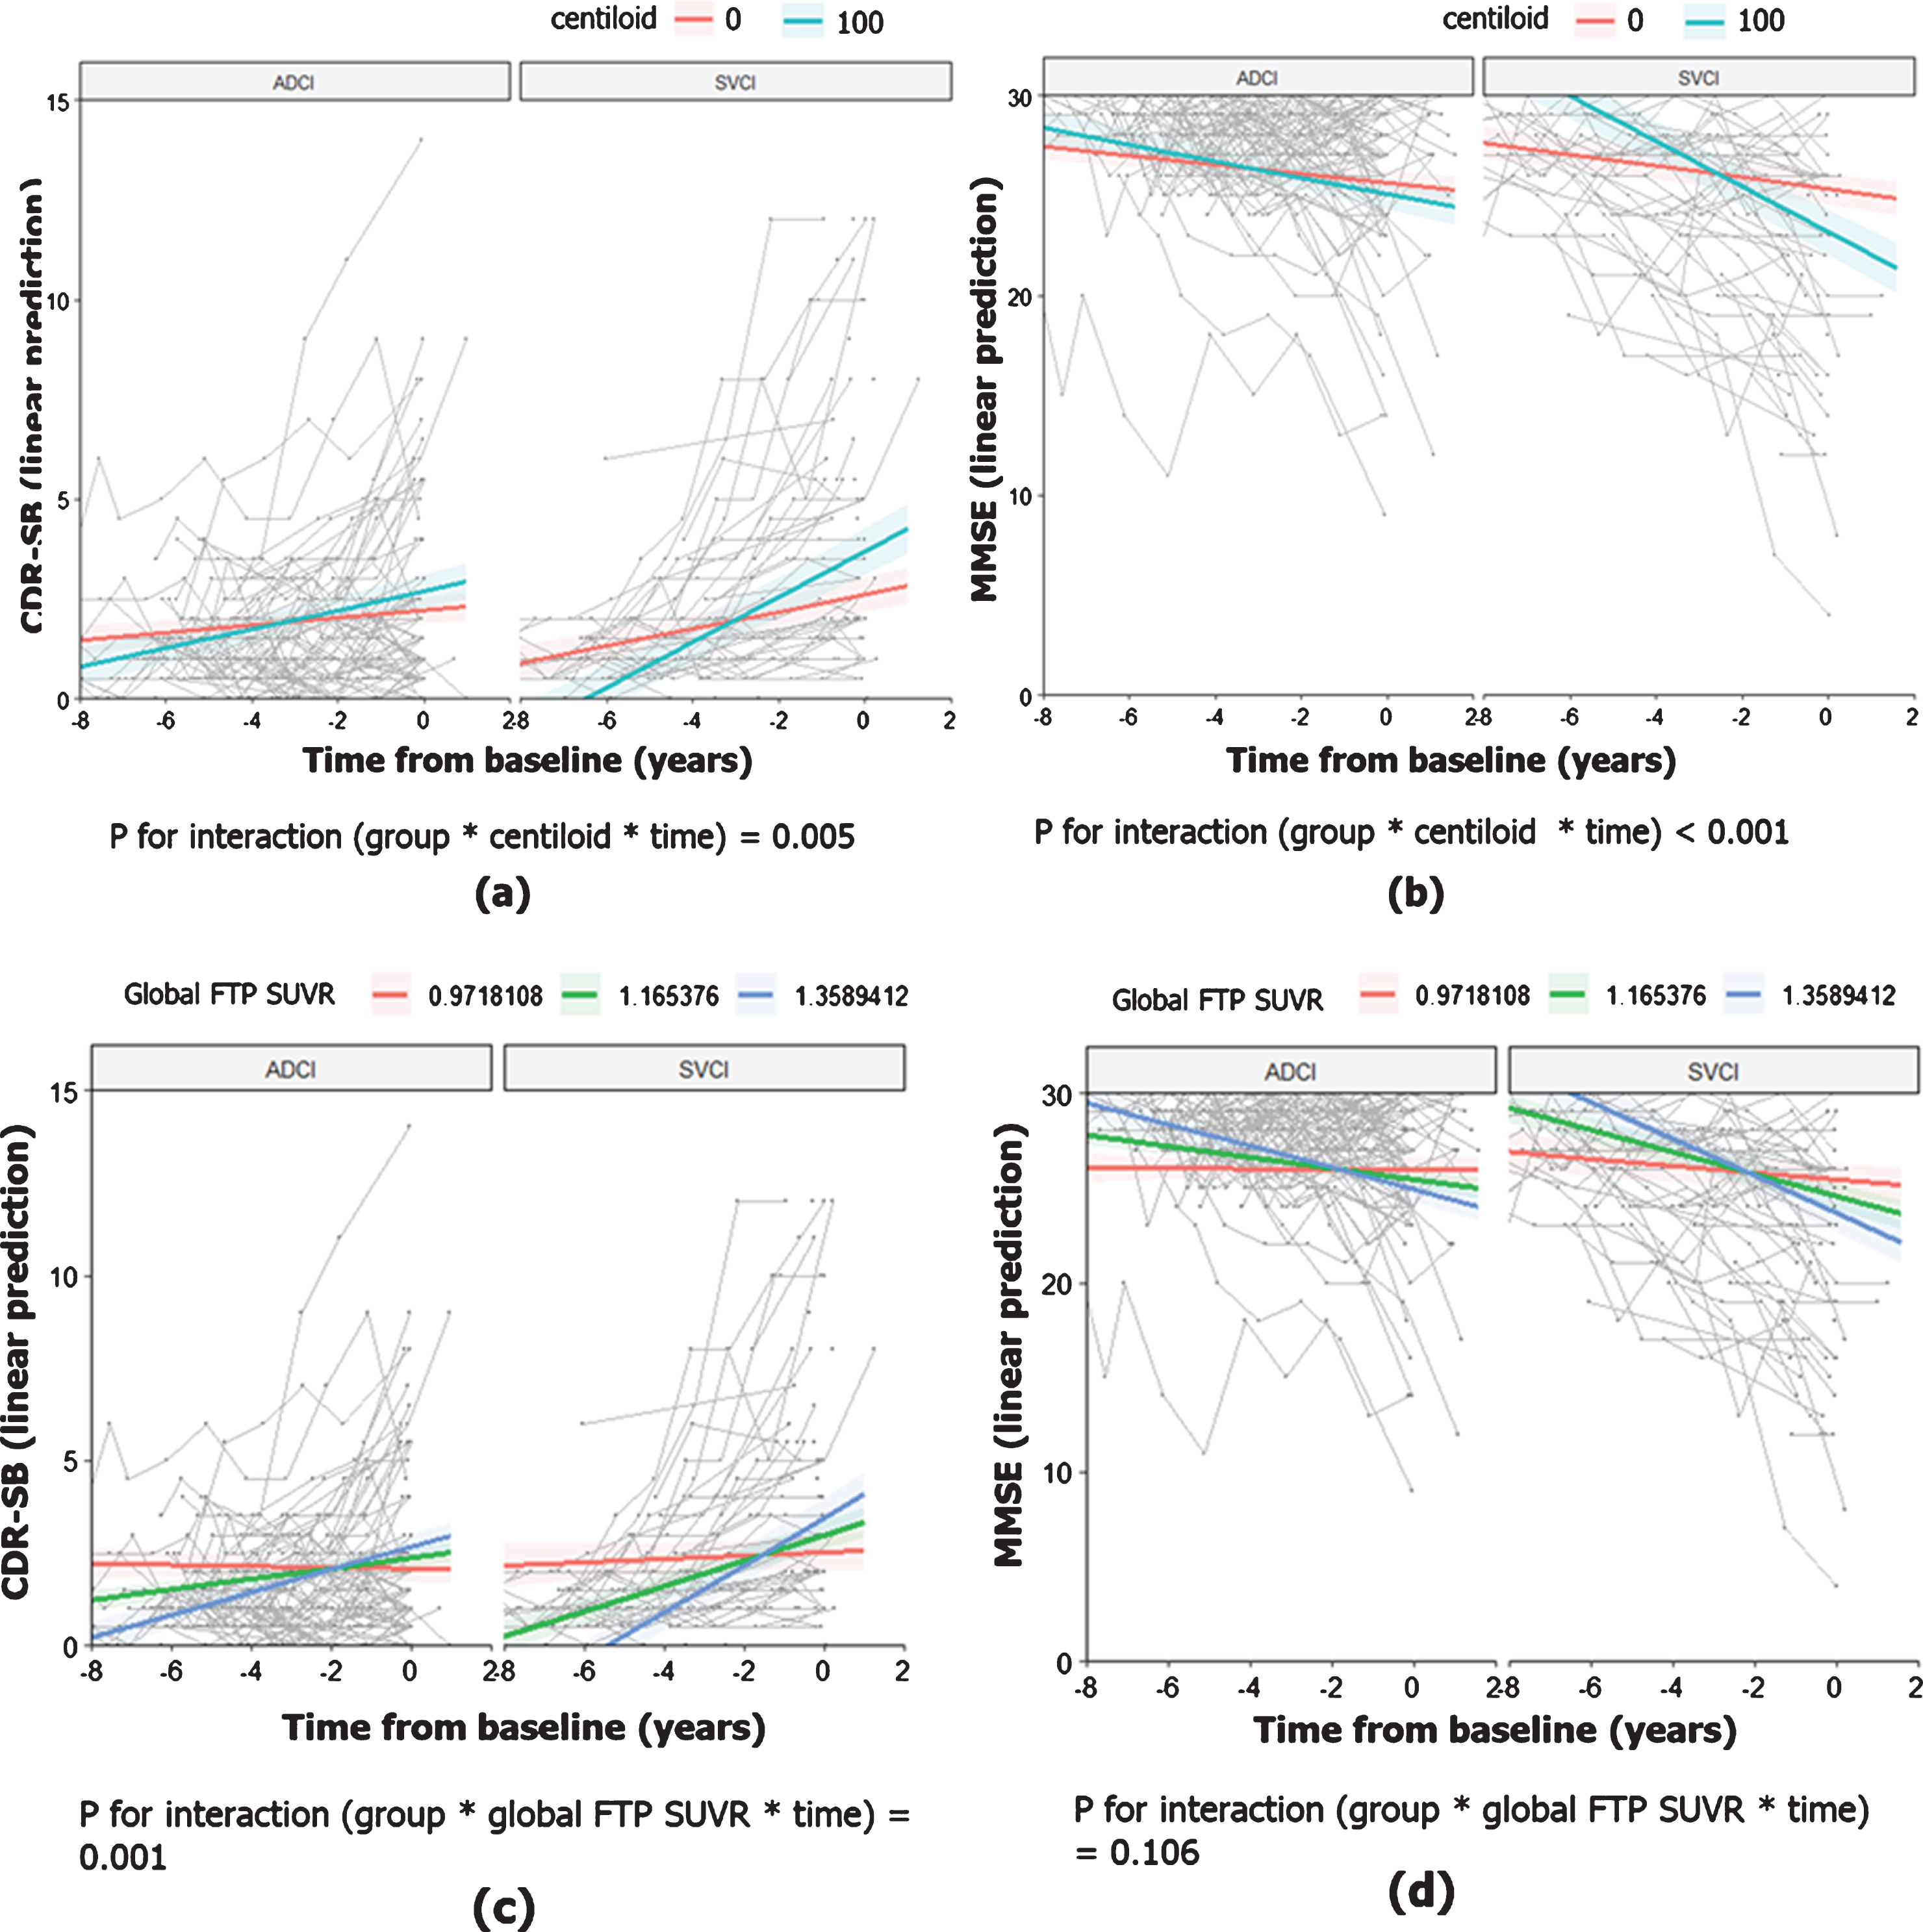
Interaction effects of Aβ (centiloid)/tau and CSVD group on (a) CDR-SB and (b) MMSE changes. Y axis represents the predicted scores for each follow up year derived from the predicted model equation using a linear mixed effect model. Blue, green and red lines indicate the trend of predicted scores when global FTP SUVR is mean + SD, mean, and mean –SD, respectively. CSVD, cerebral small vessel disease; ADCI, Alzheimer’s disease-related cognitive impairment; SVCI, subcortical vascular cognitive impairment; CDR-SB, Cognitive Dementia Rating-sum of boxes; MMSE, Mini-Mental Status Examination; SD, standard deviation; FTP, flortaucipir; SUVR, standardized uptake value ratio.
Interaction effects of tau and CSVD burden on cognitive decline
There was a significant interaction effect between global FTP SUVR and group on CDR-SB (p < 0.001) and MMSE (p = 0.030) changes (Table 2, Fig. 2). That is, higher global tau burden is associated with worse cognitive decline, but its impact is higher in the SVCI than in the ADCI group. When centiloid unit was included as a continuous measure of Aβ burden in the analysis, the interaction effect between global FTP SUVR and group on CDR-SB (p = 0.001) change remained significant, but the interaction effect on MMSE (p = 0.106) change disappeared (Table 3, Fig. 3).
Results of mixed effect models to investigate the interactive effect between regional tau and CSVD burden on cognitive declines
CSVD, cerebral small vessel disease; SVCI, subcortical vascular cognitive impairment; SUVR, standardized uptake value ratio; CDR-SB, cognitive dementia rating-sum of boxes; MMSE, mini-mental status examination; FTP, flortaucipir.
In subgroup analysis performed in the Aβ+ and Aβ–groups, there was a significant interaction effect between global FTP SUVR and group on CDR-SB changes both in the Aβ+ (p = 0.005) and Aβ–(p = 0.005) groups. In terms of MMSE score changes, the interaction effect between global FTP SUVR and group on MMSE changes remained significant in the Aβ+ (p = 0.004) group, but it was not significant in the Aβ–group (p = 0.180). These interaction effects did not change when centiloid was included in the analysis instead of Aβ positivity (Table 3).
The Braak III/IV regional FTP SUVR and group had significant interaction effects on CDR-SB (p < 0.001) and MMSE (p = 0.005) changes. Likewise, the Braak V/VI regional FTP SUVR and group also had significant interaction effect on CDR-SB (p = 0.002) and marginally on MMSE (p = 0.061) changes. However, the interaction effects between Braak I/II regional FTP SUVR and group on CDR-SB (p = 0.229) and MMSE (p = 0.443) changes were not significant. The results from all above analyses remained the same after including the presence of APOE4 genotype as the fixed effect (Supplementary Tables 2 and 3).
Effect of education on cognitive decline
The coefficients for education was –0.025 (p = 0.165) for CDR-SB and 0.111 (p = 0.001) for MMSE). When we additionally included the interaction term of education and time (education×time) in the original analysis, interaction coefficient was 0.014 (p < 0.001) for CDR-SB×time and –0.002 (p = 0.761) for MMSE×time.
DISCUSSION
In this study, we determined whether the relationships of Aβ or tau with cognition differ by significant CSVD burdens using two representative cohorts with different level of CSVD burden: SVCI and ADCI. The major findings of this study were as follows: First, SVCI showed steeper cognitive decline compared to ADCI as Aβ turns positive regardless of tau burden. Second, the relationships between global tau burden and cognition showed worse cognitive decline in SVCI than in ADCI, regardless of Aβ positivity. Specifically, this interaction effect was consistently observed in the Aβ–group as well as in the Aβ+ group. Finally, the interaction effects of regional tau burden and CSVD burden were more prominent in the Braak III/IV and V/VI than in Braak I/II region. Taken together, Aβ positivity or tau burden, particularly in the Braak III/IV or V/VI regions, and CSVD burden were synergistically associated with cognitive decline. The insight on this interaction supports the importance of intervention targeting both AD and vascular pathologies to attenuate disease progression in cognitively impaired population with mixed pathologies.
We found that the SVCI group had worse baseline cognition (higher CDR-SB and lower MMSE) compared the ADCI group, although they had similar Aβ positivity and tau burden. It leaves the potential that CSVD burden additively or synergistically with AD pathologies might contribute to cognitive impairment in SVCI patients. Our first major finding was that the impact of Aβ on cognitive decline was greater in the SVCI group than in the ADCI group, suggesting that Aβ positivity and CSVD were synergistically associated with cognitive decline regardless of tau burden. Previous studies regarding the interaction between Aβ and CSVD have shown inconsistent results [34–36]. That is, Aβ and CSVD are independently associated cognitive decline or CSVD did not affect cognitive impairments. The discrepancy might be explained by the differences in study participants (cognitively impaired patients with severe degree of ischemia in our sample compared to cognitively normal individuals with mild degree of ischemia in the previous study). In fact, our current finding is consistent with that from our previous study [12], which showed a synergistic effect of Aβ burden and severe degree of WMH volume on visuospatial dysfunction in SVCI patients. Therefore, it might be reasonable to expect that CSVD, if severe, may have a significant role as a driver of cognitive decline, interacting with Aβ although the impact of Aβ pathology overwhelms that of mild to moderate degree of CSVD on cognitive impairment when both pathologies coexist [37].
The second major finding was that the impact of tau on cognitive decline was greater in the SVCI group than in the ADCI group, regardless of Aβ positivity. Furthermore, this interaction effect remained significant both in the Aβ–and Aβ+ population. Tau is more directly related with cortical atrophy and cognitive impairments compared to Aβ. Our previous studies suggested that CSVD could cause increased tau burdens [38], cortical atrophy [16, 17], and cognitive decline [39–42]. Therefore, it is possible that tau contributes to cortical thinning, which are associated with subsequent cognitive impairment and CSVD burden accelerates these processes by increasing vulnerability of neuronal injury by tau accumulation possibly under condition with hypoxia and disrupted network. Alternatively, tau and CSVD might have contributed to decline in different cognitive domains, which may be associated with decline in general cognitive functioning. In fact, cognitive performance at the retrospective time points were not different between SVCI and ADCI groups. Therefore, the disease severity in the past cannot explain a steeper cognitive decline in the SVCI group. Instead, this finding supports the significant interactive effect between amyloid/tau and CSVD on cognitive decline.
Interestingly, unlike CDR-SB changes, the interaction effect of tau and CSVD on MMSE changes was significant in the Aβ+group, but not in the Aβ–group. It might be explained by the fact that CDR-SB could be more likely to capture impairment in activity of daily living and MMSE could not sensitively measure frontal dysfunction. In fact, CSVD is known to affect functional activities and contribute primarily to frontal dysfunction. Therefore, in Aβ–patients, there is a possibility that tau and CSVD were independently (not interactively) associated with cognitive decline in separate cognitive domains while they together contribute to general cognitive worsening and disease progression (represented by CDR-SB).
The third major finding in our study was that Braak III/IV or V/VI regional tau and CSVD burden had synergistic effects on cognitive decline, while this interaction effect was not found between Braak I/II regional tau and CSVD. We consider that CSVD burden accelerates cortical thinning by tau pathology when it presents in Braak III/IV or V/VI stage regions. This is supported by our previous studies showing that CSVD were associated with cortical thinning in frontal or superior temporal neocortex which are included in Braak III/IV or V/VI stage regions [43, 44], while Braak I/II stage regions such as hippocampus are much less affected by CSVD [43–45]. Alternatively, the Braak III/IV or V/VI regional tau are major determinants of neocortical atrophy and cognitive impairment, while Braak I/II regional tau could be observed in the cognitively normal elderly. Therefore, as increase in Braak I/II regional tau might not largely affect cognitive decline regardless of coexisting CSVD burden, it is expected that the significant interaction effect was found between CSVD and Braak III/IV or V/VI regional tau only.
We additionally looked at how education affects cognitive performance and cognitive worsening over time. We found that higher education is associated with higher cognitive performance, but paradoxically, more educated participants seem to be more vulnerable to cognitive worsening. This finding might be supported by previous study demonstrating that greater cognitive reserve related to slower progression in predementia stages of AD, but faster decline after the onset of dementia [46, 47]. Given that SVCI group in our study had lower education years than ADCI group, we considered that faster decline in cognition in SVCI than in ADCI might not be attributed to lower cognitive reserve. Moreover, this paradoxical effect of education might have underestimated our study finding that SVCI had steeper cognitive decline than ADCI. The strength of our study lies in its well-characterized ADCI and SVCI cohorts which had both Aβ and tau PET according to the standardized protocols. However, there are several limitations in this study. First, we did not consider other pathologies contributing to cognitive impairment. Nevertheless, the only autopsied case in our SVCI cohort showed none of TDP, hippocampal sclerosis, argyrophilic grain disease, or Lewy body pathology, that are the rest of major causes for dementia. Likewise, we did not consider other MRI CSVD markers. However, we instead used two well-characterized cohorts with obviously distinct WMH burden. This may allow CSVD burden such as microinfarcts that are unmeasurable on conventional MRI [48] to be potentially considered, given that microinfarcts are closely associated with WMH volume [49–51]. Second, we evaluated cognitive decline using retrospective neuropsychological data that were conducted before Aβ and tau PET were performed. Therefore, future prospective study with participants from the same cohort is required to confirm this result. Third, we used tau PET instead of pathologic confirmation, which could cause off-target binding issue: Off-target FTP binding to the choroid plexus might explain why the interaction effect between FTP uptake and CSVD was found only for higher Braak stages. Lastly, we could not generalize our study findings as SVCI patients in this study had very severe ischemia on MRI. Nevertheless, we consider that our study is worth to report in the developing era of therapeutic trials targeting disease specific molecules, because this demonstrated the interaction between Aβ or tau (separately) with CSVD burden.
In conclusion, the effects of Aβ positivity or tau burden on cognitive decline were prominent in the presence of significant CSVD burden, suggesting that AD pathologies and CSVD synergistically affect cognitive decline. Our findings are important as it could help predict distinct clinical trajectories of patients when they have combinations of different levels of AD pathology and vascular burden. Particularly, based on this knowledge, the effort to prevent and reduce each pathologic burden may differently slow disease progression.
Footnotes
ACKNOWLEDGMENTS
This study was supported by Research of Korea Centers for Disease Control and Prevention (2018-ER6203-02), the Brain Research Program through the National Research Foundation of Korea (NRF) funded by the Ministry of Science, ICT & Future Planning (2016M3C7A1913844), a grant of the Korean Health Technology R&D Project through the Korea Health Industry Development Institute (KHIDI) funded by the Ministry of Health & Welfare, Republic of Korea (HI19C1132), the National Research Council of Science & Technology (NST) grant by the Korea government (MSIP) (No. CRC-15-04-KIST) and the National Research Foundation of Korea (NRF) grant funded by the Korea government (MSIT) (NRF-2020R1A2C1009778). This work was also supported (researched) by the Fourth Stage of Brain Korea 21 Project in Division of Intelligent Precision Healthcare.