
Abstract
Background:
Studies of elderly subjects using biomarkers that are proxies for Alzheimer’s disease (AD) pathology have the potential to document meaningful relationships between cognitive performance and biomarker changes along the AD continuum.
Objective:
To document cognitive performance differences across distinct AD stages using a categorization based on the presence of PET-assessed amyloid-β (Aβ) burden and neurodegeneration.
Methods:
Patients with mild dementia compatible with AD (n = 38) or amnestic mild cognitive impairment (aMCI; n = 43) and a cognitively unimpaired group (n = 27) underwent PET with Pittsburgh compound-B (PiB) assessing Aβ aggregation (A+) and [18F]FDG-PET assessing neurodegeneration ((N)+). Cognitive performance was assessed with verbal and visual episodic memory tests and the Mini-Mental State Examination.
Results:
The A+(N)+ subgroup (n = 32) showed decreased (p < 0.001) cognitive test scores compared to both A+(N)–(n = 18) and A–(N)–(n = 49) subjects, who presented highly similar mean cognitive scores. Despite its modest size (n = 9), the A–(N)+ subgroup showed lower (p < 0.043) verbal memory scores relative to A–(N)–subjects, and trend lower (p = 0.096) scores relative to A+(N)–subjects. Continuous Aβ measures (standard uptake value ratios of PiB uptake) were correlated most significantly with visual memory scores both in the overall sample and when analyses were restricted to dementia or (N)+ subjects, but not in non-dementia or (N)–groups.
Conclusion:
These results demonstrate that significant Aβ-cognition relationships are highly salient at disease stages involving neurodegeneration. The fact that findings relating Aβ burden to memory performance were detected only at (N)+ stages, together with the similarity of test scores between A+(N)–and A–(N)–subjects, reinforce the view that Aβ-cognition relationships during early AD stages may remain undetectable unless substantially large samples are evaluated.
Keywords
INTRODUCTION
The neuropathological changes that characterize Alzheimer’s disease (AD) include extracellular amyloid-β (Aβ) aggregation (neuritic plaques), pathologic accumulation of phosphorylated tau (p-tau, which forms neurofibrillary tangles), and neurodegeneration/neuronal injury [1]. Cerebral Aβ deposition occurs early over the course of AD, starting many years before the development of dementia [2]. Studies using either positron emission tomography (PET) or cerebrospinal fluid (CSF) analyses show evidence of cortical Aβ deposition in a significant proportion of patients with mild cognitive impairment (MCI) as well as in a non-negligible minority of cognitively intact elderly subjects [3, 4]. The 2018 National Institute on Aging and Alzheimer’s Association (NIA-AA) research framework has reinforced the concept of AD as a biologically-defined construct rather than a clinical syndrome, and proposes a disease staging system whereby the detection of Aβ deposition (A+) in living persons is sufficient to define the presence of AD pathologic change, placing an individual in the “Alzheimer’s continuum”. The additional evidence of tau pathology (T+) establishes the diagnosis of “Alzheimer’s disease” (A + T+), while the detection of neurodegenerative changes ((N)+) typifies AD with signs of neurodegeneration (A + T+(N)+). Conversely, a profile of neurodegeneration ((N)+) in the absence of Aβ positivity (A–) suggests the presence of neuropathological processes other than AD, characterizing non-AD pathologic change [5].
Contemporary biomarker-based classification systems propose that cognitive symptoms (C+) may be used to stage the severity of AD [5]. While Aβ positivity is seen as a relevant predictor of future risk of decline in cognitively intact individuals [6], the emergence of cognitive deficits is more directly related to the detection of tau pathology along the AD continuum [7]. Nevertheless, studies evaluating the relationship between cognitive performance and Aβ burden are also clinically relevant, and it has been reported that the overall degree of cognitive impairment and the severity of memory deficits in particular are significantly related to the presence of Aβ deposition in patients with dementia, both in clinic-pathologic studies with autopsy confirmation and in amyloid PET investigations [8–10]. Additional PET and CSF studies have indicated that Aβ-cognition relationships may also hold true in individuals without dementia [11–18], although such significant associations have not been confirmed in a number of other investigations in non-dementia samples [19–22]. Several investigations in this field have restricted their comparisons to groups separated using one single cut-point to define Aβ positivity [15, 19], while other studies included continuous measures to evaluate dose response-patterns in the relationship between Aβ deposition and the severity of cognitive deficits [9–11, 22]. Therefore, PET and CSF-based studies evaluating the relationship between Aβ aggregation and cognitive test scores using biologically-based AD staging systems are relevant to document possible differences in the profile of Aβ-cognition associations between early stages of AD pathological change and later disease stages with neurodegeneration.
In the present study, a sample of elderly subjects with mild dementia clinically compatible with AD, amnestic MCI (aMCI), or unimpaired cognition (n = 115) underwent PET imaging with the Pittsburgh compound B (PIB) tracer for Aβ mapping labeled with carbon-11 ([11C]PIB-PET) [23]) and [18F]fluorodeoxyglucose ([18F]FDG-PET) to measure brain glucose metabolism (a highly sensitive biomarker of neurodegeneration) [24, 25]. We evaluated the relationship between PET-based biomarker changes and three indices of cognitive performance, namely verbal and visual episodic memory, and global cognition. By classifying the sample according to the presence of Aβ positivity (A+) and neurodegeneration ((N)+) based on [11C]PIB-PET and [18F]FDG-PET results, we wished to investigate whether Aβ positivity with signs of degeneration (A+(N)+) would be associated with greater episodic memory deficits in comparison not only to the A+(N)–and A–(N)–stages, but also to the A–(N)+ profile that characterizes SNAP. Using a continuous measure of [11C]PIB uptake (standardized uptake value ratio; SUVr), we also predicted that there would be significant direct relationships between the severity of Aβ deposition and decrements in memory scores. We wished to ascertain if such correlations between severity of Aβ deposition and memory deficits would be significant only when analyses were restricted to cognitively impaired patients or subjects classified as (N)+, or whether significance would also be attained in correlation analyses carried out for (N)–subjects.
MATERIAL AND METHODS
Study sample
A total of 38 patients with mild dementia clinically compatible with AD, 43 aMCI subjects, and 34 cognitively unimpaired (CU) volunteers were enrolled in the study. The ethical committee of the Hospital das Clínicas, Faculdade de Medicina, Universidade de São Paulo (HC-FMUSP) approved the investigation (CAPPesq 368.037), and informed consent was obtained from all participants or their caregivers in the dementia group.
Patients in the mild dementia group fulfilled the 2011 criteria of the National Institute on Aging-Alzheimer’s Association (NIA-AA) [26], and the diagnostic criteria for dementia of the Alzheimer’s type according to the DSM-IV [27]. The presence of consistent cognitive deficits compatible with the diagnosis of probable AD according to the NIA-AA criteria was documented by extensive neuropsychological assessments including tests evaluating auditory and visual verbal episodic memory, visuoconstructive function, semantic memory, attention, processing speed, language, and executive functioning. The overall severity of cognitive decline was assessed using the Mini-Mental State Examination (MMSE) [28]. Patients in the mild dementia group were also evaluated with the Blessed Dementia scale [29] and the Informant Questionnaire on Cognitive Decline in the Elderly (IQ-CODE) [30] in order to assess cognitive decline, and the Hachinski Ischemic Score (HIS) to assess the possible contribution of cerebrovascular pathology to the development of dementia [31].
Patients with aMCI also underwent neuropsychological evaluations, and their diagnosis was based on the revised Petersen criteria [32, 33]. Patients should present the following features: a) a perception of cognitive decline in relation to a previous level (according to the participant and an informant); b) deficits in one or more cognitive domains below the expected norms for age and education, with at least one of the domains being related to memory (amnestic impairment as a single or multiple domain aMCI); c) independence for daily activities; d) absence of dementia; e) absence of significant vascular disease, trauma or general medical conditions as the attributable cause of the cognitive deficit. Memory impairment in the aMCI group was considered present if subjects had scores at least 1.5 standard deviation (SD) below the age and education stratified norms on one memory test, or 1.0 SD below norms on more than one memory test. Besides memory impairment, participants might have deficits in other cognitive domains.
Based on neurological examination and structured interviewing using the translated version of the Structured Clinical Interview for DSM-IV (SCID-IV) [34], no patients in the AD or aMCI groups had history of neurologic diseases (such as Parkinson’s disease, epilepsy, inflammatory diseases or stroke, with the exception of migraine) or major psychiatric disorders with the exception of previous history of depressive, anxiety or alcohol-abuse disorders. As detailed elsewhere [35], eighteen cognitively impaired subjects (8 in the dementia group and 10 in the aMCI group) presented history of mood and/or anxiety disorders (currently in remission), and fifteen of those were under psychopharmacological treatment when recruited for the study.
Subjects for the CU group were recruited via online and printed announcements in activity centers and groups for elderly individuals in the community, invitation of acquaintances of the relatives of dementia and aMCI subjects, and invitation of elderly subjects who were screened in the community during other research studies recently carried out by our institution. They also underwent neurological examination, structured interviewing using the SCID-IV and extensive neuropsychological assessments as described above. They all had a normal cognitive performance for their age range and no past or current history of the above major psychiatric disorders or neurological conditions. As detailed elsewhere [35], six control subjects presented history of mood and/or anxiety disorders (currently asymptomatic), two of which under current psychopharmacological treatment.
Additional exclusion criteria for both the cognitively impaired and control samples were: presence of severe medical conditions and any systemic disorders associated with cognitive impairment; family history of dementia with a dominant pattern of inheritance; uncorrected auditory or visual impairments that could interfere with the cognitive evaluation; and presence of gross vascular pathological findings or other lesions incidentally detected by brain structural magnetic resonance imaging (MRI) scanning.
No subjects in the three groups were under chronic use of any other drugs with action in the central nervous system. A total of 8 subjects (two in the dementia, two in the aMCI, and three in the control groups) had been exposed to benzodiazepines recently but not continuously. Other medication used regularly for stabilized general medical conditions across the three groups included: a) anti-hypertensive medications of the following classes: diuretics, angiotensin-converting enzyme (ACE) inhibitors, calcium channel blockers, beta blockers, vasodilators; b) oral hypoglycemic medications; c) statins; d) acetylsalicylic acid; e) calcium carbonate; f) and hormone replacement therapies with estrogen or levothyroxine.
The core set of neuropsychological tests that were applied to all subjects in the three groups within a mean of 6 weeks prior to PET imaging are provided in Supplementary Table 1. Episodic memory indices used for the investigation of associations with biomarker status in the present investigation included: the delayed recall score on the Rey Auditory-Verbal Learning Test (RAVLT) as a measure of verbal auditory episodic memory [36, 37], thereafter referred to as verbal memory; and the memory sub-score on the Short Cognitive Performance Test (Syndrom Kurztest, SKT) as a measure of verbal visual memory [38, 39], thereafter referred to as visual memory. The RAVLT requires the individual to encode and immediately recall a 15-item word list five times. Next, he/she is asked to encode and recall a new list (interference) and then to recall the original list. After 30 min, in the delayed recall, the individual needs to remember as many words as possible from the original word list. The test is based on listening and orally repeating words and there are no visual stimuli. In the present analyses, the variable of interest was the number of items recalled in the delayed recall. The SKT has an attention sub-domain (0–18 points) and a memory sub-domain (0–9 points) [38]. In the present study, the memory domain was included in the analyses. This domain is composed of three tasks, each one scoring 0–3 points: immediate recall of 12 colorful pictures of common objects after the individual names them (he/she is reminded of the not-recalled ones). After approximately 5 min, the individual needs to recall the pictures, and, finally, in the recognition task, he/she needs to identify the original 12 pictures among other 12 new pictures. The variable of interest in the study was the total score for the SKT memory sub-domain. Higher SKT scores represent worse memory performance.
PET data acquisition
Both [11C]PIB and [18F]FDG were produced at the Centro de Medicina Nuclear of HC-FMUSP using an on-site cyclotron (PETtrace-880, GE-Healthcare) and PET/CT images were acquired using a Discovery-710 PET/CT-scanner (GE-Healthcare, Milwaukee, USA). Before data acquisition, a CT scan from the skull was acquired and used for attenuation correction, at: 120 kVp and 70 mA (140 mA and 0.5 s per rotation) for the [11C]PIB-PET data acquisitions; and 120 kV, range 70–100 mA for [18F]FDG-PET data acquisitions.
Details of the [11C]PIB radiochemical production were described elsewhere [23]. For the acquisition of [11C]PIB -PET data, subjects were positioned with the brain in the center of the field of view of the PET equipment and [11C]PIB was injected intravenously (296–740 MBq). The acquisition started immediately after the beginning of tracer injection. Images were acquired for 70 min using a 256×256 mm matrix. Images from 40 to 70 min after injection were condensed in time creating a static [11C]PIB-PET showing extracellular Aβ deposits. Images were corrected for radioactivity decay, dead time, attenuation and scatter and reconstructed using the OSEM algorithm, 4 iterations and 16 subsets. For the acquisition of [18F]FDG-PET data, participants fasted for at least 6 h before imaging. Blood glucose levels were measured and recorded immediately before [18F]FDG injection to ensure levels below 200 mg/dL. Subjects remained at rest with eyes open for at least 30 min after intravenous [18F]FDG injection (177 to 344 MBq). Data were acquired in static mode, for 15 min, with time-of-flight information and a 256×256 mm matrix, and were reconstructed using OSEM with four iterations and sixteen subsets and a 3 mm Gaussian filter with TOF and point spread functions modelling (VUE Point FX with Sharp IR - GE Healthcare). Data were corrected for scattering, attenuation, dead time, and radioactive decay.
Protocol for defining Aβ positivity and measures of standardized uptake value ratio (SUVr)
The protocol used for the classification of individuals as A+ or A–was detailed previously [35]. In summary, two certified nuclear medicine physicians with more than five years of experience in the field, evaluated each [11C]PIB-PET dataset independently and blinded to diagnoses. Images were rated as “positive” if there was an increase in [11C]PIB uptake in cortical gray matter areas causing a loss of GM to white matter contrast in at least two of the six following areas: frontal, temporal, lateral parietal, precuneus, anterior cingulate and posterior cingulate cortices, and precuneus. They also rated the images as positive if only one single large cortical area had a strong diffuse [11C]PIB uptake. A scan was rated as “negative” when there was strong white matter uptake and no significant gray matter uptake [40]. As a second step, each physician performed an analysis with the aid of the 3D-SSP semi-quantitative method designed for the clinical analysis of brain PET amyloid imaging (Cortex ID Suite software, GE healthcare), with the standard uptake values ratio (SUVr) of the cortical areas normalized to the cerebellar gray matter. A SUVr cutoff of 1.42 was used for A+ scoring for the composite of cortical areas [41], complementing the visual analysis. In cases of persisting discordance between the readers after the 3D-SSP analyses, consensus readings with both physicians were performed.
Additionally, in order to generate one single continuous variable of cortical Aβ load, the SUVr of [11C]PIB uptake was extracted for 34 regions of interest placed on the prefrontal, orbitofrontal, parietal, temporal, parahippocampal, anterior cingulate, and posterior cingulate cortices and precuneus, normalized to whole cerebellar tracer uptake [41]. For the generation of SUVr for each region, [11C]PIB-PET images were co-registered to a T1 weighted MRI of the same subject using the PNEURO tool of the PMOD 3.4 software (PMOD™ Technologies Ltd, Switzerland), and brain parcellation was carried out based on the HAMMERS atlas for generating different volumes of interest (VOI). Images were corrected for partial volume effect using the “VOI based” correction method. A meta-region of interest including all regions was used to generate a composite [11C]PIB SUVr for each individual [42].
Visual classification of [18F]FDG PET data
The protocol used for the classification of individuals as N+ or N–was described previously [35]. In brief, evaluations of individual [18F]FDG-PET datasets were carried out by the same two certified nuclear medicine physicians cited above, who were blinded to clinical diagnoses. The two physicians scored each exam as “positive” or “negative” (first separately and then in consensus) based on visual interpretation assisted by the 3D-SSP semi-quantitative software (Cortex ID Suite, GE healthcare) [25]. They used three different methods of tracer uptake normalization (global uptake, pons or cerebellum as reference), based on the fact that normalization using different regions as reference may complement each another in terms of sensitivity and specificity [43–45]. Abnormal [18F]FDG-PET datasets were rated as typical of AD when there were unilateral or bilateral findings of decreased regional brain glucose metabolism affecting mainly the posterior temporo-parietal, posterior and inferior temporal cortices, the precuneus and the posterior cingulate cortex [25, 47].
Classification of subjects in four categories based on the presence of Aβ aggregation and neurodegeneration
Based on the above described individual classification of [11C]PIB-PET and [18F]FDG-PET datasets as “positive” or “negative”, we classified each individual in one of the four following categories [35]: A+(N)+ (Alzheimer’s pathology with neurodegeneration); A+(N)–(Alzheimer’s pathology without neurodegeneration); A–(N)–(non-pathological findings); and A–(N)+(SNAP). We were not able to apply the complete AT*(N) classification based on the 2018 NIA-AA RF since neither PET imaging nor CSF analyses evaluating tau pathology were performed in the present study [5].
Data management and statistical analysis
Demographic data, clinical details, and main neuropsychological characteristics for the three groups were managed using the REDCap (Research Electronic Data Capture) method [48, 49]. Statistical tests were run using the Statistical Package for Social Sciences (SPSS) version 17.0 (IBM Corp.).
Group comparisons of demographic data, clinical details, and A(N) frequencies were conducted using one-way ANOVA for continuous variables and chi-square tests for categorial variables.
Using the univariate generalized linear model option in SPSS, we then carried out comparisons between the four A(N) categories entered as fixed factors, with cognitive test scores (RAVLT delayed recall score, SKT memory sub-score, and MMSE score) as dependent variables and age, sex and years of education as covariates. Significant findings in such analyses were followed-up with post-hoc Schefffé’s tests (unequal sample sizes) for two-group comparisons.
Subsequently, we ran partial correlation analyses (again controlled for age, sex, and education) between cognitive test scores and continuous SUVr measurements. Such analyses were first carried out for the overall sample, then separately for the (N)+ and (N)–subsamples, and finally for the A(N) biomarker-based categories.
Finally, both the group comparisons and partial correlation analyses above were repeated with the overall sample divided according to clinically defined diagnoses rather than A(N) categories, including: the overall cognitively impaired sample (dementia plus aMCI subjects); and the separate dementia, aMCI and CU groups.
In all analyses above, a one-tailed p < 0.05 level of statistical significance was applied.
RESULTS
Demographic and clinical data, cognitive test scores, and biomarker profile for the sample
Demographic and clinical details for the overall sample (n = 115), and then separately for the clinically defined subgroups are provided in Table 1. There were no significant between-group differences in regard to age, sex, number of years of education, or socio-economic status (Table 1).
Demographic, clinical characteristics, cognitive scores, and biomarker category frequencies in the sample
aMCI, amnestic mild cognitive impairment; CU, cognitively unimpaired; SD, standard-deviation; SES, socio-economic status; MMSE, Mini-Mental State Examination; RAVLT, Rey Auditory-Verbal Learning Test; SKT, Short Cognitive Performance Test; HIS, Hachinski ischemic score; IQ-CODE, Informant Questionnaire on Cognitive Decline in the Elderly; SUVr, standard uptake value ratio of [11C]PiB uptake using whole cerebellum as reference; A, Aβ status; N, neurodegeneration as assessed based on [18F]FDG PET patterns; aComparisons between dementia, aMCI and CU groups conducted using one-way ANOVA with Scheffé’s post-hoc tests for continuous variables, and chi-square tests for categorial variables; *Difference between dementia and CU groups; **Difference between dementia and aMCI groups; ***Difference between aMCI and CU groups; ****Difference between dementia, aMCI and CU groups;
In regard to cognitive test results, the greatest discrimination between the two cognitively impaired groups and CU subjects was obtained when verbal memory scores (RAVLT) were assessed, with significantly lower scores both in the dementia and aMCI groups relative to CU subjects (Table 1). Worse performance indices on the visual memory (SKT) and the MMSE were detected in the dementia group relative to both aMCI and CU subjects (Table 1).
Regarding [11C]PIB uptake, the dementia sample displayed higher levels of Aβ deposition relative to aMCI and CU subjects either when mean SUVr scores or the frequency of subjects classified as A+ were analyzed (Table 1).
There were highly significant differences between the clinically defined groups in regard to the A(N) categorization, with the proportion of A+(N)+ subjects being higher in the dementia group (65.8% of all dementia cases) in comparison to the proportion of individuals rated as A+(N)+ in the aMCI (16.3%) and CU (0%) groups. Conversely, the proportion of A+(N)–and A–(N)–subjects was higher in the aMCI and CU groups in comparison to dementia subjects (Table 1).
Demographic details for the four subgroups classified according to presence of Aβ aggregation and neurodegeneration are shown in Table 2. Mean age was higher in A+(N)+ subjects relative to A–(N)–subjects (p < 0.05), with no other significant differences between subgroups.
Demographic data for the subgroups classified according to presence of Aβ aggregation and neurodegeneration
SD, standard-deviation; SES, socio-economic status; A, Aβ status; N, neurodegeneration as assessed based on [18F]FDG PET patterns. aComparisons between the four subgroups conducted using one-way ANOVA with Scheffé’s post-hoc tests for continuous variables and chi-square tests for categorial variables. *Significant difference between A+(N)+ and A–(N)–subjects.
Aβ-cognition relationships in the overall sample and the four subgroups categorized according to PET biomarker profiles
In the overall sample, A+ subjects presented significantly lower verbal memory (F = 14.88, p < 0.001), visual memory (F = 24.50, p < 0.001), and MMSE scores (F = 12.68, p = 0.001) compared to those with Aβ negativity (A–) (ANCOVA model including age, sex, and years of education as covariates).
There were also significant differences between the four A(N) profiles for verbal memory, visual memory, and global cognition scores (Table 3). Post-hoc Scheffé’s tests indicated that scores on the three measures were lower in the A+(N)+ subgroup compared to the A+(N)–and A–(N)–subgroups. Mean values and levels of inter-subject variability in regard to cognitive test scores were highly similar between the A+(N)–and A–(N)–subgroups (Table 3). The A–(N)+ subgroup had lower values relative to the A–(N)–subgroup in regard to the RAVLT delayed recall and MMSE scores, but not for the SKT memory subscore (Table 3). There was also a significant difference between the A–(N)+ subgroup and the A+(N)–subgroup in regard to MMSE scores, (Table 3).
Differences in cognitive test performance according to the A(N) classification applied to the overall sample
RAVLT, Rey Auditory-Verbal Learning Test; SKT, Short Cognitive Performance Test; MMSE, Mini-Mental State Examination; *Missing value in one subject; **missing value in two subjects.
Using SUVr as a continuous measure of Aβ deposition, significant associations were found in the overall sample for: verbal memory scores (r = –0.37, p < 0.001); visual memory scores (r = 0.50, p < 0.001); and MMSE scores (r = –0.38, p < 0.001).
In regard to Aβ-memory relationships in separate (N) subgroups, correlation indices were not statistically significant in the (N)–subgroup either for verbal memory (r = 0.13, p = 0.154), visual memory (r = –0.15, p = 0.106), or MMSE (r = 0.04, p = 0.486) scores. Conversely, the (N)+ subgroup displayed significant correlation indices for both verbal (r = –0.31, p = 0.029) and visual (r = 0.51, p = 0.001) memory scores, but not for MMSE scores (r = –0.21, p = 0.100).
Finally, there was a significant association between higher Aβ load and lower cognitive test scores in the A+(N)+ subgroup for visual memory performance (r = 0.45, p = 0.008), but not for verbal memory (r = –0.20, p = 0.155) or MMSE scores (r = –0.22, p = 0.129). No significant correlations were detected between higher Aβ load and lower memory scores either in the separate A+(N)–subgroup (r≤0.34, p≥0.118), the separate A–(N)–subgroup (r≤0.11, p≥0.220), or the combined A+(N)–plus A–(N)–subgroups (r≤0.16 p≥0.100).
Scatterplots showing SUVr measurements and visual memory scores regarding to the above correlation analyses are provided in Fig. 1.
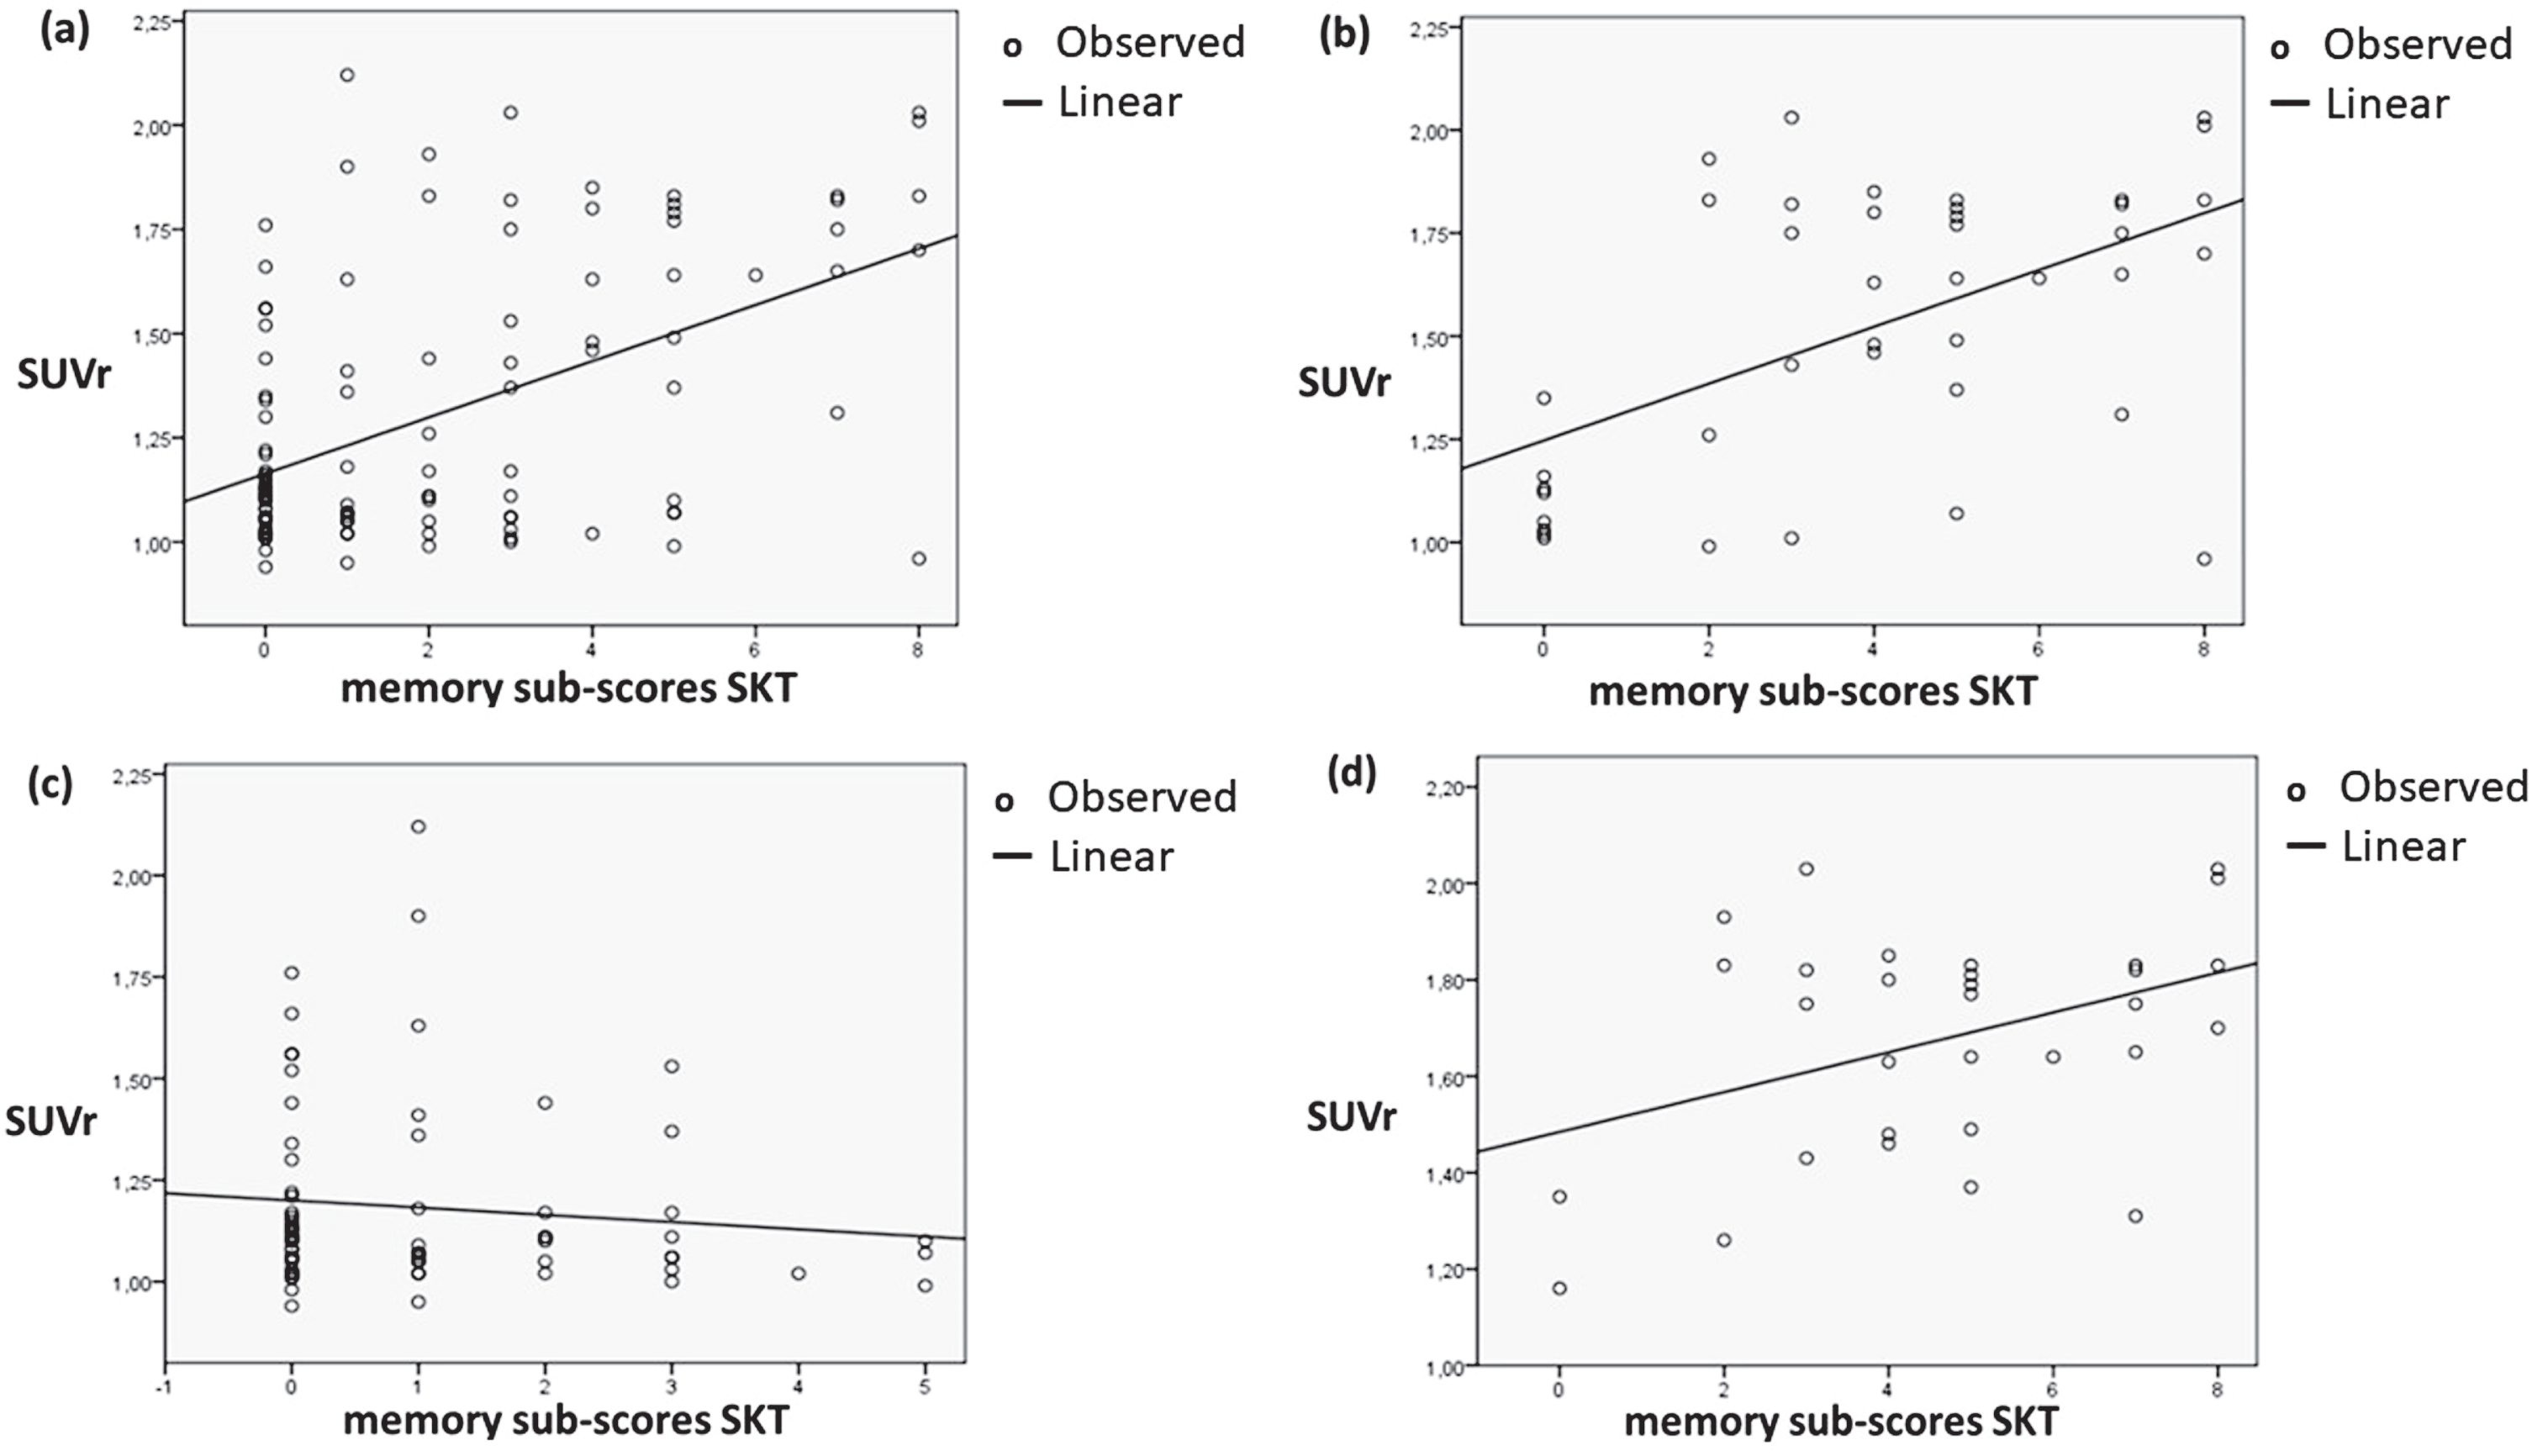
(a) Scatter plot for the overall sample showing visual memory sub-scores of the Short Cognitive Performance Test (SKT) (on the x axis) and [11C]PIB standardized uptake value ratios (SUVRs, on the y axis), obtained using tracer uptake measurements in a meta-region of interest encompassing the prefrontal, orbitofrontal, parietal, temporal, cingulate cortices, and the precuneus, normalized to the tracer uptake in the whole cerebellum. Worse SKT memory performance (as indicated by higher scores) was significantly related to higher values of [11C]PIB SUVr (n = 113, r = 0.50, p < 0.001, partial correlation index controlled for age, sex and years of education). The other graphs show scatter plots for: (b) the subjects rated as presenting neurodegeneration as assessed by [18F]FDG-PET ((N)+), with significant findings in the partial correlation analysis (n = 41, r = 0.51, p = 0.001); (c) the subjects rated as presenting no neurodegeneration ((N)–), with non-significant partial correlation results (n = 72, r = –0.14, p = 0.122); and (d) the A+(N)+ subgroup (n = 31), with significant findings in the partial correlation analysis (n = 31, r = 0.45, p = 0.008).
Relationships between Aβ aggregation and memory test results in the clinically defined groups
In the cognitively impaired subsample (dementia plus aMCI subjects), A+ subjects presented significantly lower verbal memory and visual memory scores compared to A–subjects (Table 4). When the same comparison was conducted separately within the dementia group, there was a trend towards worse cognitive performance in A+ relative to A–subjects in regard to visual memory scores (p = 0.082) (Table 4). There were no significant memory score differences between Aβ-positive and Aβ-negative subjects either in the aMCI or CU groups (Table 4).
Differences in episodic memory performance according to the presence of Aβ positivity in the clinically defined groups
Aβ, Aβ status; SD, standard-deviation; RAVLT, Auditory-Verbal Learning Test; SKT, Short Cognitive Performance Test; aMCI, amnestic mild cognitive impairment; CU, cognitively unimpaired; *Missing value in one subject; **missing value in two subjects.
Using SUVr as a continuous measure of Aβ deposition, significant correlations were found in: the cognitively impaired sample (dementia plus aMCI) for both verbal (r = –0.32, p = 0.002) and visual (r = 0.46, p < 0.001) memory scores; and the dementia group for visual memory scores (r = 0.47, p = 0.003). Correlation indices were not statistically significant either in the aMCI group or the CU group for verbal (r < 0.26, p≥0.088) or visual (r < 0.18, p > 0.200) memory scores.
DISCUSSION
In this cross-sectional PET study of elderly individuals presenting variable levels of cognitive decline, we documented cognitive performance differences across distinct AD stages using a categorization based on the presence of PET-assessed Aβ burden and neurodegeneration, independently of variations in age, sex distribution, or level of formal education. The results reported herein extend previous findings of several PET studies carried out with samples of patients with dementia clinically compatible with AD, MCI subjects, and CU individuals [9–11, 14], and highlight the usefulness of biomarker-based systems to define and stage cognitive deficits along the AD continuum.
A number of recent studies have conducted cognitive evaluations of elderly subjects subdivided according to principles of the 2018 NIA-AA RF, focusing on samples of nondemented individuals aged from approximately 55 to 65 years. In one of such investigations, Jack Jr. et al. (2017, 2019) applied a complete staging system including PET data to evaluate T status, in addition to Aβ PET imaging to assess A status and MRI-based hippocampal volume measures for (N) staging in CU subjects; greatest impairments in memory and other cognitive domains were present in A + T+(N)+ subjects [50, 51], and follow-up evaluations over a mean of approximately 5 years showed that subjects in A+ categories had the largest levels of cognitive decline over time when combined with T+ status, (N)+ status, or both [51]. Evaluating one other CU sample using a A(N) staging system based on Aβ PET imaging and MRI-based hippocampal volume measurements, Burnham et al. [52] detected worse overall cognitive performance in the A+(N)+ and A–(N)+ categories relative to the A–(N)–subgroup at an initial assessment; after a mean follow-up interval of 6 years, both episodic memory and overall cognition declined significantly in both the A+(N)+ and A+(N)–categories, but not in the A–(N)+ subgroup relative to the A–(N)–subgroup [52]. A similar study by Bilgel et al. [53] used an Aβ PET and MRI-based A(N) categorization and showed no overall cognitive or memory performance differences across the four CU subgroups at baseline. After a mean of approximately 4 years, A+ subjects displayed greater episodic memory decline relative to either the A–(N)–and A–(N)+ subgroups [53]. Episodic memory decline was influenced longitudinally by neurodegeneration (as revealed in the comparison between the A–(N)+ versus A–(N)–subgroups), as well as by the combined effects of Aβ deposits and neurodegeneration (as shown by the comparison between the A+(N)+ versus A+(N)–subgroups) [53]. Similar findings regarding the influence of Aβ burden plus neurodegeneration on longitudinal cognitive decline were reported in a combined Aβ PET, [18F]FDG-PET and MRI study of CU individuals by Mormino et al. [54]. Finally, recent CSF-based analyses of CU groups using a complete AT(N) system showed greater levels of longitudinal decline in A + T+(N)+ subgroups, both in regard to memory and overall cognition [55, 56].
In the present study, we confirmed the prediction that patients displaying Aβ positivity with signs of degeneration (A+(N)+) would present significantly worse cognitive performance in comparison to the A+(N)–and A–(N)–categories, with deficits detected in regard to visual and verbal episodic memory, as well as with a parameter of global cognition (MMSE). These results support a view that neurodegeneration, as indicated herein by [18F]FDG-PET abnormalities, is a key pathological feature that determines the amplitude and severity of cognitive decline along the AD continuum [4, 58].
Associations between Aβ aggregation and cognitive deficits in the present study were present not only when we subdivided groups using a single, conventional cut-point for Aβ positivity (A+), but also when we carried out analyses using SUVr as a continuous measure. Thus in the overall sample (n = 108), the severity of Aβ burden was significantly correlated with lower scores both in regard to visual and verbal memory. Moreover, when we singled out the A+(N)+ subgroups, a dose-response pattern was again uncovered between Aβ aggregation and cognition specifically in regard to visual memory performance, whereby the higher the level of Aβ aggregation, the greater the degree of memory impairment. In previous biomarker-based investigations, similar patterns were observed. For instance, in a recent PET amyloid imaging study including a sample of 66 aMCI patients, Aβ deposition increased linearly as function of memory impairment, with a rate of 0.13/point of composite memory score (R = –0.44, p = 0.0003) [17]. In one other CSF study including 101 patients with clinical profiles varying along the AD continuum, memory performance significantly correlated with CSF levels of Aβ1–42, total tau, and p-tau [12]. Thus, although cognitive symptoms may not be specific of AD [22], the results above suggest that episodic memory scores co-vary with Aβ deposition and remain as significant parameters related to neurodegenerative processes.
Both our A+(N)–and A–(N)–subgroups included a significant proportion of CU subjects (27.8% and 47.8%, respectively) (Table 1), and these two subgroups presented highly similar mean scores and levels of inter-subject variability across all three cognitive measures. Moreover, correlations between severity of Aβ deposition and memory deficits in the present study were significant when analyses were restricted to subjects classified as (N)+, but not when correlation analyses were carried out separately for (N)–subjects. Such negative findings are consistent with the results reported in some previous PET studies carried out with similarly sized samples of aMCI and CU individuals [19–22]. A previous meta-analysis evaluating the relationship between Aβ burden and episodic memory performance in elderly CU samples demonstrated that significant findings may be detected in such subjects, but with small effect sizes [14]. One recent study did uncover significant associations between presence of Aβ aggregation and memory performance deficits in analyses carried out using a very large dataset pooling samples of MCI patients and CU subjects from multiple sites [16]. In that study, memory scores differences between A+ and A–groups were relatively modest, in the order of 16% for aMCI and 5% for CU samples [16]. Given the subtlety of memory deficits detected in those previous investigations, it is conceivable that the negative results of our analyses comparing A+(N)–and A–(N)–subjects would have been due to limited statistical power afforded by the modest size of those two subgroups, as well to the likely etiological heterogeneity of aMCI [54]. It should also be noted that above-cited recent analyses on large non-dementia samples indicated that Aβ-memory associations emerge more clearly in individuals older than 70 years [16]. The age range in our study was relatively wide, where approximately one-third of non-dementia subjects aged from 60 to 69 years.
In the present study, we added analyses for clinically defined groups to the main approach of categorizing the sample based on A and (N) biomarker changes. Thus, when we conducted separate analyses in A+ subjects with cognitive impairment (dementia plus aMCI patients), findings were significant for both visual and verbal episodic memory in the correlation analyses with SUVr. In the dementia subjects, SUVr correlations were significant with visual memory scores. Finally, there was also a trend toward a significant difference for visual memory when A+ and A–dementia individuals were compared against each other. The significant findings pertaining specifically to dementia patients replicate the results of previous studies carried out with similar samples [9, 10], and reinforce the view that episodic memory scores may be relevant disease staging parameters, as they continue to correlate with biological markers among dementia patients.
While the results of the present study indicate that deficits in verbal and visual episodic memory are both present in proportion to neurodegenerative changes along the AD continuum, it should be noted that all of our analyses specifically pertaining to the relationship between the degree of Aβ aggregation and cognition produced findings that were more salient in regard to visual episodic memory. Such pattern of results is consistent with the findings of previous investigations indicating that visual memory indices may be useful to discriminate between subjects at different stages of the AD continuum (unimpaired cognition, MCI, and mild dementia) [59, 60] as well as to predict future cognitive decline in subjects at risk for AD [61–63]. Visual episodic memory tests may be superior to word list learning as markers of episodic memory, as the former require both visual and verbal encoding. Word list learning, without the support of semantic cues, as in the Free and Cued Selective Reminding test [64], may be more affected by lack of attention during encoding. Despite that, both visual and verbal episodic memory tests have been significantly associated with biomarkers [64, 65].
Studies undertaking both Aβ-PET imaging and [18F]FDG-PET imaging in elderly samples recruited in middle income environments such as ours are scarce. We previously reported detailed findings of blinded visual inspections of PET images from the cognitively impaired sample reported herein, where we defined a small A–(N)–subgroup who presented very low educational levels [35]. There is evidence that low levels of education significantly impact on both MMSE and episodic memory performance in Brazilian individuals [37, 66]. However, it is unlikely that the main findings pertaining to Aβ-cognition relationships reported in the present paper would have been determined by variations in levels of education, as the A+(N)+, A+(N)–and A–(N)–subgroups were highly similar in regard to mean levels of educational attainment. Moreover, all significant cognitive score differences between subgroups and correlations with Aβ deposition were corrected for the potential confounding influence of educational attainment. However, the generalizability of the findings reported herein should be ascertained by contrasting our PET-based results with those obtained in elderly samples recruited in other environments.
One final aspect of interest in the current study pertains to the results found in the SNAP (A–(N)+) subgroup. Despite its modest size, this subgroup presented significantly lower global cognition scores in comparison to both the A–(N)–and A+(N)–subgroups, as well as lower scores relative to the A–(N)–subgroup in regard to verbal memory (with analyses corrected for variations in educational background). Such preliminary findings highlight the potential usefulness of category systems based on AD biomarkers to tease apart different biological categories and evaluate their specific clinical relevance [5]. It should also be noted that only visual memory scores discriminated the A+(N)+ and A–(N)+ subgroups in the present study, and this highlights the relationship between visual memory performance and AD-related Aβ neuropathology [62, 63]. The presence of neurodegenerative disorders other than AD should be considered in those individuals [35], for instance limbic-predominant age-related TDP-43 encephalopathy (LATE) [67].
One limitation of the present study, already mentioned above, refers to the modest size of some of our subgroups. Another important limitation lies in the fact that we did not obtain CSF- or PET-based measurements of pathological tau accumulation. This prevented us from carrying out a complete in vivo assessment of AD neuropathology according to the 2018 NIA-AA RF [5]. Therefore, we were not able to map the contribution of tau-related features to the cognition-neuropathological changes evaluated in vivo in the present study. In a recent longitudinal neuroimaging investigation of elderly subjects without dementia classified using the 2018 NIA-AA RF staging system, fastest memory decline over time was seen not only in A + T+(N)+ and A + T–(N)+ subgroups, but also in the A + T+(N)–subgroup relative to all other AT(N) categories; this indicates that the association of Aβ deposition with memory decline is clinically relevant when in combination with neurodegeneration, but also in concomitance with tauopathy (combined or not with neurodegeneration) [4]. Additionally, a recent investigation of imaging biomarkers from a non-dementia elderly sample included in the Alzheimer’s Disease Neuroimaging Initiative dataset suggested that correlations between Aβ burden and test scores evaluating several cognitive domains are non-significant when analyses are adjusted for variations in PET-based indices of tau deposition [7].
Despite the above limitations, the present study produced findings that consistently relate memory performance to PET-based measurements of Aβ aggregation and neurodegeneration in elderly subjects presenting variable levels of cognitive performance and functional impairment. Our results indicate that the A(N) categorization of individuals, together with the use of quantitative measurements of Aβ aggregation in a continuous fashion, have the potential to provide complementary information to further advance knowledge on the relationship between cognition and biological changes, both within the AD continuum and also when comparing AD against other neurodegenerative disorders.
Footnotes
ACKNOWLEDGMENTS
We thank Alexandre Teles Garcez (for the technical support), Prof. Carla Rachel Ono (respectively for assistance in imaging data acquisition and visual assessment of PET datasets), Pedro P. Santos, Patricia Rzezak, Maira Okada de Oliveira and Eduardo Sturzeneker Tres (for assistance in the selection and clinical assessment of patients), and Jullie Hernandes (for assistance in the logistics for acquisition and quality control of MRI data).
This research was funded by the São Paulo Research Foundation (FAPESP) reference number 2012/50329-6 and 14/50873-3; National Council for Scientific and Technologic in Development (CNPQ) in Brazil reference number 465412/2014-9. PS was supported by National Council for Scientific and Technologic in Development (CNPQ) in Brazil (88887.137488/2017-00).