
Abstract
Background:
Predicting the prognosis of mild cognitive impairment (MCI) has outstanding clinical value, and the hippocampal volume is a reliable imaging biomarker of AD diagnosis.
Objective:
We aimed to longitudinally assess hippocampal sub-regional difference (volume and asymmetry) among progressive MCI (pMCI), stable MCI (sMCI) patients, and normal elderly.
Methods:
We identified 29 pMCI, 52 sMCI, and 102 normal controls (NC) from the ADNI database. All participants underwent neuropsychological assessment and 3T MRI scans three times. The time interval between consecutive MRI sessions was about 1 year. Volumes of hippocampal subfield were measured by Freesurfer. Based on the analysis of variance, repeated measures analyses, and receiver operating characteristic curves, we compared cross-sectional and longitudinal alteration sub-regional volume and asymmetry index.
Results:
Compared to NC, both MCI groups showed significant atrophy in all subfields. At baseline, pMCI have a smaller volume than sMCI in the bilateral subiculum, molecular layer (ML), the molecular and granule cell layers of the dentate gyrus, cornu ammonis 4, and right tail. Furthermore, repeated measures analyses revealed that pMCI patients showed a faster volume loss than sMCI in bilateral subiculum and ML. After controlling for age, gender, and education, most results remained unchanged. However, none of the hippocampal sub-regional volumes performed better than the whole hippocampus in ROC analyses, and no asymmetric difference between pMCI and sMCI was found.
Conclusion:
The faster volume loss in subiculum and ML suggest a higher risk of disease progression in MCI patients. The hippocampal asymmetry may have smaller value in predicting the MCI prognosis.
INTRODUCTION
Alzheimer’s disease (AD) is the most common cause of dementia and characterized by the progressive cognitive decline, especially memory deficit. The core pathological markers of AD are amyloid-β (Aβ) and neurofibrillary tangles (NFTs). As no effective medicine exists, studies have thus paid more attention to mild cognitive impairment (MCI) [1], which is deemed as individuals having a high risk of AD. Notably, about 8.3 to 31.4%of MCI patients convert to AD [2–4], and these MCI were thus defined as progressive MCI (pMCI). However, more than half of MCI patients do not progress even after a 10-year follow-up [5, 6]. Undoubtedly, the management of stable MCI (sMCI) increases the pressure on medical resources.
Due to the reproducible and non-invasive nature, MRI-based imaging biomarkers are important in the early diagnosis and prognosis assessment of AD. As the pivotal structure of episodic memory mediation, volume of hippocampus (HP) is one of the most reliable imaging biomarkers [7]. By measuring the whole hippocampal volume, previous studies have shown significant hippocampal atrophy in MCI patients. However, the HP is a heterogeneous formation. According to histological grounds, we can divide the HP into several subfields such as subiculum and cornu ammonis (CA 1–4) [8], which show differential vulnerability to AD pathology. Previously, neuropathological studies showed NFTs are transmitted along CA1 to CA4 along the AD continuum [9, 10]. In addition, West et al. have reported that AD patients showed reductions of 68%in CA1 and 47%in the subiculum [11]. Therefore, the HP subregions might be more sensitive as a biomarker than the HP overall volume measurement [12]. Recently, some cross-section studies have demonstrated that the volume of subiculum and CA1 could effectively distinguish MCI [13–15], or even subjective cognitive decline (SCD) [15], from normal aging. However, whether sMCI and pMCI have differences in the volume of HP subregion or in the rate of progression, remains unclear.
In addition to volume, asymmetry of HP is also a potentially effective biomarker for predicting the risk of AD [14, 17]. Specifically, cerebral laterality is a property of the human brain [18, 19]. Previous AD studies frequently reported regional abnormalities in hemispheric asymmetry, including a smaller volume and faster atrophy, especially in the left hemisphere [20–24]. Asymmetry alteration of MCI and AD in limbic structures have been reported [25]. Furthermore, pMCI patients showed asymmetric differences in the medial temporal lobe compared to sMCI [26]. Consistently, prior work also found the lateralization of hippocampal subfields. In the continuum from MCI to AD, Sarica et al. have found a general trend of elevated asymmetric degree of HP volume with increasing diagnosis severity [27]. As far as we know, the dynamic alteration of HP subfields volume in MCI patients is still unclear. Further, whether HP asymmetry is an indicator to predict the clinical prognosis of MCI remains unclear.
We aimed to evaluate longitudinal changes of hippocampal subfields alteration in both pMCI and sMCI patients over a 2-year follow-up. The HP indicators we focus on include sub-regional volume and asymmetry index (AI) [25, 28–32]. Based on previous research results that HP subfields are differentially susceptible to tau protein deposition, we thus hypothesized that the volume or AI of subiculum and CA1 might predict the differences in clinical outcomes of MCI.
MATERIALS AND METHODS
Participants
Data used in the preparation of this article were obtained from the Alzheimer’s Disease Neuroimaging Initiative (ADNI) database (http://www.loni.ucla.edu/ADNI).
We selected subjects from the ADNI2-population based on study forms downloaded from the website. The ADNI criteria for normal controls (NC) were: 1) a Mini-Mental State Examination (MMSE) score of equal to or higher than 24 out of 30; 2) a Clinical Dementia Rating (CDR) score of 0; 3) and has no report of any cognition complaint. The ADNI criteria for MCI were: 1) subjective memory complaints; 2) objective memory loss defined as scoring below an education-adjusted cut-off score on delayed recall of the Wechsler Memory Scale (WMS-R) logical memory test; 3) a global CDR score of 0.5; 4) a MMSE score of equal to, or higher than, 24 out of 30; and 5) general cognitive and functional performance sufficiently preserved such that a diagnosis of dementia could not be made by the site physician at the time of screening. The MCI patients which convert to AD according to the NINCDS-ADRDA criteria [33] within four years would be defined as pMCI. Accordingly, the sMCI was defined as diagnostic status remaining as MCI for a minimum of three years [34, 35]. In order to improve reliability, we only include sMCI patients which have unchanged diagnosis at least four years into our study.
Based on the above criteria, we identified 99 MCI patients (including 31 pMCI and 68 sMCI) and 108 NC underwent MRI scan and neuropsychological assessments at all three time points. After screening procedure, we excluded 17 subjects (9 sMCI patients, 2 pMCI patients, and 6 NC) because of signs of depression (the Geriatric Depression Scale, score ≥5) during the follow-up period. Additionally, we excluded 7 sMCI patients who had CDR score as 0 at several times points during the follow-up periods.
Finally, we identified 183 subjects, including 81 MCI (29 pMCI, 52 sMCI) and 102 NC. Notably, the time intervals between three times of scanning were 1.05±0.11 years (range: 0.5–1.5) and 1.02±0.11 years (range: 0.7–1.6), respectively. For the reliability and repeatability of our study, we selected 80 Aβ-negative NC and 67 Aβ-positive MCI based on the cutoff of global AV45 SUVR to compose a subset for further analyses [36].
Image acquisition
Sagittal 3D T1-weighted MRI sequence (TE/TI/TR = 2.98/900/2300 ms, matrix size 256×256×176, slice thickness = 1.20 mm) were performed for each participant. Details of the ADNI neuroimaging acquisition protocol are publicly available on the Laboratory of Neuroimaging (LONI) website (http://www.loni.ucla.edu/ADNI).
Hippocampal subfields volume estimation
Volumetric estimation of hippocampal subfields was performed using FreeSurfer (version 6.0, http://surfer.nmr.mgh.harvard.edu). Automated segmentation of the hippocampus to its respective subfields was performed based on a computational atlas of the hippocampal formation, based on ex vivo, ultrahigh-resolution MRI [37]. The atlas includes CA1, CA2/3, CA4, fimbria, the hippocampal fissure, presubiculum, subiculum, hippocampal tail, parasubiculum, the molecular and granule cell layers of the dentate gyrus (GC-ML-DG), the molecular layer (ML), and the hippocampal amygdala transition area (HATA). In this study, we focused on seven regions into the analysis as previous AD-related studies: the tail, subiculum, CA1, CA2/3, CA4, the ML, and the GC-ML-DG [38]. It should be noted that the hippocampal subfields segmentation and corresponding T1-weighted structural images for each participant were visually inspected using Freeview (see Fig. 1). Also, to correct the effects of the brain volume size, we calculated the estimated total intracranial volume (TIV). As described previously, TIV estimation by FreeSurfer is an atlas-based estimation approach as described previously [39]. In this study, we used subfield-to-TIV ratio for further statistical analyses.
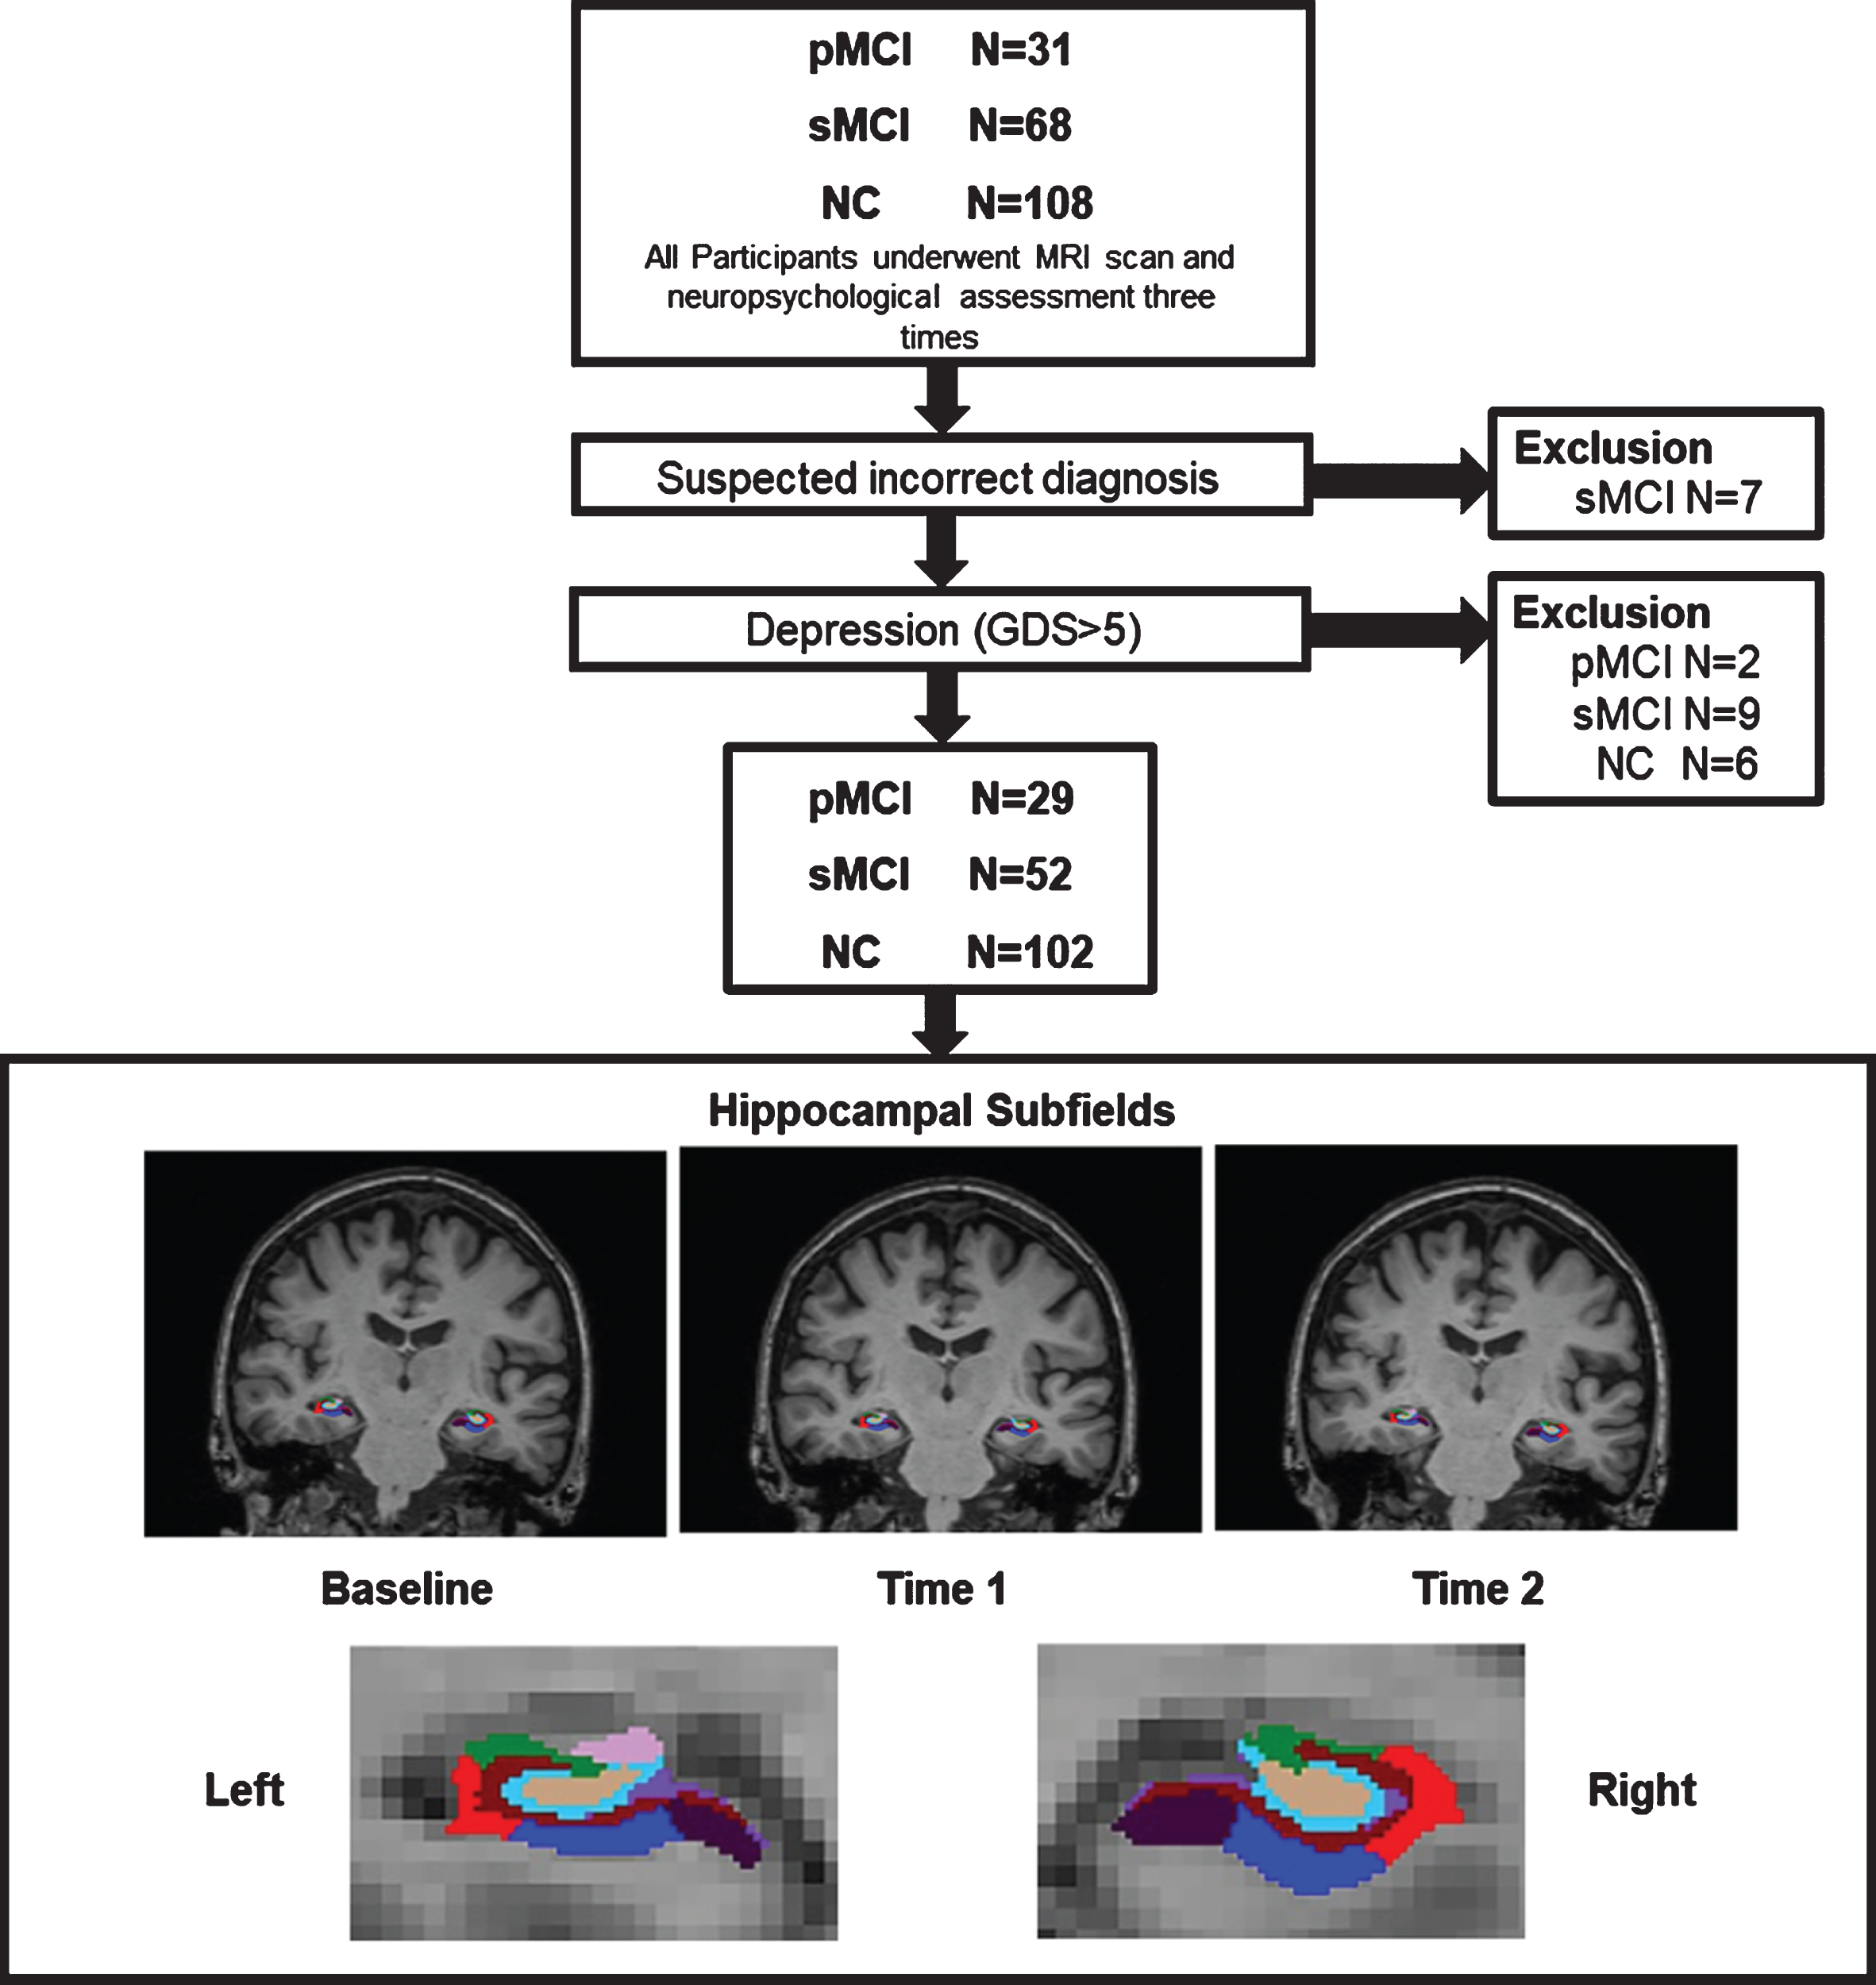
Flow diagram of participants selection and hippocampal segmentation. NC, normal controls; sMCI, stable mild cognitive impairment; pMCI, progressive mild cognitive impairment; GDS, Geriatric Depression Scale.
Asymmetry index
To quantify the magnitude of hippocampal sub-regional asymmetry, we calculated the AI by using the following formula:
As previous studies described [25, 28–32]. In addition, we also calculated the sub-regional asymmetry for further analyses using the Left/Right volumetric ratio.
Statistical analysis
Regarding demographic data, we used the analysis of variance (ANOVA) to compare the age, education, CDR, and MMSE among three groups; subsequently, we performed the post-hoc two-sample t-test. The Chi-square test was used for gender distribution differences assessment (p < 0.05).
Regarding the imaging measures, we applied the analysis of covariance (ANCOVA) for finding differences in each of the hippocampal subfields’ volumes and asymmetric features (AIs and Left/Right ratios) among the three groups (age, gender, and years of education as covariates) at three times (baseline, Time 1, and Time 2). Further, we used repeated measures analyses to detect longitudinal hippocampal subfield volumes alteration. We assessed the main effect of time and group-by-time interaction among the three groups. Age, gender, and education were considered as covariates in analyses. Same as above, we calculated the difference of sub-regional volume changes between the left and right hemisphere. In order to test the hippocampal subfield volumes for differentiation between pMCI and sMCI, we performed ROC analyses for each subfield volume after correcting for age by linear regression in NC group.
We repeated statistical analyses described above in the amyloid stratified subset.
RESULTS
Characteristics of the study population
Table 1 showed the demographic and clinical characteristics of our cohort. At baseline, three groups did not differ in terms of age (p = 0.674) and gender (p = 0.754). Also, there was no significant difference between sMCI and pMCI patients on MMSE (p = 0.910) and CDR scores at baseline. However, the NC group had a slightly higher educational level than sMCI group (p = 0.028).
Sociodemographic and Clinical Characteristics of NC, sMCI, and pMCI
NC, normal controls; sMCI, stable mild cognitive impairment; pMCI, progressive mild cognitive impairment; Aβ+/Aβ-, Amyloid-β status determined by AV45 PET; Summary SUVR, Summary standard uptake value ratio normalized by whole cerebellum; MMSE, Mini-Mental State Examination; CDR, Clinical Dementia Rating.
Hippocampal sub-regional volume
At baseline, both pMCI and sMCI patients showed smaller volume in all subfields than NC (p < 0.05, Bonferroni corrected) controlling for age, education, and gender (Table 2). Also, pMCI patients showed more volume loss than sMCI in the bilateral subiculum, ML, GC-ML-DG, left CA4, and right tail (Table 2). Results of sub-regional volume at Time 1 and Time 2 were shown in Supplementary Tables 1, 2.
Hippocampal Subfield-to-TIV (10–6) of Three Groups at Baseline
aStatistical significance, p < 0.05/14 = 0.0036, compared to NC. bStatistical significance, p < 0.05/14 = 0.0036, compared to sMCI. NC, normal controls; sMCI, stable mild cognitive impairment; pMCI, progressive mild cognitive impairment; CA, cornu ammonis; GC-ML-DG, the molecular and granule cell layers of the dentate gyrus; ML, the molecular layer.
Longitudinally, repeated measures analyses showed that atrophy in bilateral subiculum and ML were faster in pMCI patients than sMCI (p < 0.05, Bonferroni corrected) controlling for age, education, and gender (Table 3, Fig. 2). Besides, repeated measures analyses (control for gender, age, and education) revealed that no significance between left and right hippocampal sub-regional atrophy existed in each group during the 2-year follow-up period (Supplementary Table 3).
Time effects and group-by-time interaction for significant hippocampal subfields between pMCI and sMCI groups
aStatistical significance, p < 0.05/14 = 0.0036. sMCI, stable mild cognitive impairment; pMCI, progressive mild cognitive impairment; ML, the molecular layer; HP, hippocampus.
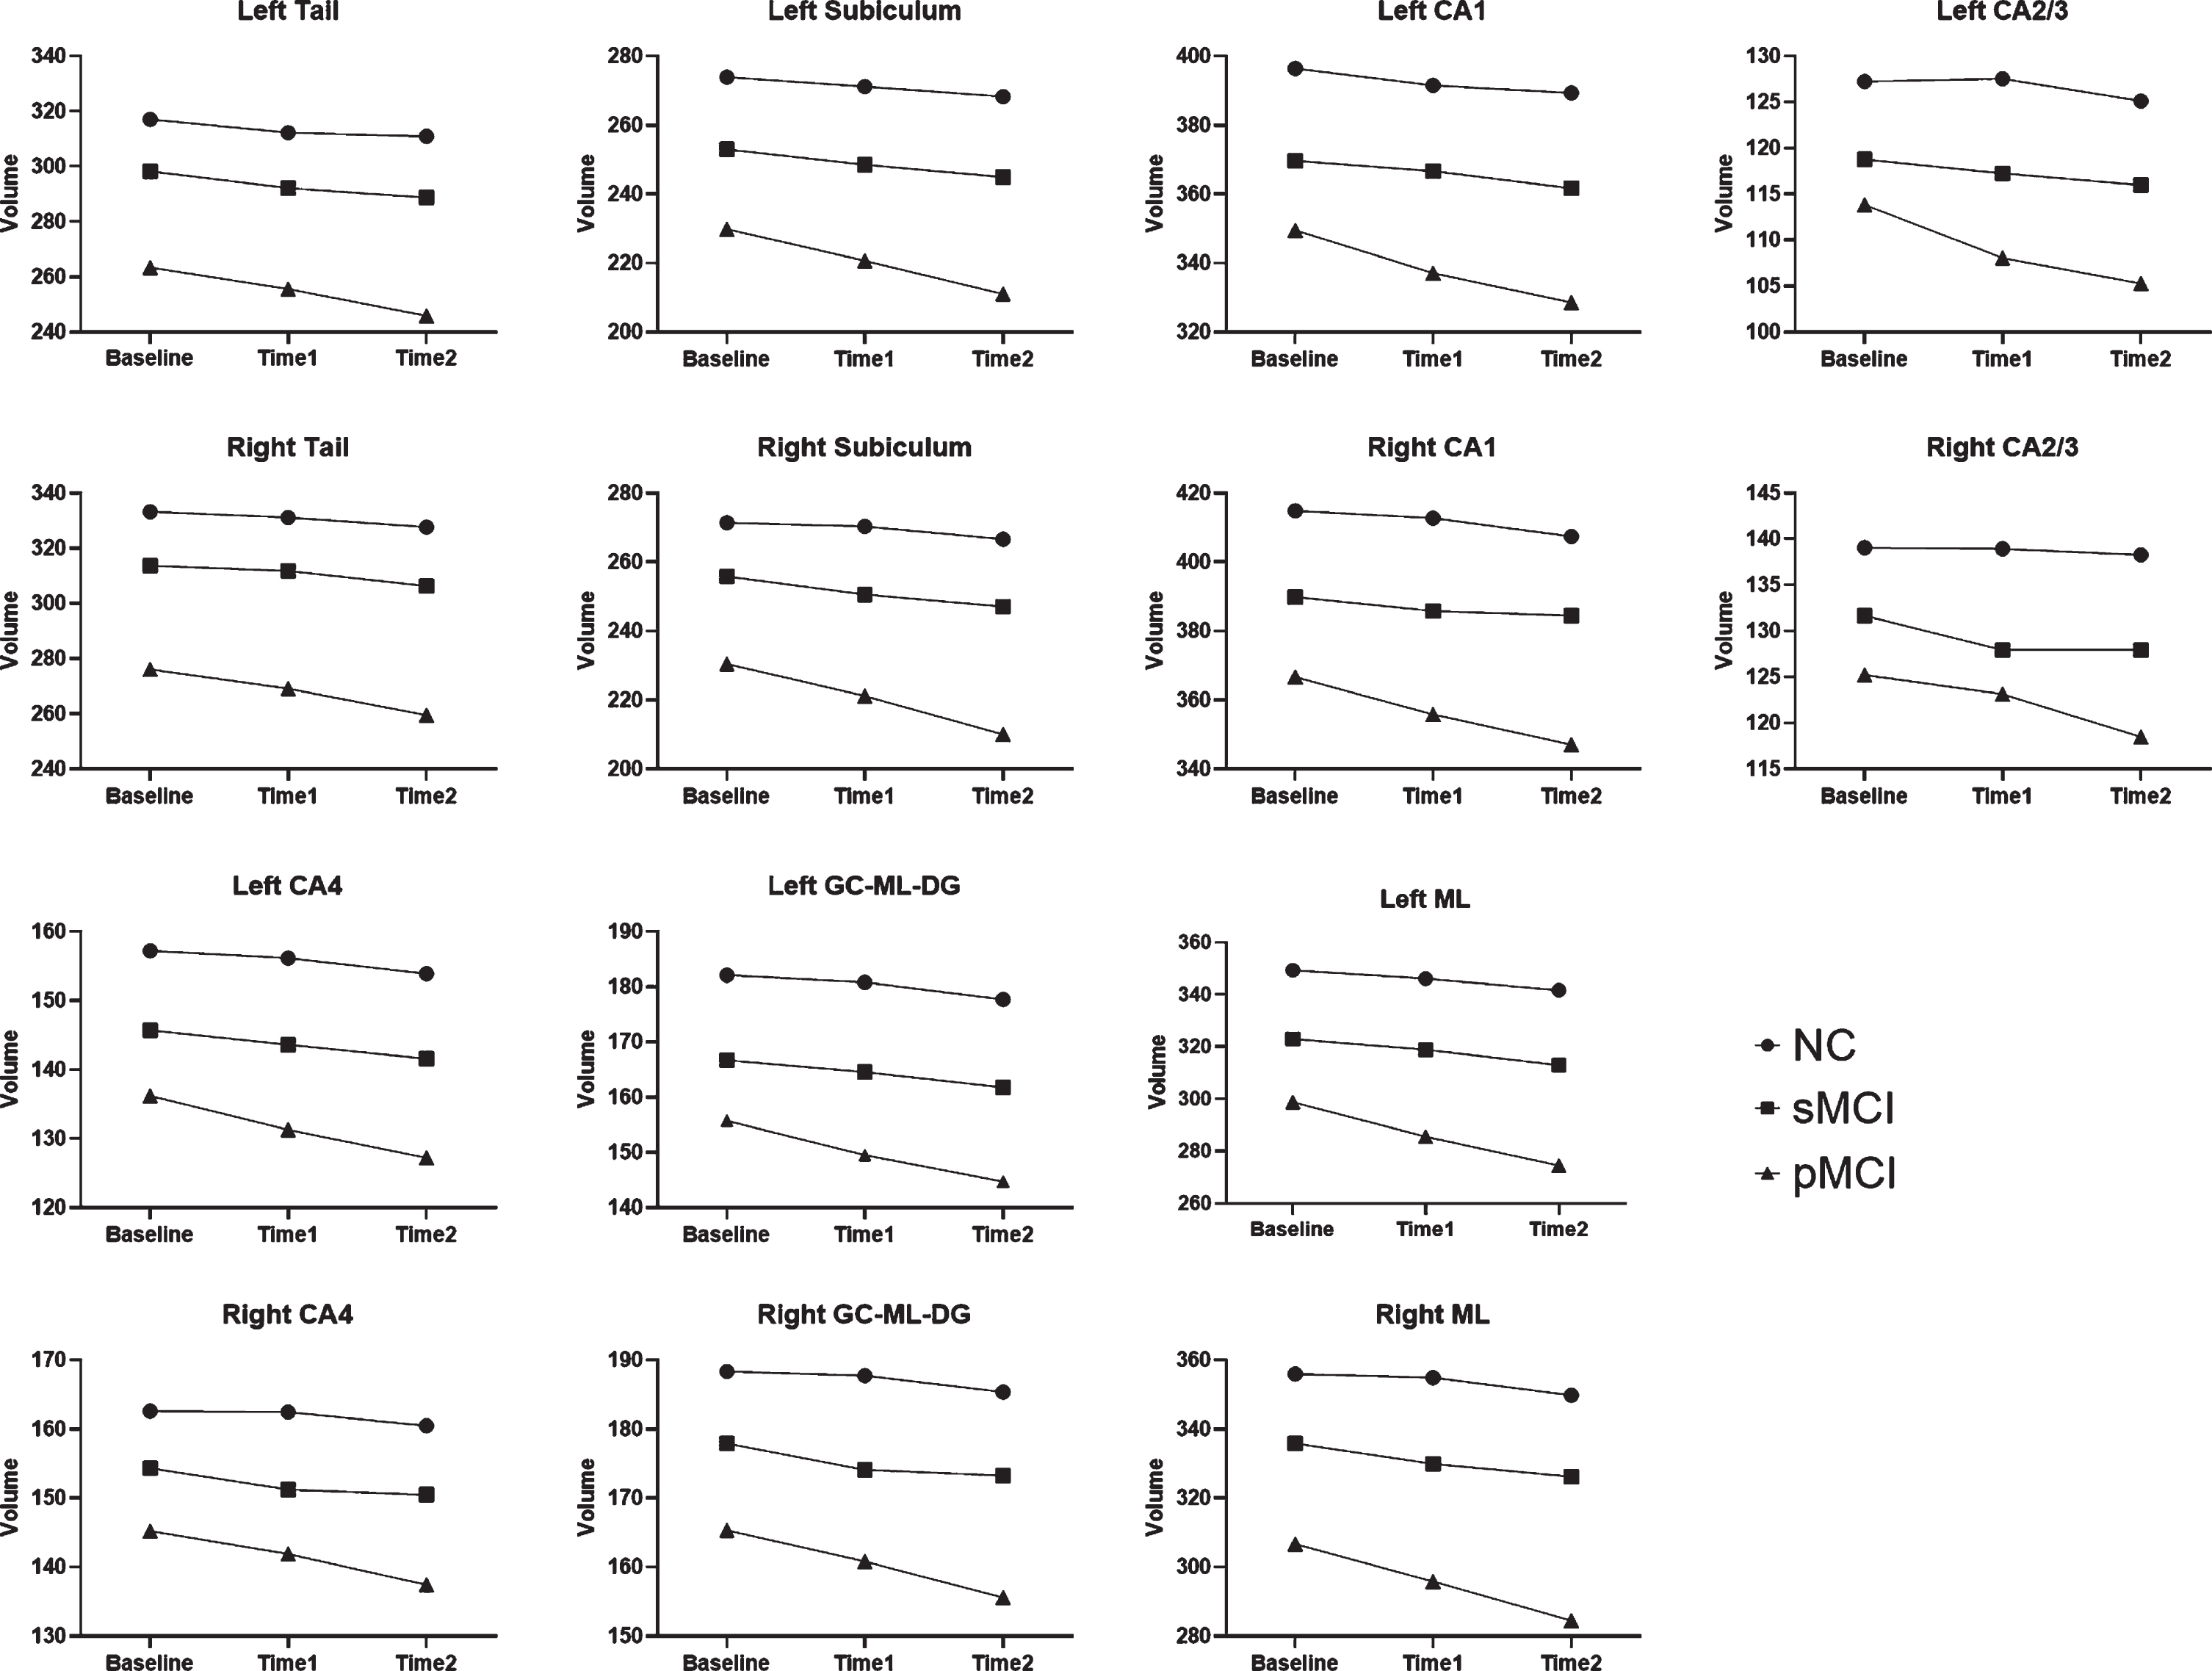
Mean hippocampal subfield-to-TIV volume ratios (10–6) between groups at baseline, Time 1 and Time 2 (adjusted for age, gender and education). NC, normal controls; sMCI, stable mild cognitive impairment; pMCI, progressive mild cognitive impairment; CA, cornu ammonis; GC-ML-DG, the molecular and granule cell layers of the dentate gyrus; ML, the molecular layer.
Asymmetry of hippocampal subfields
Both pMCI and sMCI patients showed increased AI in the subiculum compared to NC at baseline controlling the age, gender, and education (Table 4). Moreover, we found that pMCI patients showed increased AI in CA2/3 and ML (Supplementary Tables 4, 5), whereas sMCI patients showed these differences at Time 2 (Supplementary Table 5). However, no difference in AI between pMCI and sMCI existed at any time.
Hippocampal sub-regional AI of NC, sMCI, and pMCI at baseline
aStatistical significance, p < 0.05/7 = 0.007, compared to NC. NC, normal controls; sMCI, stable mild cognitive impairment; pMCI, progressive mild cognitive impairment; CA, cornu ammonis; GC-ML-DG, the molecular and granule cell layers of the dentate gyrus; ML, the molecular layer; HP, hippocampus.
In addition, we also used the Left/Right ratio to reflect asymmetry, but no significant results were detected (Supplementary Table 6).
Results of the ROC analyses in each subfields and whole hippocampus
The Supplementary Table 7 summarized the formulas between age and sub-regional volume in NC group. Supplementary Table 8 and Supplementary Figures 1–4 none of the hippocampal subfield volumes performed better than the total hippocampus volume.
Results of statistical analyses in amyloid stratified sample
The demographic, clinical characteristics of amyloid stratified sample and volumes of hippocampal subfields were shown in Supplementary Tables 9–12. Repeated measures analyses showed that atrophy in bilateral subiculum and ML were faster in pMCI patients than sMCI (p < 0.05, Bonferroni corrected) controlling for age, education, and gender (Supplementary Table 13). The results of AI in the subset were similar as in the whole cohort (Supplementary Table 14–16).
DISCUSSION
Currently, we aimed to assess the distinct damage pattern of HP subfields (volume and AI) in sMCI and pMCI patients based on a longitudinal dataset. At baseline, pMCI patients had smaller volume in several subfields such as subiculum and ML than sMCI patients. During the follow-up period, pMCI patients showed faster atrophy in bilateral subiculum and ML than sMCI. However, regarding the asymmetric pattern, no significant difference in AI was observed between pMCI and sMCI at any time. Specifically, the results remained unchanged in amyloid stratified sample. Our work demonstrated that the distinct pattern of HP sub-regional atrophy might predict the progression of MCI patients.
First, we found that MCI patients showed significant atrophy in all subfields relative to NC at baseline. Previous work pointed out that HP plays essential roles in episodic memory formation [40, 41], and it is susceptible to the AD-related pathologies, especially the NFTs [9, 42–44]. Our findings were consistent with previous studies, documenting the MCI patients had smaller HP volume than NC [45–47]. Furthermore, a meta-analysis of 14 studies (including 365 MCI and 382 NC) has reported that MCI patients had average volume reduction of 12.9%and 11.1%in the left and right HP respectively [47]. Besides, MCI converters had less volume in HP (including the bilateral subiculum, CA4-DG, and CA2-3) than non-converters [48, 49].
At the sub-regional level, our results showed that pMCI had smaller volume in subiculum than sMCI at baseline. Anatomically, the subiculum locates between the neocortex and the HP, receiving and processing the spatial, mnemonic and movement information from the entorhinal cortex. The subiculum also modulates neuronal activation from the HP to cortical or subcortical areas. Multiple studies have demonstrated that calculating the volume of HP subfields has a higher sensitivity than whole volume in differential diagnosis and prognosis of AD. For example, Mizutani and Kasahara have observed that mild AD patients had a remarkable neuronal loss in the subiculum but only a slight loss in the global hippocampus [50]. In the MCI cohort, de Flores et al. stated that alteration of subicular volume would be more sensitive to detect cerebral change than whole HP, and it is associated with memory performance [51]. Based on a previous neuropathological study, we considered that smaller subiculum in pMCI patients at baseline might represent the early structural disconnection caused by NFTs in an early stage [52, 53]. Accordingly, subicular atrophy is potentially one of the earliest imaging markers in AD [54]. Longitudinally, our results also showed that pMCI patients had faster subicular atrophy than sMCI. A possible explanation might be that severe atrophy (pyramidal neurons loss) in subiculum would significantly influence communication between the HP and other connected regions, further leading to increased cognitive impairment.
Similarly, pMCI patients showed faster volume loss in ML than sMCI. In this study, the ML consists of molecular layer for subiculum and CA fields [37]. Synaptic connection and interneurons in the ML are associated with the regulation of activities in the hippocampal complex. Both the CA (especially CA1) and subiculum are dominant regions attacked by NFTs in the hippocampal formation, composing of different cellular layers such as stratum radiatum and lacunosum moleculare (SRLM). Histologically, the aggregation of hyperphosphorylated tau-protein lead to degeneration of synapse in the SRLM earlier than the neuronal loss in stratum pyramidale [55–58]. Kerchner et al. have observed that less volume of SRLM in AD patients by manual segmentation [59]. In line with previous studies, our results revealed that pMCI have faster atrophy in the ML than sMCI. Synaptic loss in ML might influence information communication between the pyramidal cells and interneurons, further lead to inter-subfields dysconnectivity and finally result in cognitive impairment especially memory deficit. However, during the follow-up period, no significant difference of atrophy in CA fields between pMCI and sMCI was found. We considered that volume loss in the CA field, which reflects the death of neuronal bodies (components, located below the synapse), would appear in the late AD stage. Given that the relatively mild cognitive symptoms of our pMCI cohort, thus we only detected severer synaptic degeneration in ML.
Unexpectedly, we found that the AI is not sensitive to distinguish pMCI from sMCI. Previously, hemispheric specialization is considered as a property of the human brain [18], and abnormal pattern of asymmetry might reflect neural pathology to some extent [32, 61]. Currently, we only noted that pMCI and sMCI patients had increased AIs compared to NC, but no significant difference between pMCI and sMCI patients existed at baseline and follow-up time points. To be specific, there was no difference between atrophy rate of left and right HP subfields, but the sub-regional volume of left HP was smaller than the right one. The previous study has reported that asymmetry difference in medial temporal lobe could predict MCI-conversion. Also, Sarica et al. have found different sub-patterns of the hippocampal structure and a trend of increased asymmetric degree from NC to AD [27]. Consistent with our results, they did not find any difference of AIs between sMCI and pMCI after Bonferroni’s correction. The potential reason of negative AI result is that: first, the volume of subfields is small (only several hundred cubic millimeters), potentially weakening the statistic power due to floor effects; second, the left and right hippocampus might experience similar atrophy rate in the both pMCI and sMCI after the appearance of cognitive deficit (hippocampal volume lower than threshold). According to the calculation formula, the AI was calculated by the ratio between difference and sum of left and right sub-regional volume. Thus, during the follow-up period, volume loss in each subfield may not lead to the significant variation of the AI between pMCI and sMCI.
There were also some limitations in current study. First, hippocampal sub-regional segmentation only used T1-weighted images provided by 3T MR scanner. It may be challenging to define the boundaries of hippocampal subfields especially in several small volume subfields. Further studies using 7T MRI would be more precise to measure sub-regional volume. Second, a 2-year follow-up period may be not long enough. Specifically, we only included MCI patients who would progress to AD after approximately 2 years. Thus, these patients preferentially represent for the MCI at the late stage. Further studies with a longer follow-up period are needed. Third, the sample size of pMCI groups was small. Studies with larger sample size would be more beneficial for detection distinct pattern of hippocampal sub-regional atrophy. Finally, no AD-related neuropathological data such as cerebrospinal fluid or PET were included in our study. Recently, NIA-AA has proposed a novel biological definition of AD independent from classical symptomatic definition [62]. Individuals with both abnormal amyloid and tau biomarkers could be classified as AD. Thus, the application of AD-related biomarkers would be beneficial to detect cerebral change under pathological process.
In conclusion, our longitudinal study demonstrated that hippocampal subfields have distinct damage pattern between pMCI and sMCI patients. In particularly, a faster reduction in subiculum and ML might suggest a higher risk of disease progression in MCI patients. This work may help clinicians effectively determining the progression risk of MCI patients.
Declarations
All procedures performed in studies involving human participants were in accordance by the ethical standards of the institutional and national research committee and with the 1964 Helsinki declaration and its later amendments or comparable ethical standards.
Written informed consent was obtained from all participants and authorized representatives, and the study partners before any protocol-specific procedures were carried out in the ADNI study. More details in http://www.adni-info.org.
Datasets and Data Articles
The datasets generated and/or analyzed during the current study are available in the ADNI study. More details in http://www.adni-info.org.
Footnotes
ACKNOWLEDGMENTS
This study was funded by National Key Resea-rch and Development Program of China (Grant No. 2016YFC1306600), National Natural Science Foundation of China (Grant No. 81901707 and No. 81701337), the Fundamental Research Funds for the Central Universities (No.2017XZZX001-01), Zhejiang Medicine and Health Science and Technology Program (No.2018KY418).
The data collection and sharing for this project were funded by the ADNI (National Institutes of Health Grant U01 AG024904) and DOD ADNI (Department of Defense Award No. W81XWH-12-2-0012). ADNI was funded by the NIA, the NIBIB, and through generous contributions from the following: AbbVie, Alzheimer’s Association; Alzheimer’s Drug Discovery Foundation; Araclon Biotech; Bio Clinica, Inc.; Biogen; Bristol-Myers Squibb Company; Cere Spir, Inc.; Eisai Inc.; Elan Pharmaceuticals, Inc.; Eli Lilly and Company; Euro Immun; F. Hoffmann-La Roche Ltd. and its affiliated company Genentech, Inc.; Fujirebio; GE Healthcare; IXICO Ltd.; Janssen Alzheimer Immunotherapy Research & Development, LLC.; Johnson & Johnson Pharmaceutical Research & Development LLC.; Lumosity; Lundbeck; Merck & Co., Inc.; MesoScale Diagnostics, LLC.; NeuroRx Research; Neurotrack Technologies; Novartis Pharmaceuticals Corporation; Pfizer Inc.; Piramal Imaging; Servier; Takeda Pharmaceutical Company; and Transition Therapeutics. The Canadian Institutes of Health Research is providing funds to support ADNI clinical sites in Canada. Private sector contributions are facilitated by the Foundation for the National Institutes of Health (![]() ). The grantee organization is the Northern California Institute for Research and Education, and the study is coordinated by the AD Cooperative Study at the University of California, San Diego. ADNI data are disseminated by the Laboratory for Neuroimaging at the University of Southern California.
). The grantee organization is the Northern California Institute for Research and Education, and the study is coordinated by the AD Cooperative Study at the University of California, San Diego. ADNI data are disseminated by the Laboratory for Neuroimaging at the University of Southern California.