
Abstract
Background:
Studies providing Alzheimer’s disease (AD) prevalence data have largely neglected to characterize the proportion of AD that is mild, moderate, or severe. Estimates of the severity distribution along the AD continuum, including the mild cognitive impairment (MCI) stage, are important to plan research and allocate future resources, particularly resources targeted at particular stages of disease.
Objective:
To characterize the distribution of severity of AD dementia and MCI among prevalent cases in the population-based Framingham Heart Study.
Methods:
Participants (aged 50–94) with prevalent MCI or AD dementia clinical syndrome were cross-sectionally selected from three time-windows of the population-based Framingham Heart Study in 2004-2005 (n = 381), 2006-2007 (n = 422), and 2008-2009 (n = 389). Summary estimates of the severity distribution were achieved by pooling results across time-windows. Diagnosis and severity were assessed by consensus dementia review. MCI-progressive was determined if the participant had documented progression to AD dementia clinical syndrome using longitudinal data.
Results:
Among AD dementia participants, the pooled percentages were 50.4%for mild, 30.3%for moderate, and 19.3%for severe. Among all MCI and AD participants, the pooled percentages were 29.5%, 19.6%, 25.7%, and 45.2%for MCI-not-progressive, MCI-progressive, mild AD dementia, and the combined group of MCI-progressive and mild AD dementia, respectively. Distributions by age and sex were presented.
Conclusion:
The finding that half of the people living with AD have mild disease underscores the need for research and interventions to slow decline or prevent progression of this burdensome disease.
Keywords
INTRODUCTION
Alzheimer’s disease (AD) has been conceptualized as a pathological-clinical continuum [1]. Although it is challenging to identify clear transitional points, the disease begins with a long asymptomatic period during which pathophysiological processes are progressing (preclinical stage) [1], then evolves to the symptomatic mild cognitive impairment (MCI) phase [2], and finally advances to the dementia phase with increasing stages of severity impairment [3]. Estimates of the disease severity distribution of the sym-ptomatic stages (MCI and dementia) of Alzheimer’s clinical syndrome are useful for health services planning and the development of new disease-modifying therapies that target different stages of the disease.
Population-based research on the percentage of prevalent AD dementia that is mild, moderate, or severe is limited, with only one previous epidemiological study available. The Chicago Health and Ag-ing Project (CHAP) [4] (n = 6,153) estimated the sample-weighted distribution of severity of AD de-mentia clinical syndrome (hereafter referred to as AD dementia), classified by Mini-Mental State Examination (MMSE) [5], using data collected from 1994–1996. Results were that 48%of prevalent AD dementia cases were mild, 31%were moderate, and 21%were severe. The percentages with severe AD dementia increased by age group: among persons aged 65–74 year (y), 17%were severe compared to 20%among persons aged 75–84 y and 28%among those aged 85 + y.
Apart from the CHAP study, other prior research was conducted for dementia in general, rather than AD dementia specifically. For example, the Dementia U.K. 2007 report considered data from the 1980s and provided an expert consensus that that among people with late-onset dementia, 55.4%had mild dementia, 32.1%had moderate dementia, and 12.5%had severe dementia [6]. This distribution was not altered in their 2014 update owing to no new data on severity [7].
More recent data on AD dementia, specifically ac-ross all severity stages from MCI to severe, would be useful for determining study design for research and drug development. Furthermore, data on severity by age and sex has not been widely reported from epi-demiological studies. Hence, this paper aims to characterize the distribution of severity of AD dementia and MCI among prevalent cases in the population-based Framingham Heart Study (FHS). Rather than a single time point, we analysed data from three cross-sectional time-windows in 2004-2005, 2006-2007, and 2008-2009, which allowed us to then pool results to achieve more robust estimates, overall and within age and sex category.
METHODS
Cohort profile
The FHS, a community-based, multigenerational, prospective cohort study, was established in 1948 in the town of Framingham, Massachusetts. Details about the study profile are available [8, 9]. Briefly, FHS cohorts include the Original Cohort (n = 5,209), the Offspring Cohort (n = 5,124), the Third Generation (n = 4,209), the Omni1 (n = 500), the Omni2 (n = 410), and the New Offspring Spouses (n = 103) who all undergo regular follow-up through core health exams [8, 10].
Assessment and ascertainment of cognitive status
Brain aging research began at FHS in 1976, and the detailed cognitive evaluation methods, case ascertainment procedure, and quality control approaches for FHS have been published [11, 12]. Briefly, in addition to the core health exams which happened regularly approximately every two years in the Original Cohort and on average every four years in other cohorts, FHS participants who gave consent receive neuropsychological (NP) assessment every 4-5 years for all cohorts. For those identified as having a pos-sible cognitive impairment, regular neuropsychological examinations were conducted on average every 1-2 years and neurological exams were performed on a subset. Participants were flagged as having possible cognitive impairment if they performed poorly on the MMSE (≤24), had a decline on MMSE (greater than three points between successive examinations, or more than five points as compared with any previous examination), if there were self- or family-reported symptoms of memory loss, or upon referral by a phy-sician (the primary care provider or the FHS physician conducting the follow-up evaluation) or referred by any FHS study staff [11]. To determine whether a participant had cognitive impairment or dementia and to ascertain related information such as date of onset and type of cognitive impairment, a clinical review was routinely conducted by a panel of at least one neurologist and one neuropsychologist, using all available data including comprehensive NP test results, neurological examination, family interview, FHS health exam records, home visit records, and/or hospital/nursing home medical records. All deceased participants were reviewed to determine final cognitive status at time of death regardless of cognitive status. A diagnosis of MCI required evidence of a decline in cognitive performance in one or more cognitive domains, no records indicating functional decline, and not meeting criteria for dementia [2].The diagnosis of AD dementia satisfied the DSM-IV criteria for dementia [13] and the criteria of National Institute of Neurological and Communicative Disorders and Stroke and the Alzheimer’s Disease and Related Disorders Association (NINCDS-ADRDA) for probable AD [14]. The presence of vascular dementia did not disqualify a concurrent diagnosis of AD, if indicated. The severity of dementia and diagnosis of MCI was determined by the review panel using clinical judgment. Although the Clinical Dementia Rating (CDR) scale [15] was not formally applied, the neurologist and neuropsychologist used CDR parameters as part of the severity judgment process. For example, an individual progress into the mild dementia stage when they are no longer able to perform some activities of daily living (ADL) with assistance and their cognitive impairment becomes increasingly obvious to others (e.g., repeats self, forget what was just said, makes mistakes at work). A person in the moderate stage shows a more significant cognitive impairment, and symptoms include things like requiring help with ADLs, disorientation to time and/or place, forgetting personal history, demonstrating a notable change in personality or behavior, etc. In the severe stage, the individual needs complete assistance with ADLs, they may not recognize family members, they may have limited or no speech, they may be doubly incontinent, they may not be able to walk/sit/swallow, etc. The determination of whether MCI later progressed to AD dem-entia was based on whether progression occurred during the participant’s follow-up. That is, it was determined if the participant had documented progression to AD dementia clinical syndrome using the longitudinal data. Participants with MCI who progressed to AD dementia during follow-up are abbreviated as ‘MCI-progressive’, and those who did not progress during the examined time frames are abbreviated as ‘MCI-not-progressive’ hereafter. The median length of follow-up of all MCI cases was 5.0–5.3 y (interquartile range [IQR] 2.9–8.7 y) across Windows (e.g., Window 1 median 5.0, IQR 2.9–8.7 y). Median follow-up among MCI cases who did not progress to AD dementia was 6.2 y (IQR 4.1–10.9 y). Thus, participants with MCI had sufficient follow-up time to observe progression to dementia, if progression to dementia were to occur [16, 17].
Samples of prevalent MCI and AD dementia cases
Prevalent MCI and AD dementia cases were cross-sectionally sampled in three different time-windows of the years 2004-2005 (Window 1), 2006-2007 (Window 2), and 2008-2009 (Window 3). The selection of three different time-windows instead of a single window helps to minimize potential sample selection bias given the different cohorts within the FHS and to acquire more robust estimates. As shown in Fig. 1A-C, the samples were created by using three steps for each window: 1) include participants aged 50–94 y; 2) restrict to participants reviewed for possible cognitive impairment (see prior section); 3) exclude participants without assessment of disease severity or cognitive status at any time during study participation and exclude participants not assigned as MCI or AD dementia during or before the window. After the three steps, the numbers of prevalent MCI or AD dementia were N = 381, N = 422, and N = 389 cases for Windows 1–3, respectively. For participants who had severity information during the study period but were missing severity status in a specific window, we assigned severity for that window based on the median transition times observed among participants with data in the FHS dementia review database: 2.3 y for MCI to mild (observed data of 991 participants); 2.2 y for mild to moderate (observed data of 772 participants); and 1.9 y for moderate to severe (observed data of 463 participants). Among the aforementioned prevalent cases, severity status was assigned in this manner for n = 61 in Window 1, n = 65 in Window 2, and n = 60 in Window 3.
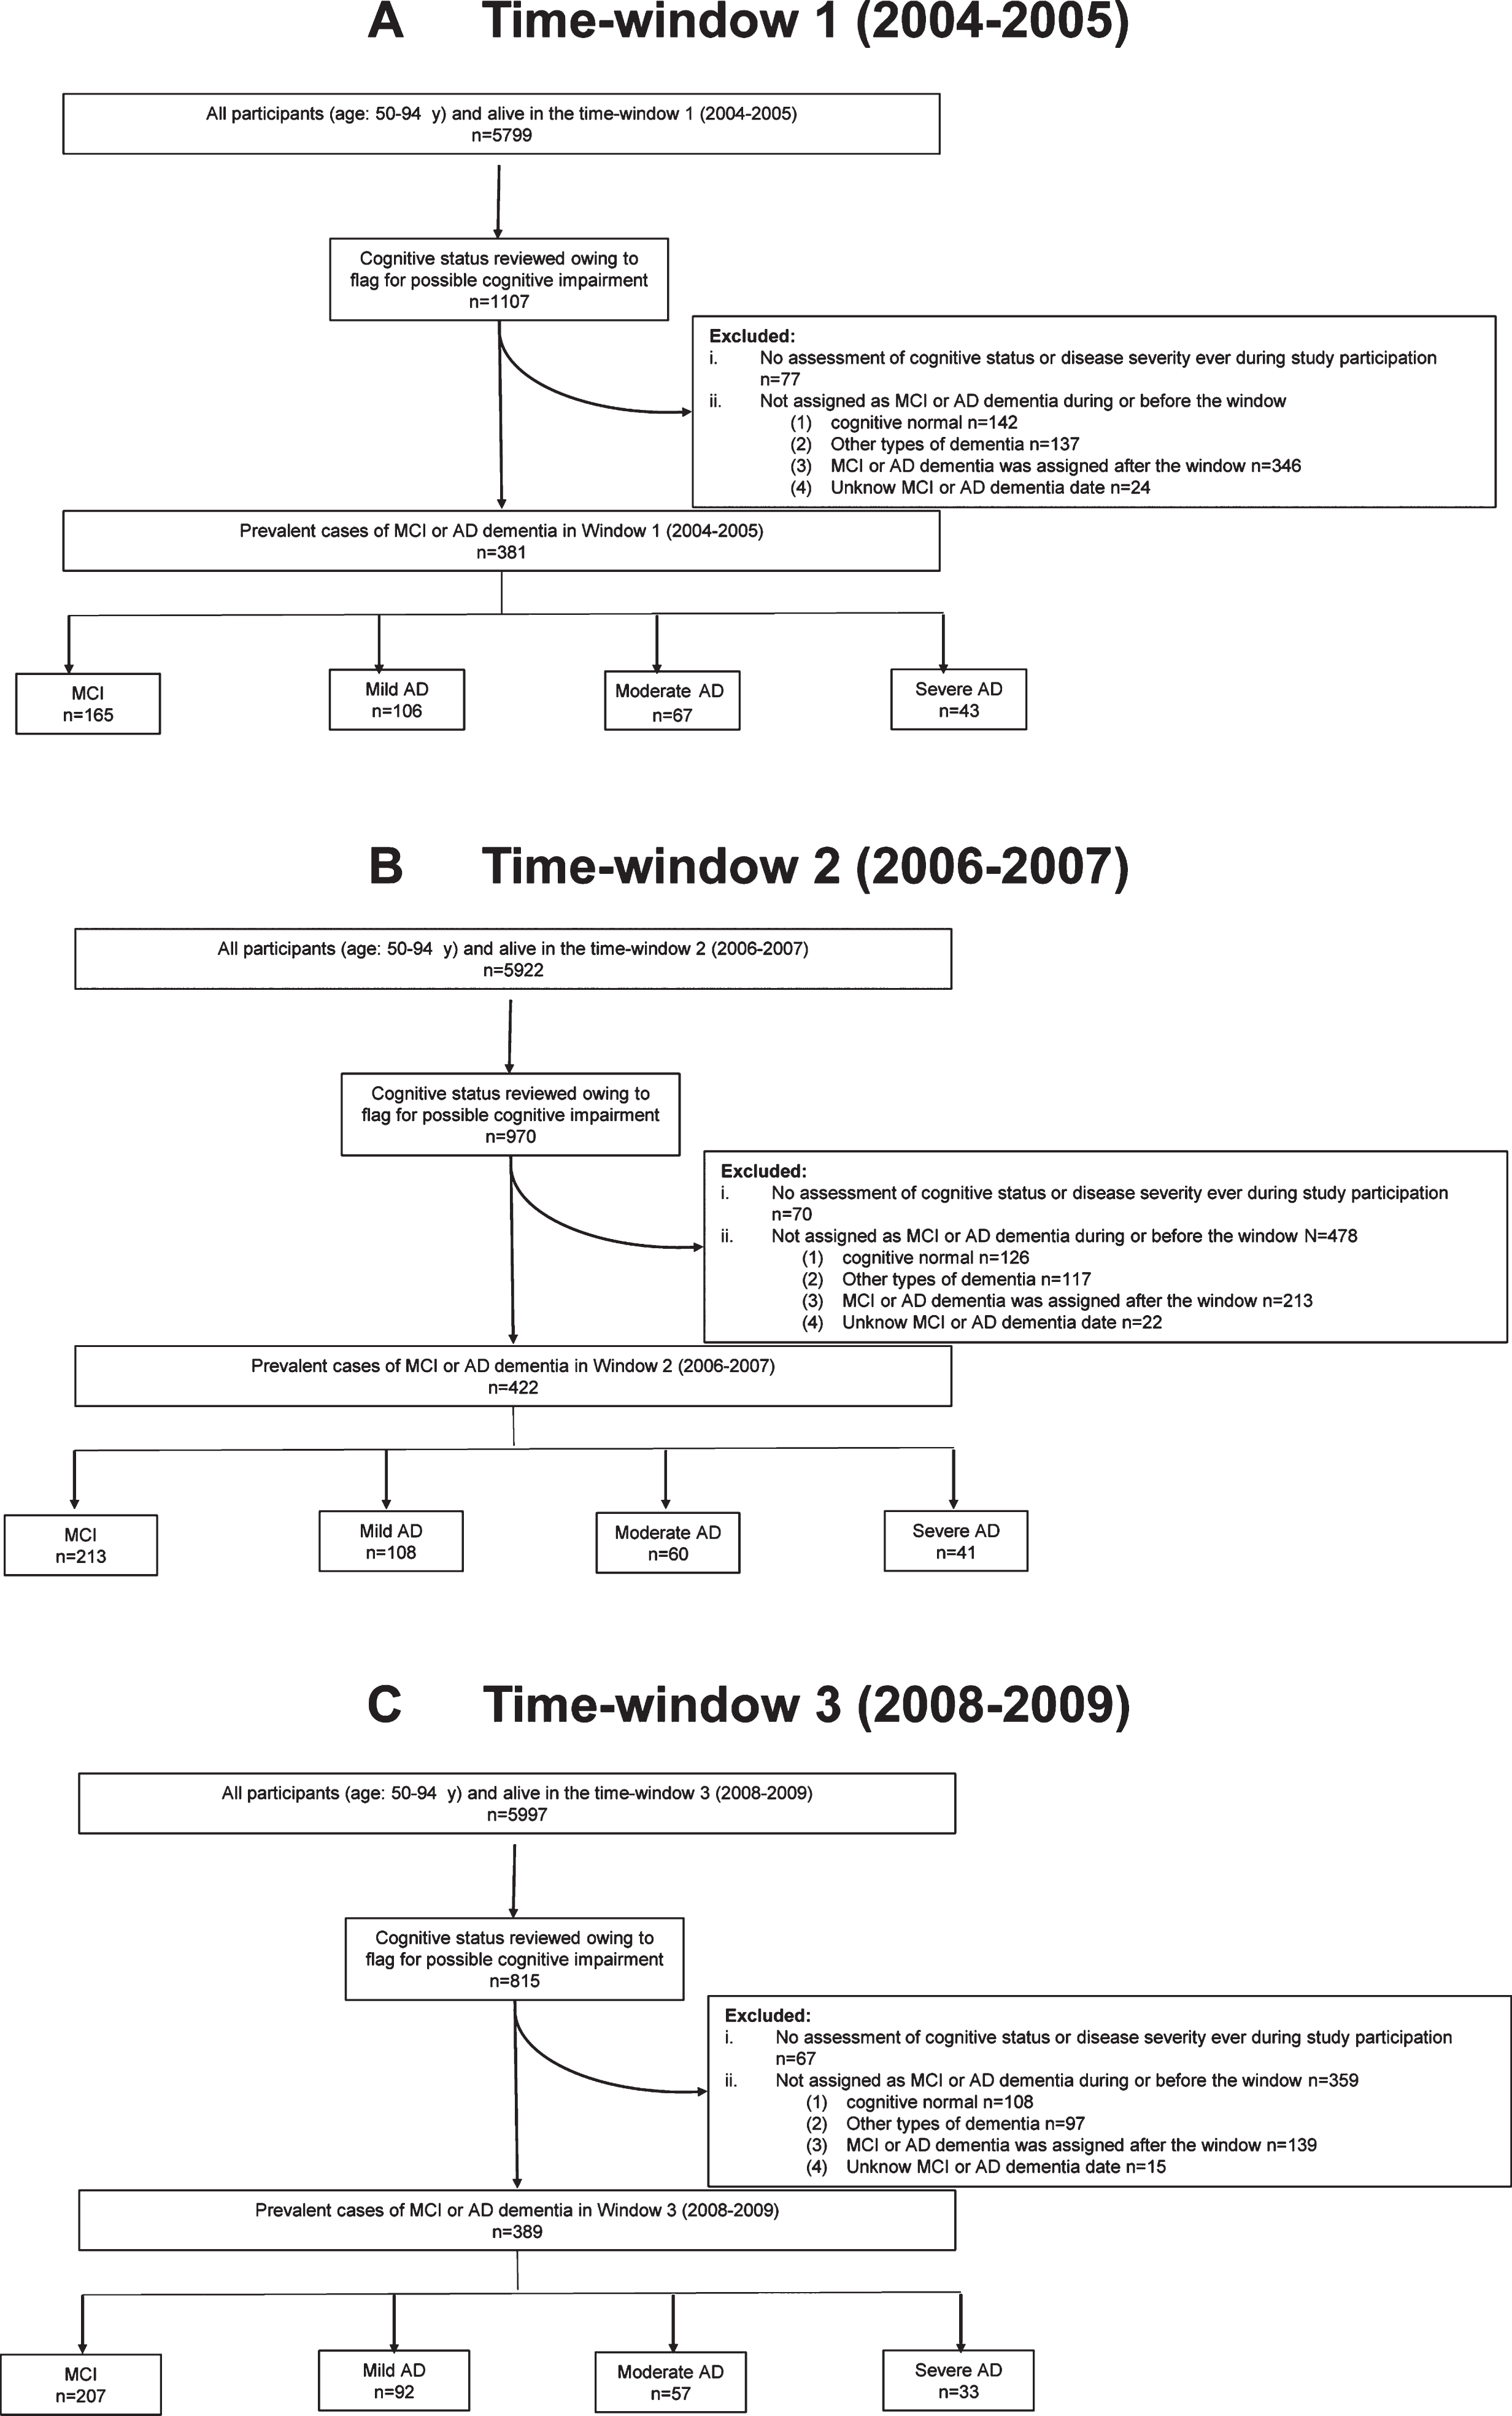
Flowchart of sample selection. Participants aged 50–94 y with a cognitive assessment and a consensus determination of disease severity of MCI and AD in three time-windows.
Ethics approval and consent to participate
The Boston University Medical Campus and Bo-ston Medical Center Institutional Review Board (BUMC/BMC IRB) approved the study procedures and protocols. Written informed consent was obtained from all participants.
Statistical analysis
Analyses were first conducted in each time-win-dow separately. For each window, we examined the following case groups: AD dementia (overall and by severity), MCI (overall and by progression), a combined group of MCI-progressive & AD dementia, and a combined group of MCI-progressive & mild AD dementia. This latter group of MCI-progressive and mild AD dementia are of interest owing to current research on potential disease modifying therapies for earlier stages of AD. We calculated descriptive statistics for age, sex, educational level, and apolipoprotein E ɛ4 allele carrying status (APOE ɛ4-, APOE ɛ4+). Among participants with AD dementia, the number and percentages of participants with each severity level (mild, moderate, and severe) are presented by age (50.0–64.9 y; 65.0–74.9 y; 75.0–84.9 y; over 85.0 y) and by sex within each time-window. Among participants with MCI or AD dementia (total sample), the number and row percentages of participants who were MCI progressive, MCI-not-progressive, mild AD dementia, and combined group of MCI-progressive & mild AD dementia are presented by each age group and by sex within each time-window.
To calculate summary estimates across all time-windows, we used predicted values from generalized estimating equation multinomial regression models with a cumulative logit link, separately for each age group and sex. This method accounted for the three time-windows not being mutually exclusive with re-spect to participants (overlap: N = 293 cases in Window 1 & 2; N = 197 cases in Window 1 & 3; N = 317 cases in Window 2 & 3; N = 197 cases in Window 1, 2, & 3); traditional meta-analysis methods do not take into account participant overlap. The models were intercept-only models, with the dependent variables being severity (mild, moderate, severe), separate MCI/AD status (MCI-progressive, MCI-not-progre-ssive, mild AD dementia), or combined MCI/AD status (MCI-progressive & mild AD dementia, neither mild AD dementia nor MCI-progressive; for this latter outcome the multinomial regression model defaults to a binomial logistic regression model), and participant as a random effect. Since multinomial regression GEE models can only assume an independent within-participant correlation structure, the robust estimate of percentages and their two-sided confidence intervals (CI) are presented here. These robust estimates are theoretically appropriate, even if the within-participant correlation structure is mis-specified. Statistical analyses were conducted using SAS Version 9.4.
RESULTS
Demographic characteristics and APOE ɛ4 status of the samples for each time-window are shown in Table 1 and Supplementary Tables 1, 2. Compared to participants with MCI, those with AD dementia were older in each window (e.g., Window 1: mean age AD 85.1 y; MCI 81.5 y). Among participants with MCI, MCI-progressive was slightly older than MCI-not-progressive (e.g., Window 1: mean age MCI-pro-gressive 82.8 y; MCI-not-progressive 80.2 y). There were more females than males in the samples of AD dementia (69.4%–70.9%female), MCI (54.5%–58.8%female), and MCI-progressive (63.9%–70.2%female), whereas the MCI-not-progressive was more balanced by sex. Across all three windows, 32.1%–39.0%of participants with AD dementia and 39.6%–42.7%of MCI received > 12 y of education. APOE ɛ4 positivity ranged from 26.3%–31.3%in the three windows among AD dementia and from 21.3%–28.2%among MCI participants.
Demographics and ApoE ɛ4 status by window (W) of analysis
Among participants with AD dementia, the percentages of disease in the mild stage were generally higher than those in moderate and severe stages in all three windows (Table 2). The pooled percentages by disease severity across the three windows combined were for mild 50.4%(95%CI: 45.6–55.2), for moderate 30.3%(95%CI: 26.4–34.5), and for severe 19.3%(95%CI: 15.6–23.6) (Fig. 2). Sample sizes by age were small thereby providing less robust estimates (Supplementary Figure 1). In particular, there was a limited number (n = 12–15 cases) of participants with AD dementia under the age of 75 y, which precluded obtaining reliable estimates in the first two age groups. Among AD dementia cases age ≥75 y, the percentage of cases that were in the mild stage appeared higher among those aged 75.0–84.9 y compared to those aged 85.0 + y (53.8%versus 47.1%in Window 1; 59.4%versus 46.9%in Window 2; 62.3%versus 41.6%in Window 3). The pooled percentages of mild, moderate, and severe were 58.6%, 22.7%, and 18.7%in the group aged 75.0–84.9 y. The corresponding percentages were 45.5%, 35.9%, and 18.6%in the group aged over 85.0 y. Stratifying by sex, there was a slightly lower percentage of females in the mild stage than males (pooled estimates: 49.2%versus 53.3%), similar percentages in the moderate stage (pooled estimates: 30.6%versus 29.7%), and slightly higher percentages in the severe stage (pooled estimates: 20.2%versus 17.0%).
Percentages of AD dementia by severity, age, and sex in each time-window among AD dementia
*Data represent the number of participants and row percentages in the bracket, n (%), in each time-window.

Pooled percentages of AD dementia clinical syndrome by disease severity among participants with AD dementia. Pooled percentages of AD dementia by disease severity (mild, moderate, and severe) in three time-windows were illustrated among participants with AD dementia. The 95%confidence intervals were showed by error bars.
Considering all MCI and AD dementia participants as the denominator (Table 3, Fig. 3, and Suppleme-ntary Figure 2), the pooled percentage of mild AD dementia was 25.7%(95%CI: 22.9–28.7), and the pooled percentage of the combined group of MCI-progressive & mild AD dementia was 45.2%(95%CI: 41.3–49.2), consistent with results in each wi-ndow. Comparing MCI by progression to AD dementia, the percentages of MCI-not-progressive were higher than MCI-progressive in the pooled estimate (29.5%versus 19.6%), in Window 2 (30.8%versus 19.7%) and Window 3 (36.2%versus 17.0%), but not in Window 1 (21.3%versus 22.0%). Stratifying by age, except for the youngest age group (50.0–64.9 y) which had only a limited number of cases, the relative proportion of MCI-progressive and MCI-not-progressive among all those with either MCI or AD dementia decreased with increasing age group. Meanwhile, the percentages of mild AD dementia and the combined group of MCI-progressive & mild AD dementia generally increased with increased age. Stratifying by sex, the percentages of MCI-not-progressive were higher in males than females (pooled estimates: 40.2%versus 23.4%). The pooled percentages of mild AD dementia and the combined group of MCI-progressive & mild AD dementia were higher in females (27.6%and 48.1%) than in males (22.3%and 40.2%).
Percentages of MCI progression or mild AD in each time-window among all cases
*Data represent the number of participants and row percentages in the bracket, n (%), for each time-window.
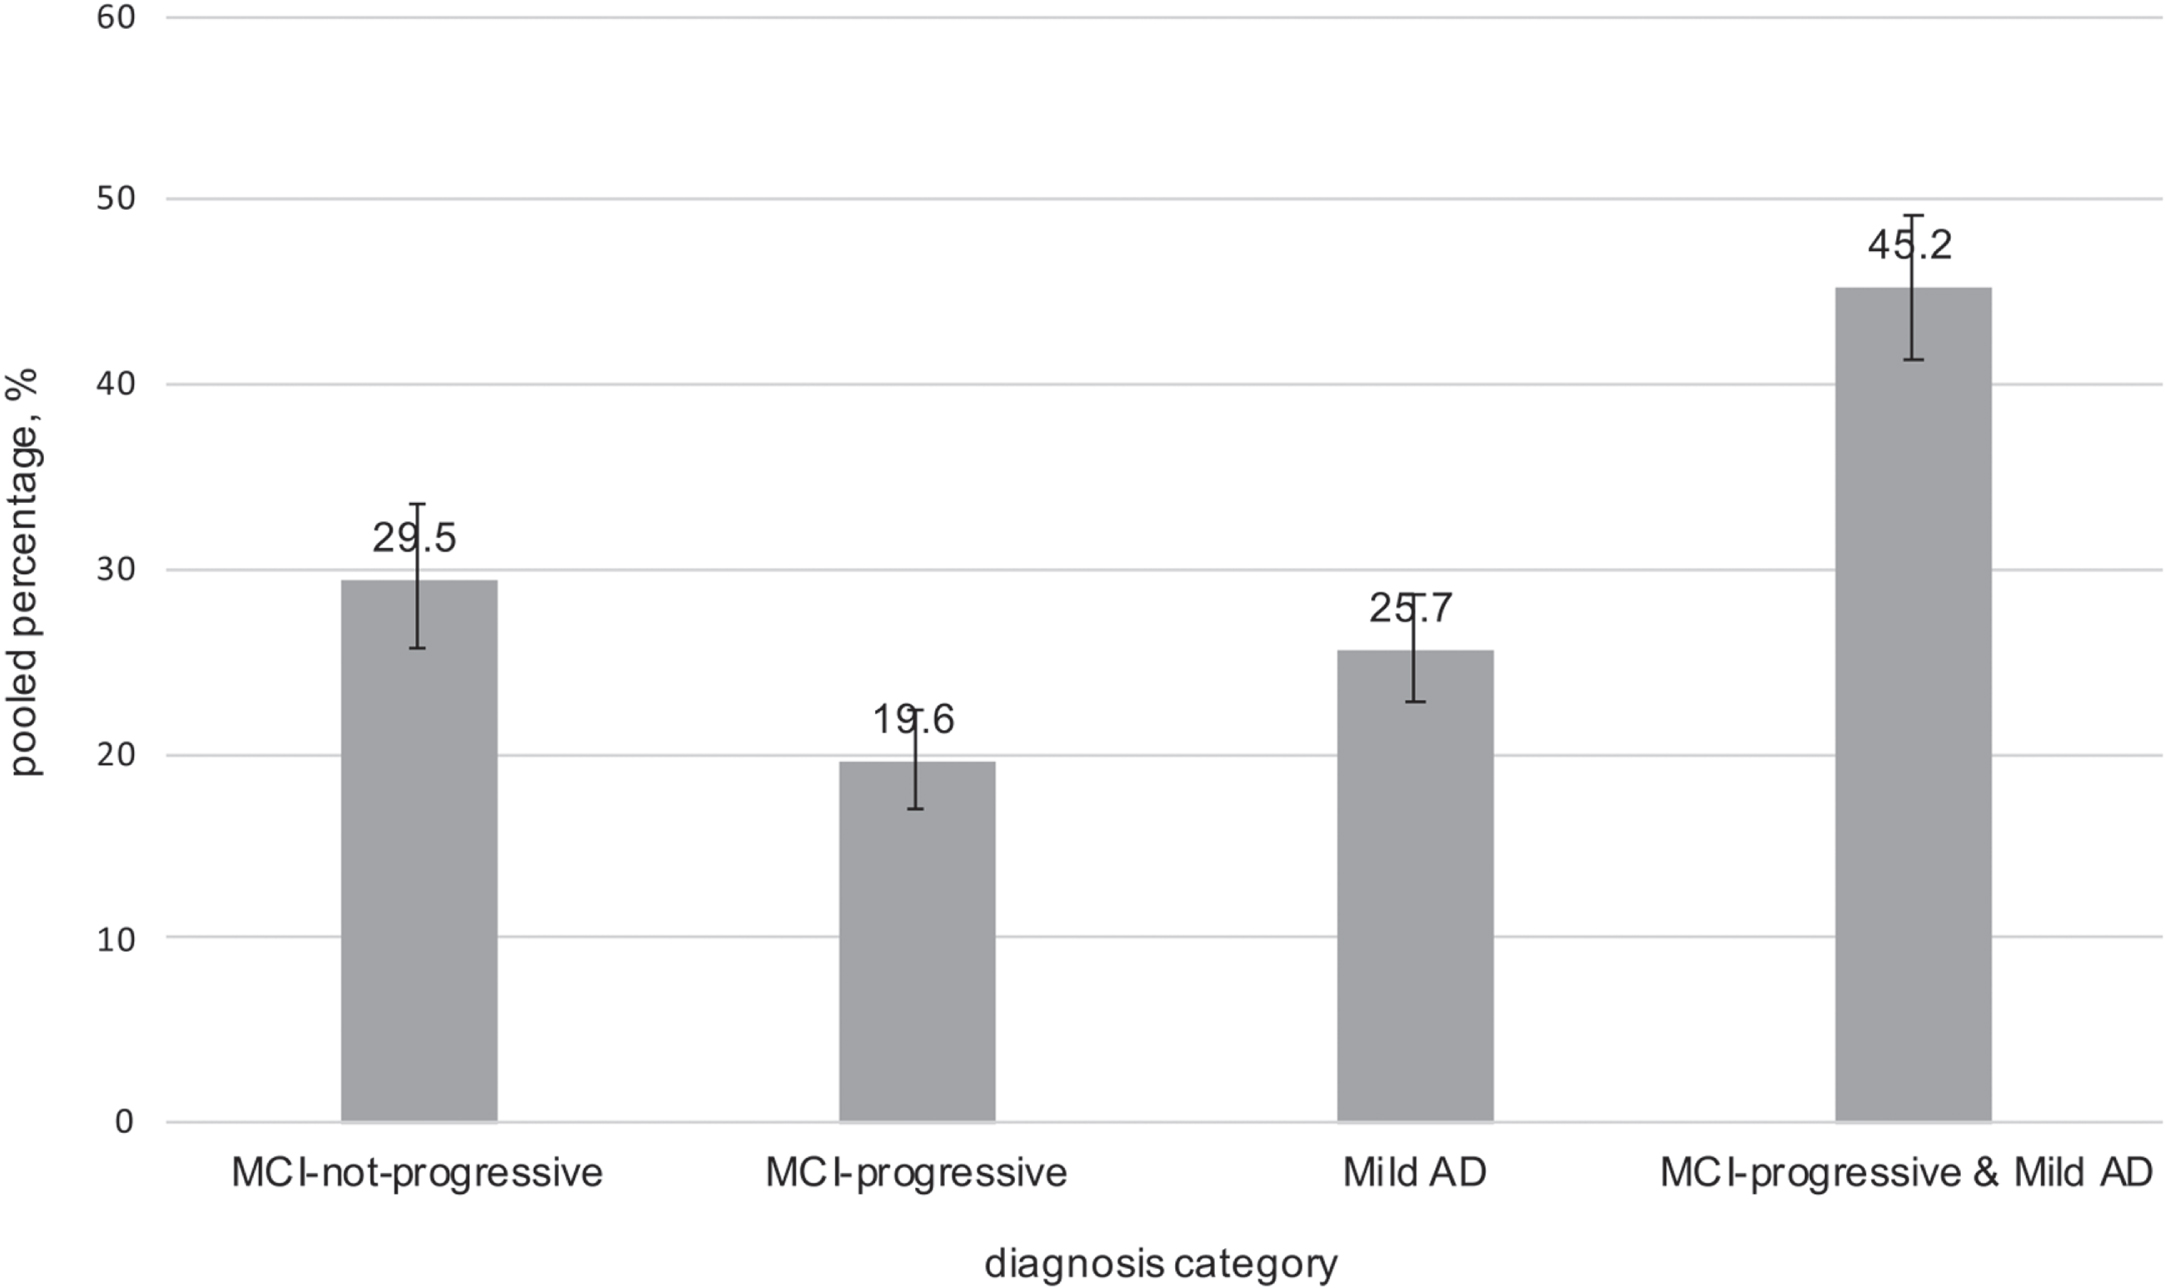
Pooled percentages of MCI progression status or mild AD among all cases. Pooled percentages of MCI-not-progressive, MCI-progressive, mild AD, MCI-progressive & mild AD in three time-windows were illustrated among participants with AD dementia or MCI. The 95%confidence intervals were showed by error bars.
DISCUSSION
The goal of this analysis was to estimate, among people living with AD, the proportion with mild, moderate, or severe dementia. We furthermore considered MCI as part of the spectrum of AD and explored differences by age and sex. To our know-ledge, this is one of only two published epidemiological studies to provide information on the severity distribution of AD in the general population. Whereas there is a large body of existing information on the incidence of AD, including data from the FHS [18, 19], there has been little data on the severity of disease among people living with AD. FHS is ideally suited for this analysis because of its systematic ascertainment of MCI and AD dementia with severity staging. Compared to CHAP [4], rather than using a single cognitive screening test for severity criterion, FHS used a consensus process that considered, when available, multiple cognitive tests and other sources of data to provide a more reliable and accurate ascertainment of severity. More precise confirmation of MCI due to AD was based on documented progression by capitalizing on the longitudinal data.
For the distribution of disease severity among AD dementia, FHS results are consistent with those reported by the Dementia UK 2007 report [6] and by CHAP [4]. Across all three studies, the percentage mild was higher than moderate, and the percentage moderate was higher than severe. Since the Dementia UK 2007 report was based on all dementia and not AD dementia, the results in the present study are more appropriate to compare with those reported from the CHAP study [4]. The pooled estimates of mild, moderate, and severe AD dementia in the present analysis were 50.4%, 30.3%, and 19.3%, respectively, which are comparable to corresponding rates of 48%, 31%, and 21%in the CHAP study. When restricting comparisons to the age-stratified analyses, results are consistent across the studies for some but not all age groups. For example, among ages 75-84 y with AD dementia, both studies reported that ∼59–60%were mild and ∼19–20%were severe. Similarly, among ages 85 + y, both studies reported that ∼44–45%were mild; however, the proportion with severe was higher in CHAP ages 85 + y (28%) than in FHS ages 85+ (19%). This difference among the oldest age group may be explained by differen-ces in study design, sample characteristics, and the smaller sample sizes within the age subgroups in FHS. Importantly, the number of FHS participants within age strata was small, which leads to unstable estimates by age. Regarding demographic differences across the two cohorts, participants of FHS were mainly Caucasian and had higher education levels compared to those in CHAP, which enrolled 10,000 community residents, 60%of whom were African-Americans, with a median of 12 years of education [20]. Also, the two studies had different sampling and research methods regarding cognitive evaluations. In CHAP, clinical evaluation for AD was restricted to a stratified random sample of all participants, and the distribution of disease severity was based on weighted percentage data. In FHS, all participants who agreed to participate were administered comprehensive NP test protocol, although only a subset of participants are prioritized to be dementia reviewed based on performance criteria and/or referrals [11, 12]. The ideal would have been to have all participants reviewed in the community-based study regardless of cognitive status. Although neither FHS nor CHAP fulfilled this ideal, the FHS methods did identify cognitively impaired participants as much as was feasibly possible in a community-based cohort, and did a final review at time of death, regardless of cognitive status, which allowed us to directly calculate the distribution of severity, based on actual cases within a specified period. Lastly, in CHAP, a MMSE cut-off score was used for determining severity. In FHS, the diagnosis and judgment of disease severity were made by consensus review with all available data, which is more accurate than using MMSE only.
Indeed, both CHAP and FHS highlight the challenges of operationalizing criteria for cognitive and functional impairment when conducting population-based studies [2, 21]. Despite published criteria cov-ering subtypes and definitions, there is no definitive best method to measure specific domains, and no con-sensus on determining the diagnosis psychometrically by NP test scores or by consensus review [22]. Even within particular stages of AD, clinical variation in symptom presentation, neuronal changes, biomarker levels, and rate of decline may exist [23, 24]. Subtypes within AD have been hypothesized with studies indicating differences in regional brain atrophy and rates of decline on cognitive metrics between these potential types. In a recent meta-ana-lysis, subtypes of AD were significantly associated with differences in demographics, age at onset, age at death, duration of disease, and biomarker levels [24]. Further, among individuals with MCI, large variability in progression, type of domain impairment, imaging and other disease markers has been documented [25]. Such differences in clinical presentation may be related to differences in underlying neuro-pathology which may influence severity [26, 27]. In observational epidemiological studies, the prevalence of MCI ranges from 3%to 42%[28]. Heterogeneity in MCI incidence estimates was also reported in a recent meta-analysis [29]. A relevant concern are the rates of MCI reported to revert to normal cognition in community-based studies, which vary from 30%to 50%with 2–5 years of follow-up [30]. Biomarker data would help to confirm AD pathology, but currently AD biomarkers are difficult to collect in large population-based studies. Thus, prior cross-sectional studies have limitations in their determination of MCI and whether it is likely due to AD. Despite lack of AD biomarkers in FHS, a strength of this analysis is the use of longitudinal data that documented progression to AD dementia to make the ascertainment of MCI possibly due to AD.
Our analysis focused on MCI due to AD and mild AD dementia, more so than moderate or severe, as current priorities in AD research and drug development focus on the earlier stages. Of note, moderate to severe AD dementia, which is substantially burdensome to patients and society, was also common, accounting for half of all AD dementia. Among females with MCI or AD, the percentages of mild AD and the combined group of MCI-progressive & mild AD were slightly higher than those among males, although the number of males in this analysis was small. Previous analyses of the FHS data showed that there was an overall higher lifetime risk of dementia in women than in men, and that this difference likely reflected the combined effect of a longer life expectancy among women and a selective survival of men with a lower dementia risk beyond age 65 y [31]. Given the relatively small number of men in our analysis of prevalent MCI and AD cases, additional studies are necessary to determine whether women living with AD are more likely to be in mild stages compared to men living with AD. The CHAP study did not report sex-stratified analyses [4].
Limitations of this analysis relate primarily to the largely homogenous study population and lack of AD biomarker confirmation. First, the FHS cohort participants were almost homogenously Caucasians and residents of a single city in Massachusetts. It is worthwhile to conduct further investigations in more racially and geographically diverse populations. Second, although FHS is a longitudinal study, and our analysis included participants from both the original and newer cohorts, the study population over the three time-windows would not be expected to be as dynamic as that of sampling participants from an open population-based cohort and from different geo-graphic areas. Indeed, despite additions of new MCI cases over each time-window, the percentage of MCI-not-progressive slightly increased with each subsequent time-window. This increase could be re-lated to different participants in each window, but it likely reflected that participants with non-progressive MCI remained in the analysis in a subsequent win-dow while new MCI cases entered, and the MCI-progressive group was more dynamic by definition. Third, while loss to follow up may be considered a limitation in all longitudinal studies, FHS had rig-orous methods to maintain contact and continue fol-low-up regardless of participants’ dementia severity, relocation to other geographic locations, institutionalization, or death, by doing full review of electronic health records for deceased participants. Evidence is that the follow-up rate for the FHS Original Cohort was 99.5%. Indeed, we did not observe a higher proportion of mild dementia in the later time window compared to the earlier window, indicating that loss to follow-up was not related to AD severity. Lastly, the study lacked AD biomarker confirmation (e.g., amyloid, tau, neurodegeneration) [32], which would have increased the accuracy of case ascertainment.
In summary, approximately half of prevalent AD dementia cases were of mild severity, whereas approximately one-fifth were severe. When the analysis further considered prevalent MCI as well as AD dementia, approximately 45%of all cognitively impaired or AD-demented participants had early AD (i.e., MCI that would be observed to progress to AD dementia or mild AD). Early intervention in MCI or the mild stage of AD dementia has been the primary focus for AD research and drug development in recent years. Meanwhile, studies providing prevalence data for AD have largely neglected characterizing the severity of AD cases. This disconnect hampers the ability to plan clinical trials, observational research, and policy-making regarding AD therapies targeted at particular stages of disease. Accordingly, our results help fill a data gap on the severity distribution of the symptomatic AD continuum and serve to inform the design of future research studies and optimal resou-rce allocation for policy-making.
Footnotes
ACKNOWLEDGMENTS
We thank the Framingham Heart Study (FHS) participants for their decades of dedication and the FHS staff for their hard work in collecting and preparing the data.
This work was supported by the Framingham Heart Study’s National Heart, Lung, and Blood Institute contract (N01-HC-25195; HHSN268201500001I), and NIH grants from the National Institute on Aging (AG008122, AG016495, AG033040, AG054156, AG049810, AG062109), and Pfizer; Analytic support was provided by Biogen.
Support for Jing Yuan was also provided by the Chinese Academy of Medical Sciences Innovation Fund for Medical Sciences (2016I2M1004); National Key Cooperation between the BRICS Program of China (No.2017YFE0100500).