
Abstract
Background:
The Framingham Stroke Risk Profile (FSRP) was created in 1991 to estimate 10-year risk of stroke. It was revised in 2017 (rFSRP) to reflect the modern data on vascular risk factors and stroke risk.
Objective:
This study examined the association between the rFSRP and cognitive and brain aging outcomes among participants from the National Alzheimer’s Coordinating Center (NACC) Uniform Data Set (UDS).
Methods:
Cross-sectional rFSRP was computed at baseline for 19,309 participants (mean age = 72.84, SD = 8.48) from the NACC-UDS [9,697 (50.2%) normal cognition, 4,705 (24.4%) MCI, 4,907 (25.4%) dementia]. Multivariable linear, logistic, or ordinal regressions examined the association between the rFSRP and diagnostic status, neuropsychological test performance, CDR® Sum of Boxes, as well as total brain volume (TBV), hippocampal volume (HCV), and log-transformed white matter hyperintensities (WMH) for an MRI subset (n = 1,196). Models controlled for age, sex, education, racial identity, APOE ɛ4 status, and estimated intracranial volume for MRI models.
Results:
The mean rFSRP probability was 10.42% (min = 0.50%, max = 95.71%). Higher rFSRP scores corresponded to greater CDR Sum of Boxes (β= 0.02, p = 0.028) and worse performance on: Trail Making Test A (β= 0.05, p < 0.001) and B (β= 0.057, p < 0.001), and Digit Symbol (β= –0.058, p < 0.001). Higher rFSRP scores were associated with increased odds for a greater volume of log-transformed WMH (OR = 1.02 per quartile, p = 0.015). No associations were observed for diagnosis, episodic memory or language test scores, HCV, or TBV.
Conclusion:
These results support the rFSRP as a useful metric to facilitate clinical research on the associations between cerebrovascular disease and cognitive and brain aging.
Keywords
INTRODUCTION
Cardiovascular disease (CVD) and its risk factors (e.g., hypertension, diabetes, obesity) are known determinants of incident cognitive impairment and dementia [1] due to cerebrovascular disease (CBVD), Alzheimer’s disease (AD), and AD related dementias (ADRD) [2–29]. The role of CBVD in the path-ogenesis of AD and ADRD has long been a focus because interventions that improve cardiovascular health may prevent or slow the progression of disease. The extant research has historically examined the neurological sequelae of individual or small clusters of vascular risk factors (VRF) [4, 31]. Focusing on individual VRF seldom captures the full clinical picture [32], as they rarely occur in isolation particularly in older adults. To this end, several aggregate composites have been adopted to facilitate clinical research on the relationship between VRF, CBVD, and dementia [33–36].
The Framingham Stroke Risk Profile (FSRP) was created in 1991 to predict risk of incident stroke using the Framingham Heart Study (FHS) cohort [36]. The FSRP is a composite based on age, systolic blood pressure (SBP), antihypertensive medication use, prevalent or past diabetes mellitus (DM), current smoking status, prevalent CVD, prevalent or past atrial fibrillation (AF), and left ventricular hypertrophy (LVH) determined by an echocardiogram (echo) [36]. The FSRP predicts incident cognitive impairment [37–40] and cognitive decline [37, 39–46]. Due to lack of feasibility associated with echo, studies have often omitted LVH from the FSRP composite. This modified composite has still been shown to be associated with cognitive impairment and decline, including among cognitively normal participants from the National Alzheimer’s Coordinating Center (NACC) Uniform Data Set (UDS) [45]. The VRF comprising the FSRP have been greatly studied and have been shown to confer risk for cognitive decline [1, 47–51]. Furthermore, VRF metrics, including the original FSRP, have been associated with changes in frontal-mediated functions [37, 52–58].
The literature has evolved since the FSRP was created in 1991 and the prevalence of stroke risk factors have changed [35]. The FSRP was updated in 2017, the revised FSRP (rFSRP), to reflect the current literature on the associations between VRF and stroke risk, as well as the decline in age-adjusted stroke incidence [35]. The rFSRP excludes prevalent LVH because it requires an echo for measurement, and it was no longer found to be a determining factor in predicting an individual’s risk of stroke. Dufouil and colleagues used three different cohorts (i.e., FHS, 3C, REGARDS) to validate the rFSRP [35], including showing that it had superior accuracy for predicting stroke compared to the original FSRP.
A recent autopsy study [59] linked mid- and late-life rFSRP scores with CBVD neuropathology among 129 brain donors from the FHS. The same study also found late-life but not mid-life rFSRP scores were associated with increased odds of higher Braak stage [59]. This was among the first studies to examine the effect of the rFSRP on AD and ADRD. However, in vivo studies have not yet examined the correspondence of the rFSRP with cognitive and brain aging outcomes. Here, we leveraged data from the NACC-UDS to examine the ability of the rFSRP to discriminate participants with mild cognitive im-pairment (MCI) and dementia from those with normal cognition (NC). The associations between the rFSRP and neuropsychological test performance and MRI-derived measures of total brain volume (TBV), hippocampal volume (HCV), and white matter hyperintensities (WMH) were investigated at baseline. Based on the research examining the original FSRP and other VRF, we hypothesized that baseline rFSRP scores would be associated with increased odds for MCI and dementia, worse neuropsychological test performance, and increased volume of WMH.
MATERIALS AND METHODS
Participants and procedures
The current sample included participants from the NACC-UDS (Fig. 1). The NACC was establi-shed in 1999 by the National Institute on Aging (NIA) to facilitate research on AD and ADRD. It is a publicly accessible longitudinal database gathered from approximately 30 Alzheimer’s Disease Research Centers (ADRCs) across the U.S. Since 2005, ADRCs have contributed standardized cognitive, behavioral, and functional participant data from approximately annual study visits to a common database, known as the NACC-UDS [52, 60–63]. In 2014, a subset of the ADRCs also began to voluntarily submit structural MRI data [28] to NACC to include with the UDS. All ADRCs that contribute data to NACC are approved by their local Institutional Review Board (IRB) and participants provided informed consent at the ADRC where they completed their study visits. The NACC-UDS has been described elsewhere [52, 60–65].
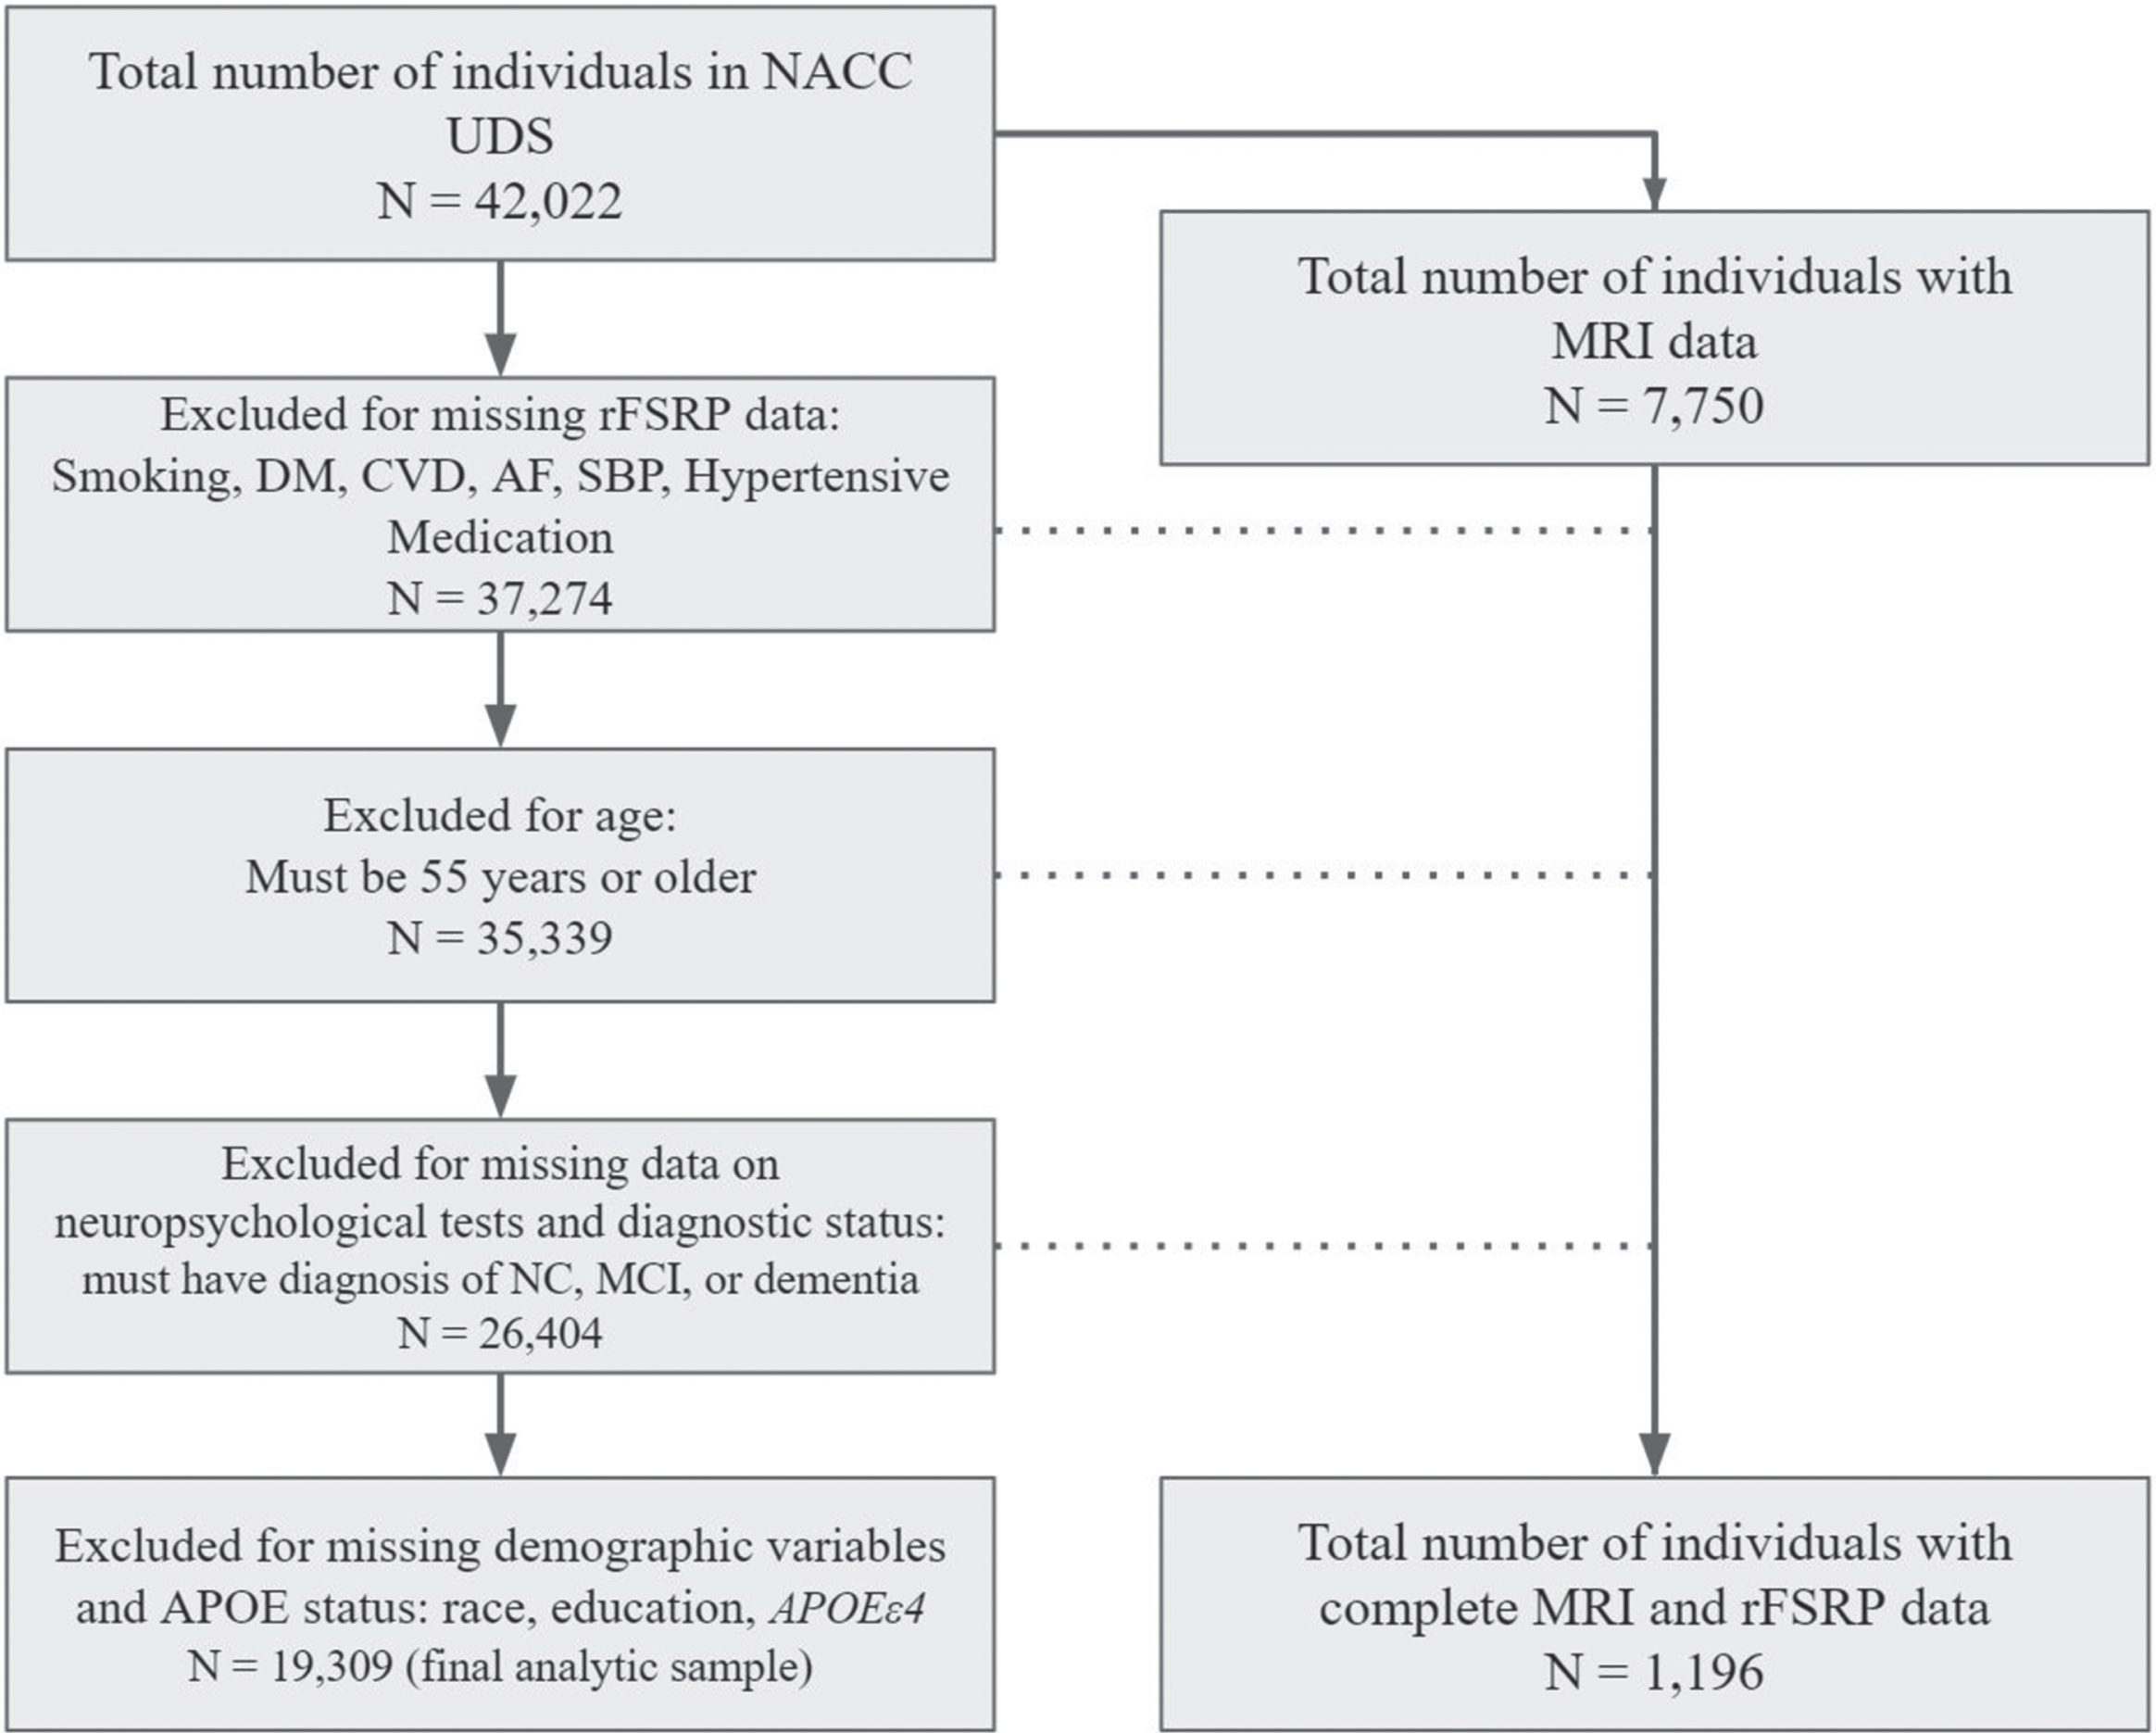
Flow Chart of Sample Derivation. NACC, National Alzheimer’s Coordinating Center; UDS, Uniform Data Set; rFSRP, revised Framingham Stroke Risk Profile; DM, diabetes mellitus; CVD, cardiovascular disease; AF, atrial fibrillation; SBP, systolic blood pressure; NC, normal cognition; MCI, mild cognitive impairment; MRI, magnetic resonance imaging.
For this study, a formal data request was submitted to NACC to obtain UDS data for all participants as of the December 2019 data freeze, resulting in an initial sample of 42,022. This study examined only baseline UDS data. As shown in Fig. 1, the final analytic sample was reduced to 19,309 following exclusion of participants for missing data on the individual items used to compute the rFSRP. Due to the age component of the rFSRP algorithm having a lower age restriction of 55, all participants were 55 years or older at baseline. The sample was also restricted to participants who had complete data across all primary independent and dependent outcomes. Participants who were diagnosed with “cognitively impaired, not MCI” (n = 1,058, after exclusion for the above) were excluded due to the lack of stability of and diverse reasons for this diagnosis (sensitivity analyses were performed to determine if their inclusion affected the results). Those excluded from the analytic dataset were younger (mean difference = 2.13, p < 0.001), had more years of education (mean difference = 0.52, p < 0.001), were less likely to identify as White (78.3% versus 84.1%, p < 0.001), and were more likely to have an APOE ɛ4 allele (42.4% versus 39.7%, p < 0.001). There were no differences in terms of sex (p > 0.05).
As of the December 2019 data freeze, 7,750 individuals had MRI scans submitted to NACC. How-ever, the MRI sample for the present sample included 1,196 participants. This MRI sample represents the participants from NACC-UDS who had complete baseline quantitated MRI values and who met the above-described inclusion/exclusion criteria.
Measures
Revised framingham stroke risk profile
Baseline data were used to calculate the rFSRP for each participant. The rFSRP estimates 10-year pro-bability of incident stroke that is expressed as a percent in this study. The primary components of the rFSRP include: age, sex, SBP, current smoking status, prevalent CVD, prevalent or past AF, prevalent or past DM, and antihypertensive medication use (HRX). The rFSRP value for each participant was calculated using the formula described in Fig. 4 of Dufouil and colleagues’ study [35]. The equation is stratified by sex and calculated as follows:
Male: FSRP (t) = 1 - Sb (t) exp(L-M), where t =10, Sb(10) = 0.94451 (the baseline survival at time t), M = 4.4227101 (L evaluated at the mean of all the covariates), and L is the linear combination: L =0.49716 * (Age/10) + 0.47254 [if smoker] + 0.45341 [if CVD] + 0.08064 [if AF] + 0.45426 [if Age ≥65]+ 1.35304 [if Age < 65 and DM] + 0.34385 [if Age ≥65 and DM] + 0.82598 [if antihypertensive medication used HRX] + (0.27323 * (SBP–120)/10) [if no HRX] + (0.09793 * (SBP–120)/10) [if HRX].
Female: FSRP (t) = 1 - Sb (t) exp(L-M), where t =10, Sb(10) = 0.95911, M = 6.6170719, and L is the linear combination: L = 0.87938 * (Age/10) + 0.51127 [if smoker] –0.03035 [if CVD] + 1.20720 [if AF] +0.39796 [if Age ≥65] + 1.07111 [if Age < 65 and DM] + 0.06565 [if Age ≥65 and DM] + 0.13085 [if HRX] + (0.11303 * (SBP–120)/10) [if no HRX] +(0.17234 * (SBP–120)/10) [if HRX].
The following NACC-UDS variables defined each of the components of the rFSRP and were fitted into the above equations: NACCAGEB for age at baseline; TOBAC30 defined current cigarette smoking status and refers to history of smoking within the last 30 days (yes/no); recent or active CVHATT (heart attack/cardiac arrest), CVCHF (congestive heart failure [CHF]), CVOTHR (other CVD) were used to define prevalent CVD (absent/present) and code for heart attack, congestive heart failure (CHF), and other cardiovascular events, respectively; CVAFIB represents past or present AF and defined prevalent and past AF (absent/present); NACCAHTN and NACCHTNC refer to antihypertensive or blood pressure medication and antihypertensive combination therapy, respectively, and these operationalized current antihypertensive medication use (yes/no); BPSYS for SBP; and DIABETES refers to past or present DM and defined prevalent and past DM (absent/present). SBP was measured at the local ADRCs using a sphygmomanometer and all of the other rFSRP components were reported by the participant. The FHS defines CVD for rFSRP as the presence of coronary artery disease (CAD), CHF, or peripheral vascular disease at baseline visit [35]. It is important to note that CAD is not directly assessed as a specific variable of NACC. Furthermore, angina was not included because this data was only available for UDS version 3.0 participants.
Cognitive diagnoses and severity of impairment
The sample included participants who had clinical research diagnoses of NC, MCI, or dementia using established criteria [66–69]. Diagnostic methods for NACC vary across the ADRCs and can include single clinician diagnosis or consensus diagnosis made by a multidisciplinary panel of clinicians. In this sam-ple, 4,137 participants were diagnosed by a single clinician, 14,765 participants via a consensus conference, and other diagnostic procedures were done for 407 participants (e.g., two or more clinicians, informal group). All diagnoses were based on available UDS data, including neuropsychological, neurological, and neuropsychiatric test results, and, when avail-able, neuroimaging. Sum of Boxes from the CDR® Dementia Staging Instrument assessed overall severity of clinical impairment [70, 71].
Neuropsychological measures
The NACC-UDS standardized battery of neuropsychological measures has been described elsewhere [60–62, 65]. The following measures were examined in this study: Mini-Mental State Examination (MMSE), Logical Memory (LM) Immediate and Delayed Recall, Trail Making Test (TMT) Parts A and B, Digit Span Forward (DSF), Digit Span Backward (DSB), Wechsler Adult Intelligence Scale, Revised Version (WAIS-R) Digit Symbol, Semantic Fluency (summary composite of Animal and Vegetable Fluency), and the Boston Naming Test (BNT). Lower scores reflect worse performance for all tests, with the exception of TMT A and B where lower scores are better.
There are three versions of the NACC-UDS with the most recent version (3.0) released in March 2015. Of the 19,309 participants, 7,740 were administered UDS version 1.0, 9,013 were administered UDS version 2.0, and 2,556 were administered UDS version 3.0. For UDS version 3.0, a new neuropsychological test battery was adopted and a subset of UDS version 1.0 and 2.0 instruments were replaced with conceptually similar but non-proprietary tests. As it pertains to the above listed measures, the MMSE was replaced with the Montreal Cognitive Assessment (MoCA); LM was replaced with Craft Story Delayed Recall (Paraphrase); DSB with Number Span Test; and the BNT with the Multilingual Naming Test (MINT). The remaining tests overlap across the UDS versions with the exception of the WAIS-R Digit Symbol which was not replaced in UDS version 3.0. The Neuropsychology Work Group of the ADCs’ Clinical Task Force conducted a Crosswalk Study [72] and used equipercentile equating methods to convert scores on UDS version 3.0 tests to comparable scores on the respective UDS version 2.0 test that was replaced (e.g., imputation of MMSE scores based on MoCA scores). To maximize the sample size and available data, conversion scores for the MMSE, LM, DSB, and BNT were used for those participants who were administered the UDS version 3.0 battery at baseline. Sensitivity analyses were conducted to test whether the conversion scores had a differential effect on the results. As mentioned, WAIS-R Digit Symbol was only administered in UDS versions 1.0 and 2.0 and the analytic sample size for this test was reduced to 16,447.
Magnetic resonance imaging
Baseline MRI data (or MRI data closest to baseline visit) were examined. Volumetric MRI quanti-tation for NACC was conducted by the Imaging of Dementia & Aging (IDeA) Lab at the University of California Davis (Director: Charles DeCarli, M.D.; http://idealab.ucdavis.edu/). Total volume of WMH (in cm3) was calculated using T2 FLAIR scan files. Methods for WMH estimation were similar to those used for the ADNI-II [73]; a full description of methods can be found at https://www.alz.washington.edu/WEB/adni_proto.pdf and are described elsewhere [28, 52]. Using T1-weighted scans, TBV and HCV (a summary composite of the right and left hemispheres) were calculated. The TBV composite was calculated as the sum of total gray and white matter segmentations. WMH, TBV, and hippocampal volume were a priori selected as outcomes due to previous investigations showing their association with VRF [47, 74–76]. Estimated intracranial volume (eICV) was included as a covariate to account for differences in head size.
Demographic, medical, and APOE data
Demographic and medical characteristics were ascertained during individuals’ baseline UDS clinical evaluation. Blood samples were collected by the individual ADRCs to determine APOE ɛ4 allele status.
Statistical analyses
The rFSRP served as the primary continuous independent variable. Outcome variables included diagnostic status (NC, MCI, or dementia), CDR Sum of Boxes, neuropsychological test raw scores, in addition to TBV, HCV, and WMH for the subset who had available baseline quantitated MRI data. Diagnostic status was examined as two binary variables (i.e., NC versus MCI; NC versus dementia). The re-maining outcomes were continuous. The distribution of data for WMH was positively skewed and this variable was log-transformed; TBV and HCV were normally distributed. Log-transformed WMH, TBV, and HCV were examined as continuous variables and categorized into quartiles due to potential non-linear relationships [77, 78].
Binary logistic regressions were first performed to examine the association between the rFSRP and odds for having MCI and dementia (participants with NC served as the reference group). Receiver operating curves (ROC) were plotted and Area Under the Curve (AUC) statistic evaluated the accuracy of the rFSRP to discriminate between participants with MCI and dementia from those with NC. The ROC curves were conducted with and without the predicted probabilities from the logistic regression that account for model covariates (described below) to determine the independent ability of the rFSRP to discriminate groups. Multivariable linear regression analyses were used to test the association between the rFSRP and the CDR Sum of Boxes, each neuropsychological test score, as well as TBV, HCV, and log-transformed WMH. Ordinal logistic regression evaluated the association between the rFSRP and quartile ranking of TBV, HCV, and log-transformed WMH. A separate model was performed for each outcome and each model included the following covariates: age (age at MRI for MRI-derived structural indices), sex (0 = male, 1 = female), years of education, racial identity (1 = White, 0 = other), APOE ɛ4 allele status (0 = absence, 1 = heterozygote, 2 = homozygote), as well as eICV for models that examined MRI-derived indices as outcomes. Statistical significance was defined as a p-value <0.05. p-values for neuropsychological test models were False Discovery Rate (FDR)-adjusted due to the number of analyses for this domain (i.e., 10 neuropsychological test scores). Post-hoc analyses tested for an rFSRP×diagnosis in-teraction effect. For the neuropsychological test scores and MRI-derived indices that demonstrated a statistically significant association, the above models were repeated stratified by diagnosis (i.e., NC, MCI, and dementia). A final sensitivity analysis included suspected etiology (i.e., AD yes/no) as a covariate.
For statistically significant effects, post-hoc binary logistic and/or linear regression models were rep-eated with each item that comprises the rFSRP entered as an individual predictor. Sex was included in the model because the rFSRP equation is stratified by sex. The previously stated covariates not part of the rFSRP were also included in the models.
RESULTS
Sample demographic, medical, and neuropsychological characteristics are presented in Tables 1–3. The sample had an average 10-year probability of stroke (rFSRP) of 10.42% (SD = 9.42, median = 7.98, range = 0.50–95.71). Older age (r = 0.71, p < 0.001), fewer years of education (r = –0.11, p < 0.001), and being male (mean difference = 0.77, p < 0.001) were associated with higher rFSRP scores. Those who identified as White had slightly but statistically significant higher rFSRP scores (mean difference = 0.41, p = 0.02) compared to all other racial groups (i.e., Black, American Indian or Alaska Native, Native Hawaiian or other Pacific Islander, Asian, and other). To clarify this racial effect, analysis of variance (ANOVA) showed statistically significant difference between White and non-Black race (mean difference = 1.08, p = 0.01). There were no statistically sig-nificant racial identity differences between Black and White race, or between Black and other racial identity groups on rFSRP scores (ps > 0.05). ANOVA showed that rFSRP scores decreased with increasing ɛ4 allele presence (p < 0.001): ɛ4 absence (n =11,650), mean = 11.00 (SD = 10.00); heterozygotes (n = 6,389), mean = 9.92 (SD = 8.62); homozygotes (n = 1,270), mean = 7.65 (SD = 6.70).
Sample Characteristics
*Analysis of variance was used to compare the diagnostic groups on continuous outcomes, including age, years of education, systolic blood pressure, and the rFSRP. Chi-squared test was used for all other outcomes. **There are no statistically significant group differences on the rFSRP after controlling for age, sex, racial identity, and APOE ɛ4 allele status. MCI, mild cognitive impairment; NC, normal cognition; APOE, apolipoprotein E; rFSRP, revised Framingham Stroke Risk Profile; SD, standard deviation.
Revised FSRP Characteristics by Sex
Analysis of variance was used to compare the diagnostic groups on continuous outcomes, including age, years of education, systolic blood pressure, and the rFSRP. Chi-squared test was used for all other outcomes. rFSRP, revised Framingham Stroke Risk Profile; SD, standard deviation.
Neuropsychological and Magnetic Resonance Imaging Summary Statistics
*Analysis of variance compared the diagnostic groups on the neuropsychological test scores, CDR Sum of Boxes, and the MRI-derived structural indices. There were statistically significant differences between each of the diagnostic groups across all variables (i.e., normal cognition > MCI > dementia), with the exception of no statistically significant difference between MCI and dementia for total brain volume and log-transformed white matter hyperintensities. **Of the 19,309 participants, 7,740 were administered Uniform Data Set (UDS) version 1.0., 9,013 were administered version 2.0, and 2,556 were administered version 3.0. For UDS version 3.0, a new neuropsychological test battery was adopted and a subset of instruments were replaced with similar but non-proprietary tests. Equipercentile equating methods were used to convert scores on UDS version 3.0 tests to comparable scores on the respective UDS version 2.0 test that was replaced. To maximize the sample size and available data, the conversion scores for the MMSE, Logical Memory, Digit Span Forward and Backward, and Boston Naming Test were used for those participants who were administered the UDS version 3.0 battery. Refer to the Methods section under Neuropsychological Measures for further details. Sample size for MRI indices was 1,196. MCI, mild cognitive impairment; WAIS-R, Wechsler Adult Intelligence Scale, Revised Version; CDR, CDR Dementia Staging Instrument; MRI, magnetic resonance imaging; SD, standard deviation.
rFSRP and diagnostic status and severity of functional impairment
Of the sample, 9,697 (50.2%) had NC, 4,705 (24.4%) were diagnosed with MCI, and 4,907 (25.4%) were diagnosed with dementia. Binary logi-stic regressions showed that the rFSRP was not associated with increased odds for having MCI (OR = 1.003, 95% CI = 0.997–1.01, p = 0.30) or dem-entia (OR = 1.002, 95% CI = 0.996–1.01, p = 0.53). The rFSRP poorly discriminated participants with MCI (AUC = 0.58) and dementia (AUC = 0.58) from those with NC. When the demographic and APOE covariates were included, model accuracy for discriminating participants with MCI (AUC = 0.66) and dementia (AUC = 0.72) from NC improved.
Linear regression showed that higher scores on the rFSRP corresponded to greater CDR Sum of Boxes (standardized beta = 0.02, p = 0.028). For every 10 percentage point increase in 10-year stroke risk, the CDR Sum of Boxes increased by 0.1 points (95% CI = 0.01–0.1).
rFSRP and neuropsychological test scores
The multivariable linear regression models are summarized in Table 4. Higher scores on the rFSRP corresponded to worse test performance on the following neuropsychological tests, in order of effect size magnitude (based on standardized beta coeffi-cients): WAIS-R Digit Symbol (standardized beta= –0.058, p < 0.001), TMTB (standardized beta =0.057, p < 0.001), and TMTA (standardized beta = 0.05, p < 0.001). Based on the unstandardized beta coefficients, for every 1 percentage point in-crease in 10-year stroke risk, the WAIS-R Digit Symbol decreased by 0.09 correct items; and time on TMT A and B increased by 0.14 and 0.51 s, respectively. There were no statistically significant associations between the rFSRP and the MMSE, DSF, DSB (trend, p = 0.09), LM Immediate or Del-ayed Recall, Semantic Fluency, or the BNT (ps > 0.10). Figure 2 displays bar graphs of the statistically significant associations between the rFSRP, and neu-ropsychological test scores and CDR Sum of Boxes. We graphically displayed the associations with the rFSRP categorized into tertiles due to its skewed distribution. Examination of rFSRP categorized into tertiles did not affect statistical significance of results (data not shown).
Associations Between rFSRP and Neuropsychological Test Scores and MRI-Derived Indices: Summary of Regression Results
The rFSRP estimates 10-year probability of incident stroke expressed as a percent. Multivariable linear regression examined the effect of the rFSRP on the CDR Sum of Boxes and each neuropsychological test score, whereas ordinal logistic regression tested the effect of the rFSRP on quartile rankings of the MRI indices. Covariates included in the models were age at baseline, sex (1 = female, 0 = male), racial identity (1 = White, 0 = other), years of education, and APOE ɛ4 allele status (0 = absent, 1 = homozygotes, 2 = heterozygotes). For MRI indices, estimated intracranial volume and age at MRI (as opposed to age at baseline) were included as covariates. Note that no statistically significant effects were found for log-white matter hyperintensities when examined as a continuous variable. P-values for analyses examining neuropsychological test scores are False Discovery Rate (FDR)-adjusted due to the number of analyses performed for this domain (i.e., 10 neuropsychological test scores). Sample size for the CDR and neuropsychological tests was 19,309 with the exception of the WAIS-R Digit Symbol for which the sample was reduced to 16,447 due to missing data. Sample size for MRI indices was 1,196. Higher scores are worse for CDR Sum of Boxes, Trail Making Test Part A, Trail Making Test Part B, and volume of log-white matter hyperintensities. Lower scores are worse for all other outcomes. β, standardized beta; b, unstandardized beta; MRI, magnetic resonance imaging; CDR, CDR Dementia Staging Instrument; WAIS-R, Wechsler Adult Intelligence Scale, Revised version.

Bar Graphs of the Unadjusted Associations Between the rFSRP, Neuropsychological Test Performance, and Functioning. Sample size for Trail Making Test A and B and CDR Sum of Boxes is 19,309, which is reduced to 16,447 for Digit Symbol due to missing data. Whiskers represent 95% confidence intervals. Higher scores on the y-axis are worse for all outcomes with the exception of the Digit Symbol test (middle). Multivariable linear regressions showed all associations displayed are statistically significant (ps < 0.05) after controlling for age, sex, years of education, racial identity, and APOE ɛ4 allele status. Note that the primary models examined the rFSRP as a continuous variable. We graphically displayed associations with the rFSRP categorized into tertiles because of its skewed distribution. Examination of rFSRP categorized into tertiles did not affect statistical significance of results.
When stratified by diagnosis (i.e., NC, MCI, and dementia), the effects of the rFSRP on WAIS-R Digit Symbol, TMT A and B were strongest in those with NC (Digit Symbol: standardized beta =–0.07, p < 0.001; TMTA: standardized beta = 0.08, p < 0.001; TMTB: standardized beta = 0.09, p < 0.001) and MCI (Digit Symbol: standardized beta =–0.08, p < 0.001; TMTA: standardized beta = 0.06, p < 0.001; TMTB: standardized beta = 0.06, p =0.002) compared to dementia (Digit Symbol: standardized beta = –0.03, p = 0.18; TMTA: standardized beta = 0.03, p = 0.21; TMTB: standardized beta = 0.05, p = 0.01).
Among those with MCI and dementia, the suspected etiology was AD for 64.3% (n = 6,178) of the sample, with a range of other etiologies for the non-AD participants (n = 297 [3.1%] for vascular). The statistically significant effects of the rFSRP on neuropsychological test scores remained after controlling for AD as the primary etiology (ps < 0.05 for all).
rFSRP and MRI-derived indices
The mean interval (age at MRI –age at baseline visit) between baseline visit and MRI was 0.27 (SD = 1.84) months. The mean rFSRP of the MRI sample was 11.21 (SD = 9.88, range = 0.56–88.16, median = 8.71). Ordinal logistic regression showed that higher rFSRP scores were associated with in-creased odds for more severe volume of log-trans-formed WMH (OR = 1.02 per quartile, 95% CI =-1.004–1.04, p = 0.015) (Fig. 3). When examining the association between the rFSRP and log-transformed WMH stratified by diagnostic group (NC, MCI, dementia), there was a statistically significant effect in participants with dementia (OR = 1.07 per quartile, 95% CI = 1.02–1.13, p = 0.013), but not in those with NC (OR = 1.01, 95% CI = 0.88–1.03, p = 0.41) or MCI (OR = 1.02, 95% CI = 0.99–1.05, p = 0.12). In the MRI sample of individuals with MCI and dementia, the suspected etiology was AD for 66.1% (n = 335) and vascular for 9.5% (n = 48). The statistically significant effects remained after controlling for AD as the primary etiology (p < 0.05).
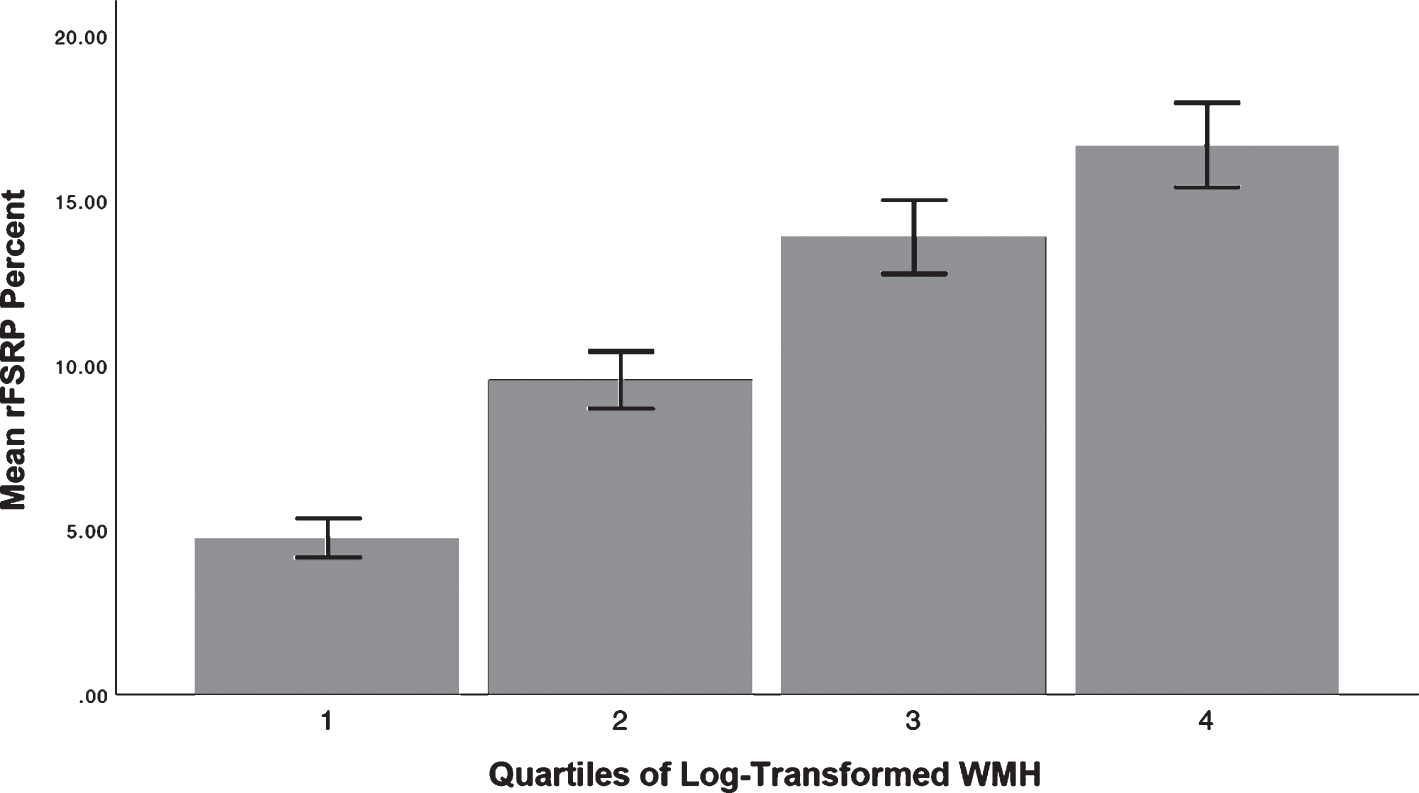
Bar Graph of the Unadjusted Associations Between the rFSRP and Quartile Ranking of Log-Transformed Volume of White Matter Hyperintensities (N = 1,196). Whiskers represent 95% confidence intervals. Ordinal logistic regression showed that higher rFSRP scores were associated with increased odds for more severe volume of log-transformed WMH (OR = 1.02 per quartile, 95% CI = 1.004–1.04, p = 0.015) after controlling for age at MRI, sex, years of education, racial identity, APOE ɛ4 allele status, and estimated intracranial volume. There was no statistically significant association between the rFSRP and log-transformed WMH when examined as a continuous variable.
Multivariable linear regression showed no stati-stically significant association between the rFSRP and log-transformed WMH (continuous). The ordinal and multivariable linear regressions showed no statistically significant association between the rFSRP and TBV or HCV (ps > 0.05).
Item-level post-hoc analysis of the rFSRP
For each outcome the rFSRP demonstrated a statistically significant association with (i.e., WAIS-R Digit Symbol, TMTA, TMTB, CDR Sum of Boxes, and log-transformed WMH), we conducted a multivariable linear regression analysis with each of the rFSRP individual components entered into the model. Results of these models are summarized in Table 5. For neuropsychological test scores, older age, identifying as male, prevalent or past DM, and current cigarette smoking status demonstrated statistically significant associations for all three neuropsychological tests. Higher SBP also had a statistically significant effect for two of the three neuropsychological test scores. Prevalent CVD demonstrated no statistically significant effect for any of the test scores. For CDR Sum of Boxes, prevalent or past AF and SBP were the only items that did not have a statistically significant association.
Item-Level Analysis of the rFSRP
Multivariable linear regression examined the effect of the rFSRP items on TMTA, TMTB, Digit Symbol, and the CDR Sum of Boxes. Ordinal logistic regression tested the effect of the rFSRP items on quartile rankings of Log-WMH. Covariates included in the model were years of education, racial identity, and APOE ɛ4. For models that examined log-transformed WMH (categorized into quartiles), age at MRI (as opposed to age at baseline) and estimated intracranial volume were also included. Higher scores are worse for TMTA, TMTB, CDR Sum of Boxes, and WMH; lower scores are worse for WAIS-R Digit Symbol. For sex, 1 = female and 0 = male; and 1 = present and 0 = absent for current cigarette smoking status, prevalent cardiovascular disease, atrial fibrillation, antihypertensive medication use, and diabetes. Sample size for the neuropsychological tests and CDR Sum of Boxes was 19,309 with the exception of the WAIS-R Digit Symbol for which the sample was reduced to 16,447 due to missing data. Sample size for MRI indices was 1,196. β, standardized beta; b, unstandardized beta; OR, odds ratio; TMTA, Trail Making Test Part A; TMTB, Trail Making Test Part B; CDR, CDR Dementia Staging Instrument; CVD, prevalent cardiovascular disease defined by recent or active heart attack, congestive heart failure, and other cardiovascular events; AF, prevalent or past atrial fibrillation; SBP, systolic blood pressure; antihypertensive, current antihypertensive medication use defined by antihypertensive or blood pressure medication and antihypertensive combination therapy; DM, prevalent or past diabetes mellitus.
For log-transformed WMH (categorized into quartiles), older age at baseline, current smoking status, antihypertensive medication use, SBP, and prevalent or past DM emerged as the statistically significant contributors for having more severe WMH.
Sensitivity analyses
Participants diagnosed with cognitively impaired, not MCI (n = 1,058) were excluded from the sample. All main effects for the rFSRP remained similar when this group was included. The magnitude of effects for the neuropsychological test scores remained when the sample was limited to those who completed UDS version 1.0 and 2.0 tests; i.e., the UDS conversion scores to impute UDS version 3.0 test to UDS version 2.0 tests were not used (data not shown).
DISCUSSION
Among 19,309 participants from the NACC-UDS, higher baseline rFSRP scores were associated with decreased performance on neuropsychological measures of psychomotor speed, working memory, and executive functioning, as well as increased severity of functional difficulties. Higher rFSRP scores additionally corresponded to greater severity of cerebral small vessel disease as measured by quartile rankings of WMH from FLAIR MRI. Individual item level analysis of the rFSRP showed that older age, male sex, history of diabetes, and smoking status were among the most significant/consistent drivers of the aforementioned effects. rFSRP scores were not associated with diagnostic status, baseline neuropsychological test performance on measures of episodic memory or language, or TBV and HCV. All effects were independent of age, sex, racial identity, years of education, and APOE ɛ4 allele status. Despite the lack of association with diagnostic status, these results provide support for the rFSRP as a useful metric to facilitate clinical research on the association between CBVD and cognitive and brain aging.
The observed associations between the rFSRP and psychomotor speed, working memory, and executive functioning are consistent with the literature linking VRF metrics, including the original FSRP, with changes in frontal-mediated functions [37, 52–58]. The classical neuropsychological profile of CBVD involves disruptions to frontal-subcortical circuitry neural networks and an associated dysexecutive syndrome [79]. Previous studies have reported associations between higher scores on the original FSRP and learning and memory [38, 81] and sem-antic fluency [37, 44] that were not observed in the current study. Those studies have often utilized a list learning (not available through NACC) rather than a story learning memory task [38, 81] that was used in this study. List learning tasks are more sensitive to episodic memory impairments, particularly those that are executive-based due to difficulties with learning and encoding [82, 83], an expected memory profile in the setting of CBVD.
Older age and male sex were significant rFSRP correlates of neuropsychological test performance. This is consistent with previous studies of the origi-nal FSRP [37, 80]. Results from a study that examined the original FSRP and cognitive decline in 2,975 cognitively normal older adults from the NACC data set found age to the be strongest predictor of cognitive decline among the FSRP components [45]. In this sample of NACC participants with and without cognitive impairment, cigarette smoking, history of diabetes, and higher SBP also contributed to the prediction of cognitive function. Numerous studies have found the aforementioned VRF and others to confer risk for cognitive decline [1, 47–51], with different risk effects across studies and at different stages of life (e.g., midlife versus late-life) [12, 78]. Notably, in the Whitehall II cohort, DM was the only component of the original FSRP to be independently associated with accelerated cognitive decline [41]. The effects of the different VRF likely depend on the population sampled. Regardless, this study and others emphasize the importance of aggregate composites of demographic and VRF variables as opposed to isolated focus on any one risk factor.
Higher baseline rFSRP scores were associated with increased odds for a greater volume of WMH, but not with TBV or HCV. Cerebral small vessel disease as measured by WMH is a common pathology associated with VRF. Here, older age at baseline, current smoking status, antihypertensive medication use, SBP, and prevalent or past DM were significant correlates of WMH. Our results are consistent with previous studies that have reported increased scores on VRF metrics, including the original FSRP, associated with both progression [80] and increased burden of WMH [74, 85]. This finding is particularly important because WMH predict accelerated cognitive, functional, and neuropsychiatric decline [52]. The association between the rFSRP and WMH was no longer statistically significant when WMH was treated as a continuous variable. This pattern of findings suggests the possible presence of a non-linear relationship between the rFSRP and WMH. Nevertheless, the results support the ability of the rFSRP to discriminate between those with severe vs mild cerebral small vessel disease. It will be important for future studies to test the correspondence between rFSRP and other metrics of cerebrovascular disease not available for this study (e.g., microbleeds, lacunes, etc.).
The rFSRP poorly discriminated between participants with MCI and dementia from those with NC. In contrast, higher rFSRP scores were associated with greater severity of functional difficulties as measured by the CDR Sum of Boxes. The effect size for this association was small; however, for every 10% increased risk for stroke, the CDR Sum of Boxes score increased by 0.1 points. The magnitude of effects for the association between the rFSRP and the neuropsychological test scores and WMH were also small. Although the clinical meaningfulness of the observed findings is thus unclear, the rFSRP might be sensitive to subtle cognitive changes. Interestingly, the neuropsychological effects of the rFSRP were strongest in those with NC or MCI. This may partially be related to greater variability in scores compared to the large subgroups of participants with dementia who performed at floor. In contrast, however, the effects of the rFSRP on WMH were strongest for participants with dementia.
To our knowledge, this study is among the first to investigate associations between the rFSRP and cognitive function, functional difficulties, and MRI biomarkers of atrophy and small vessel disease in a large sample of older adults with and without cognitive impairment. Since VRF are modifiable, it is of high priority to study their unique role in the pathogenesis of dementia and this requires validated metrics. The original FSRP is useful for predicting cognitive and brain-based outcomes [36–46]. However, it is outdated and impractical as it requires an echo to determine LVH and researchers often use a modified version of this index. We were unable to compare the rFSRP and original FSRP in NACC because data on LVH are not available. The rFSRP excludes prevalent LVH and also reflects the current literature on the associations between VRF and stroke risk, which has evolved since the original FSRP was created [35]. The current study also did not include other metrics for comparison such as the American Heart Association Life’s Simple 7, Cardiovascular Risk Factors, Aging, and Incidence of Dementia (CAIDE) risk score, or the Framingham General Cardiovascular Risk Score. The data to compute these composites without modification are not available in the NACC-UDS, particularly in terms of physical activity, diet, and blood measurements of HDL and LDL levels. It will be imperative to establish the comparative accuracy of the rFSRP to other metrics of VRF in the prediction of cognitive and brain-based outcomes.
There are several other limitations to the current study. NACC data is derived from convenience samples, mostly representative of a clinic-based population. The participants and selection of participants are further different across the ADRCs that contribute data to NACC, including some centers that exclude participants based on vascular disease (e.g., stroke). There is also variability across ADRCs in the methods used to adjudicate clinical research diagnoses. The present findings need to be examined and externally validated in population-based cohorts, including the FHS study. As alluded to earlier, it is unlikely one metric will be applicable to all populations of interest. By example, the average 10-year probability of stroke was 10.42% in this sample of participants with and without cognitive impairment who had a mean age of approximately 73. In contrast, the average mid- and late-life 10-year probability of stroke (based on the rFSRP) was approximately 1 and 20, respectively, among 129 brain donors from the FHS [59]. Furthermore, there is a lack of diversity in this sample as the majority of the sample included individuals who identify as white. Another limitation to this study is the cross-sectional analyses. Understanding how rFSRP predicts decline and neuropsychological outcomes in the future would be of value to assess the validity of the model in its entirety.
An additional limitation of the study are subtle differences between how variables were defined to compute the rFSRP scale. CVD for the rFSRP was defined in the FHS as the presence of CAD, CHF, or peripheral vascular disease at baseline visit [35]. However, the NACC-UDS has no separate variable to assess for the presence of CAD or peripheral vascular disease. As such, in addition to heart attack and congestive heart failure, we included “other car-diovascular events.” This variable broadened our definition of CVD to include conditions, such as arrhythmias and angina, in addition to the originally intended conditions. It may have also captured non- or loosely-related CVD conditions, potentially resulting in misclassification. All components of the rFSRP with the exception of SBP were self-reported further increasing risk for misclassification.
Conclusions
The rFSRP was associated with neuropsychological test performance on measures of psychomotor speed, working memory, and executive function; functional difficulties; and cerebral small vessel disease as measured by WMH on FLAIR MRI. The results provide support for the rFSRP as a useful and pragmatic metric for studying the association between VRF and cognitive and brain aging. This study provides continued support for VRF as potentially modifiable targets for intervention and prevention of cognitive decline.
Footnotes
ACKNOWLEDGMENTS
This work was supported by grants from the NIH (P30AG13846; U01NS093334, K23NS102399; K23AG046377; RF1AG05416). Dr. Aparicio is supported by funds from the NIA (R01AG054076-02S1 and the Alzheimer’s Association (AARGD-20-685362). This publication was supported by the Nat-ional Center for Advancing Translational Sciences, National Institutes of Health, through BU-CTSI Grant Number 1UL1TR001430. This publication is also supported by the Undergraduate Research Opportunities Program (UROP) at Boston University. The content is solely the responsibility of the authors. There is no sponsor.
G019610 (PI Eric Reiman, MD), P30 AG013846 (PI Neil Kowall, MD), P30 AG062428-01 (PI Ja-mes Leverenz, MD) P50 AG008702 (PI Scott Small, MD), P50 AG025688 (PI Allan Levey, MD, PhD), P50 AG047266 (PI Todd Golde, MD, PhD), P30 AG010133 (PI Andrew Saykin, PsyD), P50 AG005146 (PI Marilyn Albert, PhD), P30 AG062421-01 (PI Bradley Hyman, MD, PhD), P30 AG062422-01 (PI Ronald Petersen, MD, PhD), P50 AG005138 (PI Mary Sano, PhD), P30 AG008051 (PI Thomas Wisniewski, MD), P30 AG013854 (PI Robert Vassar, PhD), P30 AG008017 (PI Jeffrey Kaye, MD), P30 AG010161 (PI David Bennett, MD), P50 AG047366 (PI Victor Henderson, MD, MS), P30 AG010129 (PI Charles DeCarli, MD), P50 AG016573 (PI Frank LaFerla, PhD), P30 AG062429-01(PI James Brewer, MD, PhD), P50 AG023501 (PI Bruce Mil-ler, MD), P30 AG035982 (PI Russell Swerdlow, MD), P30 AG028383 (PI Linda Van Eldik, PhD), P30 AG053760 (PI Henry Paulson, MD, PhD), P30 AG010124 (PI John Trojanowski, MD, PhD), P50 AG005133 (PI Oscar Lopez, MD), P50 AG005142 (PI Helena Chui, MD), P30 AG012300 (PI Roger Rosenberg, MD), P30 AG049638 (PI Suzanne Craft, PhD), P50 AG005136 (PI Thomas Grabowski, MD), P30 AG062715-01 (PI Sanjay Asthana, MD, FRCP), P50 AG005681 (PI John Morris, MD), P50 AG047270 (PI Stephen Strittmatter, MD, PhD).