
Abstract
Background:
Previous studies have demonstrated that hippocampal atrophy is a hallmark of dementia and can be used to predict the outcome of post-stroke demented (PSD) patients. The hippocampus consists of several subfields but their involvement in the pathophysiology of the PSD remains unclear.
Objective:
The present study aimed to investigate volumetric alterations of hippocampal subfields in patients with PSD.
Methods:
High-resolution T1-weighted images were collected from 27 PSD and 28 post-stroke nondemented (PSND) patients who recovered from ischemic stroke, and 17 age-matched normal control (NC). We estimated the volumes of the hippocampal subfields using FreeSurfer 6.0 which segmented the hippocampus into 12 subfields in each hemisphere. The volumetric differences between the groups were evaluated by the two-sample tests after regressing out the age, sex, education, and total intracranial volume.
Results:
Compared with NC group, PSD group showed smaller volumes in the entire hippocampus and its subfields, and such differences were not found in PSND group. Moreover, we found the dementia-specific atrophy in the left granule cell layer of dentate gyrus (GC-DG) and CA4 in the PSD patients compared with NC and PSND. Regression analysis showed positive correlations between the changes of cognitive performance and the asymmetry index in the CA3/4 and GC-DG of the PSD group. Furthermore, we found that the volumes of hippocampal subfields provided a better classification performance than the entire hippocampus.
Conclusion:
Our findings suggest that the hippocampus is reduced in the PSD patients and it presents a selective subfield involvement.
INTRODUCTION
Many survivors suffer from residual physical, cognitive deficits, or behavioral impairments after stroke [1]. Dementia is one of the common neurological complications after stroke and may affect up to one third of the survivors [2]. A systematic meta-analysis reported that 10%of the patients developed dementia soon after the first stroke and the incidence of dementia could rise to more than 30%after recurrent stroke [3]. Community-based studies showed that the prevalence of dementia in stroke patients was about 30%and the incidence of new onset dementia following stroke increased from 7%after 1 year to 48%after 25 years [4]. Therefore, understanding the pathophysiological mechanisms underlying the dementia after stroke is important for developing therapeutic intervention to improve the quality of life of these patients.
Hippocampus plays a critical role in memory acquisition, consolidation, and retrieval, and is typically disrupted in dementia disorders with an important characteristic of memory deficit [5, 6]. Multiple evidence have demonstrated that hippocampus is a hallmark of dementia, and its atrophy has been consistently reported in many subtypes of dementia, such as Alzheimer’s disease (AD) [7], frontotemporal dementia [8], Lewy body dementia [9], and vascular dementia [10]. Additionally, hippocampal atrophy has been found to be a strong predictor for post-stroke demented (PSD) outcome [2]. Recently, a pathological study found that PSD patients did not show AD-related pathology in the hippocampus, and the non-AD neurodegenerative and/or other non-neurodegenerative substrates may play more dominant roles in dementia after stroke [11]. Another postmortem study with 3-dimensional stereological analysis found neuronal atrophy and loss of hippocampal tissues in PSD patients [12]. However, neuroimaging studies using voxel-based morphometry method based on structural MRI did not show gray matter atrophy of hippocampus in stroke patients with cognitive impairment [13] or with cognitive vulnerability [14], which might be associated with the large number of multiple corrections for voxel-wise analysis of whole brain. Collectively, the pathophysiological mechanisms underlying hippocampal atrophy in PSD patients still remain unclear and the role of neuroimaging studies with MRI was not fully explored.
It is known that the hippocampus is composed of different cytoarchitectonic subfields, including the Cornu Ammonis (CA1-4), the dentate gyrus (DG), the fimbria, and the adjacent subiculum and presubiculum, which have specialized functions and distinct anatomical connections [15]. Recently, an advanced parcellation method based on a novel atlas building algorithm [16] provided automated segmentation of hippocampus into 12 subfields in each hemisphere in FreeSurfer 6.0 software. This method combined manual labels from in vivo and ex vivo images into a single computational atlas of the hippocampal formation, which improved the segmentation accuracy with a high test-retest reliability [17], compared with the previous methods using in vivo atlas [16, 18]. This enabled users to observe the local changes within the hippocampus that are related to the diseases. Using this method, subfield-specific atrophy in the hippocampus was found in several disorders, including mild cognitive impairment [19], depression [20], and dementia [21]. However, the volumetric changes of hippocampal subfields in PSD patients were not investigated yet.
In the present study, we aimed to explore how the volumes of hippocampal subfields were altered in patients with PSD. Based on the associations between the subfields and memory, we hypothesized that PSD patients would have selective atrophy in hippocampal subfields compared to both normal controls and post-stroke nondemented (PSND) patients. Given the hippocampal asymmetry [22], we also examined the hippocampal asymmetry index (AI) between groups. Moreover, we performed regression analyses of the associations between hippocampal subfield volumes/AIs and clinical assessments in each patient group.
MATERIALS AND METHOEDS
Participants
Sixty-two stroke patients were recruited at our medical center between September 2017 and October 2019. In addition, nineteen normal control (NC) were recruited in the present study. Inclusion criteria for the patients were as follows: 1) incidence of stroke between 45 and 85 years old; 2) complement of neuropsychological tests at the acute phase and the third month after stroke; 3) eligible for head MRI scan between 1 and 6 months after stroke onset; 4) definite acute ischemic stroke based on head MRI or CT. Exclusion criteria for all participants were as follows: 1) any neuropsychiatric comorbidity such as depression, epilepsy, brain tumor, brain trauma, drug or alcohol abuse; 2) any clinically significant or unstable medical disorder; 3) any contraindication for MRI; 4) dementia in pre-stroke status (Informant Questionnaire on Cognitive Decline in the Elderly (IQCODE) score > 3.31) [23]; 5) aphasia before or after the stroke. Considering the matching in age and stroke lesion information, 17 NC, 27 PSD, and 28 PSND patients were included in the final analysis of the present study. This study was conducted in accordance with principles of the Declaration of Helsinki and approved by the institutional ethics committee at the local hospital. Written informed consent was obtained from each participant.
Clinical assessments
Clinical function tests, including the National Institutes of Health Stroke Scale (NIHSS) and Activity of Daily Living (ADL) scores, were recorded upon patients’ consents. According to the post-stroke cognitive impairment assessment guideline by the Chinese Stroke Centre Alliance, IQCODE was used to evaluate the pre-stroke cognitive status of each patient, and both Mini-Mental State Examination (MMSE) [24] and miniCog [25] assessments were used to evaluate the cognitive performance of each patient both at the acute stage and at the third month post stroke. The present study used a short form of IQCODE [26], in which 16 items are made into a questionnaire for self-completion. The MMSE consists of a variety of questions with a maximum score of 30 points, and ordinarily can be administered in 5–10 mins. The mini-Cog is a cognitive‘vital signs’ measure for dementia screening, which is constructed by combining the Clock Drawing Task (CDT) with uncued three-word recall derived from the Cognitive Abilities Screening Instrument. More details for the three assessments are displayed in the Supplementary Material. We have controlled the vascular risk factors, such as blood pressure, blood sugar, blood lipids, and smoking, for each patient after stroke via anti-hypertensive drugs, glucose lowering, and lipid lowering drugs. All patients were covered by standardized treatment based on the“Guideline for Early Management of Adults with Ischemic Stroke” [27], and were followed up in the outpatient clinic of the same clinician (H Cai, MD). All normal controls underwent cognitive assessment (both MMSE and miniCog) before the MRI scan.
Here, we used the ΔMMSE, defined as MMSE2 (MMSE score at the third month) minus MMSE1 (MMSE score at acute stage), as an index to measure the cognitive dysfunction related to stroke. Two neurologists (D Sun and H Cai) who were blinded to the MRI data recorded the clinical data and performed the cognitive examinations.
Post-stroke patients were divided into two subgroups (PSD and PSND). PSD was diagnosed by two neurologists according to the definitions proposed by the Vascular Impairment of Cognition Classification Consensus Study [28], which defines the PSD as an appearance of cognitive decline within 6 months of having a stroke that does not recover, and the 2019 Chinese Vascular Cognitive Impairment Guideline [29], which defines PSD as a status that the cognitive impairment lasts for three months after a stroke. We primarily followed the 2019 Chinese guideline and determined the diagnosis at the third month after stroke onset, which also agreed with the international consensus (within 6 months). The MMSE or miniCog scores were recommended to identify the cognitive impairment if the patient satisfy either one of the following two criterions: 1) a combination of the MMSE score and individual education according to the following three levels (namely three cut-off): i) < 24 for patients with education higher than junior middle school; ii) ≤19 for primary school; iii) ≤17 for illiteracy; 2) an adjusted cut-off miniCog score of < 3. In this study, PSD patients were identified if their cognitive impairments have remained for the three months [29]. Notably, we used both MMSE cut-off and evidence of decline on MMSE to determine the PSD here.
MRI data acquisition
All scans were performed on a 3 T MAGNETOM Skyra MRI scanner (Siemens, Germany) with a 20-channel head coil, around the third month post stroke [PSND (mean±SD): 92.50±61.56 days; PSD: 119.04±89.57 days; two-sample t-test: p = 0.21]. T1-weighted images were acquired with a sagittal 3-dimensional magnetization prepared rapid gradient echo (MPRAGE) sequence with the following parameters: matrix size = 256×256×176, voxel size = 0.9×0.9×1 mm3, repetition time (TR) =2200 ms; echo time (TE) = 2.48 ms, inversion time =900 ms, and flip angle (FA) = 8°. Additionally, diffusion-weighted MRI were collected using an EPI sequence with the following parameters: TR/TE =6000/95 ms, FOV = 240×240 mm2, matrix = 120×120, voxel size = 2.0×2.0×2.0 mm3, slice number = 45, b = 1000 s/mm2, number of gradient directions = 30.
Image processing
Hippocampal subfields were segmented using FreeSurfer 6.0 (beta version; http://surfer.nmr.mgh.harvard.edu) (Fig. 1). All hippocampal segmentations were visually checked for quality and none was excluded. A comprehensive description of the pipeline was provided in Iglesias et al. [16]. Subsequently, volumes of the entire hippocampus and the 12 hippocampal subfields in each hemisphere were obtained. Given that several subfields were too small (< 200 mm3 and cannot be reliably delineated on T1-weighted images) or belong to white matter tissue, such as the hippocampus-amygdala transition area, the parasubiculum, the fimbria, and the hippocampal fissure, the present study excluded these regions from analysis and only focused on the following subfields: hippocampal tail, CA1, CA2/3, CA4, subiculum, presubiculum, molecular layer (ML) and the granule cell layer of the dentate gyrus (GC-DG). A recent study [17] demonstrates the test-retest reliability of automated hippocampal subfield measures estimated from T1-weighted scans (spatial resolution = 1×1×1 mm3) using FreeSurfer 6.0, in which the results show that most subfields are highly stable with very small difference between subjects and sessions. Several studies have used this novel subfield segmentation method with only T1-weighted images to investigate the hippocampal pathology mechanism underlying the diseases [20, 31], and their image resolution (1×1×1 mm3) was lower than that used in the current study (0.9×0.9×1 mm3).
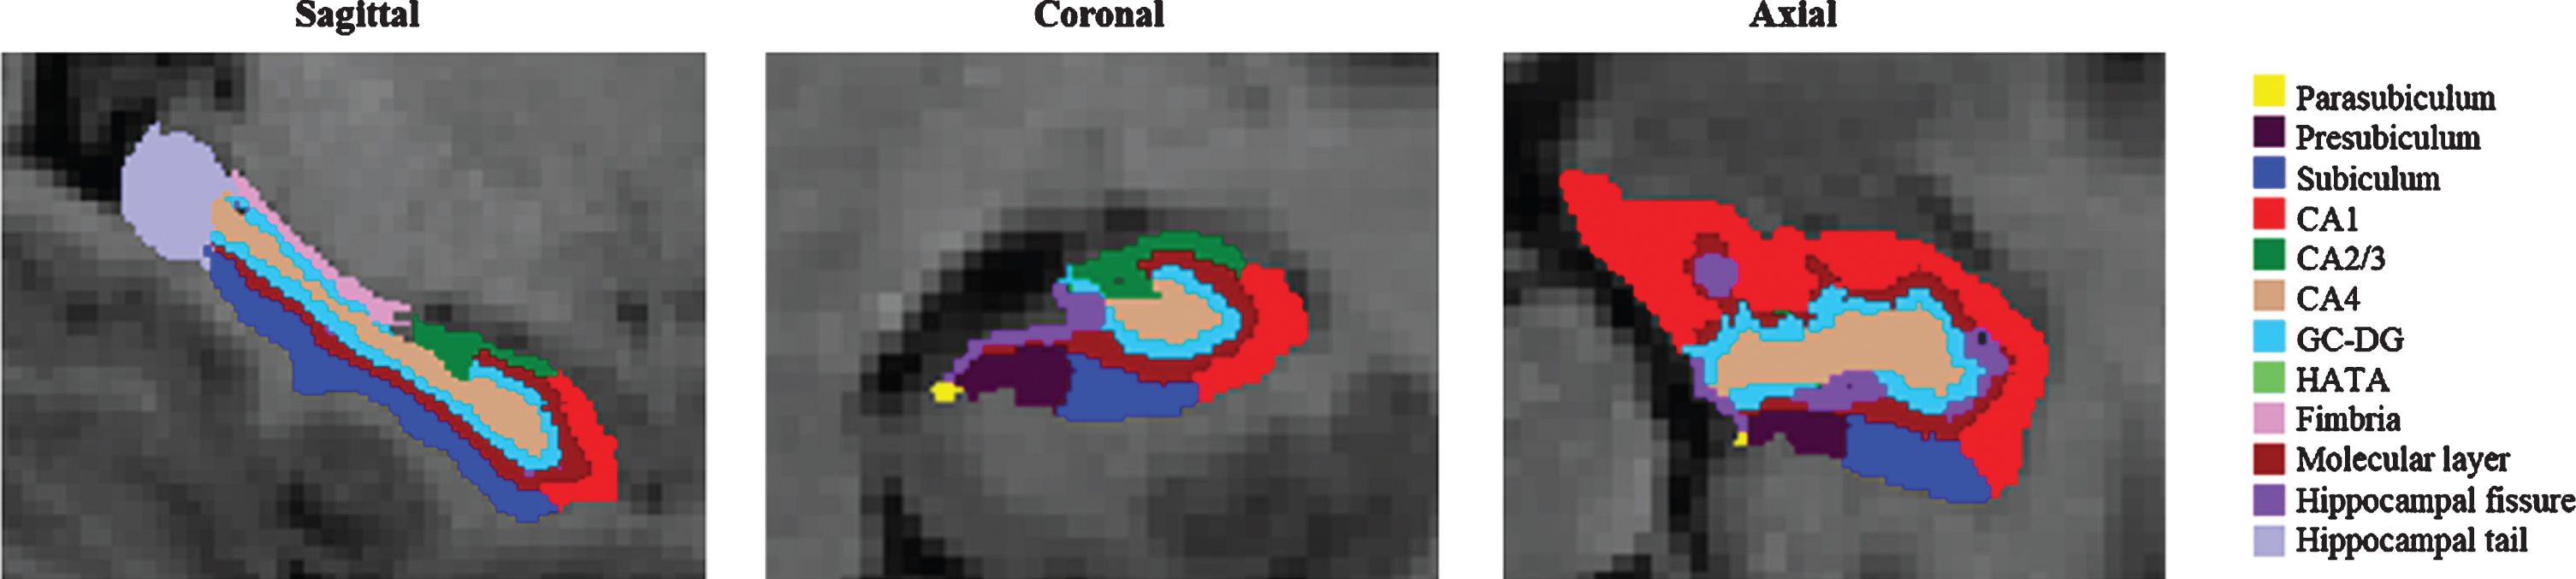
An illustration of hippocampal subfield segmentation using the novel parcellation algorithm. CA, cornu ammonis; GC-DG, the granule cell layer of the dentate gyrus; HATA, hippocampus-amygdala-transition-area.
Additionally, we investigated the hippocampal asymmetry by computing the AI, which was defined as the absolute difference [30] between the left and right volumes normalized to the total bilateral volume: |(Left–Right)|/(Left + Right). We quantified the lesion by manually delineating the lesion regions slice by slice on the non-diffusion-weighted image (b0) for each patient (Supplementary Figures 1 and 2), using the MRIcro software (http://www.mricro.com). The lesion masks were confirmed by two neurologists (D Sun and H Cai). Then, we determined the location and number of lesion, and calculated the lesion volume for each patient.
Statistical analyses
All statistical analyses were performed using SPSS version 21.0 (IBM SPSS Statistics for Windows, Armonk, NY, USA). For each region of interest (ROI), we regressed the covariates of age, sex, education and the intracranial volume (ICV) in a linear model, and then performed a t-test to compare the coefficients of volume/AI between patient and NC groups. Next, a two-sample t test after regressing the age, sex, education, ICV, and the volume, number, and location of lesions as covariates, was performed between patient subgroups using the left/right and the ipsilesional/contralesional volumes. The false discovery rate (FDR) was used to control the false discoveries due to multiple comparisons between ROIs. As a validation analysis, we performed two-sample t tests between any pair of three groups after excluding the patients with excessive lesion size (> 10 ml, four patients for PSND and three ones for PSD). Moreover, considering the close relationship between age and hippocampal volume, we also performed a Pearson correlation analysis of age-volume/AI in each hippocampal subfield in each patient subgroup. Then, a multiple regression analysis was performed between ΔMMSE/ duration of illness and the volumes/AIs, with age, sex, education and ICV as covariates in PSD and PSND groups, separately (FDR correction, p < 0.05).
Finally, we concatenated all the volumes/AIs of hippocampal subfields as features to train a linear discriminant analysis (LDA) with a 5-fold cross-validation method as the classifier for building the predictive model to separate PSD from PSND patients. Receiver operating characteristic (ROC) curve using Feature Explorer (FAE, v0-2-2, https://github.com/salan668/FAE) on Python (3-5-4, https://www.python.org) presented the performances of the LDA model. The accuracy, sensitivity, specificity, positive predictive value (PPV), and negative predictive value (NPV) were computed for the cutoff value that maximizes the Youden index. The performance was compared with classifiers using the entire hippocampal volume/AI as features.
RESULTS
Characteristics of participants
As shown in Table 1, there were no significant differences in the age, handedness, and ICV (global atrophy) between the three groups. The stroke patients in the present study included illiteracy and educated individuals who had a diverse range in education, which increased the diversity of our study population. In clinical assessments, the duration of illness and the NIHSS were all matched between the two patient groups, and the ADL scores in the PSD group were significantly higher than the PSND group. Moreover, the lesion regions did not extend into the hippocampal formation except for two patients (one for each patient subgroup) who had slight overlaps between the lesion and the hippocampal formation (Supplementary Figure 2). Notably, sex and education showed significant differences between PSD and NC [sex/education (by Fisher’s exact test): p < 0.01/p = 0.02] and between PSND and NC (sex/education: p = 0.12/p = 0.01), but not between PSD and PSND (sex/education: p = 0.07/p = 0.56). Cognition scores (MMSE and miniCog) in the PSD patients were significantly lower than that in the PSND group.
Demographic and clinical information of all participants
1acute phase; 2third month; †One-way ANOVA analysis (for the three groups)/ two-sample t-test (for the two groups); ¶Fisher-exact test. Age, ICV, Duration, and MMSE are shown as mean (standard deviation); other data (n (%)) are number of participants (percentage). NC, normal control; PSND, post stroke nondemented; PSD, post stroke demented; ICV, intracranial volume; ADL, Activity of Daily Living; *p < 0.05 and **p < 0.01.
Location, volume and number of lesions information in post-stroke patients
PSND, post stroke nondemented; PSD, post stroke demented; SD, standard deviation.
Differences between NC and PSD/PSND and between PSD and PSND
We found that compared with NC group, PSD group showed smaller volumes in the bilateral entire hippocampus, GC-DG, ML, CA4, left CA1/3, and right presubiculum/subiculum (adjusted p < 0.05). PSND group did not show significant differences in any of the ROIs compared to NC group (adjusted p > 0.05). Importantly, relative to PSND group, PSD group in the left GC-DG, CA4, ML and entire hippocampus showed significant atrophy (adjusted p < 0.05, Fig. 2 and Supplementary Table 1).
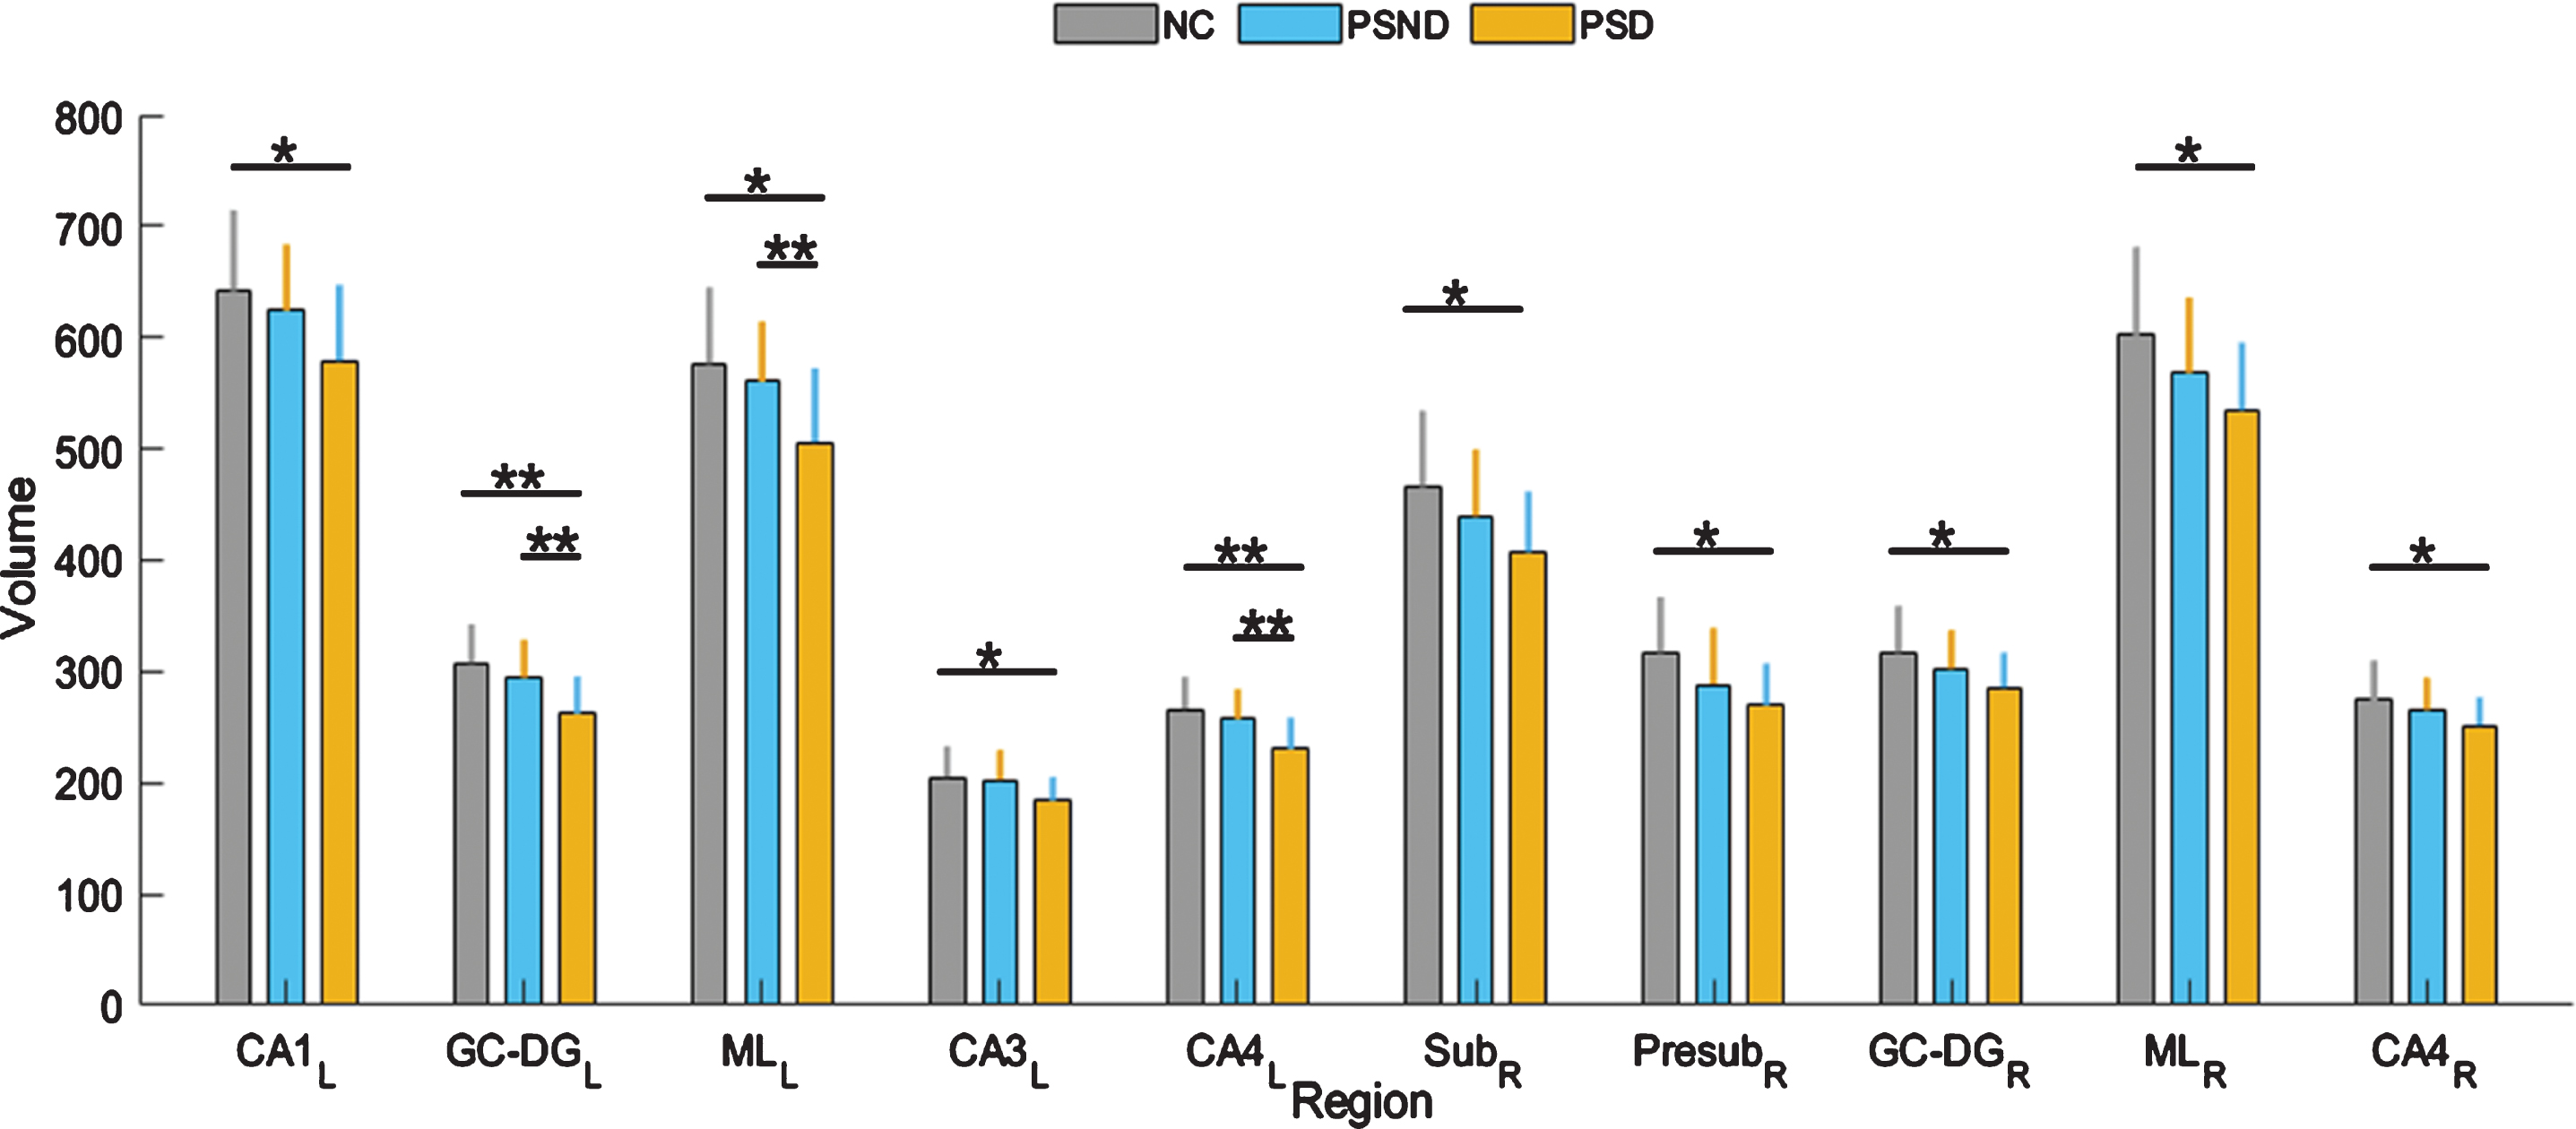
The differences of hippocampal subfield volumes between the three groups. The unit of volume is mm3. CA, cornu ammonis; GC-DG, the granule cell layer of the dentate gyrus; ML, molecular layer; Sub, subiculum; Presub, presubiculum; NC, normal control; PSND, post stroke nondemented; PSD, post stroke demented; L, left; R, right. *p < 0.05 and **p < 0.01. The error bars represent the standard deviation.
Considering the effect of the lesion location on the differences between patient subgroups, we also performed two-sample t tests between PSD and PSND again using ipsilesional and contralesional volumes instead of left and right ones. We found that compared with PSND group, PSD group showed significant atrophy in the ipsilesional GC-DG, CA3, CA4, and entire hippocampus (adjusted p < 0.05), and the ipsilesional ML showed a marginal group difference (adjusted 0.05 < p < 0.1, Supplementary Table 1). Moreover, the validation analysis that removed the seven cases with excessive lesions (lesion volume > 10 ml) also indicated the volume differences between patient subgroups in the ipsilesional GC-DG, CA3 and CA4 (adjusted 0.05 < p < 0.1, the averaged Cohen’s d = 0.77), and partly replicated those between patient and NC groups (Supplementary Tables 3 and 4). The decreased statistical power may be associated with the reduced sample size. The AI did not have significant differences between any pairs of three groups in any of the ROIs (adjusted p > 0.05) (Supplementary Tables 2 and 5).
Correlation between hippocampal volume/AI and ΔMMSE/age
The multiple regression analysis between ΔMMSE/ duration of illness and the volumes did not find significant correlation in two patient groups. However, we found that the AIs of the GC-DG (R2 = 0.51, p = 0.015) (Fig. 3A), CA3 (R2 = 0.53, p = 0.012) (Fig. 3B), and CA4 (R2 = 0.57, p = 0.005) (Fig. 3C) showed significant positive correlations with the ΔMMSE in PSD patients (adjusted p < 0.05), but such correlations were not observed in PSND group (Supplementary Table 8). We also examined the age-dependence of volume and AI measurements and found the volumes of the ipsilesional subiculum and contralesional tail had significant negative correlations with age. After excluding the patients with the excessive lesion volume (> 10 ml), the left/contralesional tail, left presubiculum, left ML, and ipsilesional subiculum also showed significant negative correlations with age in patient subgroups but not the NC group (adjusted p < 0.05, Supplementary Table 6), implying an age-related effect on the atrophy in these subfields in patients compared to NC. No correlations were found between age and AI in any of the subfields (Supplementary Table 7).
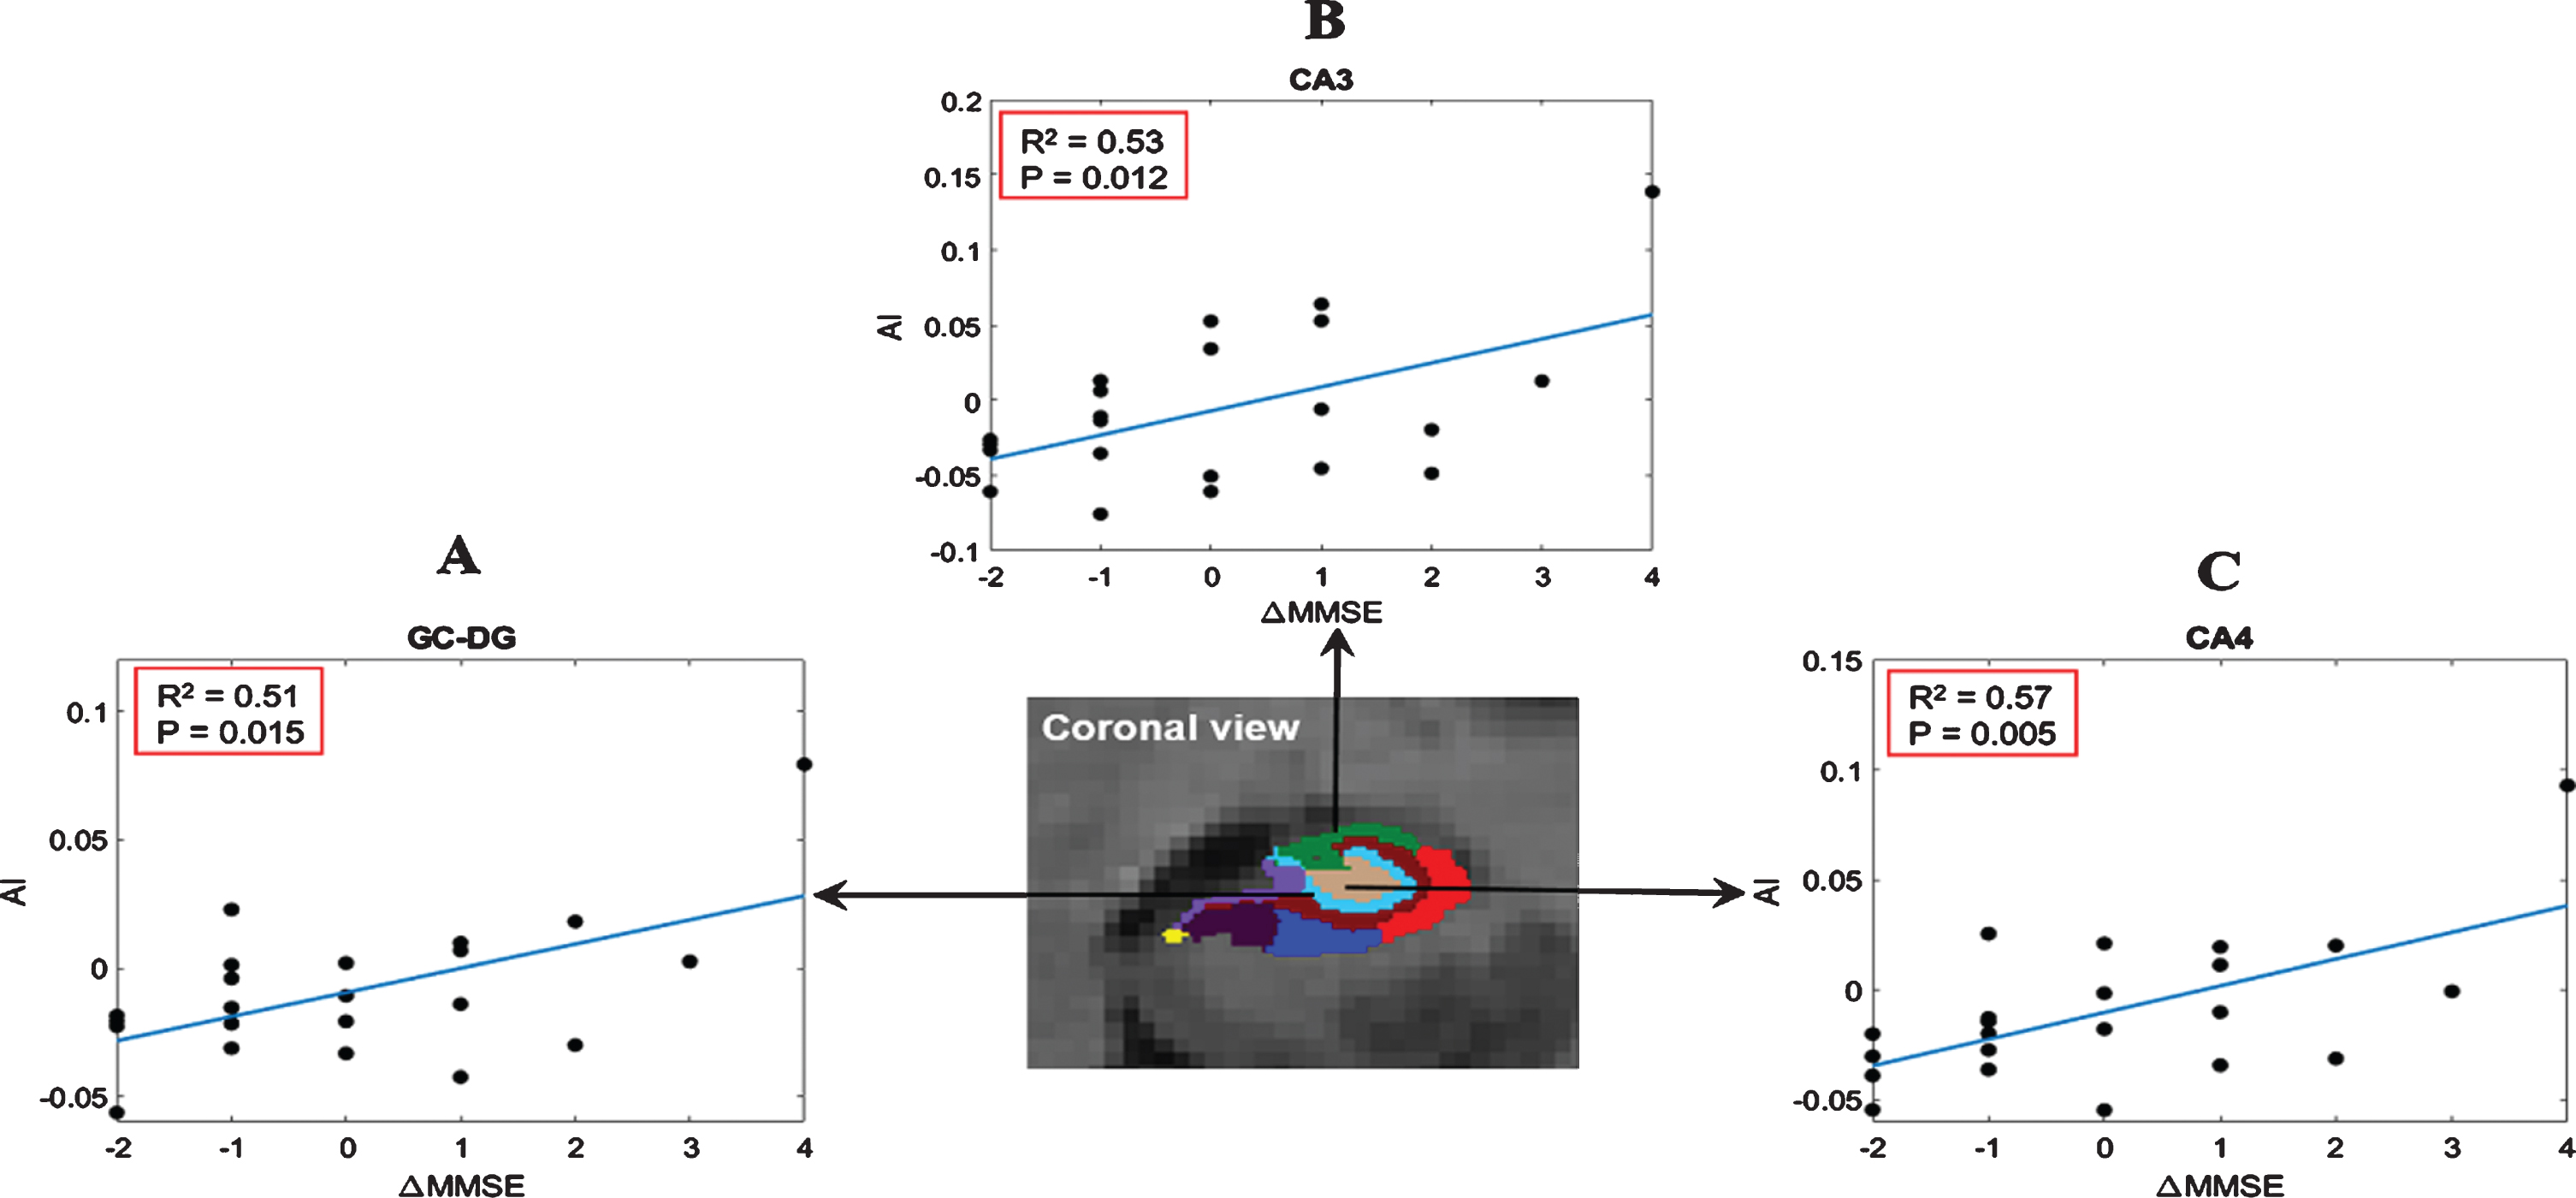
Relationship between the AI of hippocampal subfields and ΔMMSE in the PSD group. CA, cornu ammonis; GC-DG, the granule cell layer of the dentate gyrus; ML, molecular layer; MMSE, Mini-Mental State Examination. Note that AI represents the asymmetry index after regressing the covariates.
Classification of PSD
We performed classification analysis in discrimi-nating the PSD patients from the PSND patients to evaluate the diagnostic value of subfield analysis. LDA classifier based on the volumes of the hippocampal subfields showed a sensitivity/specificity/accuracy of 72.2%/81.3%/76.8%, which outperformed that of the whole hippocampal volume (sensitivity/specificity/accuracy: 66.7%/75.0%/70.9%) (Table 3). We also examined the classification accuracy of the subfield AIs with a sensitivity/specificity/accuracy of 56.5%/73.2%/65.0%.
Results of LDA analysis based on the entire hippocampus or hippocampal subfields as features for classification of PSD and PSND patients
HP, hippocampus; AI, Asymmetry Index; HP_Sub, hippocampal subfields; L, left; R, right; AUC, area under curve; CIs, confidence intervals; PPV, positive predictive value; NPV, negative predictive value; LDA, linear discriminant analysis.
DISCUSSION
In this study, we performed hippocampal subfield analysis in PSD patients using a state-of-the-art hippocampal segmentation approach. The findings supported our hypothesis that compared with NC, PSD patients showed volume loss in entire hippocampus and several hippocampal subfields, including the left CA1-4, ML, and bilateral GC-DG. Notably, selective volumetric losses in the left GC-DG and CA4 were found in PSD compared to PSND, and such changes were not found between PSND and NC. This may reflect a dementia-specific volume decrease in the two subregions after stroke. Moreover, in PSD group, the AIs of CA3, CA4, and GC-DG were positively correlated with the change of MMSE score after stroke. These findings demonstrated that hippocampus of the PSD patients presented a distinct pattern of volumetric changes, providing insights towards the potential mechanism of PSD.
Hippocampal atrophy has been found in many previous studies of dementias [8–10, 12]. A study in PSD patients demonstrated that medial temporal lobe atrophy (including hippocampal formation and parahippocampal gyri) significantly raised the risk of dementia after stroke [32], which might be associated with hippocampal microvasculature changes upon stroke [33]. Similarly, the present study observed significant volume decreases in bilateral entire hippocampus in PSD group compared with NC, and the left entire hippocampus also showed difference in PSD compared with PSND. However, a detailed look into the hippocampus is essential for us to understand the PSD mechanism in relation to other types of dementia. Selective atrophy in hippocampal subfields has been reported in a variety of dementia subtypes, especially in CA. For instance, AD patients exhibited significantly greater atrophy in the CA1 and CA2-3, while Lewy body dementia showed left-predominant atrophy in the CA1 region [9]. Histopathology of frontotemporal dementia showed the most prominent atrophy in CA1-4 [30]. Patients with amnestic mild cognitive impairment (aMCI) (a transitional stage toward AD) exhibited a significant atrophy in the CA2-3 [19], while patients with subcortical vascular mild cognitive impairment (svMCI) (a prodromal stage of subcortical vascular dementia) displayed a significant atrophy in the right CA4 [34]. These findings indicate that the hippocampal subfields show distinct pattern of atrophy for different dementias, and this may reflect a disease-specific pathology mechanism. In the present study, we found significant volume differences in the left CA1/3 and right hippocampal subfields between PSD and NC but not between PSD and PSND. Therefore, the atrophy in these subfields may not be specific for dementia and also be associated with stroke.
One of our primary findings was that the left CA4 volume was selectively reduced in the PSD compared to PSND but did not show significant difference between PSND and NC, and its AI was positively correlated with the change of MMSE scores in PSD group, indicating this might be a dementia-specific change after stroke. CA4 is considered to be an important anatomical and functional intersection of white matter pathways connecting the hippocampus and several other cerebral sites [31, 35], such as temporal and posterior cortical areas [36]. Previous studies have demonstrated altered cerebral networks in both stroke and dementia patients [37, 38]. Therefore, CA4 volume loss in the present study might affect the connectivity within the hippocampus as well as between the hippocampus and other brain regions in patients with PSD. Further connectivity analysis is needed for validation.
We also found significant atrophy in bilateral GC-DG of the PSD patients compared to NC, and the left GC-DG did not have differences between PSND and NC. The AI in GC-DG was positively correlated with the change of MMSE scores in PSD group. This indicates a mixed effect in the right GC-DG but dementia dominance in the left GC-DG which is consistent with the aforementioned reports in the svMCI [34] and AD patients [39]. The granule cell layer within DG is known to be involved in neurogenesis and synaptic plasticity during brain development and adulthood [40]. A previous study of the gerbil hippocampus found that the DG region showed ischemic damage only after a long-term ischemic insult [40]. In addition, animal experiments have demonstrated that although ischemia could stimulate neurogenesis [41], the self-repair potential of the adult mammalian brain was insufficient because the majority of newly generated cells died over time in an ischemic microenvironment [42]. These evidence may explain the GC-DG atrophy of PSD patients found in the present study, which may result from dominant cell death with respect to cell proliferation [43].
Additionally, the left ML also showed decreased volume in PSD than PSND but did not show significant difference between PSND and NC, although it might be affected by the lesion distribution. In the new segmentation method, the ML label is the molecular layer in subiculum and CA fields, which consists of interneurons and synaptic connections of these subfields [44]. The interneurons are involved in regulating the synaptic activities within the hippocampus [45]. Therefore, we speculate that the reduced volume in the left ML may indicate dysregulation of synaptic activities between the pyramidal cells and interneurons in PSD, and similar pathology in ML has been found in bipolar disorder [46].
A recent study with a large sample of 5035 de-mentia- and stroke-free persons demonstrated that smaller subiculum volume was associated with risk of dementia [21], whereas the present study only found subiculum volume difference between PSD and NC but not between PSD and PSND, and this might due to the following reasons. The participants included in [21] were dementia- and stroke-free individuals and it is known that the atrophy patterns of hippocampal subfields inherently vary between dementia subtypes [11, 30]. The volume differences of the subiculum between PSD and NC, suggested that the stroke, rather than dementia, might be a major contributor to such changes in PSD patients. Since the executive dysfunction induced by stroke has been reported in the previous studies [47, 48], the findings in the present study may indirectly support the close relationship [21] between subiculum and executive function. Also, the sample size in our study may affect the statistical power of the findings, compared to the large population-based study.
Additionally, a previous pathological study found that PSD patients dominantly showed the non-AD neurodegenerative and/or other non-neurode-generative substrates [11]. The findings in the present study further support this conclusion that PSD showed dementia-specific atrophy in the GC-DG, CA4, and ML rather than CA1-3, presubiculum, and subiculum consistently reported in AD [9, 50]. Several other studies did not show gray matter atrophy of hippocampus in stroke patients with cognitive impairment [13] or with cognitive vulnerability [14], and these differences with the findings in the present study might due to the different stage of cognitive impairment of the recruited stroke patients.
Moreover, we compared classifiers based on the entire hippocampus and hippocampal subfields volumes, which allowed us to evaluate the diagnostic value of subfield analysis with respect to the conventional entire hippocampal analysis. We found that the classifier using the subregion volumes outperformed that using the entire hippocampus as the features, in separating PSD from PSND. This was consistent with a recent report that utilized subfield volumes to classify AD and controls [16]. These results further support that the subfield volumes carry useful information in addition to the entire hippocampal volume. In addition, Table 3 showed the sensitivity of classification was higher when using the volumes of left hippocampal subfields as the features than that of right hippocampal subfields. This high sensitivity was supported by the findings of asymmetric volume differences between the two patient groups. On the other hand, specificity of the left hippocampus was low, and therefore, combining the left and right subfield volumes led to the highest classification accuracy. Notably, although a cross-validation was used to build the LDA model, this model has still been optimized on the existing data rather than an independent dataset. Therefore, the reported metrics likely did not reflect what would be observed if the model(s) were applied to a new dataset.
Notably, in the current study, the PSD group has twice as many cases with left-side stroke (left: right = 16:9) compared to the PSND group which has the balance cases with right- and left-side stroke (left: right = 13:13). Therefore, the ipsilesional regions showing the significant differences between patient subgroups might be more to the left side. Thus, the findings abovementioned suggested that the volume differences of the GC-DG and CA4 between PSD and PSND groups could be held regardless of using left and right volumes or using ipsilesional and contralesional volumes. Additionally, given that the standard Montreal Cognitive Assessment (MoCA, a test used typically in diagnosis of dementia after stroke) is not appropriate for illiterate and low-educated elderly subjects [51] and more than half (41/72) of our participants were primary school and illiteracy with age ranged from 45 to 85 years, we used MMSE and miniCog tests instead of MoCA to identify PSD according to the suggestion from the consensus [51] in the present study. We also calculated the correlations between the ΔMMSE and the education in each patient subgroup, respectively. No significant correlation was found in the PSD group (r = –0.147, p = 0.515) and the correlation was a marginal in PSND group (r = –0.397, p = 0.040).
The present study has several limitations. First, our sample size is relatively small, and a larger sample is needed to confirm our findings in the future. Second, the sex and education both showed significant differences between patient and NC groups. Although we considered these variables as covariates in the statistical model, this might not completely remove some of the heterogeneity in the data. Third, the hippocampal subfield segmentation pipeline has the capacity to incorporate T1- and T2-weighted images. When only T1 images were used, the segmentation could be less accurate due to the lack of internal contrast of the hippocampus, although it has been shown to be useful in capturing subfield abnormalities in several studies. Thus, we removed the very small subfields from analysis, but the results still needed to be interpreted with caution. Fourth, the current study only used volumetric analysis based on T1-weighted MR image. Future studies that combine multiple modalities, such as functional and diffusion MRI will enable us to investigate more comprehensive information of the hippocampal subfields in PSD. In addition, the present study used a simplistic approach with the ΔMMSE as an index to measure the cognitive dysfunction related to stroke. More scale tests, such as MoCA, and behavior cognition tasks should be combined with MMSE to estimate the cognitive dysfunction of patients in the future. Finally, the cognitive ability in most stroke survivors could be improved after 3 months, suggesting that the findings in this cross-sectional study may be mainly meaningful for this time point. A recent longitudinal study has demonstrated that first-year ipsilesional hippocampal atrophy rate was greater than atrophy rates in healthy controls and contralesional stroke, especially in first-ever stroke [52]. Therefore, a longitudinal observational study where the cognitive function is measured for one year or more after stroke would strengthen the clinical significance of the current study.
CONCLUSIONS
In summary, we found reduced hippocampal sub-field and entire hippocampal volumes in PSD compared to control subjects, especially in the left CA regions. Moreover, we observed a selective atrophy in left CA4 and GC-DG in PSD relative to PSND, which could be used to improve clinical diagnosis for the dementia after stroke. These findings may help us to understand the specific hippocampal pathology in PSD patients.
Footnotes
ACKNOWLEDGMENTS
This work is supported by the Ministry of Science and Technology of the People’s Republic of China (2018YFE0114600), National Natural Science Foundation of China (61801424, 81971606, 91859201, 61801421, and 81971605), Fundamental Research Funds for the Central Universities of China (2019QNA5024 and 2019FZJD005), Youth Program of National Natural Science Foundation of China (82001907), Natural Science Foundation of Zhejiang Province of China (LY19H090027), China Postdoctoral Science Foundation (2020M671726 and 2202M671727), and Postdoctoral Science Foundation of Zhejiang Province, China (514000-X81901).