
Abstract
Background:
Besides their other roles, brain imaging and other biomarkers of Alzheimer’s disease (AD) have the potential to inform a cognitively unimpaired (CU) person’s likelihood of progression to mild cognitive impairment (MCI) and benefit subject selection when evaluating promising prevention therapies. We previously described that among baseline FDG-PET and MRI measures known to be preferentially affected in the preclinical and clinical stages of AD, hippocampal volume was the best predictor of incident MCI within 2 years (79%sensitivity/78%specificity), using standard automated MRI volumetric algorithmic programs, binary logistic regression, and leave-one-out procedures.
Objective:
To improve the same prediction by using different hippocampal features and machine learning methods, cross-validated via two independent and prospective cohorts (Arizona and ADNI).
Methods:
Patch-based sparse coding algorithms were applied to hippocampal surface features of baseline TI-MRIs from 78 CU adults who subsequently progressed to amnestic MCI in approximately 2 years (“progressors”) and 80 matched adults who remained CU for at least 4 years (“nonprogressors”). Nonprogressors and progressors were matched for age, sex, education, and apolipoprotein E4 allele dose. We did not include amyloid or tau biomarkers in defining MCI.
Results:
We achieved 92%prediction accuracy in the Arizona cohort, 92%prediction accuracy in the ADNI cohort, and 90%prediction accuracy when combining the two demographically distinct cohorts, as compared to 79%(Arizona) and 72%(ADNI) prediction accuracy using hippocampal volume.
Conclusion:
Surface multivariate morphometry and sparse coding, applied to individual MRIs, may accurately predict imminent progression to MCI even in the absence of other AD biomarkers.
INTRODUCTION
Even though simple blood tests [1–3] promise to become a useful and less expensive tool for assessing a person’s diagnosis and prognosis in the early clinical and preclinical stages, structural magnetic resonance imaging (MRI) remains the most common biomarker assessment tool in current clinical practice. Typically, volumetric methods have utilized mass-univariate or region of interest methods to detect cortical thickness, grey matter volume, and surface areas. Accordingly, we recently reported findings from a prospective cohort of cognitively unimpaired individuals to estimate a priori MRI regions of interests (preferentially affected in the preclinical and clinical stages of Alzheimer’s disease (AD)) for differences between those individuals who subsequently progressed to clinically significant memory decline in approximately 2 years and those who did not. Additionally, the same study also used Statistical Parametric Mapping (SPM) (http://www.fil.ion.ucl.ac.uk/spm/) to examine the 18F-flu-orodeoxyglucose (FDG) positron emission tomography (PET) measured cerebral metabolic rate for glucose (CMRgl) differences between progressors and nonprogressors. Based on receiver operating characteristic, binary logistic regression, and leave-one-out procedures, hippocampal volume best predicted an individual’s imminent progression to the clinically significant memory decline, with 79%sensitivity/78%specificity among the APOE-matched cohort [4].
Multivariate methods appear to improve detection of subtle changes in MRI-based morphological features of structures relevant to preclinical detection of AD [5–7]. Machine learning methods promise to improve the accuracy of prediction for individual patients, particularly when applied to MRI based multiple features as with multivariate morphometry statistics (MMS), in the preclinical stages of AD [8–10]. In this study, we aimed to improve prediction from prior studies by employing the hippocampal surface MMS features, which have been shown to outperform the hippocampal volume measure [6, 11], and the patch based sparse coding algorithm to predict clinically significant memory impairment within two years, even in the absence of other amyloid, tau, PET, cerebrospinal fluid (CSF), or emerging blood-based bio-markers.
METHODS
Participants
Arizona cohort
These study participants were a sub-cohort of 280 drawn from our 23-year longitudinal Arizona APOE cohort study [12, 13]. As previously described [4], 18 “progressor” participants developed clinically significant memory impairment (16 diagnosed with amnestic MCI (aMCI), 1 with both amnestic and visuospatial MCI, and 1 with AD) and had both MRI and FDG PET data while still cognitively unimpaired at the epoch approximately 2 years prior to progression to aMCI/AD, and 20 “nonprogressor” participants who remained cognitively unimpaired at least 4 years after their last visits, all based on clinical, informant, neuropsychological data, and a Mini-Mental State Examination (MMSE) score > 26. The progressors and nonprogressors were matched for sex, age, education, and APOE allele dose. Participants with one abnormal score could be deemed clinically unimpaired if all other scores within the same cognitive domain were solidly normal and there were no functional impairments. The aMCI diagnosis was determined based on published criteria [14, 15] using clinical, functional, and neuropsychological data that included a wide battery of tests with > 1 test per domain. Though we subsequently introduced amyloid PET and tau PET to this overall study, we did not have these data for this specific sub-cohort available at baseline and therefore did not have amyloid or tau biomarkers to confirm AD pathology.
ADNI cohort
The Principal Investigator of this initiative is Michael W. Weiner, MD, VA Medical Center and University of California –San Francisco. For up-to-date information, see http://www.adni-info.org. Study participants were drawn from ADNI data bases utilizing the same criteria to categorize and match progressors and nonprogressors described above for the Arizona cohort. From ADNI-1, ADNI-2, ADNI-Go, and ADNI-3 we found 60 participants who developed clinically significant memory impairment, i.e., aMCI, in approximately 2 years and 60 age, sex, education and APOE-matched nonprogressors who remained cognitively unimpaired for at least 4 years. “Baseline” scans were the MRI scans from progressors at 2 years prior to clinically significant decline and the corresponding matched nonprogressors’ MRI scans.
The parent study for the Arizona cohort was approved by the Mayo Clinic and Banner Health (originally Banner Good Samaritan) Institutional Review Boards, and after complete description of the study to the subjects, written informed consent was obtained.
Hippocampus segmentation and surface reconstruction
All the T1-weighted MR images were automatically segmented by using FIRST [16], which is a model based subcortical structure registration and segmentation tool that we have used in our previous hippocampal morphometry research [6, 11]. In comparison to FreeSurfer, FIRST is capable of generating topologically sound segmentation results with classification of relatively large, scaled databases. FIRST is one part of FSL library developed mainly by Analysis Group, FMRIB, Oxford, UK. With default parameters, we ran the run_first_all command and extracted the segmentation of left and right hippocampi. Then all the extracted images were binarized with a simple thresholding process. With the binary images, hippocampal surfaces were constructed with a topology-preserving level set method [18] and triangular surface meshes were further acquired based on marching cubes algorithm [19]. We then refined the meshes [6] to get the smooth surfaces which are suitable for generating conformal grids. Finally, all these smoothed meshes were aligned into the MNI standard space with a 9-DOF (degree of freedom) global affine transformation (Fig. 1).
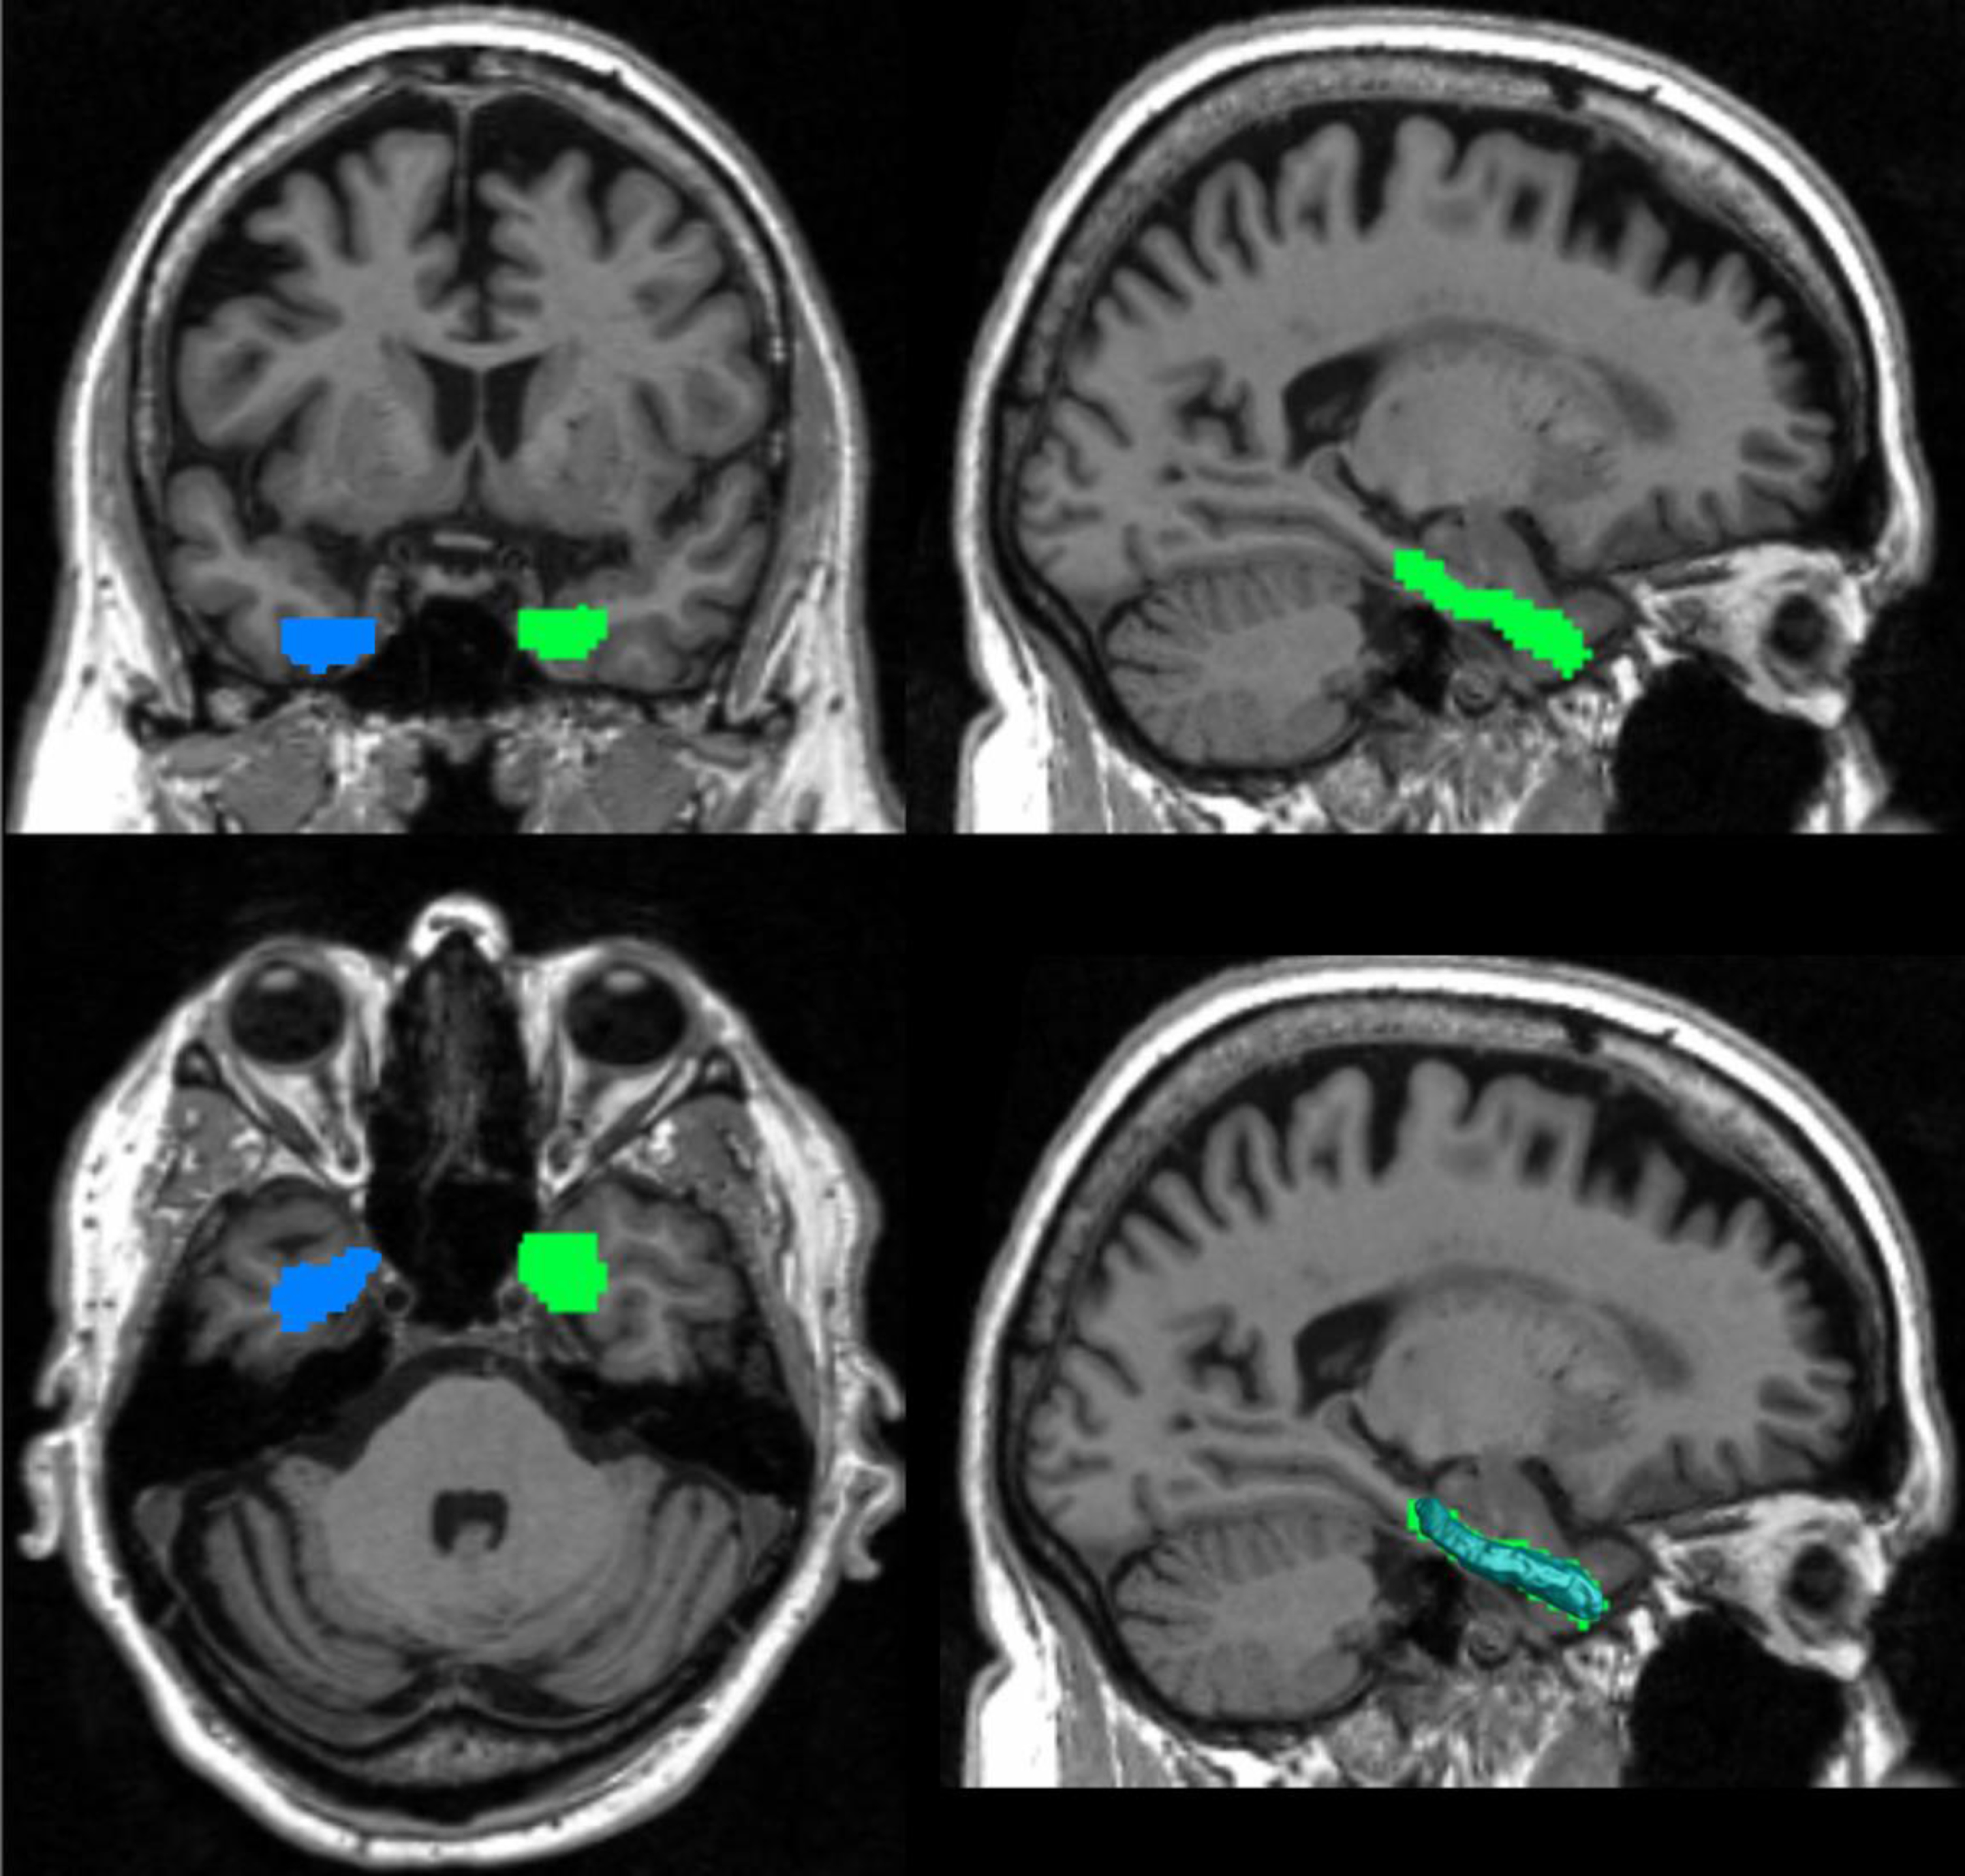
Hippocampus segment. The blue and green parts in these images represent the left and right hippocampus that FIRST segments of the image. The bottom right picture shows the shape of the hippocampal surface, which fits the segmented image well.
Surface conformal representation
On each hippocampal surface, we generated a conformal grid as a canonical space for surface registration and multivariate statistical analysis [6]. Firstly, two cuts were introduced on the hippocampal surface (Fig. 2) and thus the surface could be converted into a tube-like genus zero surface. The two cuts locate at the front and back of the hippocampal surfaces, representing anterior junction with the amygdala, and its posterior limit as it turns into the white matter of the fornix. Thus, they are biologically valid and can be used as consistent landmarks across subjects. With the tube-like surface, the landmark curves can be automatically determined by locating the extreme points and searching along the first principle direction of geometric moments of the surface [7, 21]. Finally, we calculated the holomorphic 1-form basis of each tube-like surface and conformally mapped the hippocampal surface to a planar surface.
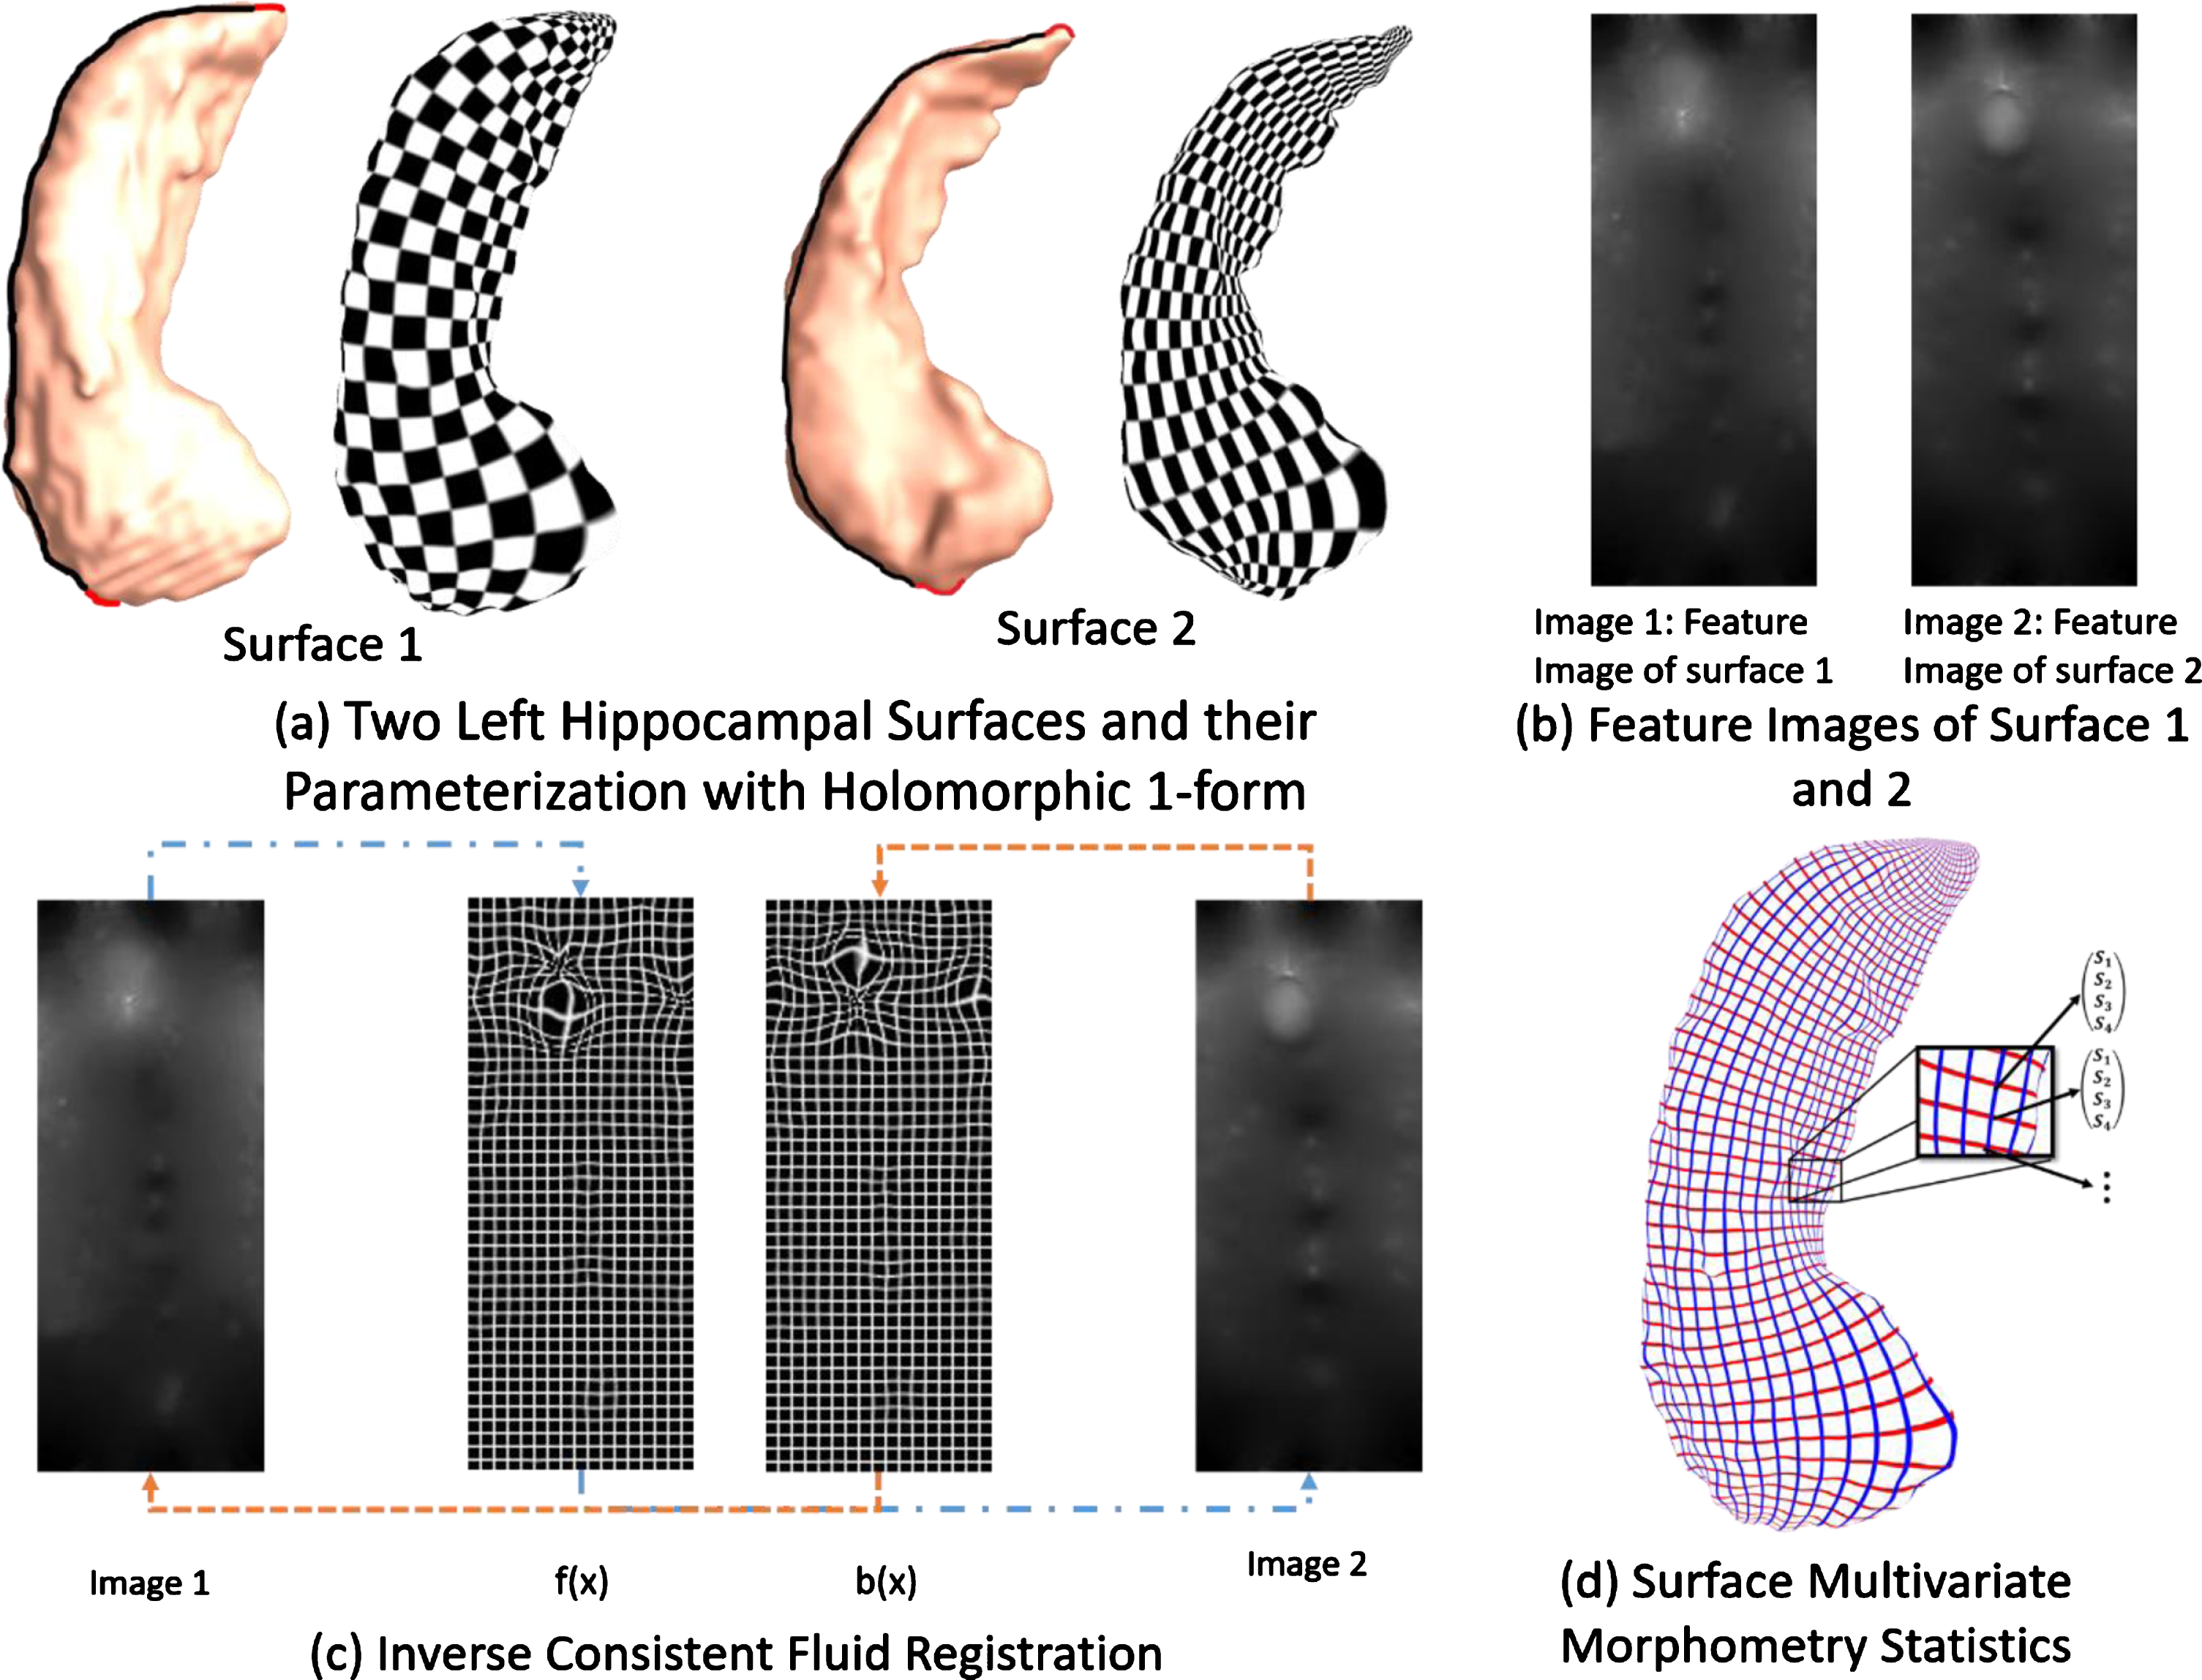
Hippocampal surface morphometry pipeline. (a) The hippocampus is segmented from T1-weighted images and a conformal grid is built on the surface. Here examples are shown for 2 different subjects. (b) Examples of features selected in the image for the two subjects in (a). (c) From left to right: Intensity map on the surface 1 in (a). Forward map f(x) for the conformal grid fluid registration to the image 2. Backward map b(x) from the image 2 to image 1. Intensity map on the surface 2. (d). Surface multivariate morphometry statistics is applied to analyze morphometric changes.
Many of the geometric features of the surface could be contained in the conformal parameterization. In this paper, we calculated the local conformal factor and mean curvature, which represents the intrinsic and extrinsic features of the surface respectively. The conformal factor is the area ratio of the infinitesimal region around the same point on the original hippocampal surface and the conformal planar surface. Mean curvature is an extrinsic measure of curvature which comes from differential geometry and can represent the flatness of the surface around a vertex. Both the conformal factor and mean curvature are local features defined on each vertex. The conformal factor and mean curvature are called the surface conformal representation because they can encode both intrinsic structure and 3D embedding information.
Hippocampal surface registrations
All the hippocampal surfaces need to be registered to a common template surface for morphometric analysis. We used the aforementioned features, surface conformal factor and mean curvature, to enforce surface correspondence. So, with the conformal parameterization, we converted the 3D surface to a 2D image registration problem. We applied the well-studied image fluid registration algorithm [22, 23] to induce a deformation flow in the parameter domain. To simulate fluid flow on the surfaces, we introduced the Navier-Sokes equation into surface space using a manifold version of the Laplacian and divergence operators [24, 25]. With an inverse consistent framework, we could optimize the surface registration by minimizing the sum of squared surface feature intensity differences between the deforming image and the template. Since both the conformal mapping and the inverse consistent framework generate diffeomorphic mappings, the mapping between the surfaces is diffeomorphic.
Surface multivariate morphometry statistics
Surface MMS consists of two different features: multivariate tensor-based morphometry (mTBM) [26] and radial distance analysis [27, 28]. The mTBM can measure the deformation within the surface while the radial distance can measure hippocampal size according to the surface normal direction.
The mTBM statistics measure local surface deformation and have demonstrated improved signal detection power relative to more standard tensor-based morphometry (TBM) measure computed as the determinant of Jacobian matrix [29].
Since the hippocampal surface is cut like a tube, the distance from each surface point to its medical core is affected by its atrophy and enlargement. We named the distance as the radial distance of a hippocampus surface, which represents the morphometric changes along the surface normal direction. Thus, radial distance and mTBM are complementary to each other; finally, we formed the new multivariate surface morphometry statistic as a 4×1 vector, of which the mTMB was computed as a 3×1 vector consisting of the “Log-Euclidean metric” [30] and the radial distance is just a scalar.
Patch analysis-based surface correntropy-induced- sparse-coding (PASCS)
Recently, sparse representation and sparse coding methodology developed in the machine learning field has been shown to be efficient in learning diverse and discriminative features for optimal representations [31, 32]. Our prior work adopting sparse coding for MRI data analysis in AD showed promising performance [33–36]. The basic idea of sparse coding is to generate an over-complete dictionary that allows us to represent the original high-dimensional features with a sparse coefficient matrix (sparse codes) for learning the optimal representation. The advantage of sparse coding is that it can use a small number of basis vectors to represent local features effectively and concisely and help extract the most discriminative features for image content analysis. Sparse coding has shown to be efficient for many medical image tasks, including image classification [37], image denoising [38], image segmentation [39], and functional connectivity [40]. In our research, we use the combination of surface patch features as input and construct both dictionary and their sparse codes to reconstruct the input features. Usually, the objective function aims to optimize two terms: the first term measures how well it represents the surface patches, and the second term ensures the sparsity of the representation, with an l1-regularized correntropy loss function. In this work, stochastic coordinate coding [42] is adopted due to its ability to dramatically reduce the computational cost while keeping comparable performance. We further use the learned sparse representation as surface features.
Patch selection with sparse coding
After registering each hippocampal surface to a uniformed grid, each surface contains 150 * 100 vertices and the feature dimension of each hippocampal surface is 60,000, where each vertice has 1 * 4 dimensional MMS features. We then randomly generated 10×10 square windows on each hippocampal surface and collected 504 surface patches with different amounts of overlapping on each side of the hippocampus. We randomly selected 1008 patches on each subject’s hippocampal surfaces (1008 for both left and right). For different subjects, we used the same random seed to choose the patches. In other words, the distribution for the random-selected patches is the same on the hippocampal surfaces for all the subjects. Then we reformed these patches of features to a vector, of which the dimension is 400×1008. The dictionary was initialized by randomly selecting patches [43], which has proved to be an efficient method in practice, and then we started learning the dictionary and sparse codes by stochastic coordinate coding [42]. The size of the batch is one and the model is trained for ten epochs. After sparse coding, we acquired 1008 samples, each of which has 1800 features on each subject. Finally, with max-pooling, we chose the maximum values for each feature over 1008 patches and obtained 1800-dimensional features for each subject.
In this study, we chose random forest algorithm [44]. Random forests are a combination of tree predictors such that each tree depends on the values of a random vector sampled independently and with the same distribution for all trees in the forest (Fig. 3). This algorithm adapts a learning process called “feature bagging.” In this process, we selected a random subset of the features for several times and then trained a decision tree for each subset. If some features are strong predictors for the response, they will be selected in many decision trees and thus make them correlated. In comparison with decision trees, random forests have the same bias but lower variance, which means it can overcome the drawback of overfitting caused by the small data set. For our sparse surface features, when the training number becomes smaller, diversification becomes more subtle, and the method can better detect these subtle differences. Finally, we employed cross-validation to evaluate the performance of the classification. For the k-fold cross-validation, we randomly shuffled the dataset and split it to k groups. For each group, we take it as the test data set and use the remaining groups to train a model. Then, the model is evaluated by the test group. In this way, we can get a predicted class label for all the samples. To indicate the number of correct class labels, we built a contingency table, of which the rows are the true classes and the columns represent assigned classes. And then, we could represent the combination of ground truth and predicted result as
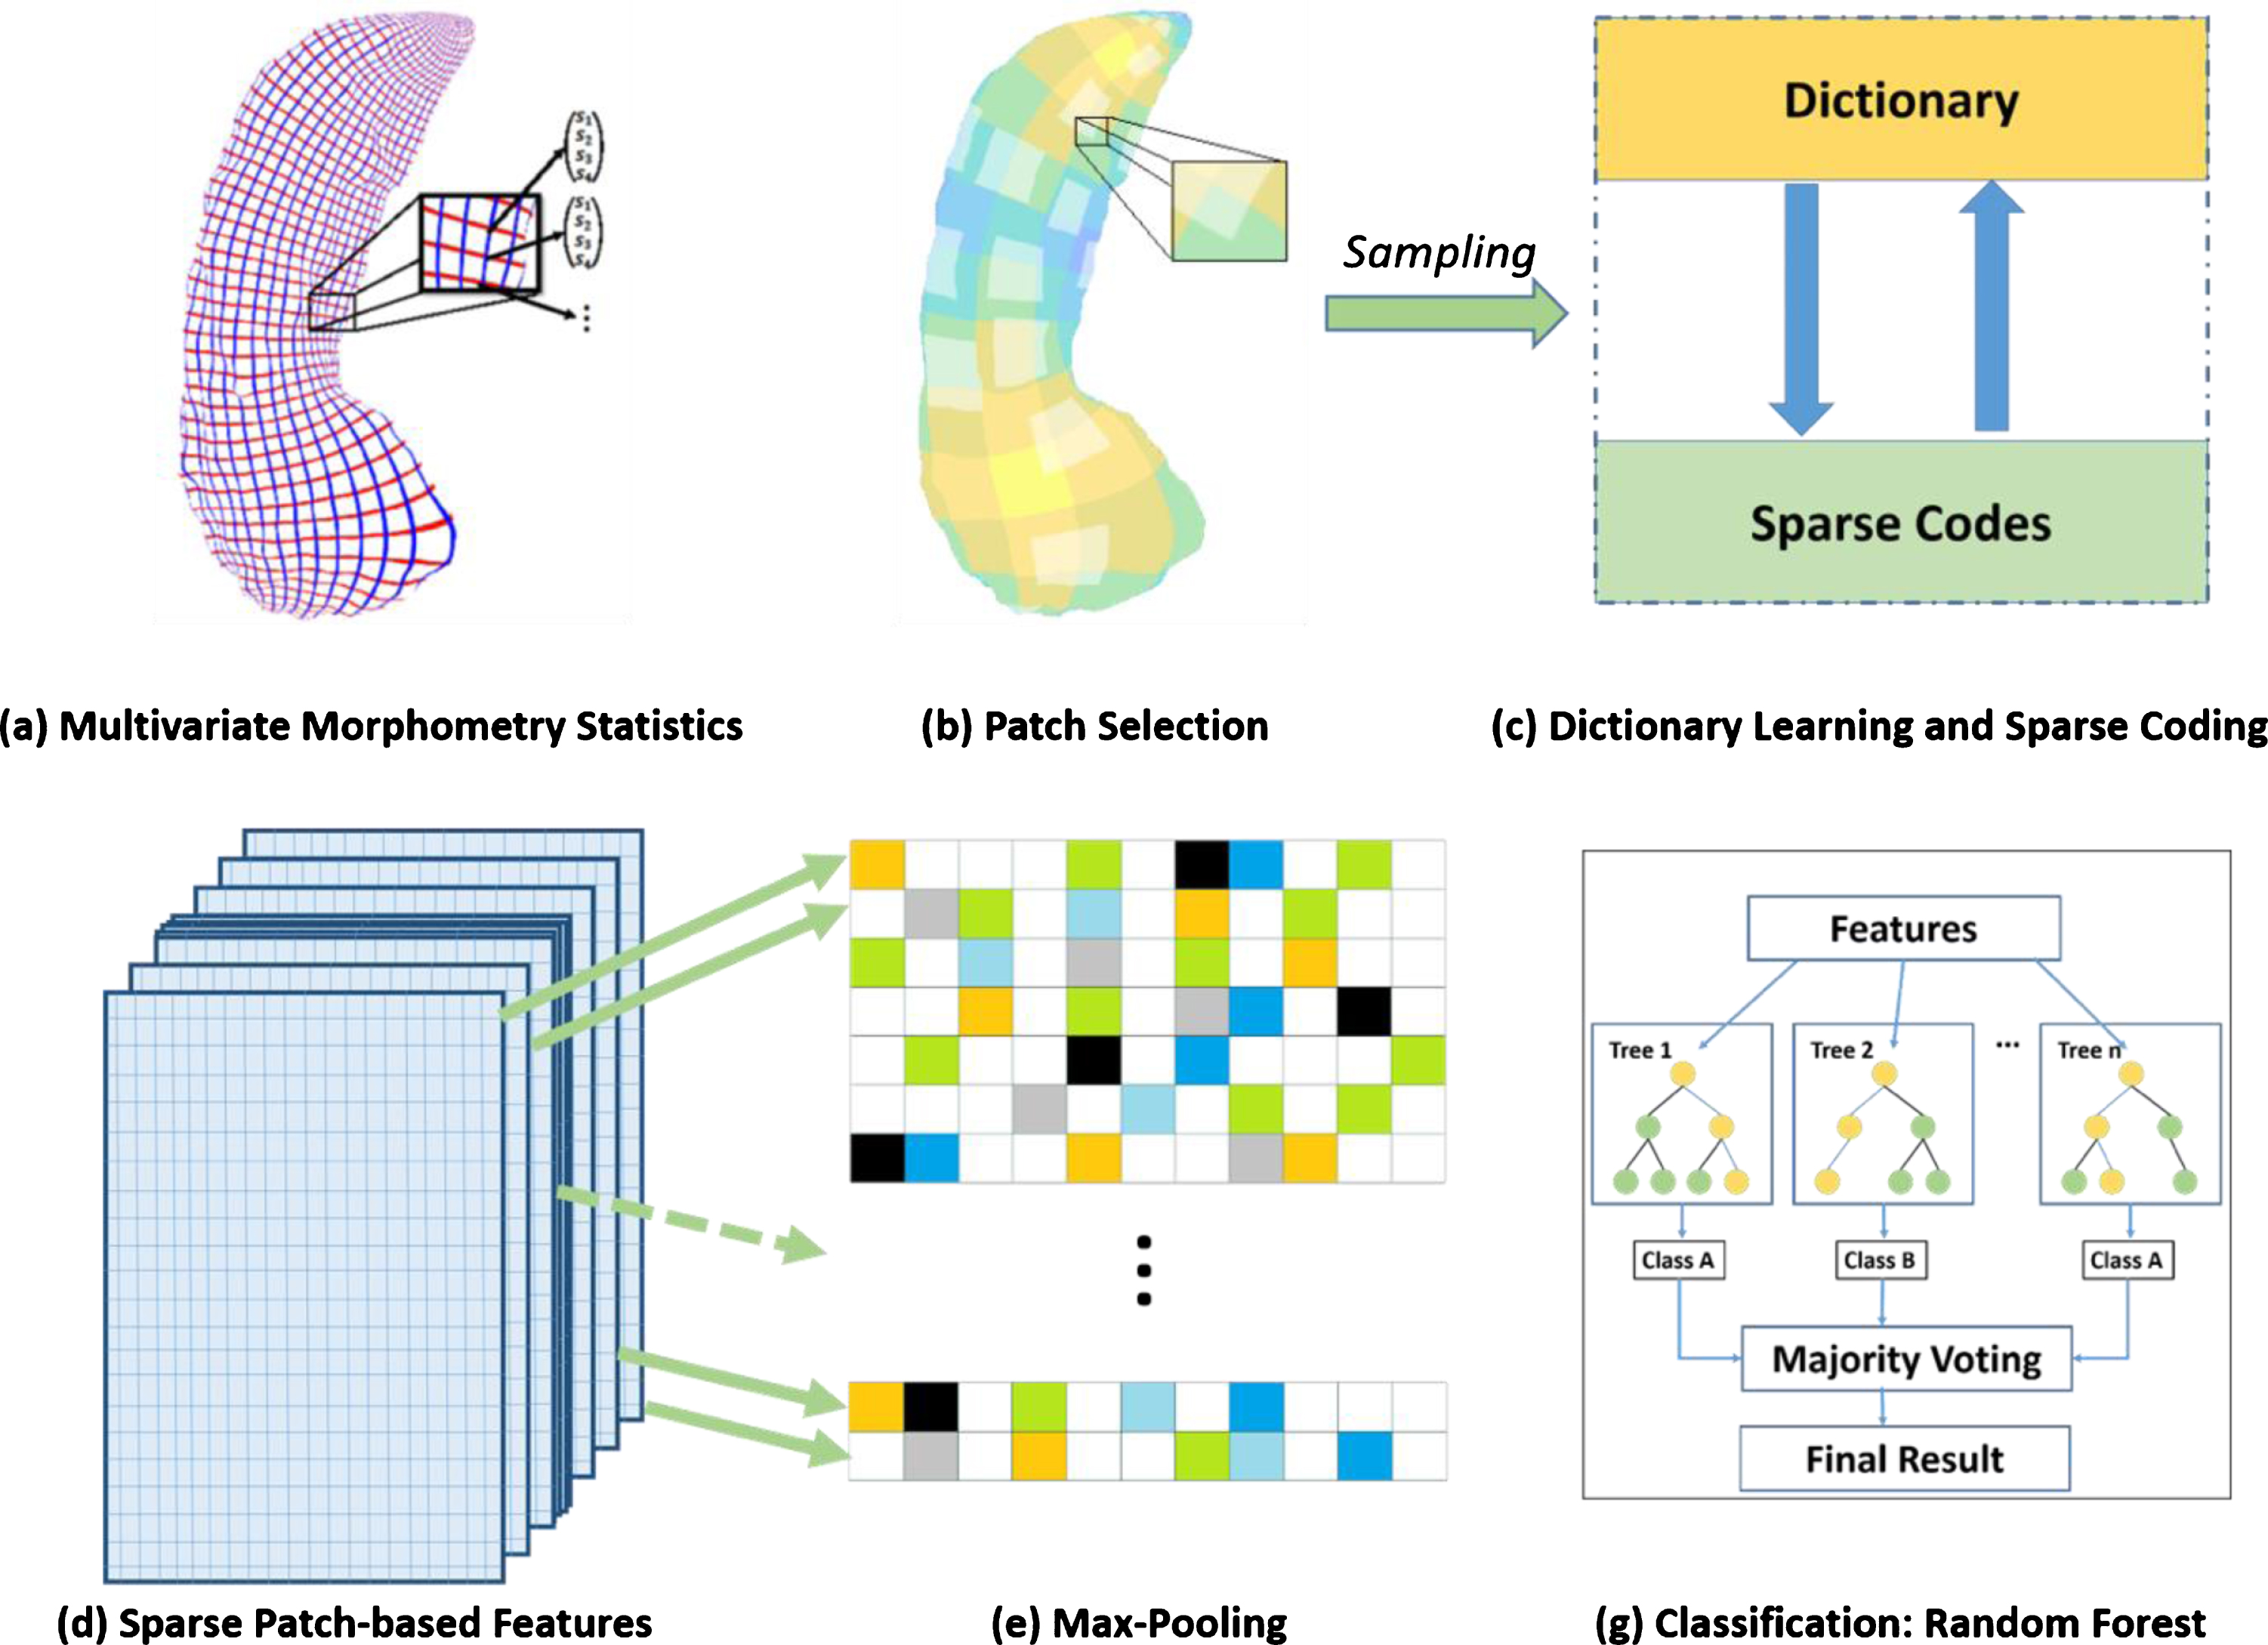
Patch-based sparse coding system. (a) Surface multivariate morphometry statistics. (b) Generate patches and randomly select patches on the surface. (c) Dictionary learning and sparse coding. (d) Sparse patch-based features got from (c). (e) Max-pooling to resize the features in (d). (g) Classification by using random forest classifier with the features after Max-pooling.
Data availability
Any data not published within the article is available, and anonymized data will be shared by request from any qualified investigator.
RESULTS
Characteristics of the progressors and nonprogressors are shown in Table 1. Overall, the ADNI participants were older and had a greater percentage of males and APOE4 non-carriers than the Arizona participants.
Characteristics progressors and nonprogressors at the time of baseline scan
Sex and genotype p-values were calculated by chi-squared tests, Age and education p-values were calculated by t-tests. HM, ɛ4 homozygote; HT, ɛ4 heterozygote; NC, ɛ4 non-carrier; AZ, Arizona cohort; ADNI, Alzheimer’s Disease Neuroimaging Initiative cohort.
Prediction results are shown in Tables 2and 3 . In the Arizona cohort, the prediction result of progression to clinically significant decline using hippo-campal surface MMS features was achieved with 92%accuracy and 89%sensitivity and 95%specificity. The same method with the ADNI cohort achieved 92%accuracy, 88%sensitivity, and 97%specificity. Combining the Arizona and ADNI coh-orts (78 progressors and 80 nonprogressors) achieved 90%prediction accuracy, 90%sensitivity, and 90%specificity.
Experimental results: Arizona and ADNI cohorts (leave-one-out cross-validation)
Multivariate morphometry statistics (MMS) column indicates the classification results with MMS from both left and right hippocampal surfaces while MMS left and MMS right columns are the classification results with MMS from left and right hippocampal surfaces, respectively. AZ, Arizona Cohort; ADNI, Alzheimer’s Disease Neuroimaging Initiative Cohort.
Experimental results: combined cohorts (5-fold cross-validation)
Multivariate morphometry statistics (MMS) column indicates the classification results with MMS from both left and right hippocampal surfaces while MMS left and MMS right columns are the classification results with MMS from left and right hippocampal surfaces, respectively.
A post-hoc analysis using random forest classification and leave-one-out cross-validation showed that AVLT long-term memory (LTM) scores predicted progression with only 74%prediction accuracy (65%sensitivity and 83%specificity) in the Arizona cohort, and 62%prediction accuracy (59%sensitivity and 65%specificity) in the ADNI cohort despite the potential bias of using that same measure (along with other criteria) when making the diagnosis of aMCI. Furthermore, as a comparison to our new methods that utilize surface multivariate morphometry, prediction of aMCI using baseline hippocampal volume, random forest classification with leave-one-out cross-validation in the same data sets yielded only 79%prediction accuracy in the Arizona cohort and 72%in the ADNI cohort (Table 4).
Hippocampal volume prediction using random forest classifier and leave-one-out cross-validation
*The automated brain mapping algorithmic program FreeSurfer (http://surfer.nmr.mgh.harvard.edu/) was used to pre-process MRI volumetric data.
DISCUSSION
This study extended previous work by showing that combining hippocampal surface MMS and machine learning methods affords improved prediction of imminent clinically significant cognitive decline compared to typical automated volumetric MRI methods and standard statistics. Our methods achieved high prediction accuracy in two separate and independent data sets, each balanced for age, sex, and presence or absence of the APOE4 allele, even in the absence of other brain imaging or fluid biomarkers of AD. Furthermore, we retained accuracy when the two data sets, which differed from each other in age, sex, and percentage APOE4 carriers, were combined. The predictions using hippocampal surface MMS and machine learning methods were also much better than predictions using either hippocampal volume or baseline cognitive scores, even though the latter are biased due to the circularity of using the same measure when making the diagnosis of aMCI. Although lacking amyloid and tau biomarker confirmation of AD pathology in this study, the data set from Arizona is well-defined, with high confidence regarding the likelihood of AD in those who subsequently developed aMCI. Thus far, the majority of those in the Arizona progressor group later developed definite or probable AD, with the exception of one person who developed dementia with Lewy bodies and one aMCI individual who 2 years later had slight improvement in cognition. Although we do not know how many of those in the nonprogressor group will ultimately develop AD, we have high confidence that none developed MCI for 4 years following the scan. To date, 3 in the Arizona nonprogressor group subsequently developed MCI and none have progressed to dementia. Thus, the training and testing groups were well defined and mostly accurate, which mirrors the accuracy of our novel feature-based sparse coding methods. Instead of using the automated brain mapping algorithmic programs FreeSurfer (http://surfer.nmr.mgh.harvard.edu/) and Statistical Parametric Mapping (http://www.fil.ion.ucl.ac.uk/spm/) as we did in our prior study with the same data set [4], in this study we utilized arguably more sensitive methods involving MMS to discover subregional hippocampal surface differences, patched-based sparse coding for feature selection, and the random forest machine learning classifier. We were able to replicate our improved results in a completely independent data set from ADNI that differed from the Arizona data set in age, sex, and percentage APOE4 carriers.
Because the Arizona data set was identical to our prior study [4], the improved accuracy in this study can be explained by our use of hippocampal surface MMS combined with patch-based sparse coding algorithms. Similar to the methods from our most recent work [36], in this paper we propose a novel Patch Analysis-based Surface Correntropy-induced Sparse coding, PASCS, to help predict future cognitive decline. We demonstrate that PASCS is surprisingly useful for surface features classification and surface multivariate morphometry statistics features consisting of surface multivariate tensor-based morphometry and radial distance (the distance from the medial core to each surface point), and we also move a step forward from group difference to that of individual subject classification. Unlike other sparse coding work [37–40], PASCS takes advantage of surface morphometry features that practically encode neighboring intrinsic 3D geometry information. Meanwhile, MMS features also benefit from the succinct representation and strong discrimination power that sparse coding provides for effective AD classifications, i.e., capturing more important information so that MMS features not only have the significant group difference but also have an effective classification power.
In this work, we adopted FIRST for hippocampus segmentation, which, having previously explored different segmented hippocampal data as input, appears to most reliably generate topologically sound segmentation results. For example, our earlier work used manually segmented hippocampi to build surface meshes [26, 45]. Later, we adopted FIRST for automatic hippocampus segmentation [6] and used it in almost all our hippocampal morphometry research. Meanwhile, we also used FreeSurfer segmented hippocampi to build hippocampal surface meshes [17]. All achieved reasonable results in group difference studies, thus demonstrating that our pipeline is robust to segmentation methods. However, FIRST can always generate topologically sound segmentation results, whereas FreeSurfer does not guarantee topologically correct results. Therefore, manual quality control is necessary to incorporate FreeSurfer in our pipeline. Thus far, our related prediction/classification work adopted FIRST segmented hippocampal surfaces in order to more efficiently work with relatively large-scaled datasets [10, 11]. Since the input of our MMLC is the surface features rather than the output from segmentation tools, it is reasonable for us to expect that our method is not sensitive to the hippocampus segmentation tools used.
To evaluate the influence of these random-select patches on the classification accuracy and the stability of our framework, we repeated the experiments ten times with ten different patch selection on both sides of the hippocampal surface. The mean and standard deviation of the results are shown in Table 5. The results show our method is relatively stable with different patch selection and comparable to the best accuracy results reported in Tables 2and 3 . It is worth noting that the variance results were not purely caused by the patch selection, since other components in the pipeline, such as random forest and cross-validation parts, may also perturb the final results. For example, during the training of random forest, the classifier will randomly select a subset of features to build a decision tree. Similarly, in the 5-fold cross-validation, the training data may be different. Considering the small dataset size in the current experiments, the minor variance in our results demonstrates that the influence of random patch selection is in a reasonable range and does not appreciably affect the stability of the results. In future, we will further explore the random patch selection issue with larger imaging cohorts.
Classifications for 10 different patch selections
We repeated the experiments ten times with ten different patch selections on both sides of the hippocampal surface. The left and middle columns of the table indicate the classification results for the AZ cohort and ADNI cohort respectively with leave-one-out cross-validation. The last column shows the results for the combined cohorts with 5-fold cross-validation. SD, standard deviation.
Future directions will include integrating convolutional neural network (CNN) with our proposed ap-proach. CNN is considered one of the most successful deep models for identifying, classifying, and quantifying patterns in medical images [46, 47]. Based on promising results from our most recent work [48, 49], integrating CNN with the proposed approach could further improve the PASS results. Specifically, we applied CNN and an unsupervised learning method (multi-task stochastic coordinate coding) algorithm to the ADNI dataset to predict future cognitive clinical measures with baseline hippocampal/ventricle mTBM features and cortical thickness, achieving accurate predictions of MMSE/ADAS-Cog scales [48, 49]. However, there is a trade-off between com-putation efficiency and prediction performance. Training a CNN model usually requires substantial computational resources (multiple GPUs). Our PASS-MP is a generative toolbox for brain image analysis with fast running time and does not require GPU for training. It can apply to different subcortical of brain images with relatively high performance. We therefore will continue to explore the efficient CNN based sparse coding method that could both improve the prediction power and maintain a low-cost of computational resources and fast running time as PASS-MP for better help with clinical diagnosis and prognosis.
Although there are many other sensitive biomarkers to detect the pathology associated with AD, this method capitalizes on MRI scans, which is a clinical diagnostic capability that virtually all clinicians have access to. Further testing is needed to verify the results in larger data sets, but our method appears to accurately predict whether an individual will progress to the clinical stages of AD within the next 2 years. Thus, this method has the potential to be developed into a clinically useful tool. We currently have no proven medication treatments for AD; however, well-tested behavioral programs that provide lifestyle and behavioral training to adapt to memory loss associated with MCI are available [50]. These behavioral programs appear to be most effective when done prior to significant memory decline [51]. If we had an accurate and inexpensive tool to predict likelihood of clinically significant decline, we could target those individuals who would most benefit from a similar intervention that is delivered preclinically.
Limitations of this study include relatively small numbers of progressors and nonprogressors in both cohorts and thus this method will need to be replicated in other, larger data sets. Importantly, we also did not include other biomarkers such as amyloid or tau to verify that progressors had MCI due to AD or include other imaging, CSF, and emerging, less expensive and more scalable blood-based biomarkers of amyloid, tau, and neurodegeneration [1–3], and future applications of this technique should do so to ensure accurate training sets and generalizable results. However, we were interested in seeing the “added value” of this MRI based image analysis technique as a complement to those emerging methods. We did not test brain regions other than hippocampus, but the purpose of this study was to evaluate the utility of prediction using hippocampal surface multivariate morphometry statistics combined with patch-based sparse coding algorithms. It was therefore convenient to compare these methods using the same data set that we had previously evaluated with standard automated brain mapping algorithmic programs, binary logistic regression, and leave-one-out procedures. Also, our previous study did explore other imaging-based biomarkers and found that the hippocampus was the best predictor 2 years prior to clinically significant decline (including both FDG-PET and MRI biomarkers). Finally, because of the overlapping patch selection and max-pooling scheme, we generally cannot visualize the selected features, which may decrease the interpretability of biomarkers and, in turn, translation to clinical applications. However, we can always visualize statistically significant regions using group differences [6]. In addition, our recent work [52] better addresses this problem with the adoption of group lasso screening [53] to select the most significant features. It was not adopted in our current study because of its relatively small sample size. In the future, we will incorporate this approach into our current framework to improve its interpretability.
Footnotes
ACKNOWLEDGMENTS
The authors thank Bruce Henslin and Kathryn DeMarco for their help with data management. This work was supported by NIH APOE4 grant, “Brain Imaging, APOE and the Preclinical Course of Alzheimer’s Disease” (R01AG0311581); ADCC grant “Alzheimer’s Disease Core Center” (P30AG019610); and the State of Arizona. The content is solely the responsibility of the authors and does not necessarily represent the official views of the National Institutes of Health.
Data collection and sharing for this project was funded by the Alzheimer’s Disease Neuroimaging Initiative (ADNI) (National Institutes of Health Grant U01 AG024904) and DOD ADNI (Department of Defense award number W81XWH-12-2-0012). ADNI is funded by the National Institute on Aging, the National Institute of Biomedical Imaging and Bioengineering, and through generous contributions from the following: AbbVie, Alzheimer’s Association; Alzheimer’s Drug Discovery Foundation; Araclon Biotech; BioClinica, Inc.; Biogen; Bristol-Myers Squibb Company; CereSpir, Inc.; Cogstate; Eisai Inc.; Elan Pharmaceuticals, Inc.; Eli Lilly and Company; EuroImmun; F. Hoffmann-La Roche Ltd and its affiliated company Genentech, Inc.; Fujirebio; GE Healthcare; IXICO Ltd.; Janssen Alzheimer Immunotherapy Research & Development, LLC.; Johnson & Johnson Pharmaceutical Research & Development LLC.; Lumosity; Lundbeck; Merck & Co., Inc.; Meso Scale Diagnostics, LLC.; NeuroRx Research; Neurotrack Technologies; Novartis Pharmaceuticals Corporation; Pfizer Inc.; Piramal Imaging; Servier; Takeda Pharmaceutical Company; and Transition Therapeutics. The Canadian Institutes of Health Research is providing funds to support ADNI clinical sites in Canada. Private sector contributions are facilitated by the Foundation for the National Institutes of Health (![]() ). The grantee organization is the Northern California Institute for Research and Education, and the study is coordinated by the Alzheimer’s Therapeutic Research Institute at the University of Southern California. ADNI data are disseminated by the Laboratory for Neuro Imaging at the University of Southern California.
). The grantee organization is the Northern California Institute for Research and Education, and the study is coordinated by the Alzheimer’s Therapeutic Research Institute at the University of Southern California. ADNI data are disseminated by the Laboratory for Neuro Imaging at the University of Southern California.