
Abstract
Background:
In recent years, many convolutional neural networks (CNN) have been proposed for the classification of Alzheimer’s disease. Due to memory constraints, many of the proposed CNNs work at a 2D slice-level or 3D patch-level.
Objective:
Here, we propose a subject-level 3D CNN that can extract the neurodegenerative patterns of the whole brain MRI and converted into a probabilistic Dementia score.
Methods:
We propose an efficient and lightweight subject-level 3D CNN featuring dilated convolutions. We trained our network on the ADNI data on stable Dementia of the Alzheimer’s type (sDAT) from stable normal controls (sNC). To comprehensively evaluate the generalizability of our proposed network, we performed four independent tests which includes testing on images from other ADNI individuals at various stages of the dementia, images acquired from other sites (AIBL), images acquired using different protocols (OASIS), and longitudinal images acquired over a short period of time (MIRIAD).
Results:
We achieved a 5-fold cross-validated balanced accuracy of 88%in differentiating sDAT from sNC, and an overall specificity of 79.5%and sensitivity 79.7%on the entire set of 7,902 independent test images.
Conclusion:
Independent testing is essential for estimating the generalization ability of the network to unseen data, but is often lacking in studies using CNN for DAT classification. This makes it difficult to compare the performances achieved using different architectures. Our comprehensive evaluation highlighting the competitive performance of our network and potential promise for generalization.
INTRODUCTION
Dementia of the Alzheimer’s type (DAT) begins with an asymptomatic phase where pathophysiological changes accumulate without clinical manifestation of cognitive symptoms. Over time, the disease slowly progresses to a symptomatic phase where cognitive impairment becomes evident and cognitive function gradually declines. While there is currently no cure for the disease, accurate diagnosis of DAT is crucial for inclusion in clinical trials. Current neuroimaging strategies for diagnosing DAT include the use of structural magnetic resonance imaging (MRI). This is due to the fact that MRI studies have uncovered DAT-related volumetric atrophy and cortical thinning specifically in the medial temporal lobes, entorhinal cortex, hippocampal and amygdala structures [1–5].
Numerous DAT detection frameworks using MRI and machine learning have been developed. These frameworks typically consist of a region-based feature extractor and a classifier. The feature extractor takes an input image, performs segmentation, and computes measurements of volume and cortical thickness of pre-defined brain regions. The classifier then uses the extracted volume and cortical thickness features to decide whether a given MRI image belongs to an individual with DAT. Such methods have been successful in DAT detection, with many studies reporting high accuracies [6–8].
More recently, convolutional neural networks (CNN) have been proposed for the detection of DAT. Contrary to the conventional framework, CNN can learn feature representations and class discriminative patterns directly from an image and simultaneously acts as a feature extractor and a classifier. Thus, a CNN approach can eliminate the need to perform segmentation of region-of-interest (ROI). This is desirable because segmentation is a challenging task especially when structural atrophy is present. Earlier CNN studies have focused on applying 2D CNNs on 2D MRI slices by borrowing from existing CNN architectures that have shown great success in natural image classification task [9, 10]. However, 2D CNNs cannot fully capture the spatial three-dimensional information that is available in a 3D MRI. Later, some studies focused on applying 3D CNNs on 3D MRI patches [11–13]. But this approach shares the same disadvantage as the 2D slice-level approach. The main reason for using 3D MRI patches as inputs is motivated by hardware limitation and memory constraints. Subject-level 3D CNN approach where a whole brain MRI image is used as an input usually presents higher computational costs in both memory usage and training time.
Here, we propose a fast and lightweight 3D CNN that can be applied on the whole brain 3D MRI image to output a dementia probability score, which can then be thresholded to achieve a classification. We use a small number of layers with dilated convolutions instead of a large stack of convolutional layers to increase the receptive field more efficiently. This allows the network to incorporate information from a large neighborhood in a fast manner. We also use convolutions without padding to reduce the size of the learned spatial features, thereby reducing memory usage.
Our network has a small number of layers and learnable parameters, thus the training process can be completed in a relatively shorter amount of time. We trained our network on stable normal controls (sNC) and stable DAT (sDAT) images obtained from the Alzheimer’s Disease Neuroimaging Initiative (ADNI) database. Importantly, we performed independent testing of our network by using three publicly available datasets [Australian Imaging Biomarkers and Lifestyle flagship study of ageing (AIBL), Open Access Series of Imaging Studies (OASIS), and Minimal Interval Resonance Imaging in Alzheimer’s Disease (MIRIAD)]. We also evaluated our network on images at various stages of the disease. These extensive and independent tests set a benchmark that can be useful for future comparisons with other models. We show that our proposed novel 3D CNN network can achieve high predictive performances and we provide visualizations to show the validity of the spatial patterns captured by our network.
MATERIALS AND METHODS
Data
The training data used in the preparation of this article was obtained from the ADNI database (http://adni.loni.usc.edu). The ADNI was launched in 2003 as a public-private partnership, led by principal investigator Michael W. Weiner, MD. The primary goal of ADNI has been to test whether serial MRI, PET, other biological markers, and clinical and neuropsychological assessment can be combined to measure the progression of mild cognitive impairment (MCI) and early Alzheimer’s disease. Full details of subject recruitment, scanning protocols and diagnostic criteria are available on http://www.adni-info.org. The data used for independent testing was collected by the AIBL study group. AIBL study methodology has been reported previously [14]. Data obtained from the OASIS and MIRIAD were also used for independent testing [15, 16].
Database stratification
To represent various stages along the DAT continuum, we stratified the images collected in a given MRI study into seven subgroups: stable NC (sNC), unstable NC (uNC), stable MCI (sMCI), progressive MCI (pMCI), early DAT (eDAT), and stable DAT (sDAT) [4, 17]. The first three subgroups (sNC, uNC, sMCI) represent subjects without DAT-related pathophysiological changes. These subjects do not have a diagnosis of DAT during the study window. These include subjects with normal and preserved cognitive abilities (sNC), subjects with stable MCI (sMCI), and subjects with declining cognitive abilities whose diagnosis converted from NC to MCI during the study window (uNC). The remaining four subgroups (pNC, pMCI, eDAT, and sDAT) represent the DAT spectrum that spans from clinically asymptomatic to severely impaired. Considering that the clinical diagnosis of DAT is often achieved late in the disease progression when cognitive abilities have become significantly impaired, sDAT represents images of individuals who joined the ADNI study after they were clinically diagnosed with dementia. For MCI subjects who later progress to dementia, their images acquired before and after conversion are labeled as pMCI and eDAT. Similarly, images of NC subjects acquired before conversion to dementia and after conversion are labeled as pNC and eDAT. Clearly, eDAT signifies an early stage of dementia, and pNC and pMCI signify an even earlier stage of dementia.
We used the baseline and longitudinal images of the ADNI sNC and sDAT subjects to train and evaluate our network via subject-level stratified 5-fold cross-validation to deliver a probability of Alzheimer’s dementia score. The remaining ADNI uNC, sMCI, pNC, pMCI, and eDAT images were utilized to assess whether our proposed network can generalize to completely unseen images along the DAT continuum. We also stratified the AIBL and OASIS subjects into these seven subgroups to further evaluate whether our network can generalize to images displaying varying levels of atrophy and images acquired using different hardware and imaging protocols. Demographic details of all datasets are presented in Table 1.
Demographic details of ADNI, AIBL, OASIS, and MIRIAD subjects
MRI image pre-processing
The pre-processing steps we employed are mainly aimed at standardizing the pose of the MRI images. The maximum voxel size of ADNI T1 MRI data in any one direction is 1.5 mm [18], and the voxel size for the OASIS data is 1.1 mm3 [19]. To ensure unbiased validation result, we resliced the MRI images into a common resolution of: 1.5 mm3 isotropic voxels and applied six degree-of-freedom (DOF) rigid transformation to center and align the brain to the three coordinate axes. In order to estimate the six transformation parameters (three rotations and three translations), we performed skull-stripping using the Freesurfer software package (https://surfer.nmr.mgh.harvard.edu). The skull-stripped images were then registered to the MNI template using the FSL-FLIRT software ([20]; https://fsl.fmrib.ox.ac.uk/fsl/fslwiki/FLIRT). The skull-stripped images were only used for estimating the six pose-transformation parameters, and were not used for training. This is because the skull-stripping step may occasionally over segment or under segment, resulting in portions of the brain being removed or portions of the skull being left intact. The estimated six transformation parameters were used to register the resliced images to the MNI template space. We performed min-max scaling on the registered images to standardize the intensity range to the range between 0 and 1.
Methods
Our proposed network is a 3D CNN that takes a whole brain 3D MRI image as input, analyzes it through a series of convolutional blocks, and generates probabilities scores with DAT probability score of 1 indicating that the given image likely belongs to an individual with DAT.
Network architecture
As illustrated in Fig. 1, our network has a total of nine convolutional blocks. Each of the convolutional blocks is composed of a convolutional layer, an instance normalization layer, and an activation layer that utilizes leaky rectified linear units (ReLu). The convolutional layers in all nine blocks have the same 3×3×3 kernel size; they only differ in terms of number of filters, length of strides, and rate of dilations. The choice of number of filters can affect the capacity of the network to learn complex spatial patterns. It can also lead to overfitting when the number of learnable parameters is too high in comparison with the number of training images. Proper fine-tuning of the number of filters requires a large amount of graphical processing unit (GPU) resources, so we opted to use a simple strategy to select the number of filters. We began with k number of filters for the first layer, then we doubled the number of filters after every n layers, and we set a limit l to be the maximum number of filters that can be used in a layer to keep the network small and compact. In this experiment, we used k = 8, n = 2, and l = 32. As the number of filters increases, the memory footprint of higher-level layers increases. To manage the memory usage, we used a stride of 2 in the first and fourth blocks to progressively downsample the feature maps. Dilated convolution utilizes kernels with holes inserted in them. These holes allow a convolutional layer to regularly skip some of the input voxels and capture patterns from a larger neighborhood. Dilated convolutions were first used to exponentially increase the receptive field of semantic segmentation architectures [21]. A convolutional layer with a dilation rate of 2 has a receptive field size of 5 which is equivalent to the total receptive field size of two consecutive convolutional layers without dilation. By using dilated convolutions, we can expand the receptive field without increasing the number of learnable parameters and without losing spatial resolution. We followed the idea originally introduced by [22] in the Deep Lab V3 for semantic image segmentation task to use consecutive dilated convolution blocks with increasing dilation rate and same stride number in the deeper layers to capture feature maps that capture larger perceptive field. We choose dilation rate of 2,2,3 in the three consecutive blocks to balance the number of reduced parameters and the range of increased perceptive field.

Network architecture with nine convolutional blocks and a total of 137,418 learnable parameters.
In the training of CNN, normalization layers are primarily used to improve the speed of convergence. We used the instance normalization layer in our network because it enables faster training, and it allows us to train the network using a smaller batch size. The instance normalization layer normalizes each channel of each feature map and it does this independently for each training sample using the sample mean and variance [23]. We used the leaky ReLu in our activation layer to avoid the dying ReLU problem where a filter may never activate again over the course of the training process due to instances of large gradients and destructive weight updates [24]. Rather than clamping the negative values to zero, the leaky ReLU has a small positive slope to allow negative values to pass through. The final classification layers are the global average pooling layer and the softmax layer. The global average pooling layer computes the average of the final 9×15×9 feature maps and outputs a feature for each channel. The softmax layer is a 1×1 convolutional layer followed by softmax activation.
Network training
We employed several augmentation and sampling strategies to avoid overfitting. We created slightly perturbed images on-the-fly by applying random left-right flip and translation of maximum 10 voxels in each direction. To train our network to be more robust against scanning conditions, we used all the baseline and follow-up images for the subjects chosen for training. Since not all subjects were scanned at regular intervals, subjects who were scanned more often may exert more influence on the network. In order to prevent this, we created our mini-batch by selecting subjects, and for each subject, we randomly selected 1 timepoint to train on.
Given that our data is imbalanced and that the number of sNC subjects is higher than that of the sDAT subjects, we optimized the weighted binary cross-entropy loss. For the NC class, we used a class weight of 0.43 which was computed by taking the ratio of the number of sDAT subjects over the total number of sNC and sDAT subjects. The DAT class weight of 0.57 was computed in a similar manner. We trained our network using Adam optimizer and a learning rate of 0.0005 for a maximum of 50 epochs [25]. We monitored the performance of our network by using all the baseline and follow-up images belonging to the validation subjects.
Experiments
To evaluate our network, we performed 5-fold cross-validation (CV) by splitting the training ADNI data at the subject-level. This ensures that the training, validation, and testing sets contain mutually exclusive subjects, while splitting the data at the image level will lead to data leakage and inflated performance metrics [26]. We split the ADNI sNC and sDAT subjects into five partitions. In each of the five folds, three partitions were used for training, one partition was used for validation, and the remaining partition was used for testing. Every partition was used once for testing and we reported the average performance achieved on the test partitions.
We performed four additional independent tests to comprehensively evaluate the generalizability of our network. Since the 5-fold CV resulted in five sets of network weights where each one was trained on only a subset (60%) of the ADNI sNC and sDAT subjects, we created an ensemble model that generates class probability scores by simply averaging the scores generated by each of the five network weights. The advantage of the ensemble model is that it makes full use of the training data. We evaluated our ensemble model on the unseen ADNI uNC, sMCI, pNC, pMCI, and eDAT images to test whether our model can generalize to subjects at earlier stages of the disease. Furthermore, we evaluated our model on the AIBL data in an effort to determine whether our network can generalize to images acquired at other sites albeit using similar imaging protocols. We also evaluated our model on the OASIS data which were acquired at other sites using different imaging protocols. A final independent test on the MIRIAD images was conducted to assess the ability of our network in generating reliable and consistent prediction labels within a single day and over short intervals where structural atrophy is not expected.
Network visualizations
We utilized guided-back-propagation and grad-ient-weighted class activation mapping (Grad-CAM) visualization techniques to verify if the DAT-discriminative spatial patterns captured by our network are consistent with the DAT-related structural atrophy patterns reported in the literature. These techniques have been previously used to highlight DAT-discriminative patterns captured using 3D CNNs and FDG-PET images [27]. Given an input image, guided-back-propagation computes and back-propagates the gradients of an output class probability node all the way back to the input layer [28]. Thus, the saliency image generated via guided-back-propagation reflects voxels whose intensity changes affect the output class probability. We computed the saliency maps for the sNC and sDAT images, and we smoothed the saliency maps by applying a Gaussian filter with a sigma of 2.
Grad-CAM works in a similar fashion except that it propagates the gradients of an output class probability node only back to the convolutional layer preceding the global average pooling, and it uses these gradients to weigh each feature maps and outputs a class-discriminative activation map [29]. Thus, the class activation maps generated via Grad-CAM are very small (9×15×9). The advantage of Grad-CAM is that it circumvents the issue of back-propagating gradients which may become discontinuous due to layers of non-linear activations. We computed the class activation maps for the sNC and sDAT images, and we re-sampled the class activation maps using spline interpolation for the purpose of overlaying it on the MRI images.
RESULTS
Cross-validation performance
The classification accuracy, specificity, sensitivity and area under the receiver operating curve (AUC) across all five folds are listed in Table 2. The performance metrics were computed using a threshold of 0.5 such that images assigned with DAT probability score greater than 0.5 were labelled as DAT. On average, the ADNI sNC test images have low DAT probability scores with the scores clustering around a mean value of 0.19. The ADNI sDAT test images have high DAT probability scores that clustered around a mean value of 0.83.
Comparison of published NC versus DAT classification performances
Independent test performances
In Table 3, we present the classification performances achieved via independent testing. For the ADNI nonextreme subgroups, we achieved an overall sensitivity of 75.9%on detecting DAT in subjects at the earliest stages of the disease. The overall sensitivity breaks down to a high sensitivity of 89.1%achieved on the eDAT images, moderate sensitivities of 71.7%, 70.1%, and 68.5%achieved on the pMCI uNC and sMCI images respectively, and a low sensitivity of 29.7%achieved on the pNC images. The performances on the AIBL data are similar to that achieved on the ADNI data. The accuracy is high (>90%) for sNC and sDAT and also for subjects post-conversion to DAT (eDAT), and moderate sensitivity for other groups (70.85%).
Accuracy on independent test images in terms of overall balanced accuracy, specificity, and sensitivity measured separately for each dataset. The sensitivity is further break down by subgroups
On the OASIS data, the model showed very high accuracy (95.6%) on the sNC images, high accuracy on the eDAT and sDAT images (89.3%and 88.1%, respectively), and low to moderate accuracy on other images along the continuum. For the MIRIAD data, we investigated both cross-sectional and longitudinal performances. The model achieved very high (>94%) accuracy on cross-sectional sNC and sDAT images. To explore whether the predictions are stable within short periods of time where structural atrophy is not expected, we computed accuracy on the subject level. In this setting, a subject is correctly classified only if all their scans are assigned the correct labels. The model consistently classified 44 out of 46 sDAT subjects as DAT and 21 out of 23 sNC subjects as NC. In both cases, the model consistently mis-classified 1 subject as either DAT or NC, and the other subject was mis-classified at certain timepoints and correctly classified at other timepoints.
Considering the four independent tests as a whole, the network achieved an overall accuracy, specificity, and sensitivity of 79.5%, 79.5%, and 79.7%, respectively, on the complete set of 7,902 independent test images. In Fig. 2, we show the distribution of the DAT probability scores assigned to the independent test images. The mean probability scores follow the data stratification scheme in an ascending order with the sNC subgroup having the lowest mean probability score (0.18) and the sDAT subgroup having the highest mean probability score (0.85). The sNC, eDAT, and sDAT subgroups, which are near the extreme ends of the spectrum, all have a single large cluster of either low or high probability scores. The other subgroups have probability scores that are more widely distributed. On the task of early diagnosis of DAT, we take a deeper look at the classification performance on the pMCI images. As shown in Fig. 3, we break down the probability score distributions and accuracy performances by the year to conversion which is the number of years elapsed before a clinical diagnosis was changed to DAT. Within 3 years to conversion, the probability scores are relatively high and the accuracy is above 70%. For images acquired 5 years prior to conversion, the probability scores are low and the accuracy is lower than that obtainable by chance.
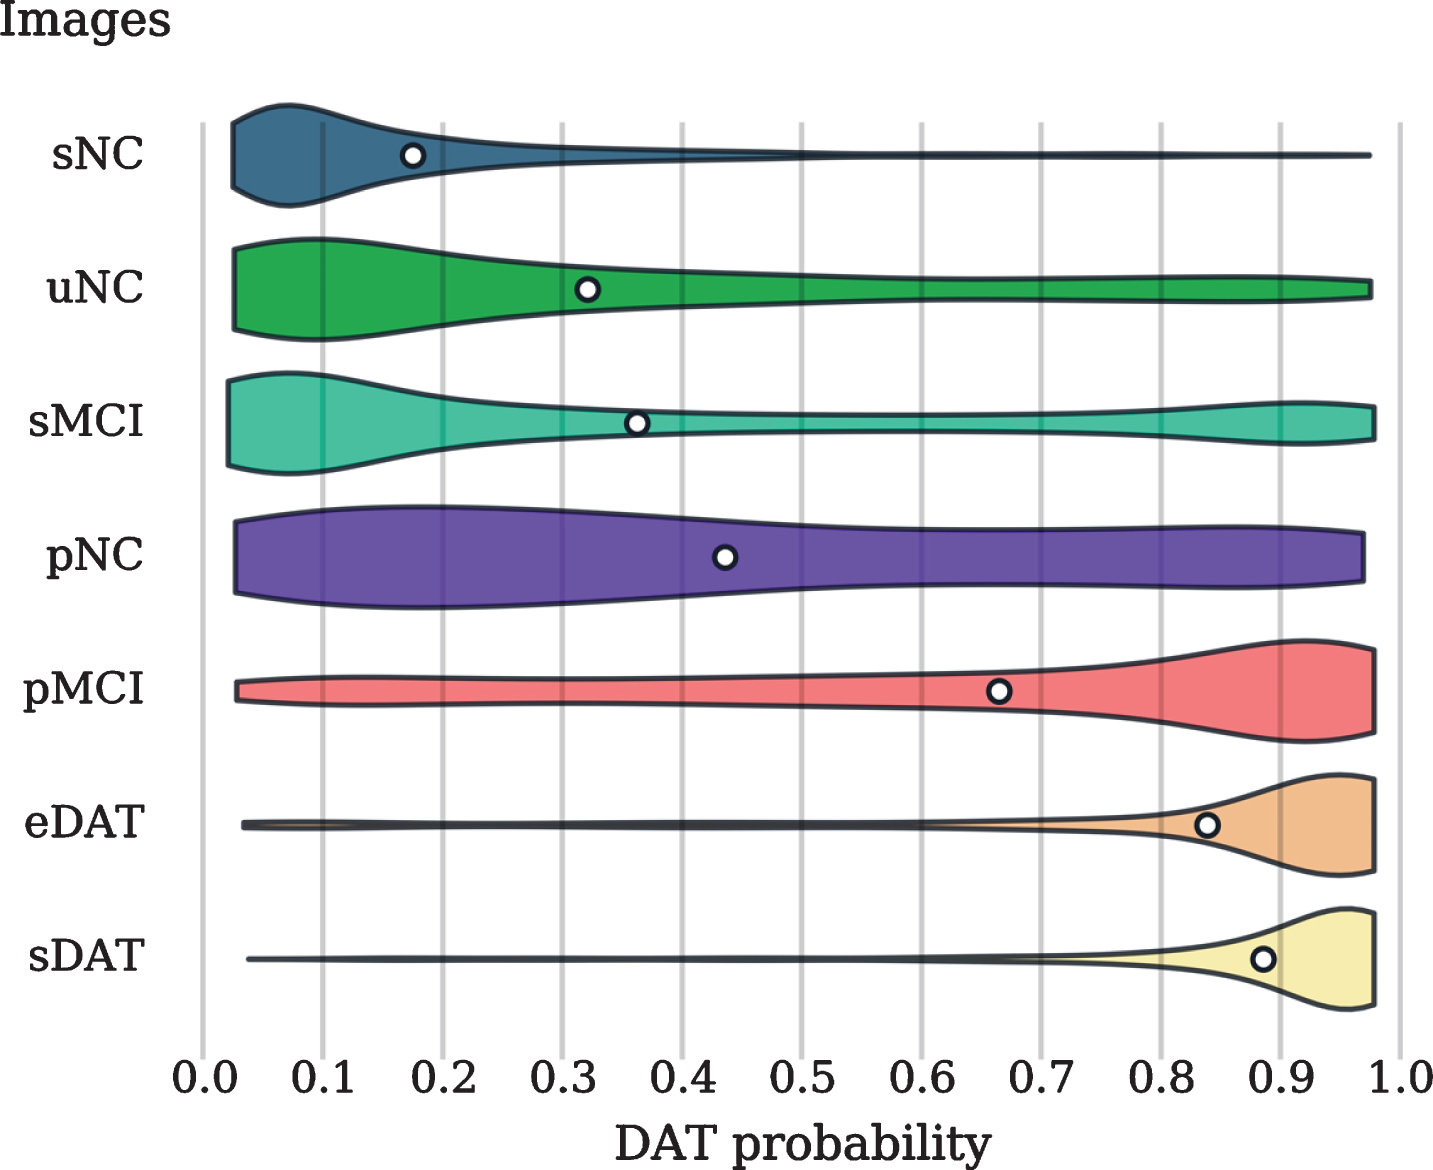
Violin plots showing the distribution of the DAT probability scores assigned to the independent test images. The white circles indicate the mean probability scores.
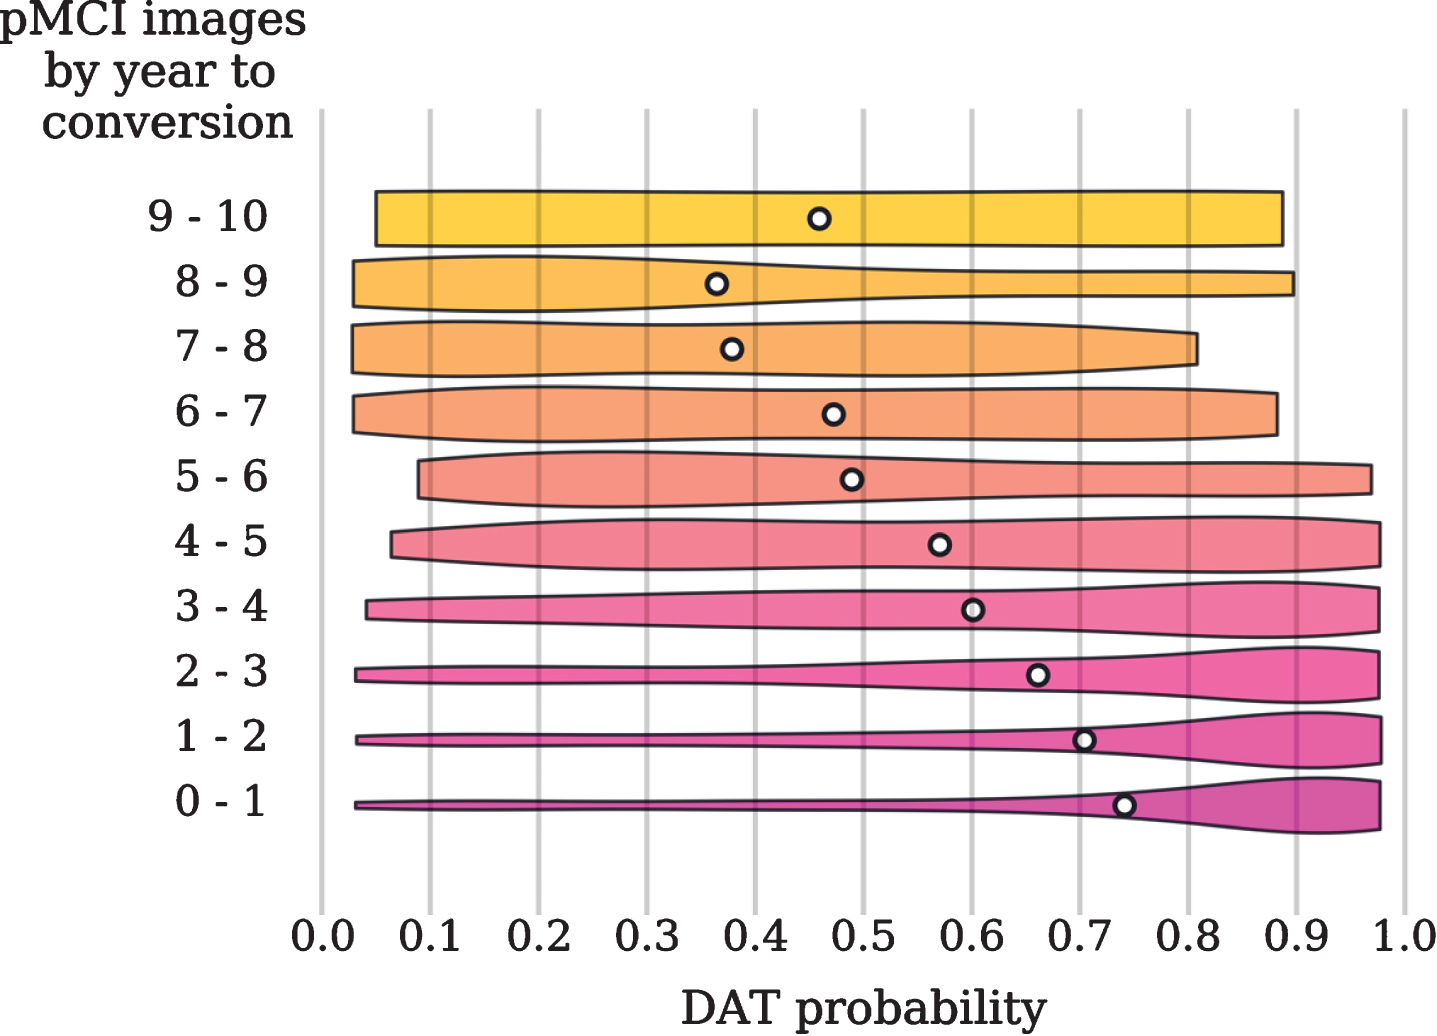
Violin plots showing the distribution of the DAT probability scores assigned to the pMCI images and sorted by the year to conversion. The white circles indicate the mean probability scores.
DISCUSSION
In this paper, we developed a lightweight 3D CNN for the quantification of a 3D subject MRI image into a probability of dementia score, with scores closer to 1 indicating higher probability of DAT. The scores thresholded at 0.5 then provided a binary classification. Our 3D CNN network features the use of dilated convolutions. Dilated convolution uses kernels with holes inserted in them to increase the receptive field size. This allows the network to learn DAT-related spatial patterns through a small number of layers and filters. Our sampling strategy allows the network to quickly learn from all training subjects and prevents subjects with multiple scans from heavily influencing the network. During each training epoch, we randomly selected one scan from every subject. The combination of compact architecture and subject-level sampling enables faster training and prevents overfitting.
Comparison of balanced accuracy achieved on independent datasets (e.g., AIBL and OASIS) for sNC versus sDAT and sMCI versus pMCI classification tasks
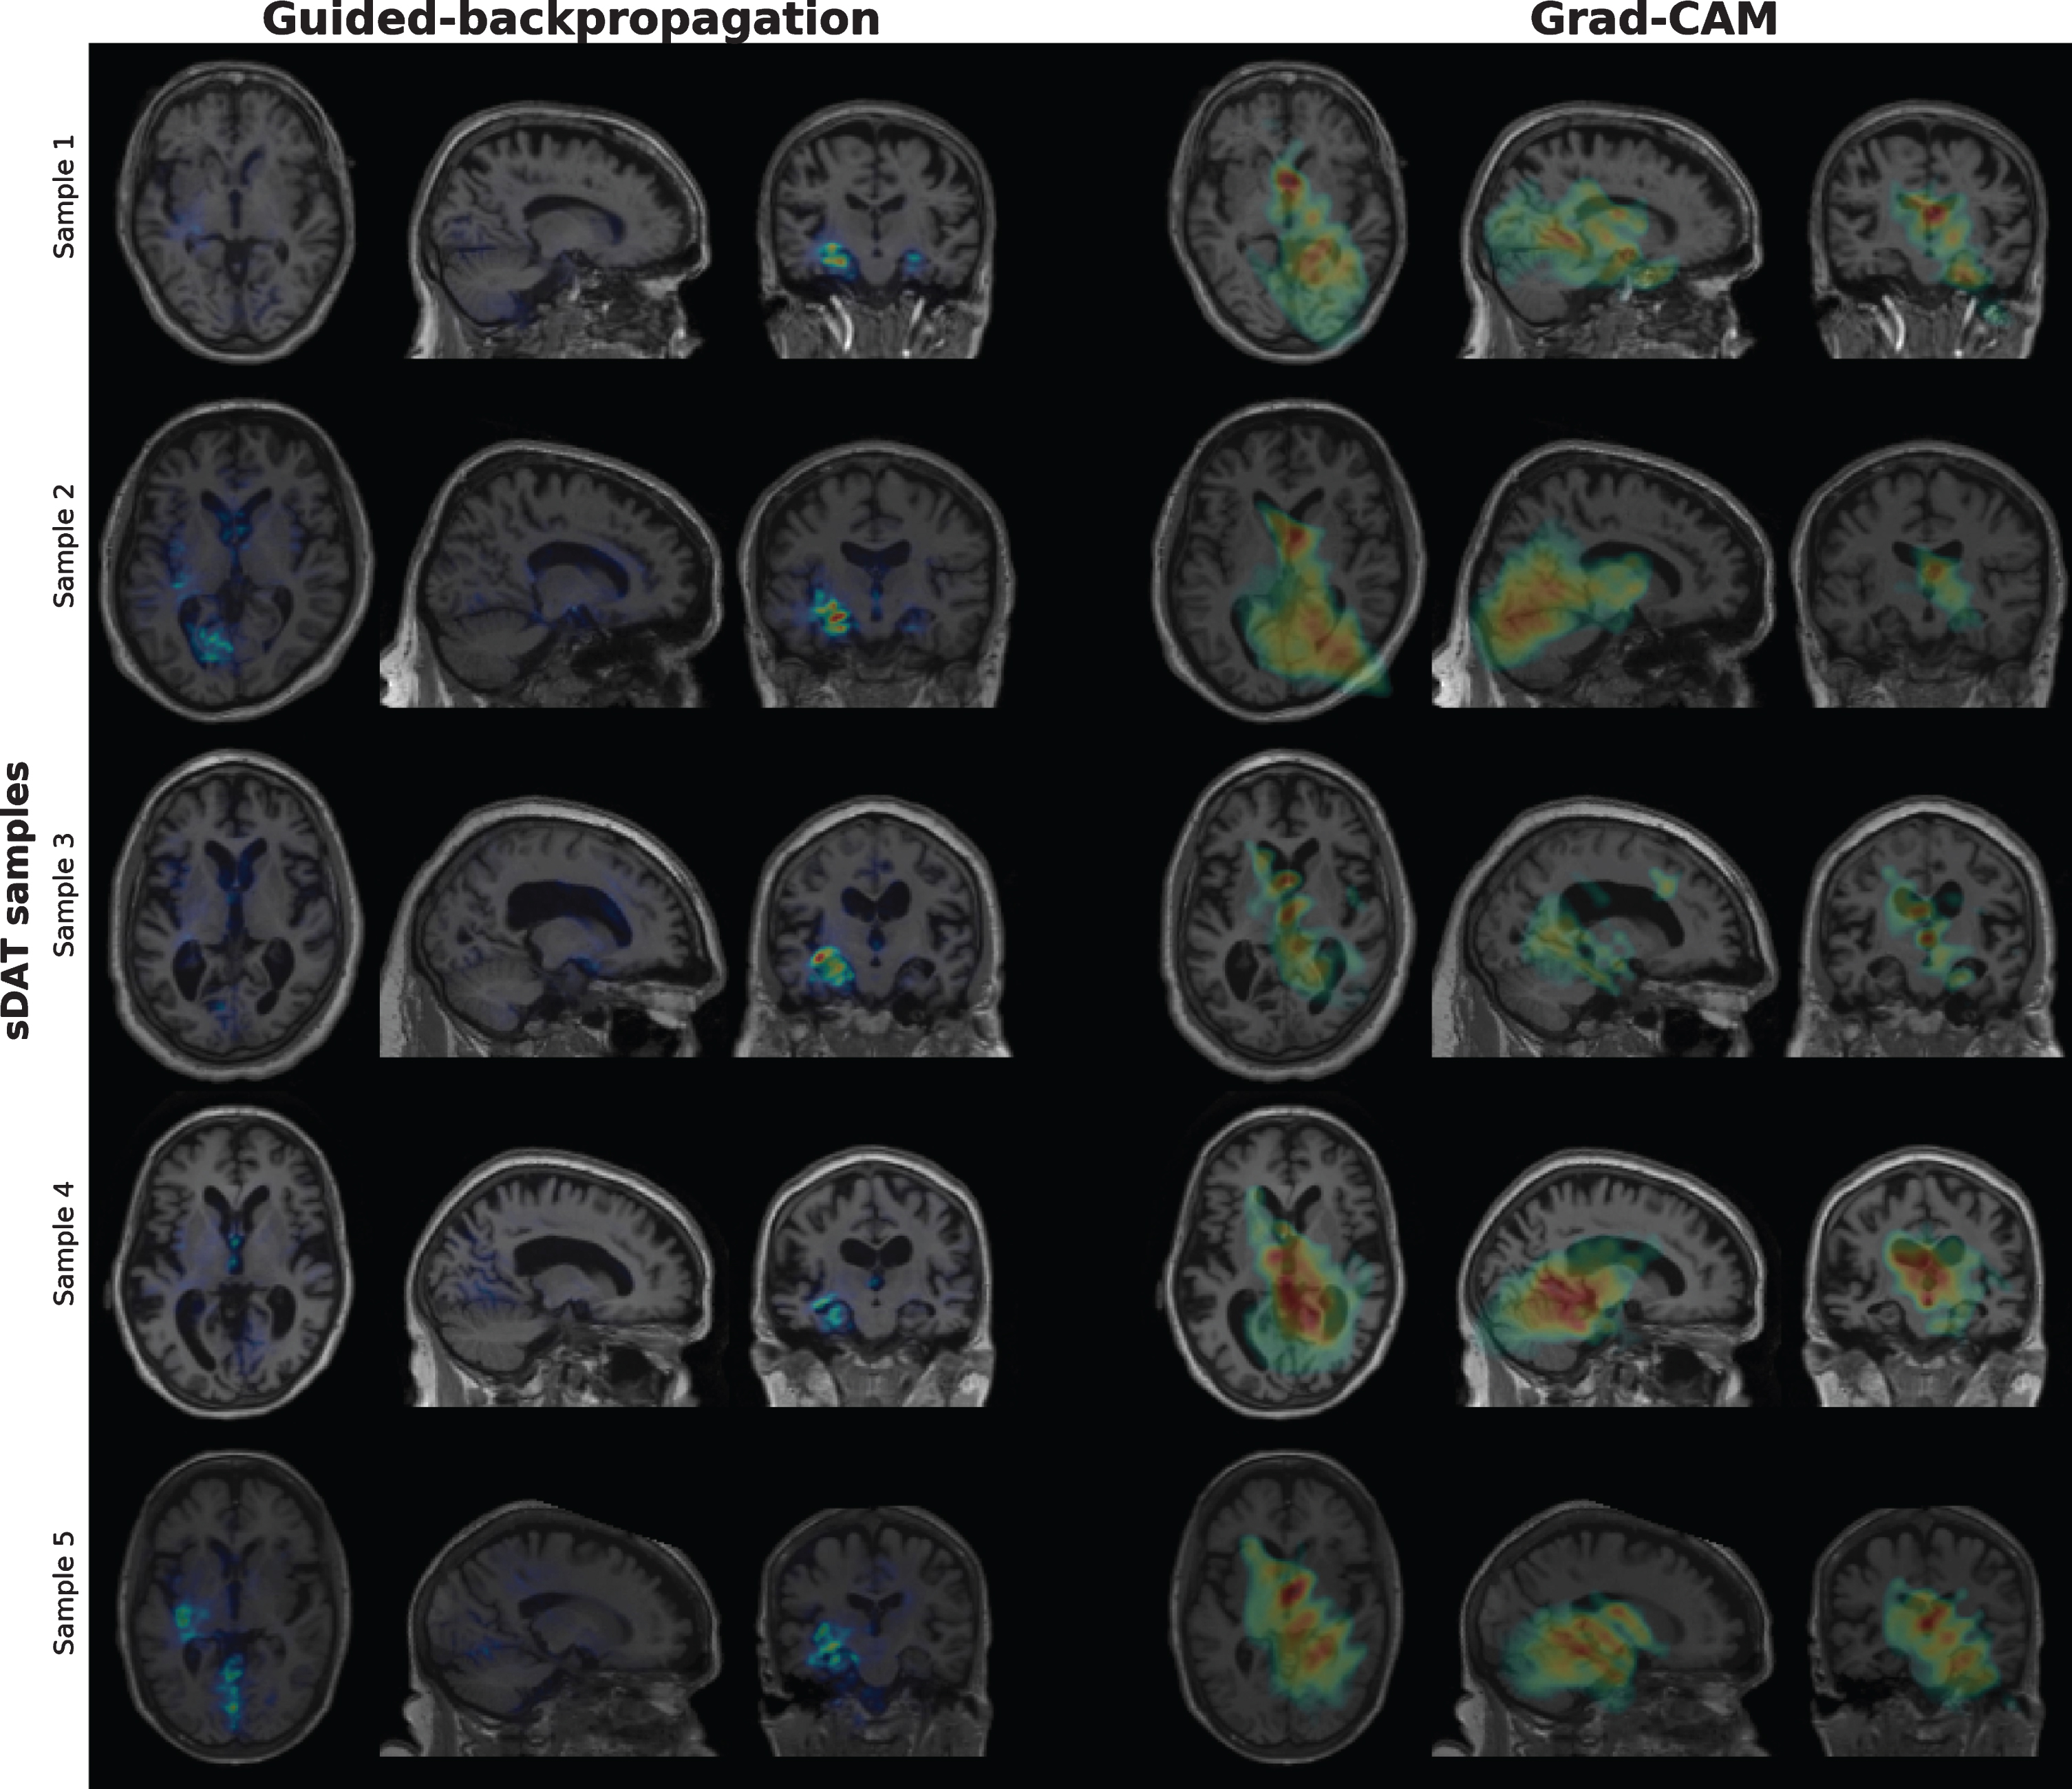
Saliency maps generated via guided-backpropagation and class activation maps generated via Grad-CAM for randomly chosen sDAT images. The saliency maps show that voxels with a large impact on the DAT probability scores are mostly located in the hippocampus. The regions considered most important for predicting the DAT class as highlighted by the class activation maps include the thalamus, hippocampus, and ventricles.
As indicated in Table 2, our 5-fold cross-validated performance is in line with previously reported results. It is difficult to perform more detailed comparison with the classification performances from other studies due to differences in the cross-validation strategies, data split, and number of images used. Many studies have reported high accuracy in differentiating DAT from NC, but very few studies have validated their methods on independent datasets. Furthermore, the accuracies in the more challenging and clinically relevant tasks of differentiating DAT from MCI and pMCI from sMCI are often not reported or are much lower [8]. We emphasize the importance of comprehensive independent testing in providing an unbiased estimate of generalizability and facilitating comparisons with other methods [40, 41]. In Table 4, we compare our method to the very few methods that have been validated on independent datasets. Our method delivers relatively high balanced accuracy across multiple independent datasets for both early (sMCI versus pMCI) and late (NC versus DAT) detection of DAT.
To comprehensively evaluate the generalizability of our network, we performed four independent tests. The first test is performed using images from other ADNI subgroups (uNC, sMCI, pNC, pMCI, and eDAT) whose subjects were never seen by the network during training. These subgroups represent individuals at various stages of the disease and are therefore more representative of the images observed in a real-world clinical setting. It is crucial to perform an independent test on these images to better examine the potential for future clinical utility of the proposed method. On the ADNI data, our network delivers classification accuracy of around 70%in classifying the uNC, sMCI, and pMCI images. The second test is performed on the AIBL data, and the results are comparable with the results achieved on the ADNI data. This indicates that our method can generalize to images acquired at different sites and with different scanners. Similar performances are achieved on the OASIS data, further indicating that our method can generalize to images acquired with different imaging protocols. The last independent test is evaluated on the MIRIAD data where a small number of subjects were scanned multiple times over a short period of time. The performance on the MIRIAD data indicates that our method can generate reliable and consistent predictions over time. Our specificity of 94.7%and sensitivity of 96.8%are slightly higher than the 93%specificity and 95%sensitivity achieved using other methods via independent testing [35, 42].
To understand how our network makes predictions, we visualize the saliency maps generated via guided-backpropagation and the class activation maps generated via Grad-CAM. The saliency maps reflect voxels whose intensity changes lead to changes in the NC probability scores, and the class activation maps reflect regions considered most important for predicting the NC class. While these saliency maps and class activation maps may contain artifacts, they allow us to see if the network is focusing on relevant brain regions. In Fig. 4, we show the saliency maps and class activation maps for some randomly chosen sNC images. Voxels with a large impact on the NC probability scores are mostly located in the hippocampus. To predict the NC class, the network focuses on the spatial and intensity patterns in the regions known to be implicated in DAT such as the thalamus, hippocampus and ventricles. Similar regions are also localized in Fig. 4 for some randomly chosen sDAT images. Consistent with the literature, the visualizations show that the network localized brain regions that are known to exhibit structural atrophy in DAT subjects [43].
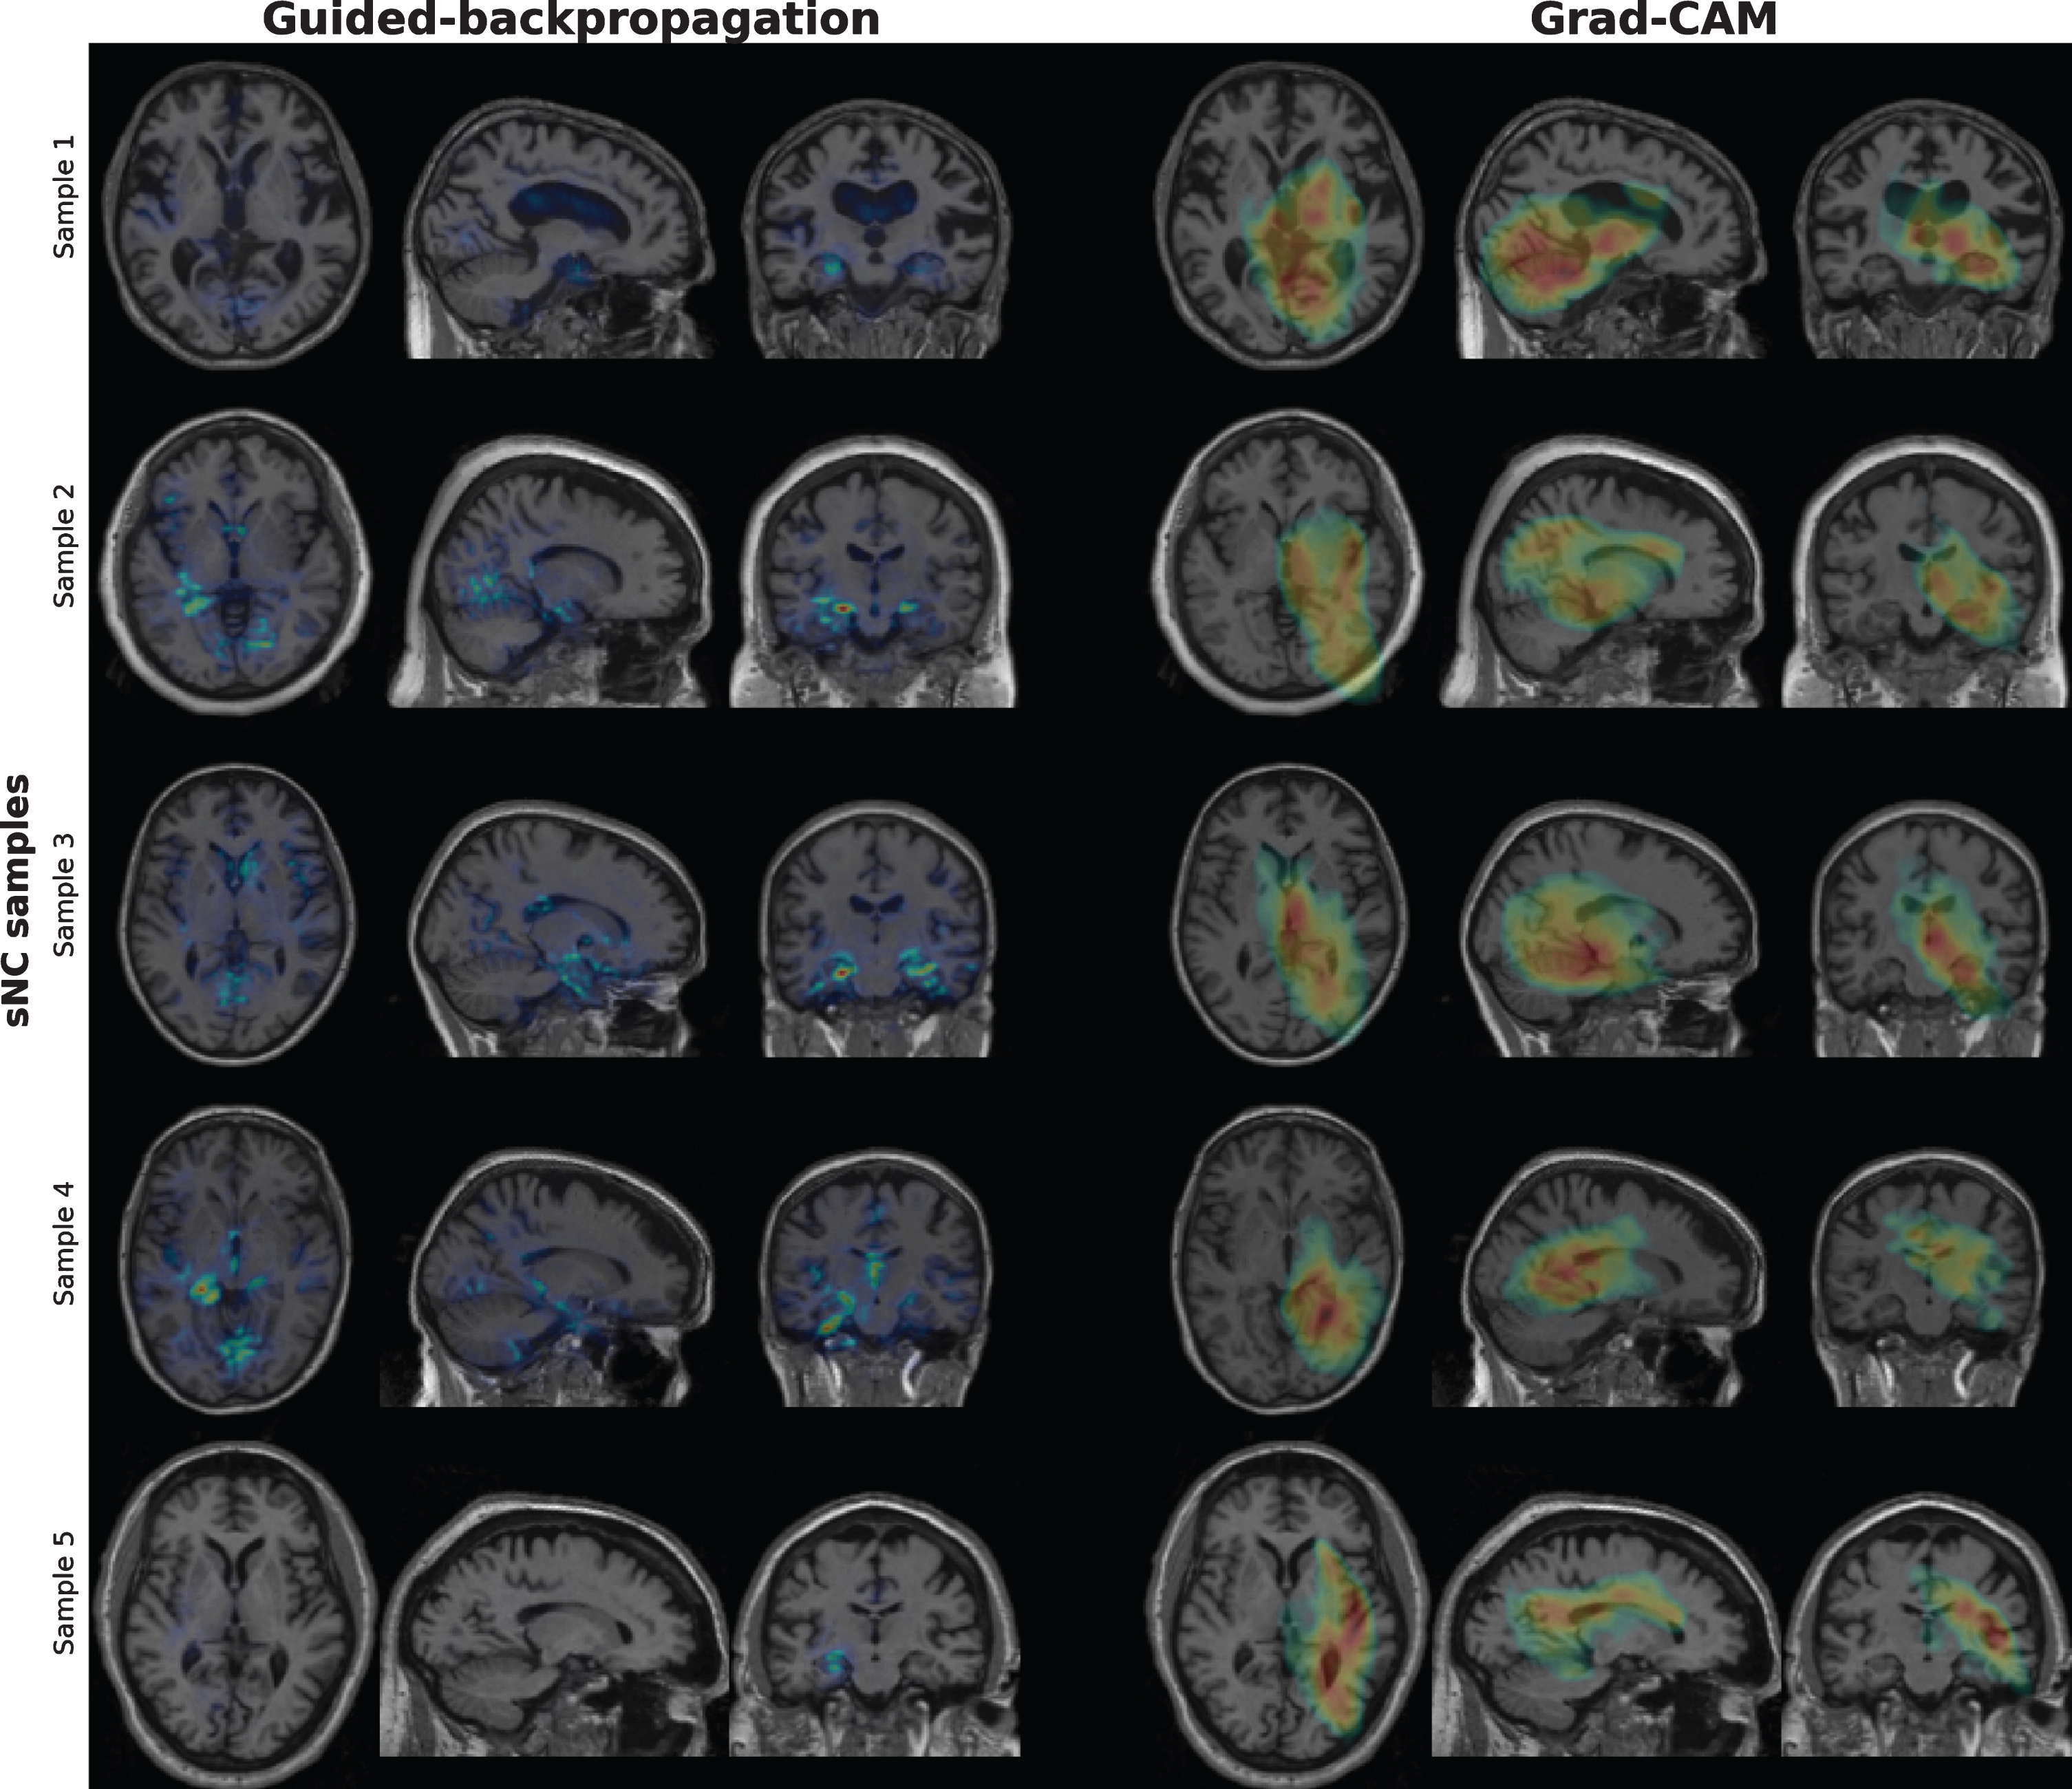
Saliency maps generated via guided-backpropagation and class activation maps generated via Grad-CAM for randomly chosen sNC images. The saliency maps show that voxels with a large impact on the NC probability scores are mostly located in the hippocampus. The regions considered most important for predicting the NC class as highlighted by the class activation maps include the thalamus, hippocampus, and ventricles.
In this study, we implemented the multi-grid me-thod introduced in [22] to include consecutive dilated convolutions with increasing dilate rate and constant stride size in the deeper layers, to achieve the same effect of capturing larger perceptive field as normal convolutional layer with reduced parameters to keep the network light-weight and efficient. Potential further improvement of our implementation of dilated convolutional layer can be made by incorporating the Atrous Spatial Pyramid Pooling (ASPP) layer introduced in the original DeepLabV3 model by [22] to apply the dilated convolution at different scale in parallel, which can then be also combined with image-level features. On the other hand, these improvements potentially require increased number of network parameter, thus may prevent the model to be light-weighted.
Conclusions
Taking into consideration the computational resources required to train neural networks, we developed a lightweight 3D CNN for the classification of DAT using MRI images. Our network is orders of magnitude smaller than existing networks in terms of number of filters. This compact architecture uses dilated convolutions to increase the receptive field more efficiently and to enable faster training. Importantly, we performed extensive evaluation of our network via four independent tests to facilitate comparison with future studies and to examine whether the classification performance can generalize to images displaying varying levels of atrophy and images acquired using different hardware and imaging protocols. Our network delivers reasonable probability scores for each stratified subgroup and showed competitive accuracy in multiple classification tasks including the classification of sMCI, pMCI, and sDAT images.
Footnotes
ACKNOWLEDGMENTS
We thank the Natural Science and Engineering Research Council (NSERC) of Canada, Canadian Institute of Health Research (CIHR), Brain Canada, Alzheimer Society Research Program (ASRP), from Alzheimer Society of Canada, Michael Smith Foundation of Health Research (MSFHR), and the National Institute of Aging (grant R01 AG055121-01A1) for funding this research. we thank Compute Canada for providing the computational infrastructure used in this study.
Part of the data collection and sharing for this project was funded by the Alzheimer’s Disease Neuroimaging Initiative (ADNI) (National Institutes of Health Grant U01 AG024904) and DOD ADNI (Department of Defense award number W81XWH-12-2-0012). ADNI is funded by the National Institute on Aging, the National Institute of Biomedical Imaging and Bioengineering, and through generous contributions from the following: AbbVie, Alzheimer’s Association; Alzheimer’s Drug Discovery Foundation; Araclon Biotech; BioClinica, Inc.; Biogen; Bristol-Myers Squibb Company; CereSpir, Inc.;Cogstate;Eisai Inc.; Elan Pharmaceuticals, Inc.; Eli Lilly and Company; EuroImmun; F. Hoffmann-La Roche Ltd and its affiliated company Genentech, Inc.; Fujirebio; GE Healthcare; IXICO Ltd.; Janssen Alzheimer Immunotherapy Research & Development, LLC.; Johnson & Johnson Pharmaceutical Research & Development LLC.; Lumosity; Lundbeck; Merck & Co., Inc.; Meso Scale Diagnostics, LLC.;NeuroRx Research; Neurotrack Technologies; Novartis Pharmaceuticals Corporation; Pfizer Inc.; Piramal Imaging; Servier; Takeda Pharmaceutical Company; and Transition Therapeutics. The Canadian Institutes of Health Research is providing funds to support ADNI clinical sites in Canada. Private sector contributions are facilitated by the Foundation for the National Institutes of Health (![]() ). The grantee organization is the Northern California Institute for Research and Education, and the study is coordinated by the Alzheimer’s Therapeutic Research Institute at the University of Southern California. ADNI data are disseminated by the Laboratory for Neuro Imaging at the University of Southern California.
). The grantee organization is the Northern California Institute for Research and Education, and the study is coordinated by the Alzheimer’s Therapeutic Research Institute at the University of Southern California. ADNI data are disseminated by the Laboratory for Neuro Imaging at the University of Southern California.
Part of the data collection and sharing for this project was funded by OASIS (Principal Investigators: T. Benzinger, D. Marcus, J. Morris). The OASIS-3 project was supported by the following grants: NIH P50AG00561, P30NS09857781, P01AG026276, P01AG003991, R01AG043434, UL1TR000448, and R01EB009352. Data were provided [in part] by the Human Connectome Project, WU-Minn Consortium (Principal Investigators: David Van Essen and Kamil Ugurbil; 1U54MH091657) funded by the 16 NIH Institutes and Centers that support the NIH Blueprint for Neuroscience Research; and by the McDonnell Center for Systems Neuroscience at Washington University Independent testing data used in the preparation of this article were also obtained from the MIRIAD database. The MIRIAD investigators did not participate in analysis or writing of this report. The MIRIAD dataset is made available through the support of the UK Alzheimer’s Society (Grant RF116). The original data collection was funded through an unrestricted educational grant from GlaxoSmithKline (Grant 6GKC).