
Abstract
Background:
To date, there are no effective treatments for Alzheimer’s disease (AD). Thus, a significant need for research of therapies remains.
Objective:
One promising pharmacological target is the hormone fibroblast growth factor 21 (FGF21), which is thought to be neuroprotective. A clinical candidate for medical use could be the FGF21 analogue LY2405319 (LY), which has a specificity and potency comparable to FGF21.
Methods:
The present study investigated the potential neuroprotective effect of LY via PPARγ/apoE/abca1 pathway, which is known to degrade amyloid-β (Aβ) plaques by using primary glial cells and hippocampal organotypic brain slice cultures (OBSCs) from 30- and 50-week-old transgenic APPswe/PS1dE9 (tg) mice. By LY treatment of 52-week-old tg mice with advanced Aβ deposition, we further aimed to elaborate the effect of LY on AD pathology in vivo.
Results:
LY application to primary glial cells caused an upregulation of pparγ, apoE, and abca1 mRNA expression and significantly decreased number and area of Aβ plaques in OBSCs. LY treatment in tg mice increased cerebral [18F] FDG uptake and N-acetylaspartate/creatine ratio indicating enhanced neuronal activity and integrity. Although LY did not reduce the number of Aβ plaques in tg mice, the number of iba1-positive cells was significantly decreased indicating reduced microgliosis.
Conclusion:
These data identified LY in vitro as an activator of Aβ degrading genes leading to cerebral Aβ load amelioration in early and late AD pathology. Although Aβ plaque reduction by LY failed in vivo, LY may be used as therapeutic agent to treat AD-related neuroinflammation and impaired neuronal integrity.
Keywords
INTRODUCTION
The hallmark of Alzheimer’s disease (AD) is the accumulation of amyloid-β (Aβ) leading to formation of Aβ plaques [1]. Aβ plaques are surrounded in a size-dependent manner by activated microglia and astrocytes indicating Aβ plaque-induced neuroinflammation, which is accompanied by the secretion of inflammatory cytokines and chemokines [2–4]. Nonsteroidal anti-inflammatory drugs (NSAIDs), such as ibuprofen, are known to prevent microglia activation, which in consequence affords protection against neuronal cell death [4–6]. Moreover, insulin-sensitizers (thiazolidinedione; TZD) are also able to reduce neuroinflammation, in part due to their ability to decrease Aβ40 and Aβ42 content and consequently to prevent Aβ plaque-induced glial activation [6]. One such insulin-sensitizer is TZD, pioglitazone, which activates the peroxisome proliferator-activated receptor (PPAR)γ [6, 7]. Activation of PPARγ causes upregu-lation of the target genes apolipoprotein E (apoE) and adenosine triphosphate (ATP)-binding cassette (ABC) transporter subfamily A1 (abca1), which in turn are known to regulate cholesterol transport, to degrade Aβ plaques and to reduce neuroinflammation [8, 9]. Additionally, PPARγ activation also leads to upregulation of the endocrine factor, Fibroblast growth factor (FGF) 21, a starvation hormone [10], which also reversely regulates PPARγ activity [11, 12]. FGF21 is mainly expressed by adipose tissue, muscles, and liver [13]. As a hormone, FGF21 acts in both a paracrine and endocrine fashion and requires the presence of a fibroblast growth factor receptor (FGFR) and the single-pass transmembrane protein β-klotho (KLB) for activation [14–16]. Besides ben-eficial effects on metabolism through increasing insulin sensitivity via upregulation of the glucose transporter-1 (GLUT1) [17] and augmentation of energy expenditure [18], there is growing evidence that FGF21 may exert neuroprotective effects [19] and improve cognition [20]. The mechanism of action underlying the neuroprotective action of FGF21 has yet to be identified. Thus, the present study investigated 1) an in vitro and ex vivo approach using primary glial cells and hippocampal organotypic brain slice cultures from 30- and 50-week-old transgenic APPswe/PS1dE9 (tg) mice if the FGF21 analogue LY2405319 (LY) activates the PPARγ/apoE/abca1 pathway, which may lead to Aβ plaque reduction. LY has been shown to exert a specificity and a potency comparable to FGF21 but with a higher stability [21, 22]. By LY treatment of 2) 52-week-old tg mice with advanced Aβ deposition, we further aimed to elaborate the function of LY in established AD pathology as a potential therapeutic tool in neurodegenerative disease.
MATERIALS AND METHODS
In vitro and ex vivo approaches
Glial cell culture
Primary glial cells were cultured from postnatal day 0–3 C57BL/6J mice as described previously [9]. This age of mice was chosen as high cell vitality can be reached. First, pups were decapitated, brains isolated in cold PBS (Gibco) with 1% penicillin/streptomycin (Invitrogen) and 0.1% glucose (Sigma), and the cerebellum, meninges, and blood vessels were removed from the cortices. The latter were then minced and trypsinized with 0.05% trypsin-EDTA (Merck Millipore), 0.1% glucose (Sigma), 1% penicillin/streptomycin (Invitrogen), and DNAse (10μg/mL) for 10 min at 37°C. To stop trypsin digestion, DMEM/F12 (Merck Millipore) containing 10% heat-inactivated fetal bovine serum (HI-FBS, PAA) with supplement 1% penicillin/streptomycin was ad-ded. Cells were triturated, filtrated, and centrifuged for 5 min at 200×g. Supernatant was discarded and the pellet re-suspended in DMEM/F12 containing 15% (HI-FBS) and 1% penicillin/streptomycin. Cortical cells were seeded in DMEM/F12 with 15% HI-FBS and 1% penicillin/streptomycin at a density of 2x10⁶/well in a 6 well-plate (Cellstar, Greiner bio-one). Medium was changed the following day to fresh DMEM/F12 with 10% HI-FBS and 1% penicillin/streptomycin and incubated for 14–21 d at 37°C and 5% CO2. Medium was replaced every 4-5 d. Afterwards cells were exposed to 5μg/ml LY and 100 nM pioglitazone (pio) in medium or medium as vehicle (co) and incubated for 24 h at 37°C, and 5% CO2. Subsequently, cells were harvested for mRNA analysis.
mRNA analysis of glial cells
With the RNeasy® Mini Kit (Qiagen) in accordance with the manufacturer’s instructions RNA was isolated from glial cells. After the isolation reverse-transcription with SuperScript TM and the First Strand Synthese System (Invitrogen) followed as des-cribed by the manufacturer. Lightcycler 1.5 was used with the Lightcycler® FastStart DNA MasterPlus SYBR Green I kit (Roche Diagnostics) for real-time quantitative PCR. Each amplification mixture (20μl) contained 5μM primer, 19μl of universal PCR Mastermix, and 1μl 1:2 diluted cDNA solution. PCR thermocycling parameters were 95°C for 10 min and 40 cycles of 95°C for 10 s, 55°C for 5 s, and 72°C for 10 s. As housekeeping gene, ribosomal protein S18 (rps18) was used. With the 2-ΔΔCt method, relative change in gene expression was calculated. The Ct-values of a cDNA pool of untreated glial cells were taken as control. To specify the amplification, the melting-curve was analyzed, and efficiency was validated. The primers are listed in Table 1.
List of used primers
Organotypic brain slice cultures (OBSCs)
The preparation of organotypic entorhino-hippocampal slice cultures of mice has been described previously by Del Turco & Deller [23]. Mice at an age of 30 or 50 weeks were decapitated under intraperitoneal anesthesia with 90 mg/kg ketamin/8 mg/kg xylazin. The brain was cut into horizontal 120μm sections with a vibratome (VT 1200S, Leica Biosystems, Nussloch, Germany), while the chamber was filled with preparation medium. The preparation medium was based on minimum essential medium (MEM, Thermofischer scientific, Germany) with 0.65% glucose, 2 mM glutamax plus streptomycin and penicillin. For incubation, a medium based on minimal essential medium containing 25% normal horse serum, 25% basal medium eagle, 0.65% glucose, 2 mM glutamax plus streptomycin and penicillin, pH adjusted to 7.3, was used [23]. Slices were cultivated using hydrophilic, semipermeable PTFE cell culture inserts with a pore size of 0.4μm (Millicell, Merck, Darmstadt, Germany), as first described by Stoppini et al. [24]. Three slices were placed on one filter, a total of 9 slices was collected per animal. For cultivation, an acute short-living protocol was established, in which slices was cultivated for about 7 days in vitro. Medium changes were done every second day. On day 5 in vitro, pioglitazone (pio, 100 nM) as positive control, LY (5μg/ml) or medium (co) as vehicle were applied and were incubated for 48 h. Then, OBSCs were fixed with 70% ethanol for further 48 h.
Immunohistochemistry
Ethanol fixed OBSCs were washed with PBS buffer (Gibco PBS, Thermofisher Scientific). The slices were separated without removing them from the filter. Aβ plaques were visualized by using mouse monoclonal anti-Aβ antibody (clone 6E10; 1:1000, BioLegend (previous Covance)) followed by the anti-mouse Dylight 488 antibody (1:100; abcam 96875). The slices were analyzed with a fluorescence microscope (Zeiss Axiovision, Jena). Images were acquired with a Color View II FW camera (Color View). The number of Aβ plaques was counted at a 100x magnification throughout the whole hippocampus (entorhinal cortex, subiculum, CA1, CA2, CA3, and dentate gyrus) by using ImageJ 1.47 v. which visualized counted plaques with pink dots. The Aβ plaques of at least two slices per animal (n = 9) were counted and the arithmetic mean was taken. The number of Aβ plaques upon LY and pioglitazone treatment is given as x-fold change compared to medium-control. For the relative Aβ plaque area, all Aβ plaques within 16 fields of view at a 400x magnification were analyzed. The area was measured using the ZEN software (Zeiss, Germany). The arithmetic mean of two slices per animal was taken and is given as x-fold change compared to medium-control.
In vivo approaches
Animals
All animal procedures were accomplished with adherence to standards of animal protocols approved by the local Animal Research Committee (Landesamt für Landwirtschaft, Lebensmittelsicherheit und Fischerei (LALLF) of the state Mecklenburg-Western Pomerania (LALLF M-V/TSD/7221.3-1.1-002/14). All animals received humane care according to the German legislation on protection of animals and the Guide for the Care and Use of Laboratory Animals (European Directive 2010/63/EU). The current study was performed in the APPswe/PS1dE9 (tg) mice, which co-express the human amyloid-β precursor protein (AβPP) K594N, M595L mutation and the human presenilin (PS) 1, L166P mutation under the control of the mouse prion protein promoter [25]. These mice show Aβ plaques in the hippocampus and cortex at the age of 6 months [26]. Littermates served as control mice (wild type; wt). All animals were housed in a 12-h light/dark cycle at 22°C with free access to food and water under specified pathogen free (SPF) conditions. At an age of 52 weeks mice were divided in two groups which were treated with either LY2405319 (LY, kindly provided by Eli Lilly & Company, n = 8) or sodium chloride as vehicle (NaCl, n = 8). Mice were administered treatment with LY dissolved in sodium chloride at a dose of 0.1 mg/kg daily at 8 a.m. via intraperitoneal (i.p.) injection for a period of 16 weeks. Control mice received equal volumes of sodium chloride. During treatment body weight and the blood glucose concentrations were measured biweekly. At the end of treatment 18-fluoro-2-deoxyglucose ([18F] FDG) PET/CT and MRI measurements were conducted.
Tissue sampling
After experimental procedures all mice were sacrificed according to approved animal experimental protocol. Brain tissue was harvested for histopathological analysis.
Magnetic resonance imaging (MRI) and Spectroscopy (MRS)
Animals were imaged in vivo with a T2-weighted Turbo-RARE (Rapid Acquisition with Relaxation Enhancement) and an isotropic T1-weighted FLASH sequence in a 7 Tesla small animal MRI-scanner (Bi-oSpec 70/30, gradient insert: BGA-12S, maximum gradient strength: 440 mT/m, Software interface: Paravision 6.01., Bruker BioSpin GmbH, Ettlingen, Germany) which was equipped with a 1H cryogenic, two elements, transmit/receive coil array. The ima-ging parameters were as follows: T2w TurboRARE: TE/TR: 39/2200 ms, in-plane resolution: 65×65μm, slice thickness: 500μm, FoV: 17×13 mm, and matrix size: 200×260 pixels; isotropic T1w Flash: TE/TR: 8/40 ms, flip angle: 10°, in-plane resolut-ion: 120×120×120μm, FoV: 17.12×14.12×8.41 mm, matrix size: 143×118×70 pixels, Avg.: 2. Mice were anesthetized using 1.5 –2.5% isoflurane with oxygen. The respiration of the mice was controlled during the imaging session and the core body temperature of the animals was maintained at 38°C via a temperature-controlled heating pad. All scans were respiration triggered.
Further, single-voxel spectroscopy using a STEAM Sequence (TE/TR: 135/1500 ms, Mixing-time: 11.75) was performed from a 3.4×4.3×1.0 mm voxel manually positioned and orientated in the right hippocampus by using anatomical axial, sagittal and coronal T2-weighted images for guidance. Spectra were analyzed with the jMRUI spectroscopy package [27]. Peak area N-acetylaspartate/creatine ratios (NAA/Cr) were calculated. For quantitation of the metabolites the Hankel-Lanczos Singular Value Decomposition (HLSVD) method with five components were applied [28].
PET/CT imaging
Small animal PET/CT scans were acquired with [18F] FDG as radiotracer. Anesthesia was induced by inhalation of isoflurane (1.5 –2.5%) supplemented with oxygen. Next, mice received an intravenous tail vein injection of 15.38±0.62 MBq [18F]FDG with an uptake time of 30 min. Using a small animal PET/CT scanner (Inveon PET/CT Siemens, Kno-xville, TN, USA), static scans in head-prone position were acquired for 30 min. The respiration of the mice was controlled during the imaging session and the core body temperature of the animals was maintained at 38°C via a temperature-controlled heating pad. The PET image reconstruction method consisted of a 2-dimensional ordered subset expectation maximization algorithm (2D-OSEM) with four iterations and 6 subsets. Attenuation correction was performed on the basis whole body CT scan and a decay correction for [18F] was applied. PET images were also corrected for random coincidences, dead time and scatter.
PET/CT data analysis
Image processing was performed using PMOD software (version 3.7; PMOD Technologies LLC, Zürich, Switzerland). The brain PET images of each mouse were spatially co-registered to a mouse MRI brain template (T2 weighted Mouse M. Mirrione template) which is included in the PMOD software. For the correction of minor motion during the measurement the individual PET images were first ri-gidly co-registered with their individual CT and the head areas were cropped. Then, the animal specific CT images of the head were transformed to measured corresponding MRI T1 brain images. Afterwards, the MRI images of each mouse were transformed to the Mouse M. Mirrione template by rigid transformations. Finally, the PET/CT transformation was normalized to the CT/MRI T1 and the MRI T1/ Mouse M. Mirrione template transformation. The processed PET images were subsequently co-registered with mouse brain volume-of-interest (VOI) template (Mouse Mirrione atlas) including the PMOD software and tracer uptake values were extracted for each delineated VOI. An exemplary workflow is shown in Fig. 1A and B. For each VOI standardized uptake values (SUVs) were acquired.
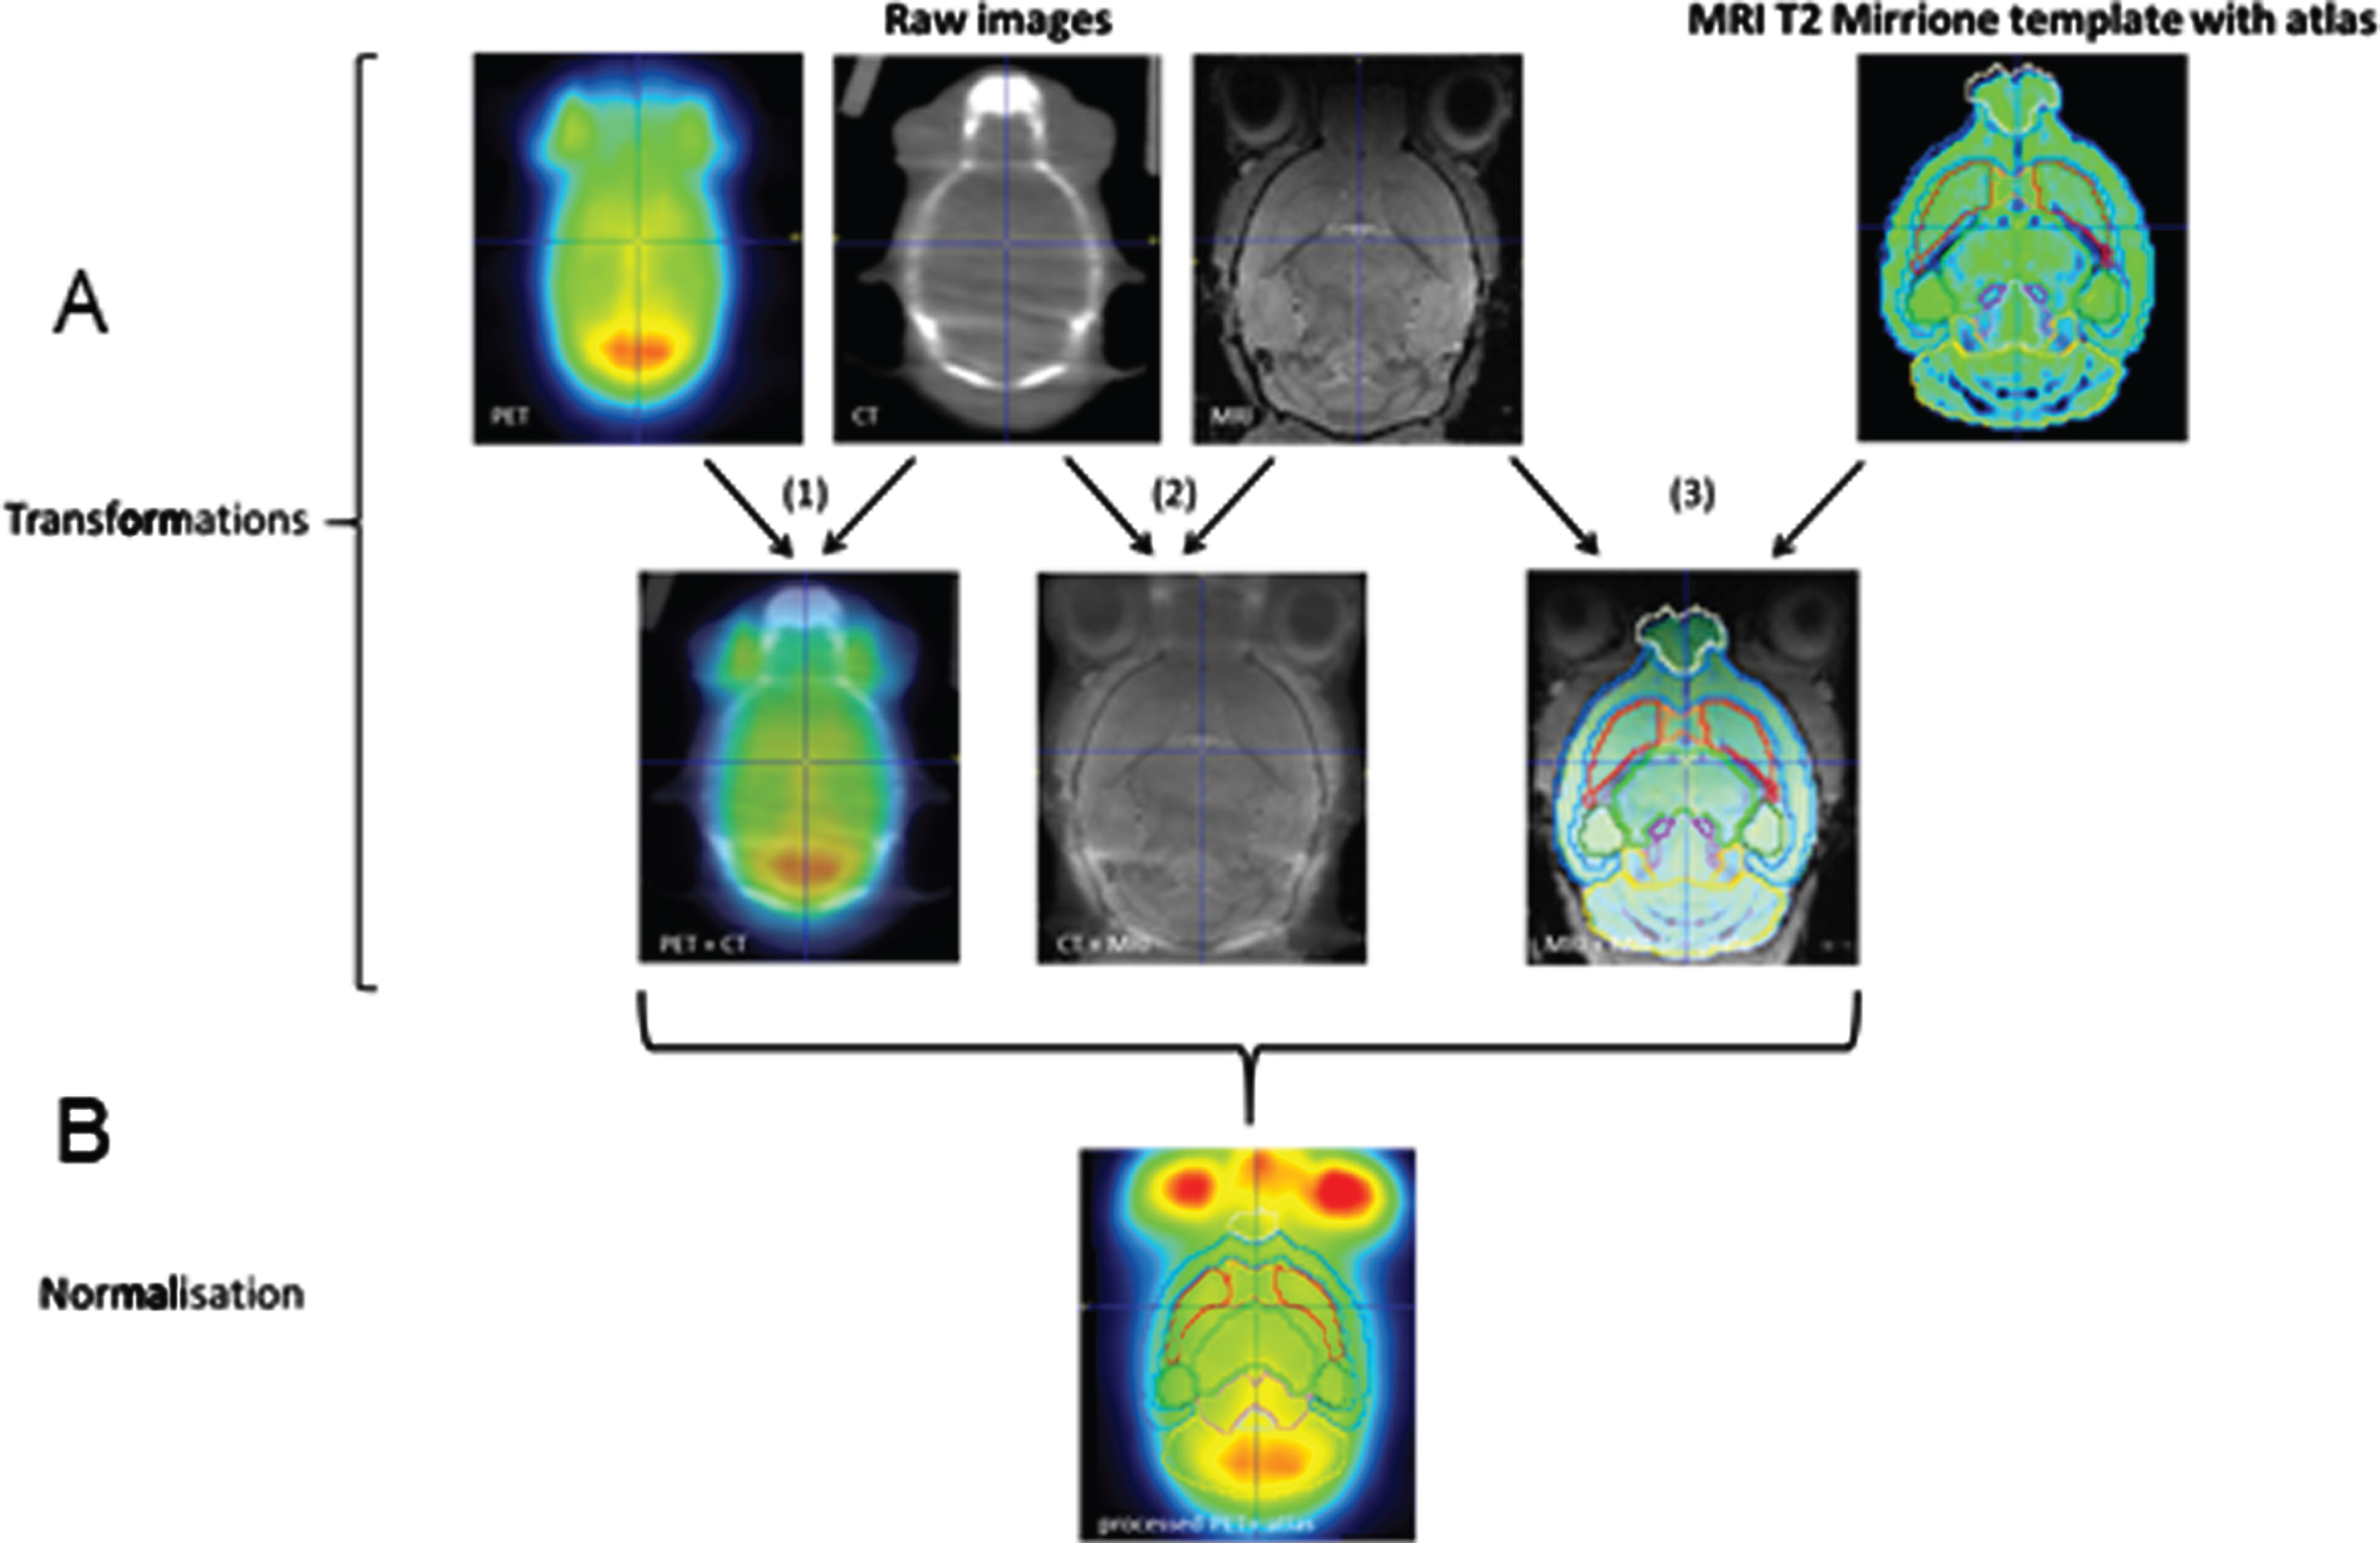
Transformation and normalization (A and B) workflow of brain PET/CT analysis via PMOD software (version 3.7; PMOD Technologies LLC, Zürich, Switzerland). Transformations (A1–3): (A1) In the first step animal specific PET was rigidly matched to CT. Secondly the animal specific CT was transformed to corresponding MRI T1 brain image (A2) and as least transformed MRI T1 brain image was matched to MRI brain template (A3, T2 weighted Mouse M. Mirrione template) which is included in the PMOD software. These transformations were finally normalized to each other and co-registered to mouse brain volume-of-interest (VOI) template (Mouse Mirrione atlas) including the PMOD software (B). Tracer uptake values were extracted for each delineated VOI.
Immunohistochemistry
For immunohistochemical analysis, brain tissue was fixed in 4% phosphate-buffered formalin and embedded in paraffin. From the paraffin-embedded tissue blocks, 4μm thin sections were put on X-tra Adhesive Precleaned Micro Slides (Leica) and exposed to mouse monoclonal anti-Aβ antibody (clone 6E10; 1:1000, BioLegend (previous Cova-nce)), a rabbit polyclonal anti-GFAP (1:100, Abcam), goat polyclonal anti-iba1 (1:1000, Abcam), and rabbit polyclonal anti-PSD95 (1:1000, Abcam). DAB chromogen Universal LSAB® kits (System-HRP; DakoCytomation, Dako) were used for development according to the manufacturer’s instructions. The sections were counterstained with hemalaun and analyzed with a light microscope (Olympus BX51). Images were acquired with a Color View II FW camera (Color View). Within the hippocampus (n = 5-6 of each mouse strain and treatment, N = 25 visual fields), cortex (n = 5-6 of each mouse strain and treatment, N = 25 visual fields) the number of anti-Aβ positive plaques, iba1-positive cells and GFAP-pos-itive cells were counted with ImageJ 1.47 v. at 400×magnification and are given per high power field (HPF). Aβ plaques areas were analyzed semi-aut-omatically (by adjusting the image threshold values) with ImageJ 1.47 v. and are given in mm2 per HPF.
Statistical analysis
Statistical differences were determined using ANOVA followed by post-hoc pairwise comparison tests (Mann-Whitney Rank Sum test). Data were considered significant if p < 0.05. Statistical analysis was performed using the SigmaStat software package (Jandel Scientific).
RESULTS
In vitro and ex vivo approaches
Primary glial cells and hippocampal OBSCs
To evaluate if similar to pioglitazone [9] LY also activates the PPARγ/apoE/abca1 pathway primary glial cells were exposed to pioglitazone and LY. In doing so, relative mRNA expression of pparγ was increased up to 50% upon pioglitazone exposure and up to almost 100% upon LY exposure (p = 0.051 versus control-medium, Fig. 2A). The relative expression of abca1 and apoE was significantly increased by both pioglitazone (abca1: p = 0.005; apoE: p = 0.009) and LY (abca1: p = 0.016; apoE: p = 0.027) treatment when compared to control-medium (Fig. 2B, C). To further assess if LY-induced activation of PPARγ/apoE/abca1 pathway results in Aβ plaque reduction, we used hippocampal OBSCs from 30- and 50-week-old tg mice. Analysis of Aβ plaque number revealed a significant reduction of plaque burden when compared to control-medium (p < 0.001; Fig. 3A, C). This finding was comparable to pioglitazone treatment as indicated by a significant decrease of Aβ plaque number (p = 0.001; Fig. 3A, C). Furthermore, Aβ plaque area was significantly reduced upon LY and pioglitazone treatment compared to control-medium (p≤0.001; Fig. 3 B).
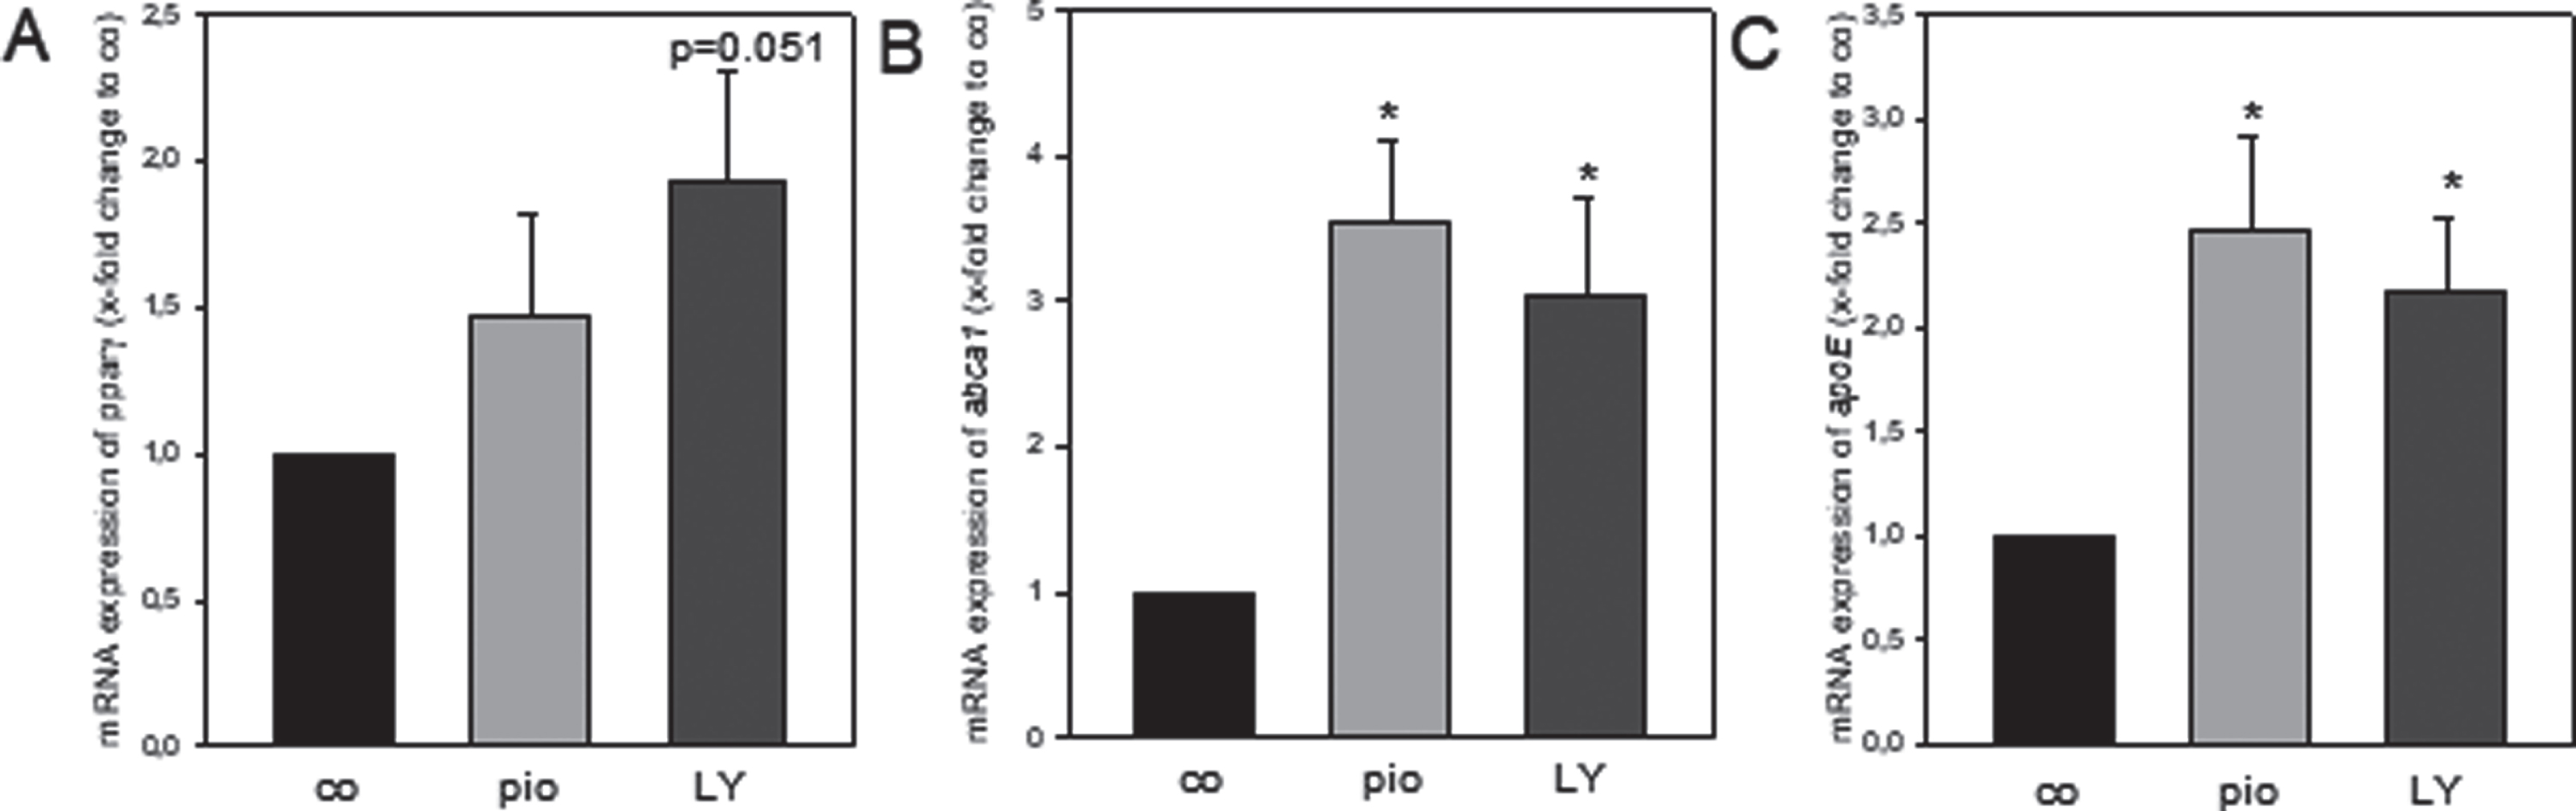
Quantitative real-time PCR analysis of mRNA expression of pparγ, abca1 and apoE relative to rps18. Glial cells were treated with 100 nM pioglitazone (pio, n = 6, independent experiments), 5μg/ml LY2405319 (LY, n = 6, independent experiments) or with medium-control (co, n = 6, independent experiments) for 24 h. Values are given as mean±SEM; ANOVA, post-hoc pairwise comparison tests: *p < 0.05 versus co.

Quantitative analysis of the number of amyloid-β (Aβ) plaques (A) and the Aβ plaque area (B) in hippocampal organotypic brain slice cultures (OBSCs of 30 (n = 9, independent experiments) and 50 (n = 8, independent experiments) week-old transgenic APPswe/PS1dE9 (tg)) mice and representative immunohistochemical images of OBSCs (C, magnification 100x, Aβ plaques are visualized by pink dots). OBSCs were treated with 100 nM pioglitazone (pio), 5μg/ml LY2405319 (LY) or with medium-control (co) for 48 h. Values are given as mean±SEM; ANOVA, post-hoc pairwise comparison tests: *p < 0.05 versus co.
In vivo approaches
Body weight and blood glucose concentrations
Since LY is involved in the regulation of lipid and glucose metabolism, body weight and blood glucose concentrations of mice were assessed. Tg mice weighed approximately 11% less (28.9±1.8 g) than their age-matched wt counterparts (32.9±2.4 g; Table 2). Body weight decreased upon LY treatment only in tg by 23% when compared to vehicle treated tg mice (Table 2) and by 32% when compared to LY-treated wt mice (p = 0.006; Table 2). There was almost no difference in blood glucose concentrations between wt (5.4±0.2 mM) and tg (5.0±0.3 mM) mice. With LY treatment blood glucose concentrations remained almost unchanged in both genotypes when compared to vehicle treated animals (Table 2).
Body weight and blood glucose concentrations. Values are given as mean±SEM; ANOVA, post-hoc pairwise comparison tests: *p < 0.05 versus wt
NAA/Cr ratio measured by MRS and [18F]FDG uptake assessed by MRS and PET/CT imaging
NAA and Cr are metabolites, which allow to cha-racterize neurochemical alterations in AD brains (Fig. 4A-C). Further [18F] FDG uptake (Fig. 4D, E) and PSD 95 positivity (Fig. 4F) —both also markers for neuronal integrity—were measured. The mean NAA/Cr ratios in tg mice were significantly reduced in comparison to wt mice (p = 0.004; Fig. 4C). Treatment with LY caused a significant increase of the NAA/Cr ratio in the tg mice (p = 0.045; Fig. 4C), reaching values as found in wt mice. Mean SUVs were calculated in the hippocampus and the cerebral cortex to evaluate [18F] FDG uptake of wt and tg mice. Tg mice showed 14% decrease in cortex (Fig. 4D) and an almost 20% decrease of [18F] FDG uptake in hippocampus (Fig. 4E) when compared to wt mice. LY treatment in tg mice led to increased SUVs, reaching levels of the wt mice (Fig. 4D, E). Qualitative assessment of PSD95 protein expression indicates more positive cells and points towards preserved synaptic plasticity upon LY treatment of tg mice (Fig. 4F, arrows).
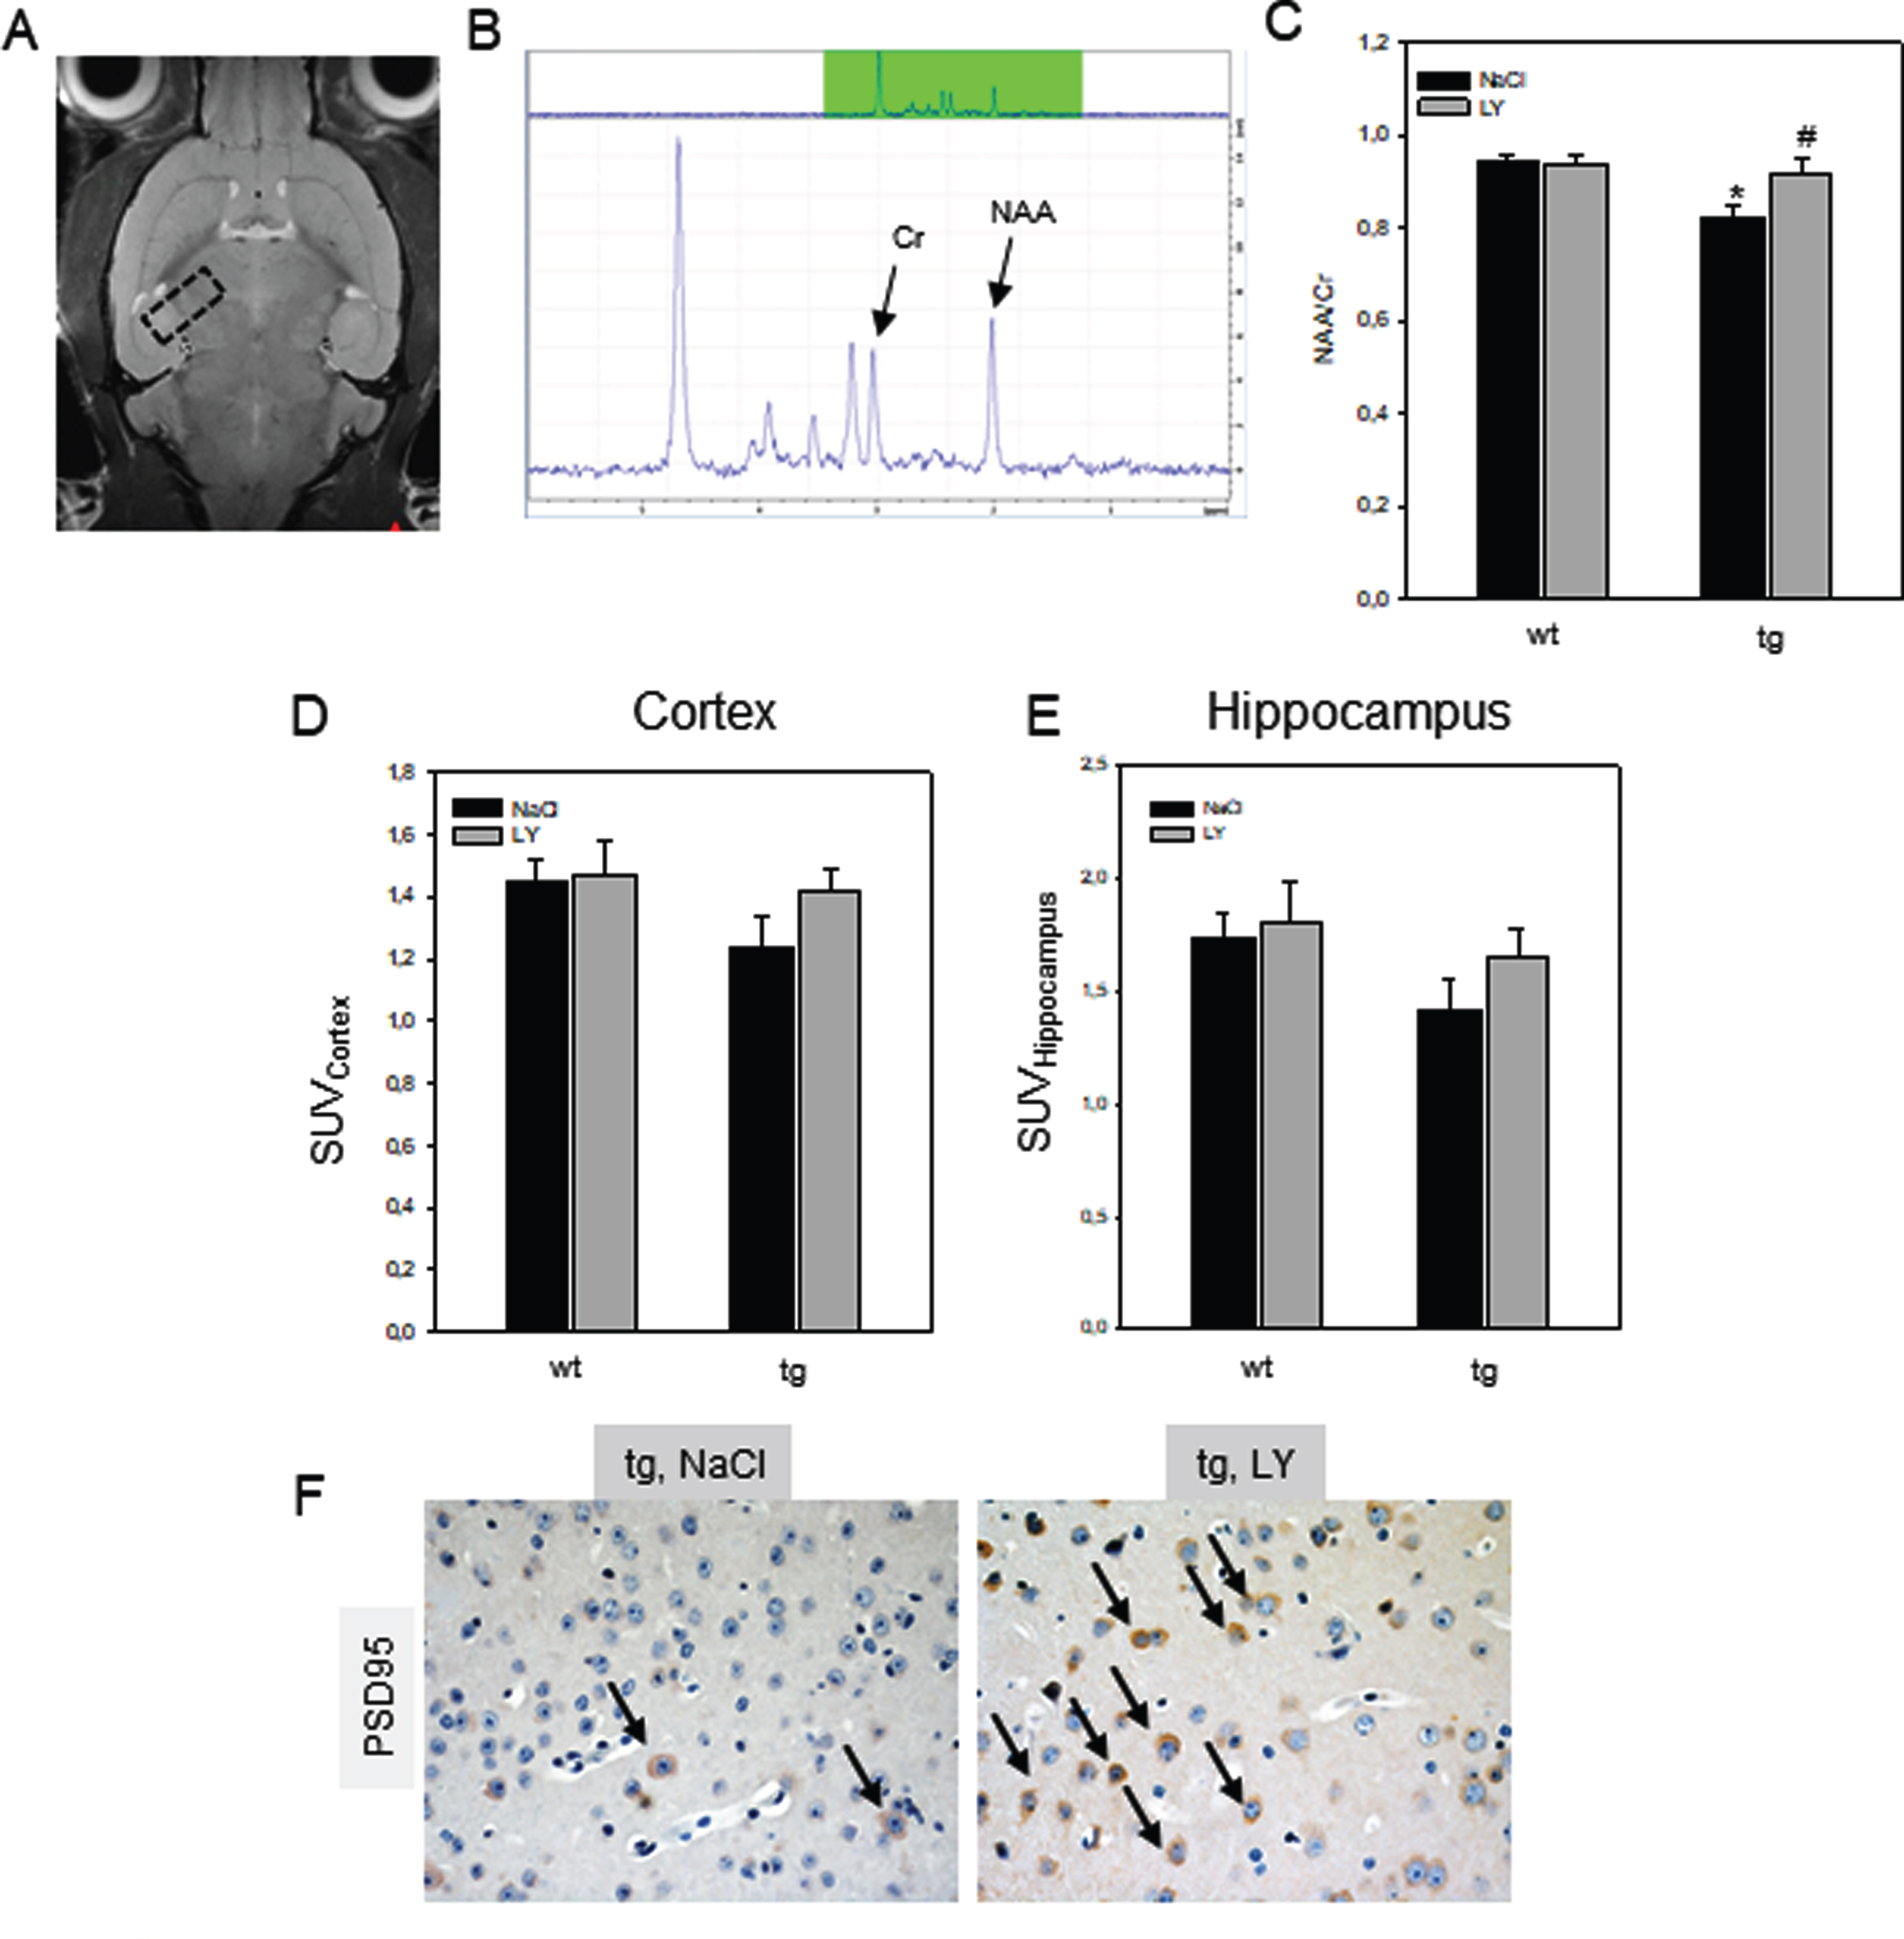
Transversal T2 weighted MRI including position of the spectroscopy voxel (A, black dashed box). Example of MRS spectrum as derived from the voxel of interest with the prominent metabolites N-acetylaspartate (NAA resonates at 2.0 ppm) and creatine (Cr resonates at 3.0 ppm) from a transgenic APPswe/PS1dE9 (tg) mouse is shown in (B) Quantification of the NAA/Cr ratios (C) in brains, [18F] FDG uptake in the cortex (D) and hippocampus (E) of wild type (wt, n = 16) and tg (n = 16) mice and representative immunohistochemical images (original magnification x400) of PSD95 protein expression in brain of tg mice (F). Mice received a daily intraperitoneal injection of either sodium chloride (NaCl, wt: n = 8; tg: n = 8) or LY2405319 (LY, wt: n = 8; tg: n = 8; 0.1 mg/kg body weight) for 16 weeks. Note the increase of PSD95-positive neurons in tg mice upon LY treatment when compared to NaCl application (indicated by arrows). Values are given as mean±SEM; ANOVA: *p < 0.05 versus wt; #p < 0.05 versus NaCl.
Immunohistochemistry of iba-1, GFAP, and Aβ
Tg mice compared to wt mice showed a marked increase of iba1-positive cells in the cortex (Fig. 5A) which was even more pronounced in the hippocampus (p = 0.024; Fig. 5B, C) indicating a marked microgliosis. Beside enhanced microgliosis, also astrogliosis was higher as given by significant increase of GFAP-positive cell numbers in the cortex (p < 0.001; Fig. 6A) and hippocampus (p = 0.001; Fig. 6B) in tg versus wt mice. Upon LY administration, microgliosis was diminished in tg mice as indicated by up to 30% reduction of iba1-positive cells numbers in the cortex (Fig. 5A) and up to 50% in the hippocampus (p = 0.023; Fig. 5B, C), while LY only slightly reduced GFAP-positive cells of tg mice in the hippocampus (up to 16 %, Fig. 6B, C). Unexpectedly, wt mice treated with LY exhibited an increase of iba1-positive cells in the cortex and hippocampus (Fig. 5A-C) and of GFAP-positive cells in the hippocampus (p = 0.031; Fig. 6B, C).
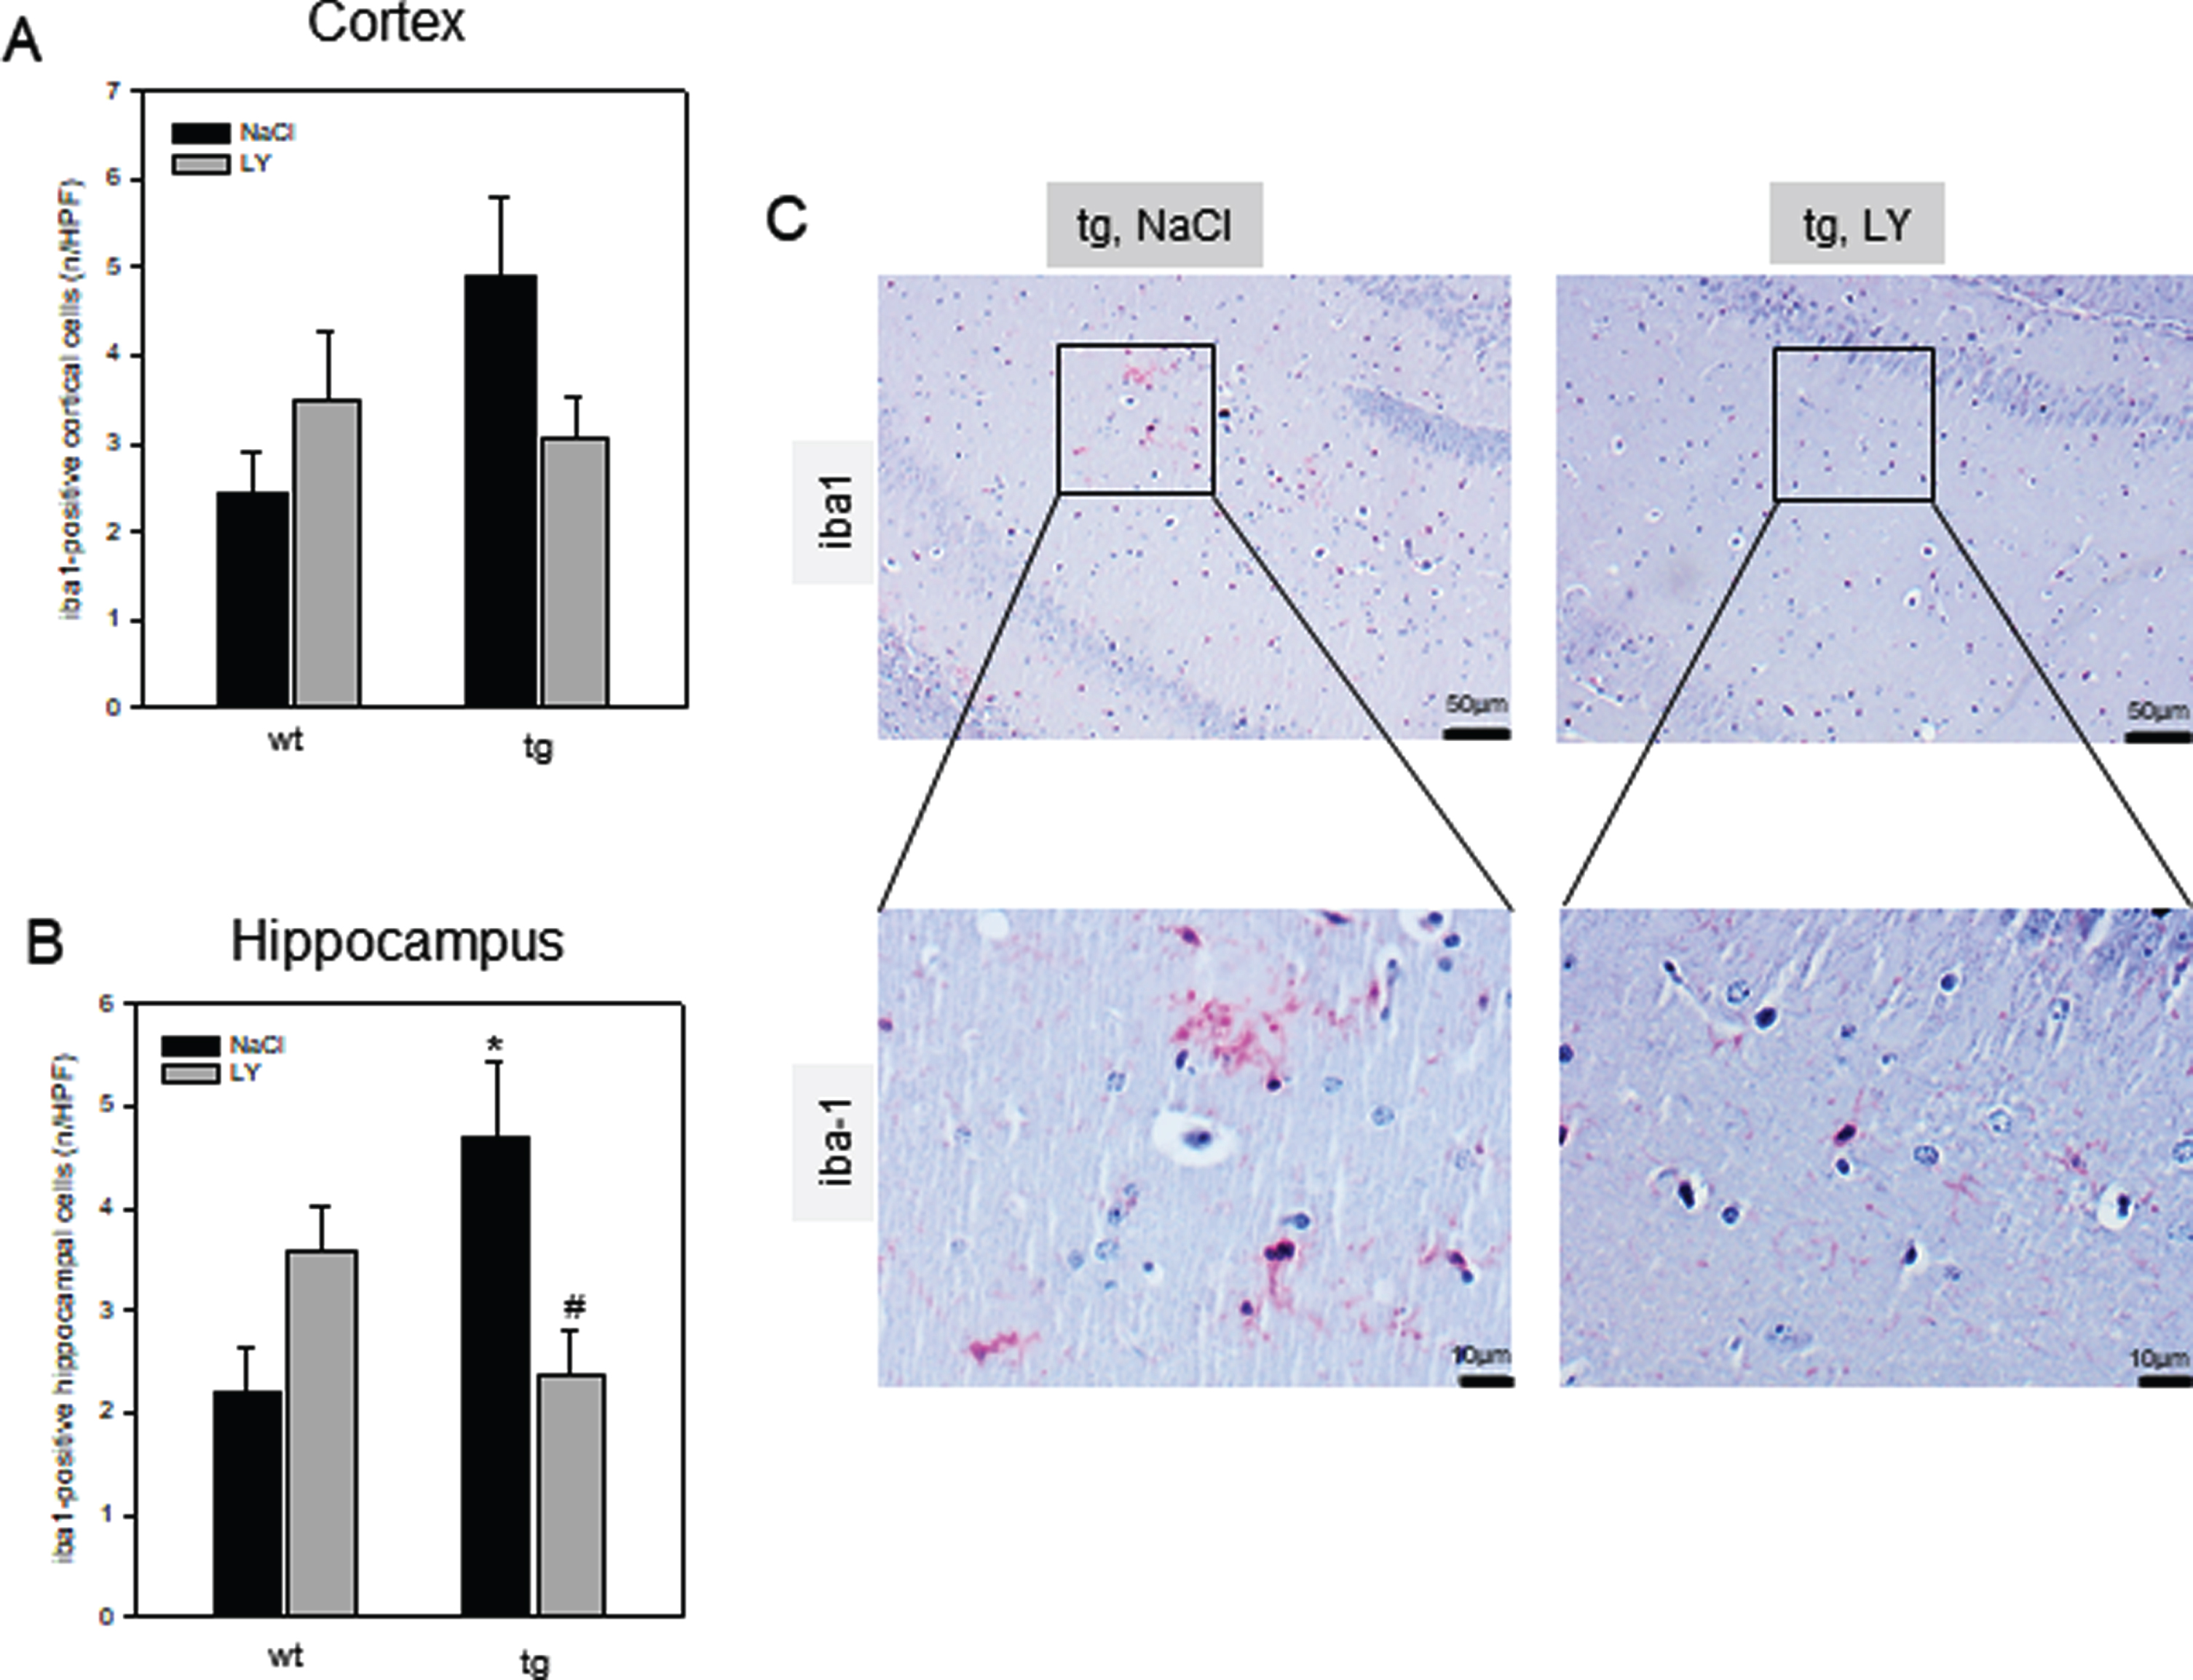
Quantitative analysis of the number of iba1-positive cells per high power field (n/HPF) in cortex (A) and in hippocampus (B) of wild type (wt, n = 12) and transgenic APPswe/PS1dE9 (tg, n = 14) mice and representative immunohistochemical images of iba1- stained hippocampal (CA1 region) sections (C; magnification 100x as an overview with insert to 400x) of tg mice. Mice received a daily intraperitoneal injection of either sodium chloride (NaCl, wt: n = 6; tg: n = 8) or LY2405319 (LY, wt: n = 6; tg: n = 6; 0.1 mg/kg body weight) for 16 weeks. Values are given as mean±SEM; ANOVA, post-hoc pairwise comparison tests: *p < 0.05 vesus wt, #p < 0.05 versus NaCl.
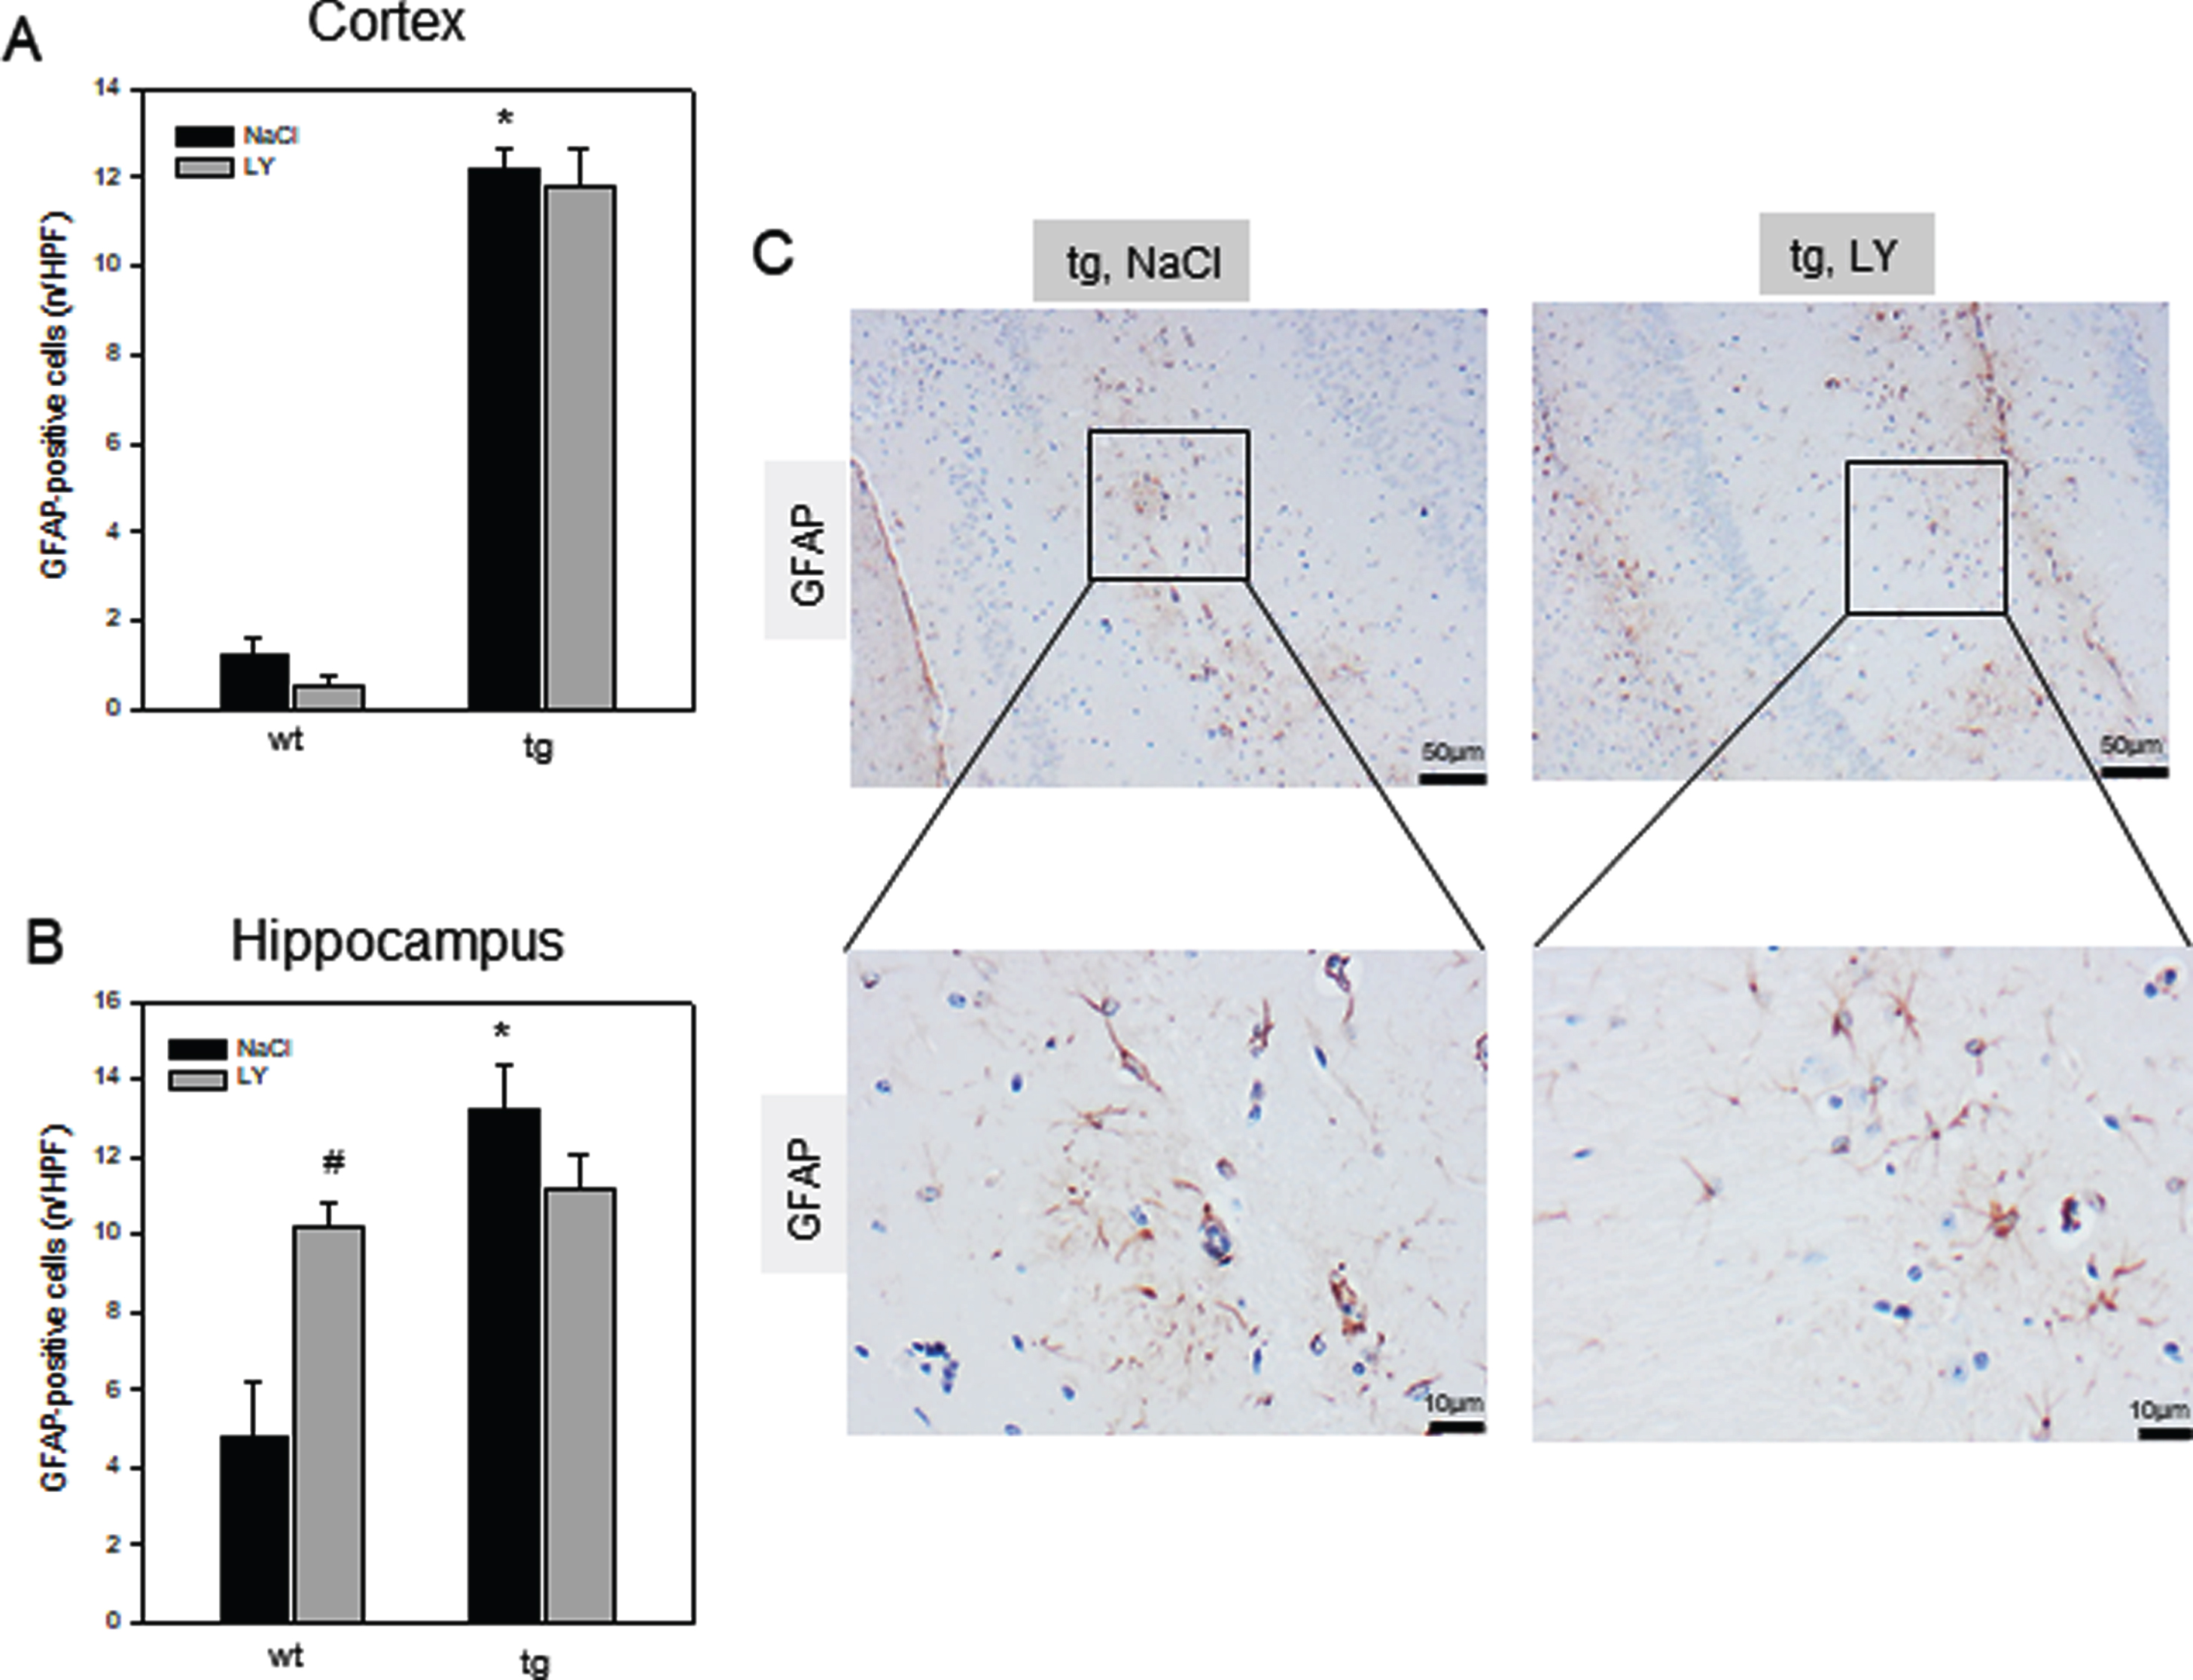
Quantitative analysis of the number of GFAP-positive cells per high power field (n/HPF) in cortex (A) and in hippocampus (B) of wild type (wt, n = 8) and transgenic APPswe/PS1dE9 (tg, n = 8) mice and representative immunohistochemical images of GFAP- stained hippocampal (CA1 region) sections (C, magnification 100x as an overview with insert to 400x) of tg mice. Mice received a daily intraperitoneal injection of either sodium chloride (NaCl, wt: n = 4; tg: n = 4) or LY2405319 (LY, wt: n = 4; tg: n = 4; 0.1 mg/kg body weight) for 16 weeks. Values are given as mean±SEM; ANOVA, post-hoc pairwise comparison tests: *p < 0.05 versus wt, #p < 0.05 versus NaCl.
To evaluate if LY-associated Aβ plaque reduction in the OBSCs can also be observed in vivo, LY-treated tg mice were analyzed. Administration of LY did not decrease the number of Aβ plaques in tg mice, which averaged between 4-5 per HPF in the cortex and 2-3 per HPF in the hippocampus of both groups (Fig. 7A-C). Aβ plaque area did also not differ between groups, while there was a 42% reduction of Aβ plaque area per HPF in the hippocampus of LY-versus NaCl-treated tg mice (Fig. 7B, C).
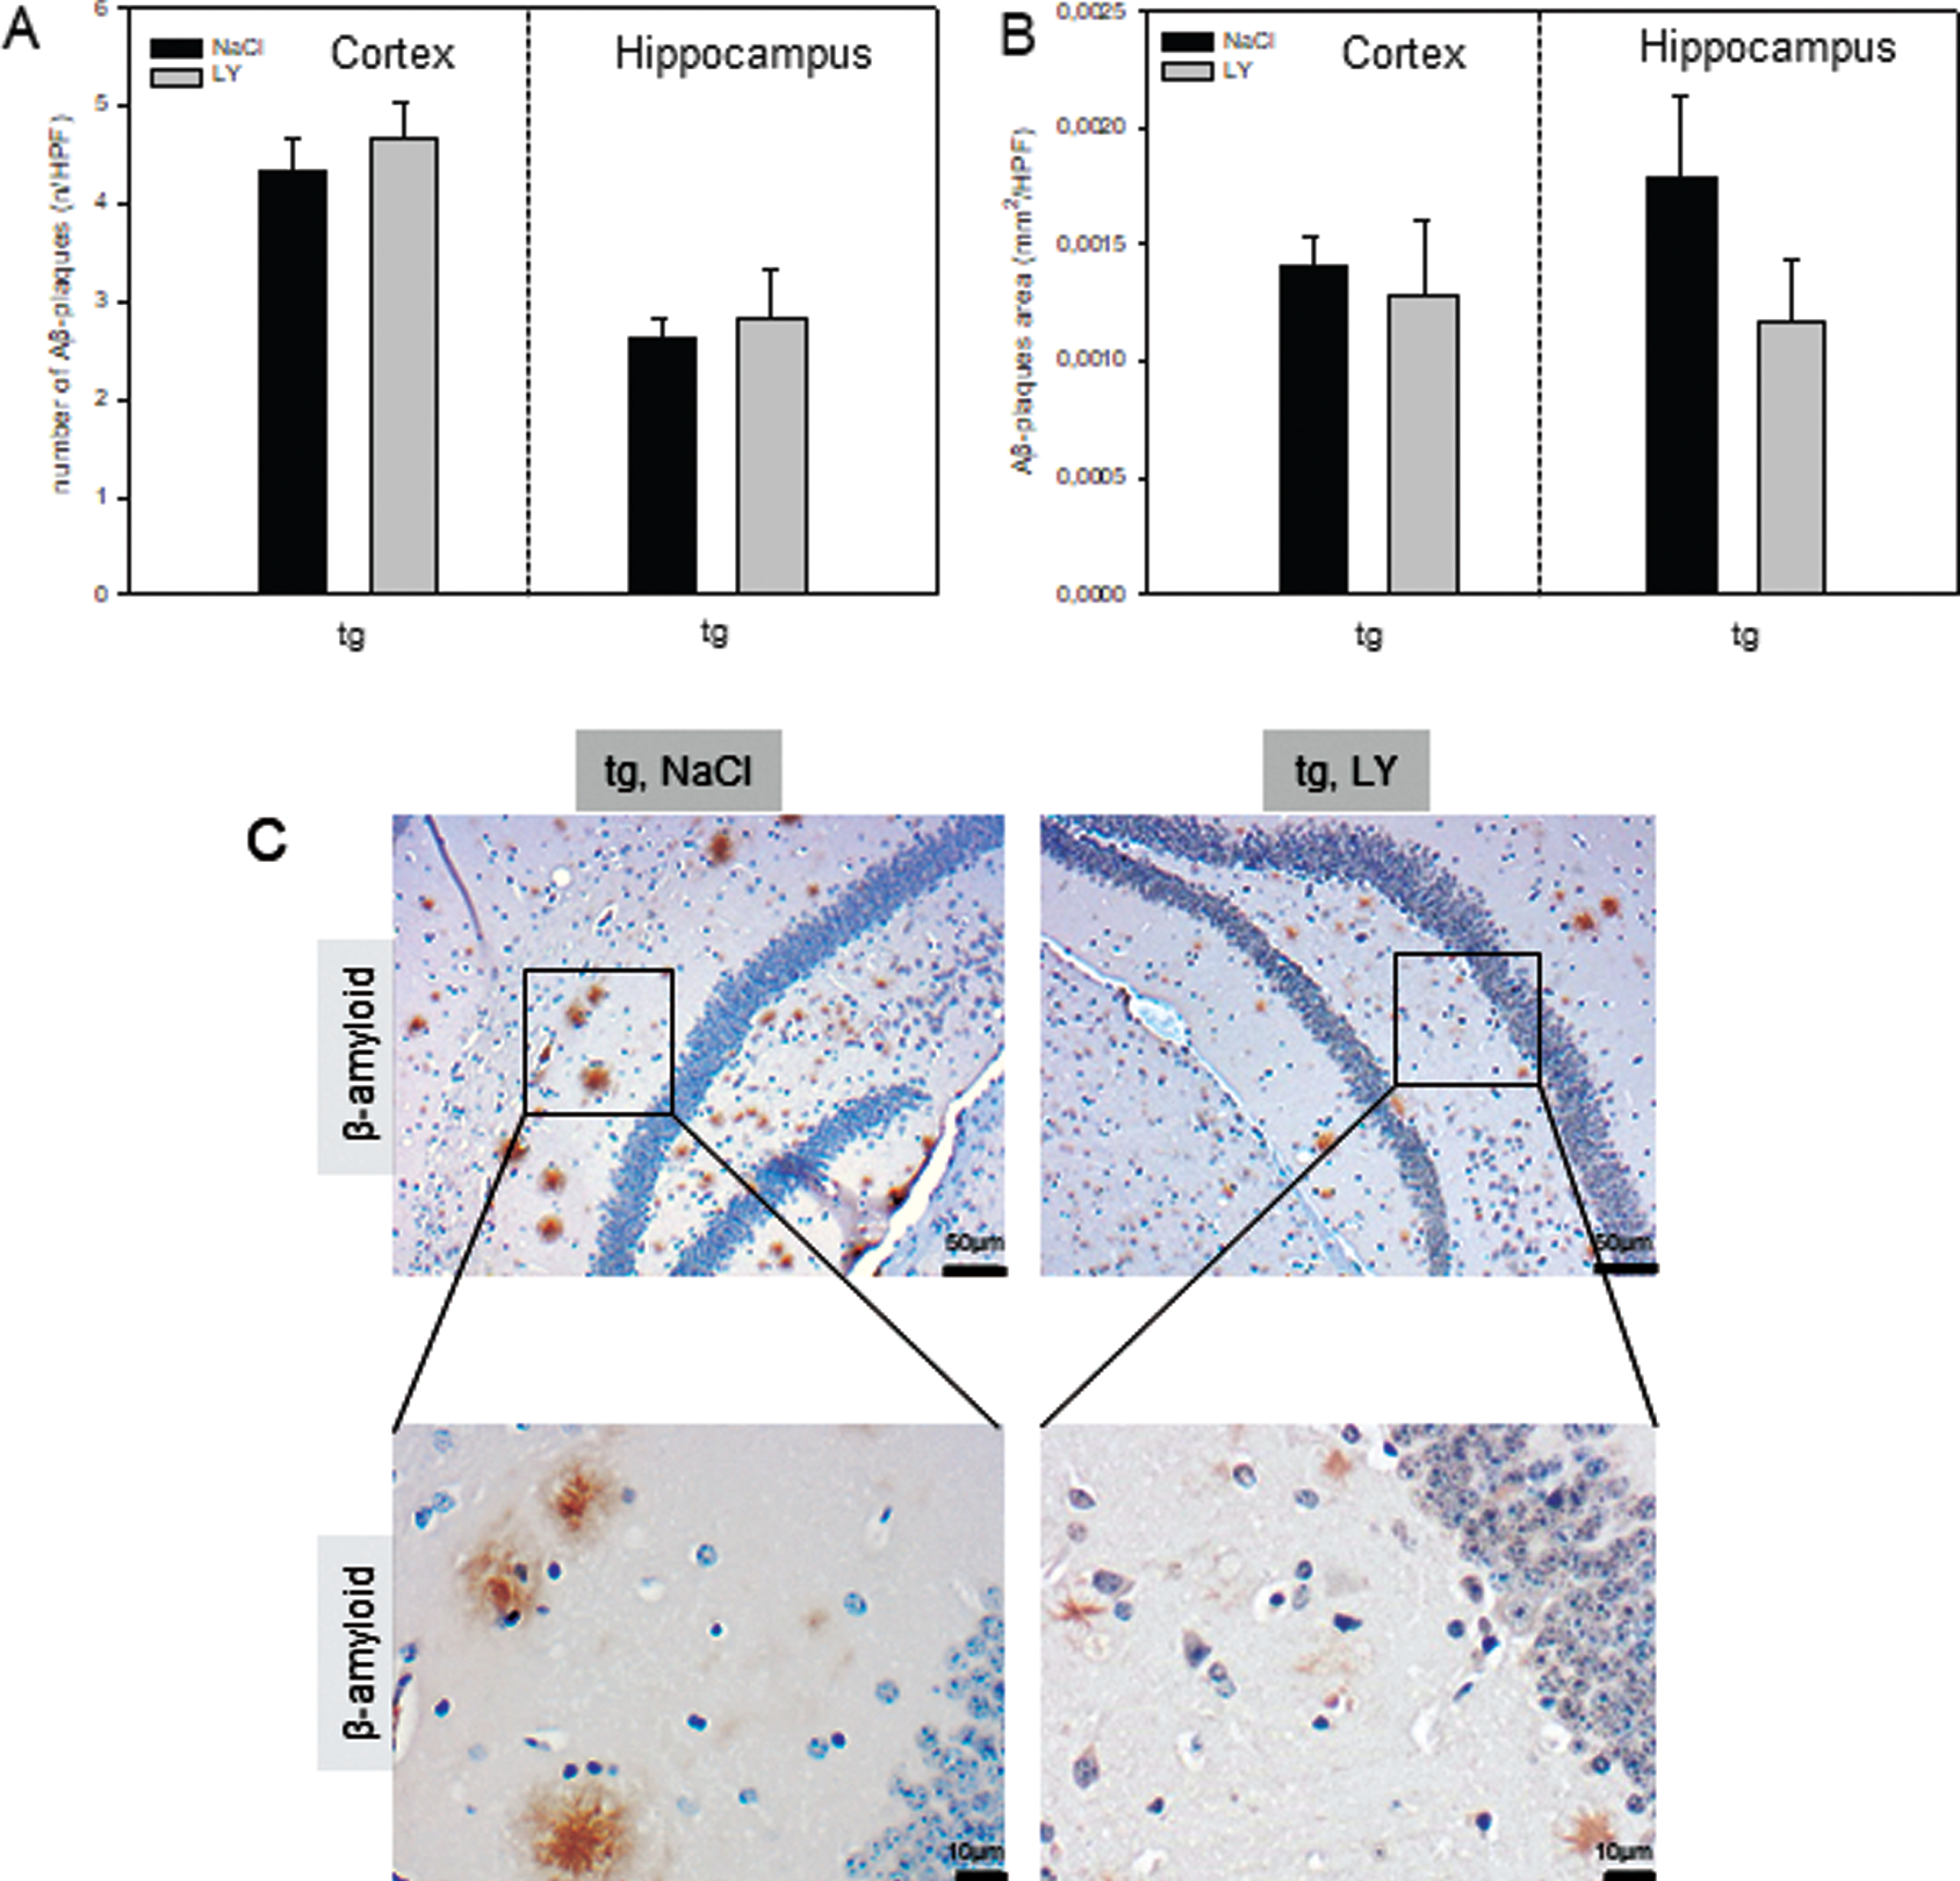
Quantitative analysis of the number of amyloid-β (Aβ) plaques (A, n) and the Aβ plaque area (B, mm2) per high power field (n/HPF) in cortex and hippocampus of transgenic APPswe/PS1dE9 (tg, n = 10) mice and representative immunohistochemical images of Aβ stained hippocampal (CA1 region) sections (C; magnification 100x as an overview with insert to 400x). Mice received a daily intraperitoneal injection of either sodium chloride (NaCl, tg: n = 5) or LY2405319 (LY, tg: n = 5; 0.1 mg/kg body weight) for 16 weeks. Values are given as mean±SEM. Wild type mice are not displayed, as there was no Aβ deposition found.
DISCUSSION
The current study was performed to investigate the potential neuroprotective effect of LY in an in vitro and ex vivo approach. Subsequently, to evaluate the therapeutic potential of LY in advanced AD pathology, aged tg mice with established Aβ deposition were used. This is relevant for a translational research approach for AD as pathogenesis most likely begins years before clinical symptoms occur [29].
FGF21 activates PPARγ [11, 12] and PPARγ in turn initiates glial apoE/abca1 expression, which is known to degrade Aβ plaques [9]. Accordingly, LY application to primary glial cells caused a significant upregulation of abca1 and apoE mRNA expression, underlining the assumption that LY may reduce Aβ plaque formation via proteolytic degradation by abca1/apoE pathway activation as described by Man-drekar-Colucci et al. [9]. This is supported by several other studies reporting that glial cells express high levels of abca1, which contributes to ApoE production in the brain and Aβ clearance by reducing Aβ aggregation [8, 31]. To further address this issue, we used OBSCs representing a physiologically relevant three-dimensional model of the brain [32]. OBSCs are a widely used tool of AD research and serve as bridging technology between cell culture and in vivo experiments to develop novel therapeutic strategies [32]. In doing so, LY administration in hippocampal OBSCs caused a significant reduction of both Aβ plaque number and area indicating that LY may has the potential to degrade Aβ plaques.
Hypometabolism is a pathological hallmark of AD, which may lead to reduced neuronal activity. Accordingly, in AD brains a decrease of [18F] FDG uptake is described implicating synaptic or neuronal impairment/loss [33–36]. Furthermore, APP/PS1 mice have been shown to exhibit reduced SUVs in hippocampus [37], potentially due to diminished expression of glucose transporters-1 and 3 (GLUT-1 and -3) [38]. Similarly, by using in vivo FDG-PET/CT imaging, we observed a reduced glucose uptake in cortex and hippocampus of tg mice indicating diminished neuronal activity. Importantly, GLUT-1 expression is enhanced by FGF21 [39], which may also act to directly stimulate glucose uptake. Now, in presence of comparable systemic blood glucose concentrations LY-treated tg mice exhibited the trend toward increased [18F] FDG uptake in the brain and reached levels as found in wt controls.
Moreover, metabolites, e.g., NAA and Cr, has been shown to be decreased in AD, indicating impaired neuronal integrity either due to diminished neuronal density, neuronal cell loss, or partially reversible neuronal dysfunction [40]. Further, it is described that the NAA to Cr ratio is significantly decreased in APP/PS1 mice [41, 42], as it was also observed in the current study. Again, LY treatment caused a significant improvement of neuronal integrity, as demonstrated by increased NAA/Cr ratios. This interpretation is supported by the qualitative impression of increased cerebral PSD95 protein expression, indicating en-hanced synaptic stability and plasticity.
Beside reduced neuronal activity and integrity, tg mice revealed a severe neuroinflammation as given by a high number of astro- and microglia cells, whereby the latter is of greater importance to AD pathology. Indeed, it has been described that Aβ plaques are surrounded in a size-dependent manner by activated microglia indicating an Aβ plaque-induced neu-roinflammation [2–4]. Neuroinflammation can be reduced by pioglitazone as it was described by Man-drekar-Colucci et al. [9] showing in APP/PS1 mice that microglia cells switched from pro-inflammatory M1 state into an anti-inflammatory M2 state. M2 state glial cells are able to phagocytize Aβ depositions leading to reduced neuroinflammation [9]. In the current study, administration of LY in tg mice also caused a reduction of neuroinflammatory microgliosis. However, in wt mice the neuroinflammation was rather increased upon LY treatment. One explanation for this unexpected result might be a different regulation of energy balance upon LY treatment in wt mice. It is known that FGF21 is involved in the fundamental regulation of energy balance at the whole body level by responding to hormonal and nutrient signals in the central nervous system and peripheral tissues that modulate food intake and energy expenditure [43]. Probably, under physiological conditions LY treatment in wt mice led to an energy abundance in the brain resulting in increased oxidative stress [44]. In turn, oxidant overproduction is being a candidate mechanism to forced neuroinflammation [45, 46]. However, under pathological circumstances LY may lead to a higher energy expenditure indicated by a loss of body weight in tg mice which in consequence may reduce oxidative stress-induced neuroinflammation. However, reduced neuroinflammation in tg mice upon LY was not accompanied by attenuation of Aβ pathology. Accordingly, activation of the Aβ degrading genes pparγ, abca1, and apoE was not observed in LY-treated tg mice (data not shown). Although Aβ deposition remained uninfluenced, neuronal activity and integrity were found improved and neuroinflammation reduced. It is reported that extensive Aβ pathology was not accompanied by other AD hallmarks, e.g., cognitive impairment [47, 48]. This phenomenon raises the question about the validity of Aβ as a causative agent [49]. Therefore, it might be speculated that Aβ depositions exist parallel to other AD typical hallmarks, e.g., decreased synaptic density or increased neuritic atrophy [49] and Aβ does not directly worsen AD pathology. Probably, enhanced neuronal activity and dampened neuroinflammation upon LY treatment occur independently to the developmental status of Aβ pathology.
In summary, this study demonstrated in vitro that LY may activate the PPARy/abca1/apoE pathway re-sulting in a reduction of Aβ plaques. LY treatment in tg mice reduced microgliosis and improved neuronal integrity, without affecting Aβ pathology. Nevertheless, LY could be used as therapeutic agent to treat advanced AD-related symptoms such as microgliosis or impaired neuronal integrity.
Footnotes
ACKNOWLEDGMENTS
The authors cordially thank the technicians of the Institute for Experimental Surgery, Central Animal Care Facility, Core Facility Multimodal Small Animal Imaging for their valuable assistance and the staff of the Department of Nuclear Medicine for the production of the radiotracer [18F] FDG. This study was supported by a grant from the Deutsche Forschungsgemeinschaft, Bonn, Germany (KU 3280/1-2).