
Abstract
Background:
Altered plasma levels of sphingolipids, including sphingomyelins (SM), have been found in mouse models of Alzheimer’s disease (AD) and in AD patient plasma samples.
Objective:
This study assesses fourteen plasma SM species in a late-onset AD (LOAD) patient cohort (n = 138).
Methods:
Specimens from control, preclinical, and symptomatic subjects were analyzed using targeted mass-spectrometry-based metabolomic methods.
Results:
Total plasma SM levels were not significantly affected by age or cognitive status. However, one metabolite that has been elevated in manifest AD in several recent studies, SM OHC14:1, was reduced significantly in pre-clinical AD and MCI relative to normal controls.
Conclusion:
We recommend additional comprehensive plasma lipidomics in experimental and clinical biospecimens related to LOAD that might advance the utility of plasma sphingomyelin levels in molecular phenotyping and interpretations of pathobiological mechanisms.
INTRODUCTION
Alzheimer’s disease (AD) is the most common cause of dementia [1], affecting over 5 million Americans each year. To date there are few marketed and validated disease modifying therapies, and the basic science community still strives to clarify the pathogenic mechanism(s) of AD. A class of phospholipids, sphingolipids, has been identified as dysregulated in several metabolomic studies and implicated as biologically relevant in AD. Sphingolipids are highly enriched in the central nervous system (CNS), in both grey and white matter [2, 3]. Sphingomyelins are a sphingolipid that contains a phosphocholine group that is catalytically exchanged with hydrogen to produce ceramides (Cers) by sphingomelinases (SMases) (Supplementary Figure 1). Elevation of Cers in AD in plasma [4 –7], serum [8, 9], and brain [10 –13] is relatively well-established, and has been associated with apoptotic cell death. However, findings on alterations in SMs between phenotypic controls and AD subjects have been much less consistent (Supplementary Table 1). Treatment of AD mouse models with intraperitoneal injection of liposomes containing cholesterol and sphingomyelins (SMs) [16] has been shown to reduce plaque pathology and delay the onset of cognitive impairment. These studies have motivated the investigation of lipid based dietary interventions, such as the LipiDiDiet [17] for prevention of AD. A number of metabolomic investigations have identified systemic lipid dysregulation in AD patients during the preclinical stages of disease [18]. However, SM levels fluctuate with age, and several reports have found that the effect of SM levels on AD risk may differ by sex and apolipoprotein E (APOE) genotype [6 , 15].
In this study, we attempted to clarify whether plasma SM levels are altered pre-clinically or after manifest AD symptoms develop in a LOAD cohort. We investigated SM chain lengths varying from C14 to C26, including saturated and unsaturated, hydroxylated and non-hydroxylated species. Our study cohort included both male (54) and female (87) subjects, allowing us to investigate whether there was sex-specific enrichment of SMs in control, pre-clinical, or manifest AD groups. We further investigated whether APOE genotype has an impact on plasma SM levels in our cohorts.
MATERIALS AND METHODS
Participants
Our study subjects represent a subset cohort selected from a larger observational study group; the Rochester/Orange County Aging Study (R/OCAS) [19, 20]. This cohort features otherwise healthy, community-dwelling seniors followed yearly for signs of transition to clinical stages of LOAD. Study protocols and informed consent documents were reviewed and approved by institutional review boards (IRBs) at the participating institutions, including the University of Rochester (UR), the University of California Irvine (UCI), Georgetown University (GU), the National Institute of Neurology and Neurosurgery in Mexico City (INNN), and the University of California at Los Angeles (UCLA). Written informed consent was obtained from all participating subjects according to the Declaration of Helsinki. All study participants underwent neuropsychological testing and blood draws per respective protocols. All study participants had agreed that their de-identified clinical information and specimens could be involved in future investigations, including analyses of neuropsychological information, blood specimens (including genetic testing and other analyses), and other clinically relevant information. All blood specimens were de-identified at the original study sites, and the biomarker and metabolomic teams associated with this study were blinded as to individual subject identities.
The demographic and clinical characteristics of our study cohort are presented in Table 1. Nearly two thirds of participants were female. Patients for whom age, gender, or mild cognitive impairment (MCI)/AD diagnosis was not available were excluded from analysis. Demographic information including age, education level, and Mini-Mental State Examination (MMSE) is available for all participants, with MMSE values declining in the symptomatic clinical stages (MCI/AD). In the initial study design, subjects in each group (NC, Converterpre (Cpre), and MCI/LOAD) were matched for education, age, and gender. MCI and AD groups were subsequently analyzed separately; ANOVA revealed no significant differences between these groups in education, age, or gender.
Baseline demographics of study cohort. Average age in years, education score, and MMSE score with standard deviation in parentheses. Number of females with percent female in parentheses
In this investigation 138 subjects from the R/OCAS cohort were phenotypically divided into three groups via longitudinal neuropsychological examinations using previously reported cognitive measures [20]. Subject groups were as follows: normal controls (NC), n = 67; Cpre, n = 28; and amnestic MCI (aMCI)/AD, n = 43 (including MCI, n = 12, AD, n = 31) a total of 138 subject specimens for analysis. Detailed cognitive assessments in this cohort in each of these groups are previously published, including composite scores for attention, executive function, language, visuoperceptual function, and memory [20]. The primary assessment of memory used was the Rey Auditory Visual Learning Test. The test was used to generate three sub-scores: learning, retrieval, and retention. These three scores were converted to an empirical Z-score by subtracting the sample mean and dividing by sample standard deviation. The three Z-scores were then averaged to obtain a composite memory Zmem score. The Zmem score was adjusted for age, gender, education, and visit using linear generalized estimating equation models, using a homoscedastic working independence covariance matrix. The aMCI/AD group was defined to be those whose adjusted Zmem score on the last available visit was at least 1 interquartile range (IQR) below the median. The participants with aMCI and mild AD were combined into a single group (aMCI/AD) because aMCI is thought to reflect the earliest clinically detectable stage of AD [21]. Converters were defined as the subgroup of aMCI/AD patients whose Zmem score at baseline was no more than 1 IQR below the median. The NC group was defined as participants whose first and last visits both had central scores.
Genetic testing
Members of the R/OCAS cohort provided coded, de-identified blood specimens from which leukocyte DNA was extracted using a QIAamp DNA Mini Kit and a QIAcube (Qiagen, Inc, Valencia, CA, USA). From the extracted DNA, APOE genotypes were determined with a TaqMan® SNP Genotyping Assay using manufacturer’s protocol (Applied Biosystems, Inc., Warrington, Cheshire, UK), as previously described [22 –24].
Metabolomic analyses
All blood specimens from the R/OCAS were collected according to protocol and shipped to the GU Biomarker Laboratory and Biorepository for processing and storage as previously reported [20]. All quantitative targeted metabolomic analyses were carried out at the GU Metabolomics Shared Resource Facility by one of our collaborators using described methods [20]. Lipids were extracted by mixing 25μL of plasma with 175μL of extraction buffer (25%acetonitrile in 40%methanol and 35%water) containing internal standards: debrisoquine, 4-nitrobenzoic acid, ceramide, and LPA. Samples were incubated on ice for 10 min and centrifuged at 14,000 rpm at 4°C for 20 min. Supernatant was transferred to a fresh tube, dried under vacuum, and reconstituted in buffer containing 5%methanol, 1%acetonitrile, and 94%water. The samples were centrifuged at 13,000 rpm 4°C for 20 min, and supernatant was transferred to a glass vial. Targeted metabolomic measures were accomplished on a triple quadrupole mass spectrometer (Xevo TQ-S, Waters Corp., Milford, MA, USA) coupled with an Acquity ultraperformance liquid chromatography (UPLC) system (Waters Corp., Milford, MA, USA) operating in multiple-reaction-monitoring (MRM) mode. This approach is based on electrospray ionization liquid chromatography–mass spectrometry (ESI-LC-MS/MS), with tandem MS (MS/MS) measurements using the Biocrates Absolute-IDQ ™ P180 (BIOCRATES Life Sciences AG, Innsbruck, Austria) kit. This validated targeted assay [24] utilizes MRM for simultaneous detection and quantification of 144 lipid species, using small plasma volumes in a high-throughput (96-well plate) format. For the calculation of metabolite concentrations, internal standards serve as a reference. Levels of several phospholipid species from this MS analysis, including phosphatidlycholines and lyso-phosphatidylcholines, have previously been published and validated as a panel of predictive biomarkers for LOAD [19, 20]. In this study due to high interest and promising literature in the field we specifically examined SM species. Fourteen distinct SM species were quantified: SM (OH) C14:1; SM (OH) C16:1; SM (OH) C22:1; SM (OH) C22:2; SM (OH) C24:1; SM C16:0; SM C16:1; SM C18:0; SM C18:1; SM C20:2; SM C24:0; SM C24:1; SM C26:0; and SM C26:1, for each of our study participants. Quantitative levels of SM species determined to be above the level of detection (LOD) and are defined in micromolar (μMol/L) units.
Data analysis
Plasma lipids concentrations were quantified in units of μMol/L, and statistical analyses were performed using STATA Data Analysis and Statistical Software and IBM SPSS.
Total SM analysis
Values for total SM were calculated by adding the sum of all SM species measured. Shapiro-Wilk test was performed to confirm that total SM values for all subjects were normally distributed. ANOVA analysis stratified by group (NC, CPre, MCI/AD) was performed, with covariates of age and gender. Significance of the overall ANOVA model was determined by α value of p < 0.05. If significance was reached, we then analyzed the variables in the ANOVA model and report which two variables were significantly different with a separate p value.
Gender analysis
A statistically significant effect for gender was observed in total SMs, therefore plasma levels of each individual sphingomyelin species were compared between male and female subjects in each group. Two-tailed student’s T-tests were performed, and significance was determined using Bonferroni correction for multiple comparisons.
Analysis of SMs with age
Total SMs were plotted by age in all patients and in male and female patients separately. Linear regression was performed to determine whether there was a significant trend with age and a significant difference in trend between males and females.
Analysis of hydroxylated and individual SM species
Total SM was divided into hydroxylated (OH) and unhydroxylated (no-OH) species. ANOVA was performed to analyze whether group impacts levels of OH or no-OH species. The ratio of all OH/no-OH species was also calculated from these subgroups and analyzed by ANOVA. As an exploratory sub-analysis to guide future studies, abundance of each of the fourteen individual SM species measured was analyzed by group stratified ANOVA. Linear modeling corrected for age and gender was used for pairwise comparisons to examine the differences between groups for individual SM species.
APOE SM analysis
Subjects who carried at least one copy of APOE2 (2/2 or 2/3) or APOE4 (4/4 or 3/4) were grouped into APOE2 or APOE4 categories respectively. APOE3 represents patients with APOE 3/3, and APOE 2/4 patients were excluded from analysis. Total SMs for APOE2, APOE3, and APOE4 subjects were analyzed by ANOVA.
RESULTS
Plasma SM concentrations for each group are summarized in Table 2. The sum of all SM species was normally distributed and passed the Shapiro-Wilk test for normality (W = 0.986) (Supplementary Figure 2). ANOVA was used to determine whether plasma levels of all SM species measured differed between groups. After adjusting for age and gender effects, ANCOVA revealed no significant effect of group on total SM levels (Fig. 1A). ANCOVA analysis of each gender separately also revealed no significant effect of group on total SM levels (Fig. 1B). When SM species were divided into subgroups of OH and no-OH species, ACNOVA adjusted for age and gender revealed no significant differences between group in OH species, No-OH species, or the OH/no-OH ratio (Table 2).
Plasma SM levels in μMol/L
Standard deviation in parentheses. “All” stands for the sum of all fourteen SM species measured. OH is the sum of all hydroxylated species, No-OH is all non-hydroxylated species, and OH/No-OH is the ratio of these two sums.
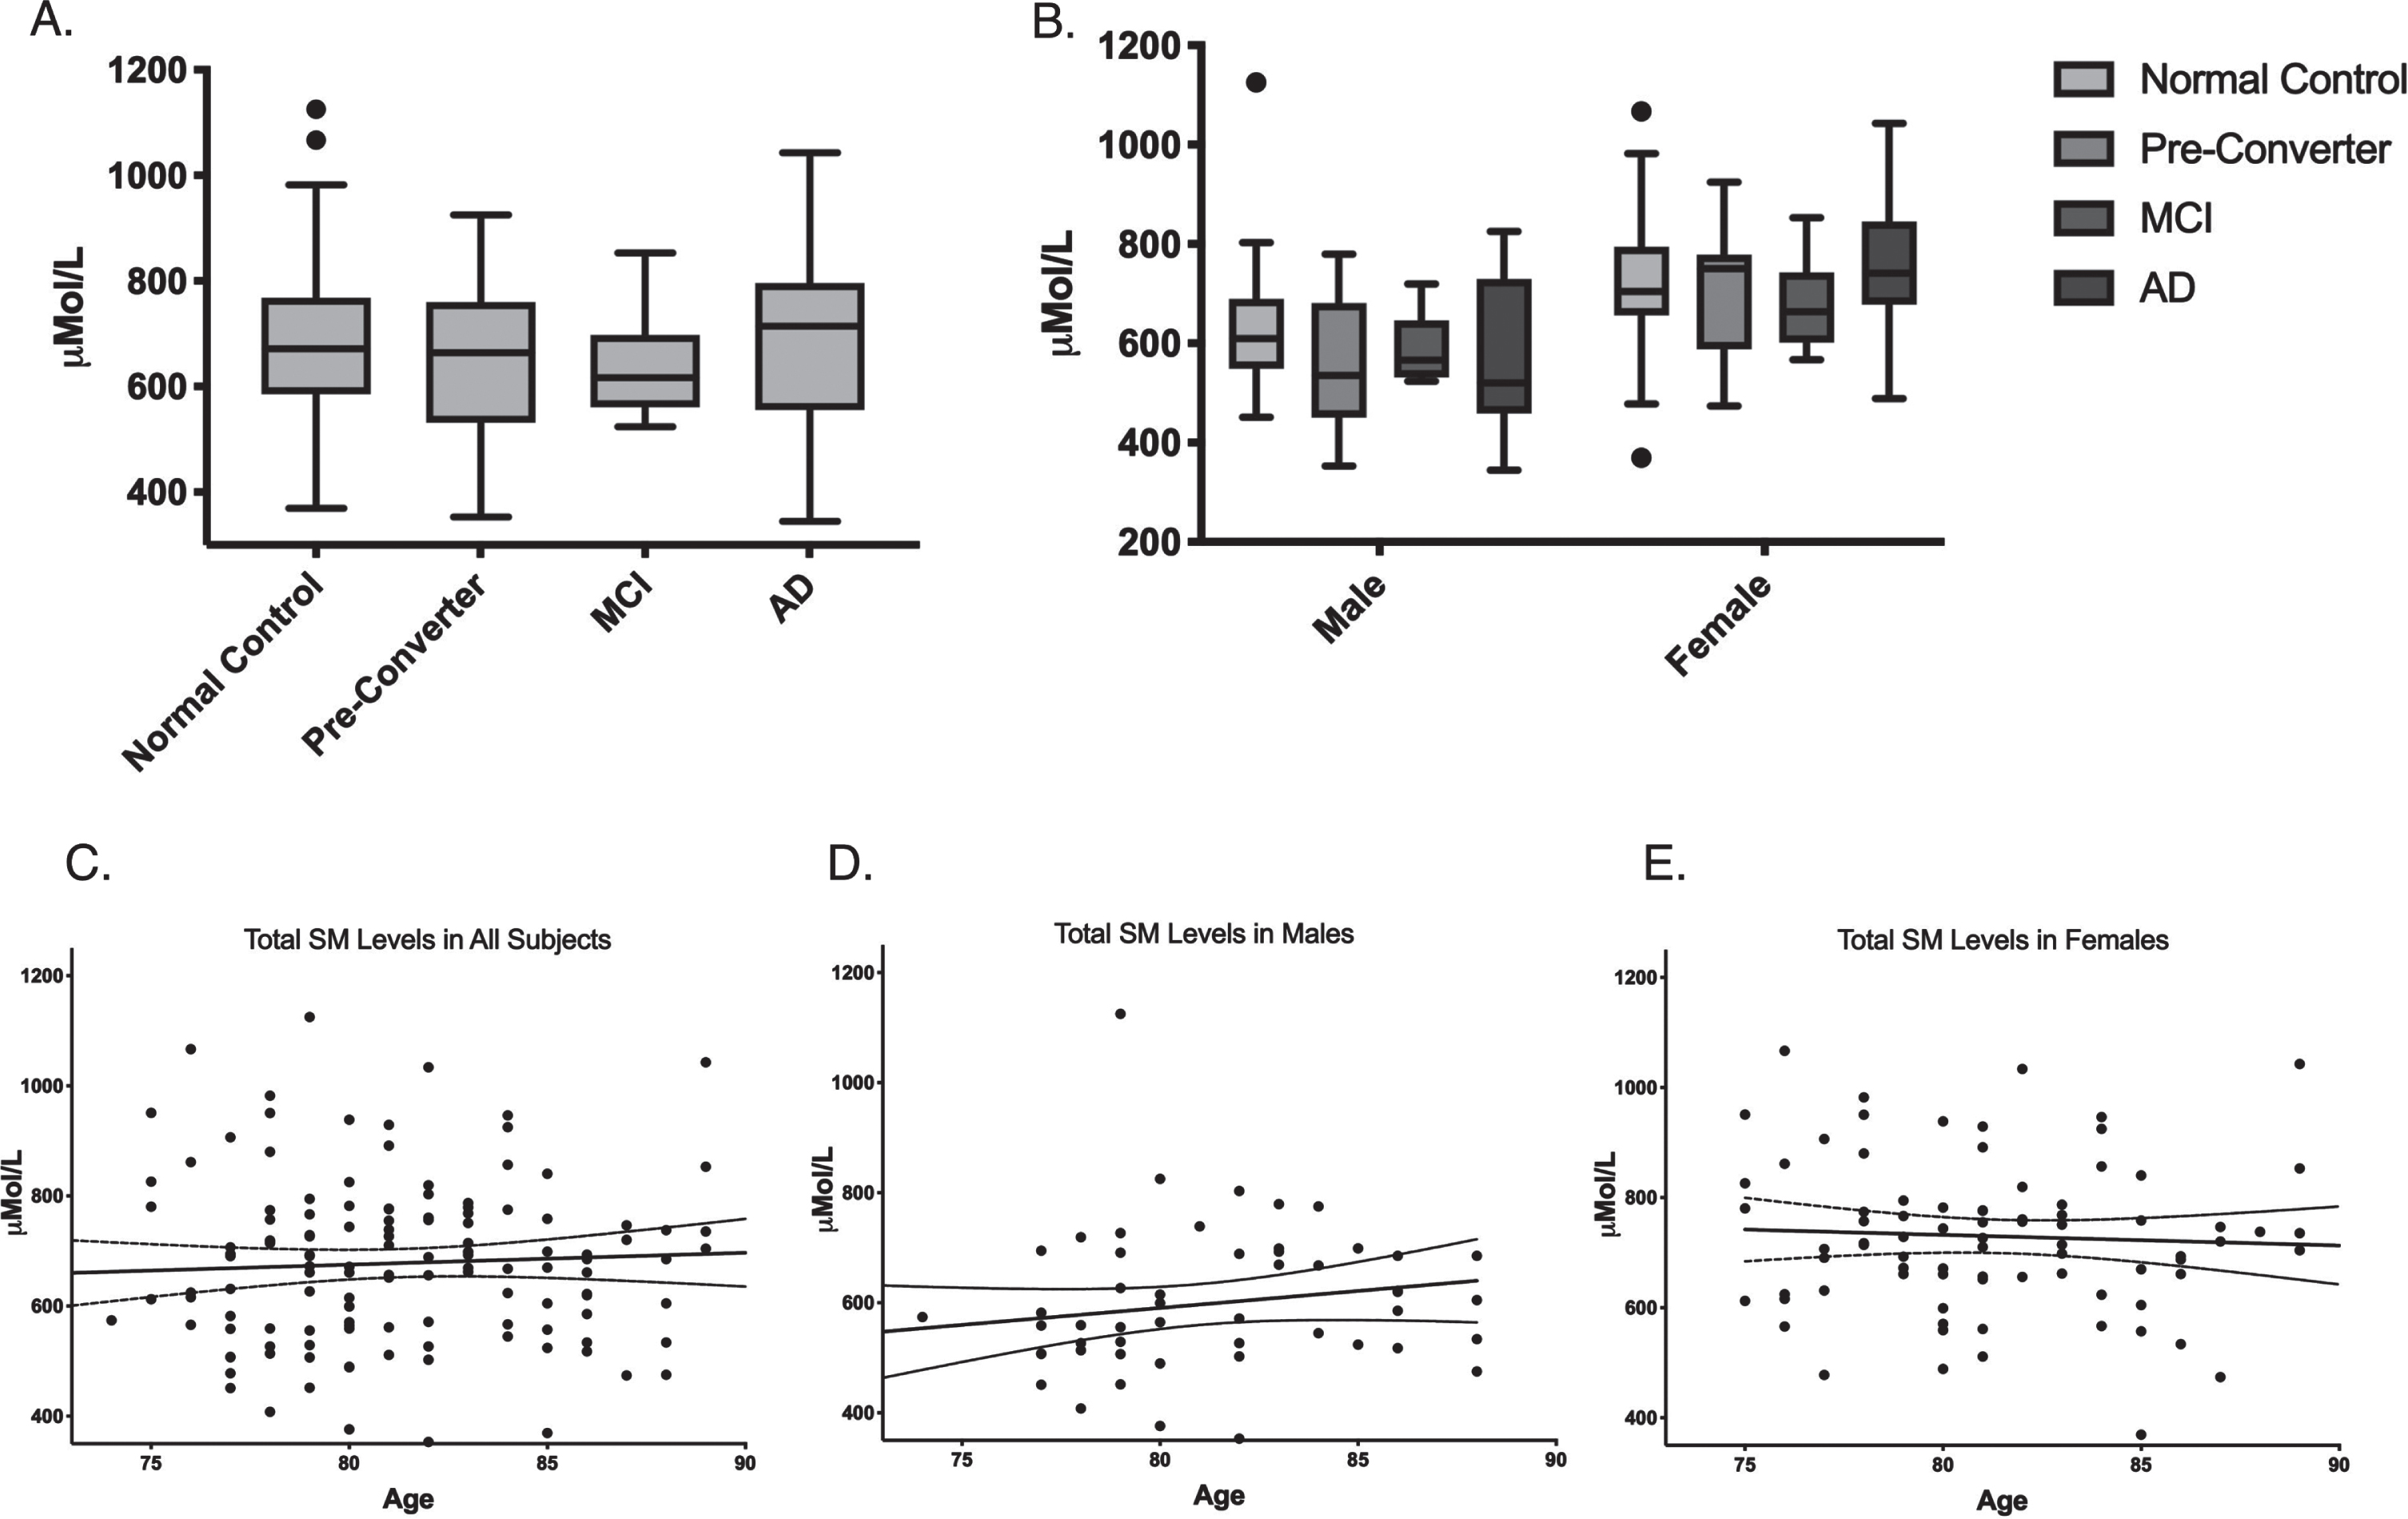
Sphingomyelin levels do not significantly differ by cognitive state or age. A) Total plasma SM levels in μMol/L separated by disease state. B) Total plasma SM levels in μMol/L separated by gender and disease state. Box plot center line represents mean, upper and lower bounds are 25th and 75th percentile. Whiskers generated by Tukey method; outliers plotted as points beyond whiskers. C) Scatter plots of plasma levels of the sum of all SM species μMol/L by age in all subjects. Each point represents one individual. Linear regression and 95%confidence intervals shown. D) Scatter plots of plasma levels of the sum of all SM species μMol/L by age in males. E) Scatter plots of plasma levels of the sum of all SM species μMol/L by age in females.
SM levels were significantly higher in females than in males in eleven out of the fourteen species measured (Table 3) and were higher in females than in males in each group (Fig. 1B). Linear regression revealed no significant trend in total SM levels with age in males, females, or all subjects combined, and no significant difference in trend with age between males and females (Fig. 1C-E).
Average plasma SM levels in μMol/L divided by gender
Male and Female SM levels were compared by two-tailed student’s T-test. When Bonferroni correction is applied, p values of < 0.0035 are significant, indicated in bold.
We performed exploratory analysis to investigate differences in any of the fourteen individual SM species that were measured. This included SM acyl chains ranging from 14 to 26 carbons long, with four saturated and ten unsaturated species with up to two double bonds. After correcting for age and gender, SM OHC14:1 is significantly altered (p = 0.02) when groups are analyzed with MCI and AD groups combined (Fig. 2). Pairwise comparison revealed that this difference is explained by the significant decrease in CPre (p = 0.005) relative to control. When MCI and AD groups were separated, ANCOVA revealed a marginally significant group effect (p = 0.055), and comparison between each group using a linear model revealed significantly reduced levels of SM OHC14:1 in the MCI group compared to normal controls (p = 0.02). There is also a significant effect of gender on this SM species (Table 3), with higher levels in females.
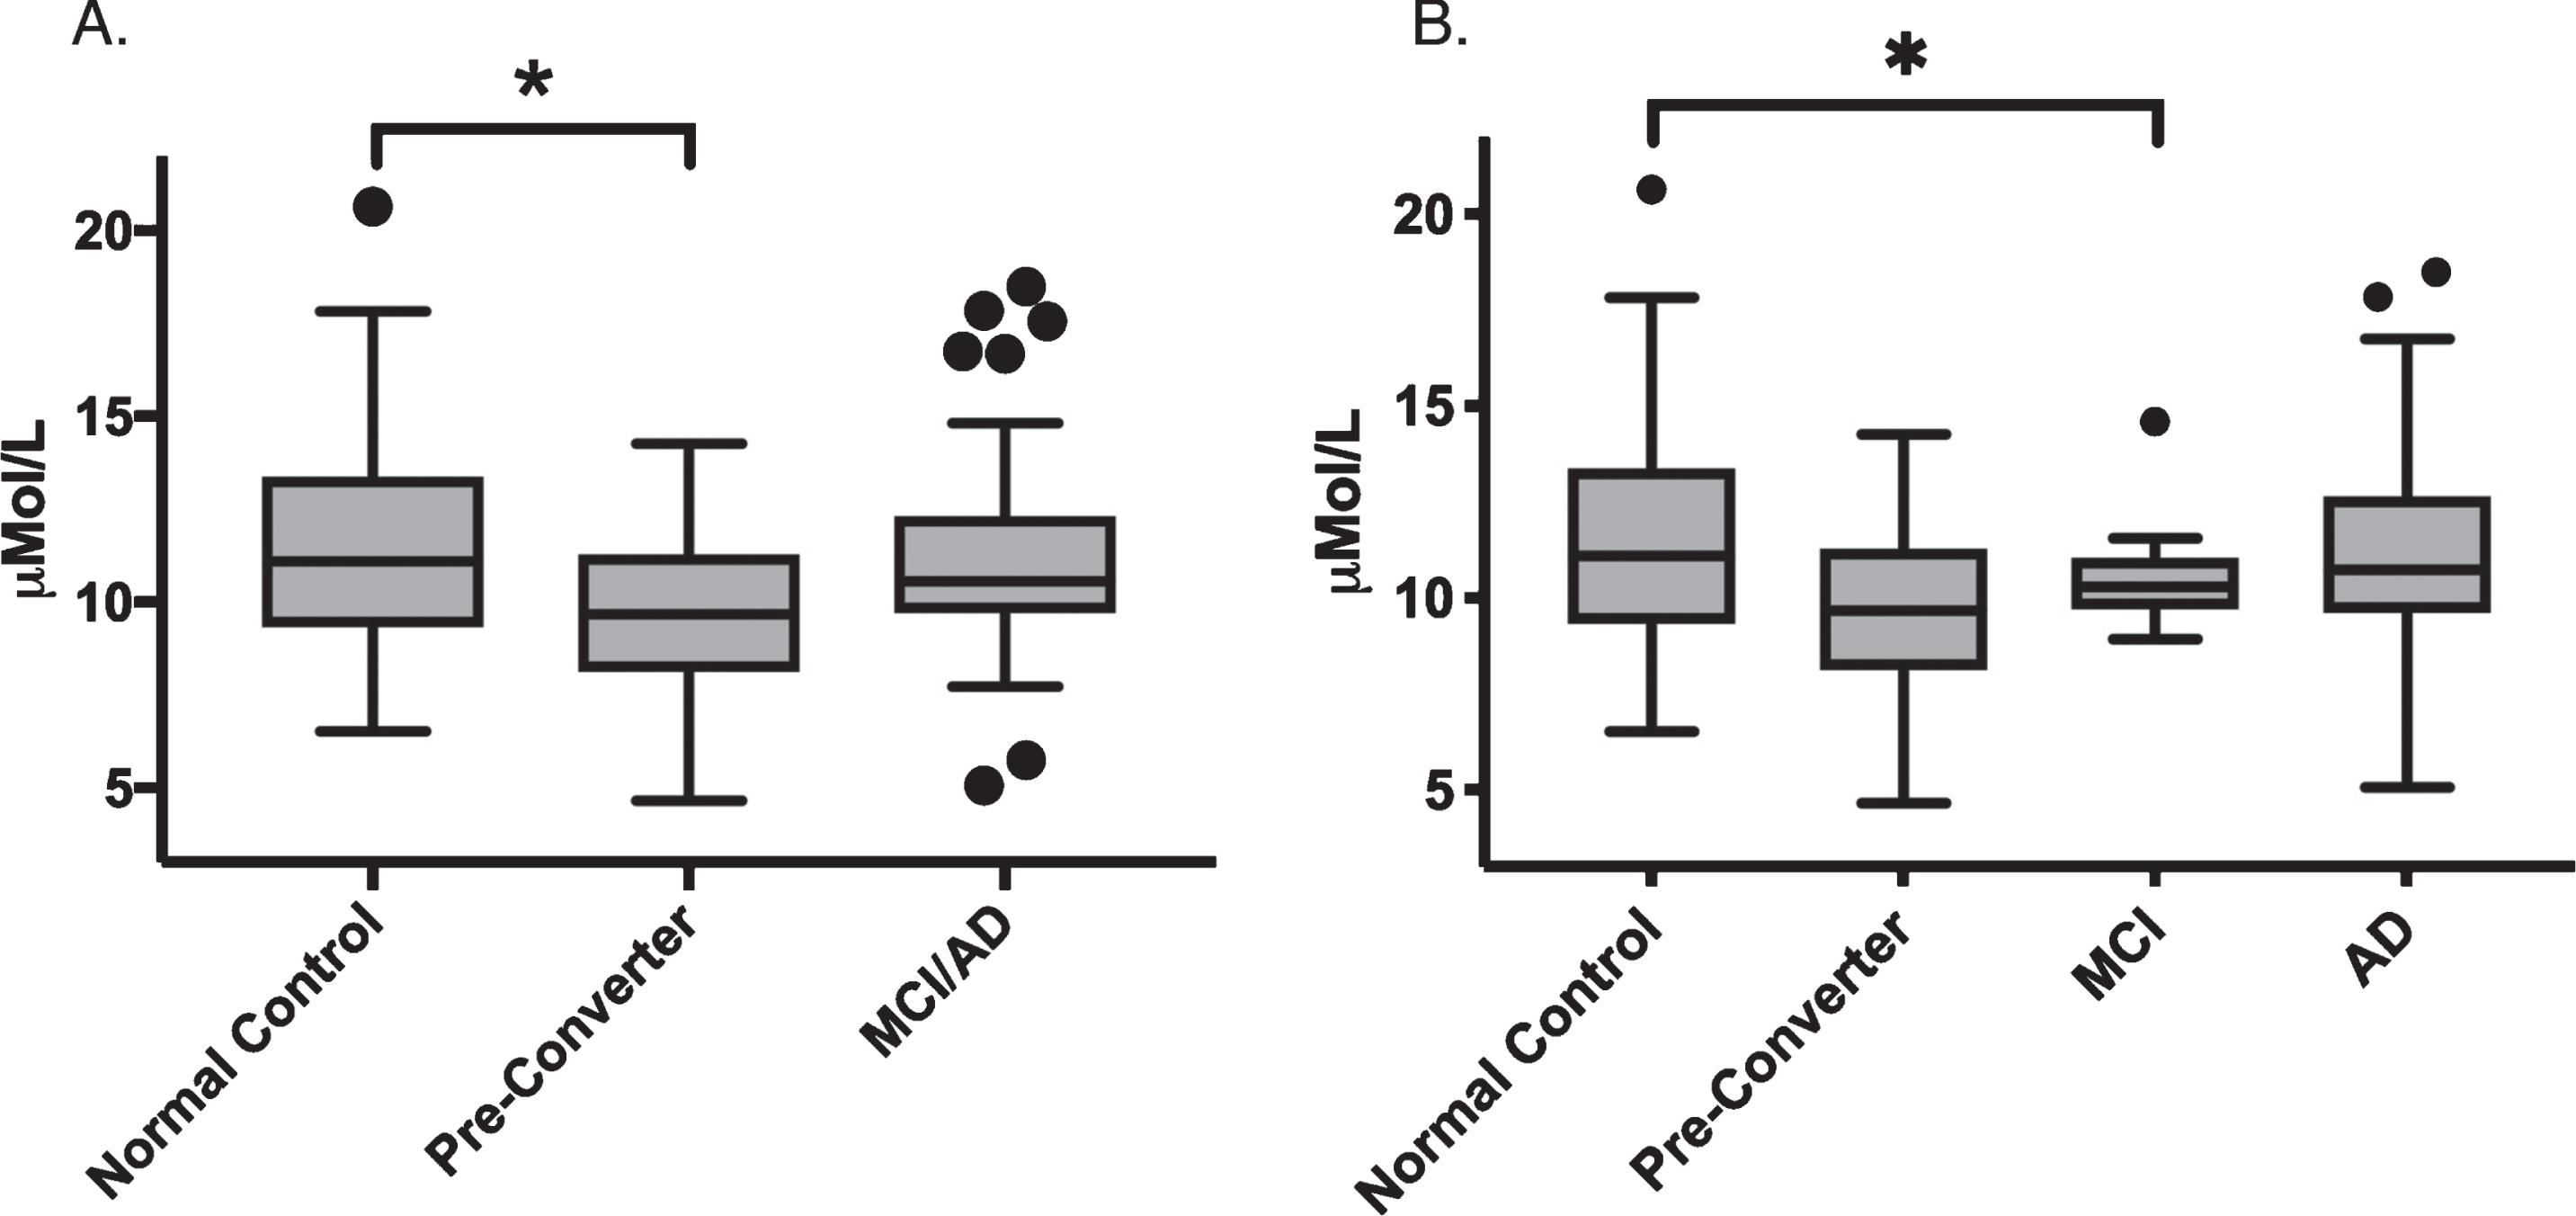
Plasma levels of SM (OH) C14:1 in μMol/L separated by group. (A) Analysis with MCI/AD grouped. (B) Analysis with MCI/AD separate. Box plot center line represents mean, upper and lower bounds are 25th and 75th percentile. Whiskers generated by Tukey method; outliers plotted as points beyond whiskers. Linear modeling analysis revealed p < 0.05 in (A) and (B). Asterisk indicates significant differences in pairwise comparisons after adjustment for age and gender, p < 0.05.
APOE allele genotypes (2/2, 2/3, 3/3, 3/4, 4/2, and 4/4) were determined. The majority of subjects had APOE 3/3, but the APOE4 allele was over-represented in disease, with APOE 3/4 comprising 39%of the MCI/AD group, compared to only 23%in the NC group and 26.9%of the total subjects. ANOVA analysis revealed no significant effect of APOE genotype on total SM levels when all subjects are analyzed together or separated by gender (Supplementary Figure 3).
DISCUSSION
In this study, plasma SM levels were assessed in a cohort of normal control, pre-conversion, and MCI/AD patients. We found no significant difference in SM levels between these groups, however levels of one species, SM OHC14:1, were reduced in the Cpre and MCI groups relative to control subjects.
There is a substantial body of literature suggesting that sphingolipids may be dysregulated in AD (Supplementary Table 1). Recent studies have generated a consensus that SM levels may be elevated in AD [8 , 25–27], and the ratio of SMs to Cers decreased in AD blood plasma [7, 28] and brain tissue [11]. However, SMs were reduced in one instance in late onset Alzheimer’s disease (LOAD) patient plasma [29]. In LOAD patient brain, SMs were reduced in one study [30] and increased in another [31]. In cerebrospinal fluid (CSF), SMs have been reported either increased [32, 33], or reduced [8, 34]. In FAD rodent models, SMs are altered in brain depending on the region studied or specific SM species, with an increase in saturated species in the cortex and cerebellum and a decrease in unsaturated species in the hippocampus [35]. SMs have also been found to be increased [36] or reduced in plasma [37, 38]. These inconsistencies in the literature may be due to several factors, including model or patient samples used, which tissue is studied, demographics of the study subjects, or exact timing of sample collection [39]. The aforementioned publications showing SM dysregulation in AD led our group to revisit a dataset previously used for discovery and validation of a panel of lipid biomarkers predictive of LOAD [19, 20] to specifically analyze SM levels. Our finding of reduced SM OHC14:1 in Cpre and MCI groups suggests that SMs in plasma may be most dysregulated immediately before symptom onset and re-equilibrate to control levels later in disease. Previous metabolomics studies have suggested that elevation of several SM species predicts conversion from MCI to AD [26, 27]. This is consistent with the trend observed in our study of a non-significant increase in SM OHC14:1 and total SMs in the AD group compared to Cpre and MCI groups.
A similar reduction of plasma lipid levels in the CPre subjects, but not MCI/AD, has been noted in a separate metabolomic analysis in this same cohort [20] and others [40]. The CPre state in the LOAD cohort includes patients within 2 to 5 years of phenoconversion to a state of cognitive impairment. This may be a critical period during which dysregulation of CNS metabolic pathways may present as alterations in plasma metabolites. While CSF offers the most direct information regarding dysregulation of metabolites during disease in the CNS, CSF collection can be painful and subjects patients to the risk of complications. Plasma could feasibly be collected regularly from the same patient to monitor metabolite changes over time.
It was recently found in several studies that SM OHC14:1 was significantly increased in AD [26 , 41], and alterations in SMs with C18, 22, and 24 have also been found [7 , 42] in AD patients. To determine whether any particular SM species had an impact on SM dysregulation, we investigated changes in plasma levels of each of the fourteen SM species measured between groups. SM OHC14:1 was significantly reduced in the Cpre group compared to normal controls, and when MCI and AD were examined separately pairwise comparisons revealed SM OHC14:1 was significantly lower in MCI relative to normal controls. Future studies will be necessary to determine what makes this particular hydroxylated, unsaturated species significant in AD pathology.
Although future investigation will be required to clarify the biological mechanisms of dysregulation SM OHC14:1, previous work suggests that SMases may be activated to convert SMs to Cers in AD, [43, 44] potentially contributing to lower SM levels in the Cpre or MCI groups. Several previous investigations have found a reduced SM/Cer ratio in AD [7 , 28], and Cers are consistently increased in AD [4–9 , 45]. Ceramides promote Aβ generation by stabilizing β-secretases and may contribute to AD pathology by depolarizing mitochondria, increasing production of reactive oxygen species [46] and exosomes [47], modulating apoptotic signaling [48], and causing dysregulated autophagy and reduced lysosomal biogenesis [49, 50]. Paradoxically, while SMases and ceramides have been noted to be elevated in AD, several studies have shown that SM synthases can increase Aβ [51, 52] and that accumulation of SMs impairs lysosomal degradation of AβPP [53], further demonstrating the complexity of sphingolipid imbalance in AD. This study did not include measures of SMase activity or levels of Cers, and future work is needed to determine the scope of sphingolipid dysregulation in Cpre patients.
Plasma SM levels are consistently higher in healthy women than in men [14, 54]. In our cohort, SMs were significantly higher in females than in males in eleven out of the fourteen species measured (Table 3). Mielke et al. have shown that in men, high levels of SMs increase risk of AD, whereas in women high levels of SMs reduced risk of AD [6]. In this study, when males and females were analyzed separately, no significant difference was observed in SM levels in the Cpre state, however on average in the males had decreased SMs and females had increased SMs in the Cpre state.
Previously, Mielke et al. have found that in healthy subjects, levels of some SM species increased with age, and other species increased until a decline began at age 70–80 in both males and females [14]. Couttas et al. found that in males, SM was positively associated with aging, whereas in females no such correlation existed [15]. In our cohort, linear regression revealed no significant difference in trend of total SMs with age between males and females, and no significant trend in total SM levels with age in all subjects, males, or females (Fig. 2). This may be because the subjects in our study were older, with average age of 81, whereas subjects in Mielke et al. had an average age of 63.
APOE4 is the greatest genetic risk factor for LOAD [55] and has previously been reported to decrease SM levels in AD brain tissue [30]. In Mielke et al., the apparent protective effect of SM enrichment in women was most pronounced in APOE4 carriers [6]. Reducing SM reduces APOE secretion from macrophages, suggesting that altered sphingolipid balance may impair APOE mediated lipid transport [56]. No significant effect of APOE genotype on SM levels was observed in our cohort (Supplementary Figure 3). Future studies including a larger number of APOE 2/2 and APOE 4/4 individuals may reveal APOE genotype effects on SM levels.
In conclusion, SM OHC14:1 is reduced in preclinical LOAD and MCI. Future metabolomic and biochemical studies will be necessary to further clarify the temporal and gender-specific pattern of SM dysregulation in AD, and the effect of SM dysregulation on AD-related biological processes. These studies of plasma lipid levels have great potential to move the field towards discovery of lipid dyshomeostasis preceding AD symptoms that may be targeted to develop novel, disease-modifying therapeutics.
Limitations
We observed dysregulation of SM OHC14:1 in the Cpre group compared to NC; however, it is not clear whether this dysregulation has a causal relationship to the disease state that follows, or whether there are additional confounding factors that affect both risk for AD and levels of SMs. For example, hyperlipidemia (elevated blood low density lipoprotein) may affect both risk of developing AD and sphingomyelin levels. However, while hyperlipidemia at midlife is associated with higher risk of developing AD [57, 58], it is associated with increased SM levels [59]. We observed reduced SM OHC14:1 levels in the Cpre group, opposite what would have been predicted if hyperlipidemia caused the dysregulation. However, a limitation of this study is that blood LDL, HDL, and triglyceride levels were unknown, groups were not matched for LDL and triglyceride levels, and LDL and triglycerides were not used as covariates in our analyses.
An additional factor affecting AD, hyperlipidemia, and SM levels, is vitamin D status. Vitamin D deficiency is associated with hyperlipidemia [60] and AD [61]. Vitamin D deficiency is also associated with lower SM levels in serum and higher levels of Cers [62], and vitamin D supplements conversely increase serum levels of SM [63]. This is consistent with the reduced SMs we found in the Cpre group. Thus, vitamin D deficiency may contribute to both SM reduction and pre-clinical AD. A limitation of this study is that we have no data on vitamin D levels.
Our study utilized a targeted metabolomic approach to investigate plasma SMs. Our targeted approach allowed quantitative assessment of only 14 SM species, the only SM analytes currently available in the targeted analytic kit, and significantly fewer than the total number present in plasma. In addition, the targeted kit did not provide the option for examination of plasma levels of associated Cer or related sphingolipid species. We expect that broader targeted metabolomic options will address these issues in the near future. An untargeted metabolomic approach, while providing a more complicated analysis, would have afforded a less biased and more comprehensive comparison of annotatable plasma SM and Cer analytes between groups, and a more thorough understanding of the sphingolipidome. Despite these constraints, we believe that the targeted approach provided useful comparisons of SM species in this LOAD cohort.
As with many clinical studies, an additional limitation to our analysis is the relatively small number of subjects in both preclinical and clinical groups. It is clear to us that additional comprehensive metabolomic investigations of SM and Cer species (as well as other metabolites) in other LOAD and familial AD cohorts are necessary to further confirm pre-clinical SM dysregulation.
Footnotes
ACKNOWLEDGMENTS
We thank Eileen Johnson, RN, and Dana Greenia, RN, for blood collections; R. Padilla, I. Conteh, J. McCann, and D. Phelps for their assistance in cataloging, processing, and storage of the blood specimens at Georgetown University in preparation for metabolomic analyses. We also thank R. Singh and P. Kaur at Georgetown University for technical assistance in developing the metabolomics data. Research support for this project was provided in part by NIA (K08 AG-22228 and F30 AG-060704), the Dominantly Inherited Alzheimer Network (NIA U19 AG032438), the UCLA Clinical Translational Research Institute (1UL1-RR033176), the Alzheimer’s Disease Research Center Grants (P50 AG-16570 and P50 AG-005142), the General Clinical Research Centers Program (M01-RR00865), the NIH (NIA R01 AG030753); the Patricia J. Harvey Current Use Research Fund at Georgetown University to MS Fiandaca; and the Department of Defense of the United States (W81XWH-09-1-0107) to HJ Federoff.