
Abstract
Background:
TAR DNA-binding protein 43 (TDP-43) has been recognized as a frequent co-pathology of Alzheimer’s disease (AD). The effect of the presence of TDP-43 pathology on in vivo measures of AD-related amyloid pathology using amyloid sensitive PET is still unresolved.
Objective:
To study the association of TDP-43 pathology with antemortem amyloid PET signal.
Methods:
We studied 30 cases from the ADNI autopsy sample with available ratings of presence of TDP-43 and antemortem amyloid sensitive 18F-FlorbetapirPET. We used Bayesian regression to determine the effect of TDP-43 on global and regional amyloid PET signal. In a post-hoc analysis, we assessed the association of TDP-43 pathology with antemortem memory performance.
Results:
We found substantial to strong evidence for a negative effect of TDP-43 (Bayes factor against the null model (BF10) = 9.0) and hippocampal sclerosis (BF10 = 6.4) on partial volume corrected hippocampal 18F-Florbetapir uptake. This effect was only partly mediated by the negative effect of TDP-43 on hippocampal volume. In contrast, Bayesian regression supported that there is no effect of TDP-43 on global cortical PET-signal (BF10 = 0.65). We found an anecdotal level of evidence for a negative effect of TDP-43 pathology on antemortem memory performance after accounting for global amyloid PET signal (BF10 = 1.6).
Conclusion:
Presence of TDP-43 pathology does not confound the global amyloid PET-signal but has a selective effect on hippocampal PET-signal that appears only partially dependent on TDP-43 mediated atrophy.
Keywords
INTRODUCTION
Clinico-pathological association studies have established that global increase of amyloid sensitive positron emission tomography (PET) signal reflects the cerebral accumulation of amyloid-β (Aβ) pathology [1–4]. Additionally, comorbid non-Alzheimer’s disease (AD) pathology may impact the amyloid PET signal [5]. One frequent comorbid pathology of AD is the presence of the TAR DNA-binding protein 43 (TDP-43) with and without hippocampal sclerosis [6].
Here, we used 18F-Florbetapir-PET scans and neuropathological data from the Alzheimer’s Disease Neuroimaging Initiative (ADNI) cohort to determine associations of TDP-43 with and without hippocampal sclerosis with hippocampal 18F-Florbetapir-PET signal. We assessed whether TDP-43 pathology with and without hippocampal sclerosis would be inver-sely associated with 18F-Florbetapir-PET signal in the hippocampus, reflecting the degree of TDP-43 related hippocampus atrophy [7]. In addition, we assessed the contribution of TDP-43 pathology to global amyloid PET signal.
MATERIAL AND METHODS
Data source
Data used in the preparation of this article were obtained from the ADNI database (http://adni.loni.usc.edu/). The ADNI was launched in 2003 by the National Institute on Aging, the National Institute of Biomedical Imaging and Bioengineering, the Food and Drug Administration, private pharmaceutical companies and non-profit organizations, with the primary goal of testing whether neuroimaging, neuropsychologic, and other biologic measurements can be used as reliable in vivo markers of AD pathogenesis. A fuller description of ADNI and up-to-date information is available at http://www.adni-info.org.
Standard protocol approvals, registrations, and patient consents
All procedures performed in the ADNI studies involving human participants were in accordance with the ethical standards of the institutional research committees and with the 1964 Helsinki declaration and its later amendments. Written informed consent was obtained from all participants and/or authorized representatives and the study partners before any protocol-specific procedures were carried out in the ADNI studies.
Study participants
We retrieved the last available 18F-Florbetapir-PET scans of 30 ADNI subjects who had come to autopsy between 2007 and 2017. Detailed inclusion criteria for the antemortem diagnostic categories can be found at the ADNI web site (http://adni.loni.usc.edu/methods/). Cognitively normal (CN) subjects had MMSE scores between 24–30 (inclusive), a CDR = 0, were non-depressed, non-mild cognitive impairment (MCI), and non-demented, and reported no subjective memory concerns. MCI subjects had Mini-Mental State Examination (MMSE) scores between 24–30 (inclusive), a subjective memory concern reported by subject, informant, or clinician, objective memory loss measured by education adjusted scores on delayed recall, a Clinical Dementia Rating (CDR)=0.5, absence of significant levels of impairment in other cognitive domains, essentially preserved activities of daily living, and an absence of dementia. At inclusion into the ADNI cohort subjects with AD dementia had initial MMSE scores between 20–26 (inclusive), a CDR = 0.5 or 1.0 with impaired activities of daily living, and fulfilled NINCDS-ADRDA criteria for clinically probable AD [8].
Neuropsychological assessment
For association with the presence of TDP-43 we used the last available ADNI composite scores for episodic memory [9].
Neuropathological assessments
All neuropathological evaluations in the ADNI cohort are performed through the central laboratory of the ADNI neuropathology core (http://adni.loni.usc.edu/about/#core-container) [10]. The neuropath-ological procedures follow previously established guidelines [11] that are captured in the format of the Neuropathology Data Form Version 10 of the National Alzheimer Coordinating Center (https://www.alz.washington.edu/NONMEMBER/NP/npform10.pdf).
Here, we applied established rating scales for the presence of TDP-43 pathology and hippocampal sclerosis. Presence of TDP-43 pathology was classified as positive if it was detected in any of the following brain regions: amygdala, hippocampus, and entorhinal cortex/inferior temporal gyrus. In addition, we used regional neuropathological rating scores of dif-fuse, core, and neuritic plaques within the hippocampal dentate gyrus and CA1 region.
Imaging data acquisition
Detailed acquisition and standardized pre-processing steps of ADNI imaging data are available at the ADNI website (https://adni.loni.usc.edu/methods/). Amyloid-PET data was collected during a 50- to 70 min interval following a 370 MBq bolus injection of 18F-Florbetapir. To account for the multicentric acquisition of the data across different scanners and sites, all PET scans undergo standardized pre-processing steps within ADNI.
For anatomical reference and pre-processing of the PET scans we used the corresponding structural magnetic resonance imaging (MRI) scan that was closest in time to the Florbetapir PET scan. MRI data were acquired on multiple 3T MRI scanners using scanner-specific T1-weighted sagittal 3D MPRAGE sequences. Similar to the PET data, MRI scans undergo standardized preprocessing steps aimed at increasing data uniformity across the multicenter scanner platforms (see https://adni.loni.usc.edu/methods/ for detailed information on multicentric MRI acquisition and preprocessing in ADNI).
Imaging data pre-processing
Images were preprocessed using Statistical Parametric Mapping software version 12 (SPM12) (The Wellcome Trust Centre for Neuroimaging, Institute of Neurology, University College London) implemented in Matlab 2019. MRI images were segmented into different tissue types and spatially normalized to a customized aging/AD-specific reference template [12] using the CAT12 toolbox. The pre-processing pipeline for the amyloid PET images followed the routine previously described in [13]. Partial volume effects (PVE) were corrected in native space using the 3-compartmental voxel-based post-reconstruction method as described by Müller-Gärtner and colleagues [14, 15]. The corrected PET images were spatially normalized to an aging/AD-specific reference template using the deformation parameters derived from the normalization of their corresponding MRI.
PVE-corrected 18F-Florbetapir-PET mean uptake values were calculated for the hippocampus as defined by the Harvard–Oxford structural atlas [16] (https://fsl.fmrib.ox.ac.uk/fsl/fslwiki/Atlases), and a global cortical composite mask including frontal, parietal and temporal areas [17]. Hippocampal and global cortical standardized uptake value ratios (SUVR) were obtained by scaling to the mean uptake of the whole cerebellum (in non-corrected 18F-Florbetapir-PET).
Hippocampus volume was derived from the spatially normalized MRI scans using the Harvard–Oxford hippocampal mask and scaled to each individual’s total intracranial volume.
Statistics
We used Bayes factor (BF) hypothesis testing to compare one or more alternative hypotheses against the null hypothesis (i.e., the assumption that there is no effect of neuropathological markers, H0) [18, 19], as implemented in Jeffreys’ Amazing Statistics Program (JASP Version 0.11.1), available at http://jasp-stats.org. This facilitates the simultaneous comparison of four hypotheses: the absence of an effect (null hypothesis), the effect of TDP-43 alone, the effect of hippocampal sclerosis alone, the combined effect of hippocampal sclerosis and TDP-43. Subsequently, we can determine the hypothesis best supported by our data. We report the Bayes Factor (BF10) quantifying evidence against the null hypotheses, as well as the BFM indicating the informativeness of our data given the prior (P(M)) and posterior distributions (P(M|data)) [19]. In addition we report estimates of regression coefficients with corresponding 95% credibility intervals [20]. Bayes factor hypothesis testing inferences are mutually consistent with every single participant’s data contribution through continuous updating of the prior distribution [19] (Fig. 2). Table 1 provides a short description of the Bayesian parameters that are reported here and the applied evidence categories.
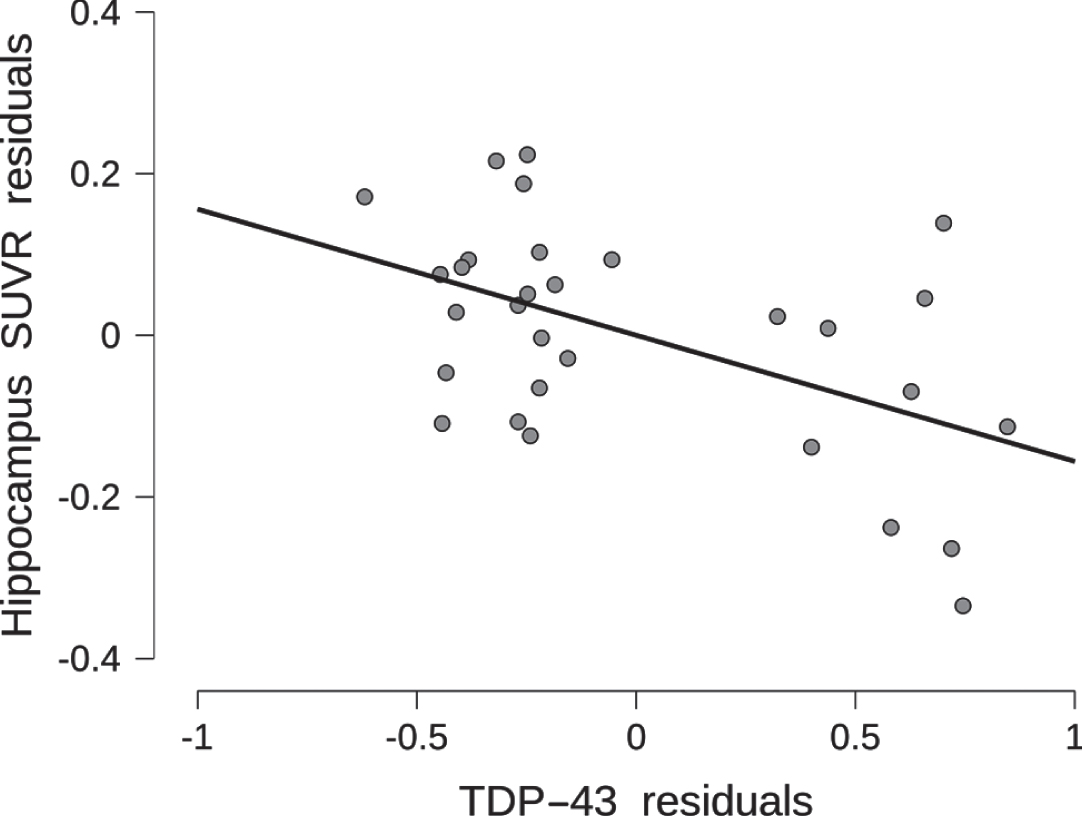
Association of TDP-43 pathology with antemortem hippocampus SUVR. Hippocampus SUVR residuals are plotted by TDP-43 pathology residuals, after regressing out age, sex, and distance between cognitive testing and death from both variables. The scatter plot includes the least square regression line.
Summary of the reported Bayesian Statistics
We determined associations of presence of TDP-43 pathology and hippocampal sclerosis with global and hippocampal partial volume correction (PVC) SUVR values, including age, sex, and distance between PET scanning and death into the null model. We determined if associations of TDP-43 with hippocampal SUVR were mediated by the effects of TDP-43 on hippocampal volume using Bayesian mediation regression with the packages “brms” and “mediation” in R-Studio, version 1.1.463.
For comparison, we determined associations of dentate gyrus and CA1 region scores for diffuse plaques, core plaques and neuritic plaques with hippocampal PVC SUVR values, including age, sex, and distance between PET scanning and death into the null model.
After supporting the effect of TDP-43 on hippocampal PVC SUVR, but not on global SUVR values, we added a post hoc analysis to determine if the presence of TDP-43 was associated with ADNI memory scores controlling for age, sex, distance between testing and death, and global SUVR values.
RESULTS
Demographics
Demographics of the sample of 30 cases with available 18F-Florbetapir-PET scans are given in Table 2. Ten of the thirty cases had indication of TDP-43 pathology; two of these ten cases had hippocampal sclerosis. Global SUVR values ranged between 1.15 and 4.73, i.e., all cases were above a previous used cut-off of 1.04 used for global amyloid positivity in the ADNI autopsy data [21]. In contrast, hippocampal SUVR values ranged between 0.45 and 1.01, with all cases below the previously defined cut-off.
Sample characteristics at time of last 18F-Florbetapir PET scan
f/m, female/male; SD, standard deviation.
TDP-43, hippocampal sclerosis, hippocampal Aβ pathology, and hippocampal 18F-Florbetapir SUVR
We found substantial to strong evidence for TDP-43 to be associated with bilateral hippocampal PVC SUVR values (BF10 = 9.0) when age, sex, and distance between PET and death were included into the null model. The corresponding coefficient for TDP-43 was -0.010 (95-CI: –0.185 to 0). Figure 1 shows a corresponding scatterplot for the TDP-43 effect, and Fig. 2 a sequential robustness check. Adding hippocampal sclerosis to the model showed additional substantial evidence for hippocampal sclerosis alone (BF10 = 6.4) and very strong evidence for the combined effect of TDP-43 and hippocampal sclerosis (BF10 = 18.5) (Table 3a). When hippocampal sclerosis already was included into the null model, then the data became 2.5 times more likely when adding TDP-43 to it. In the Bayesian mediation analysis, only 32.4% (95-CI: 13.7 –78.5) of the effect of TDP-43 on hippocampal PVC SUVR was mediated by the effect of TDP-43 on hippocampus volume (Table 3b). The estimates of the coefficients were negative for TDP-43 on hippocampus volume and hippocampal PVC SUVR, and positive for hippocampus volume on hippocampal PVC SUVR.
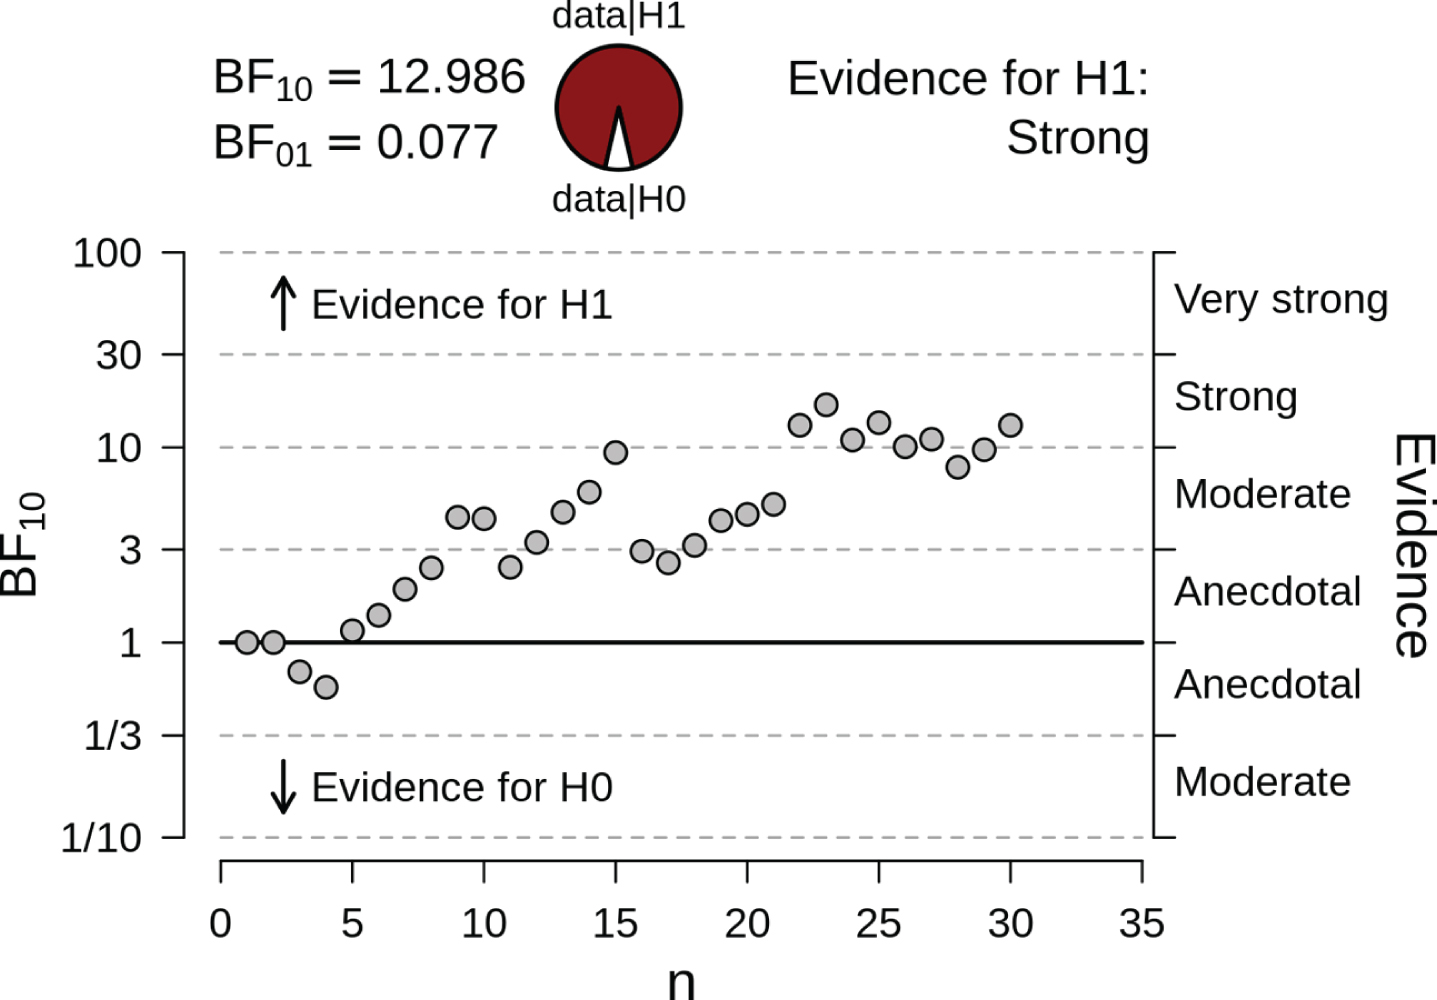
Sequential robustness check for the effect of TDP-43 on hippocampus SUVR. The probability wheel on top contrasts the posterior probabilities for the data under the assumption of presence (H1) or absence (H0) of an effect of TDP-43. The scatter plot on the bottom demonstrates the internal coherence of Bayesian hypothesis testing: each individual participant contributes to the updating of the prior distribution, and the subsequent inference based on the posterior distribution (shown on the right-hand y-axis). To illustrate this, note participant 14, 15, and 16. Participant 14’s data contribution to the summed up inferences from participants 1–13 shifts the BF to just below 10, so in the “moderate” evidence category. The addition of participant 15’s data pushes the currently possible conclusion over into the “strong” evidence category. However, when we update the information from participants 1–15 with the data contributed by participant 16, our evidence strength plummets to just above 3. This is what is meant by Bayesian coherence: the conclusions are coherent with every individual participant’s contribution and are therefore not limited in their validity by the small sample size. After the inclusion of 20 cases the strong evidence level for the presence of an effect remains stable.
Hippocampus SUVR versus TDP-43
Evidence was in favor of no effect of TDP-43 on global PVC SUVR values (BF10 = 0.65). Evidence was in favor of no association of core or diffuse plaque or neuritic plaque scores in the dentate gyrus and the CA1 region with bilateral hippocampal SUVR (BF10 <0.67 for all comparisons, in favor of the null model).
We found a negative association between memory score and TDP-43, i.e., lower memory performance with the presence of TDP-43, with a Kendall’s tau correlation coefficient of -0.26 (95% credibility interval between –0.47 and 0) (Fig. 3). The Bayes factor, however, indicated only anecdotal evidence in favor of an effect of TDP-43 on the ADNI memory score (BF10 = 1.6).

Association of TDP-43 pathology with antemortem memory performance. ADNI memory score residuals are plotted by TDP-43 pathology residuals, after regressing out age, sex, distance between cognitive testing and death, and global SUVR values from both variables. The scatter plot includes the least square regression line.
DISCUSSION
We found no association of TDP-43 with global PVC SUVR values, consistent with a previous study [5], but could confirm our assumption that the presence of TDP-43 pathology would be associated with lower levels of hippocampal amyloid PET signal. One major contributor was the presence of hippocampal sclerosis that accounted for some of the TDP-43 effect; however, TDP-43 remained a relevant predictor even when accounting for hippocampal sclerosis. Interestingly, against our expectation, the effect of TDP-43 on hippocampus amyloid PET signal was only partly mediated by the well-known effect of TDP-43 on hippocampus volume [7], with the mediated effect accounting only for about a third of the total effect. Our findings extend results of two previous studies. One study reported in six cases that a negative 11C-PIB-PET scan was associated with different non-AD pathologies, including TDP-43 in two cases [22]. Our findings also agree with observations in 16 amnestic MCI cases with slowly progressive cognitive decline suggestive of limbic TDP-43 pathology/hippocampal sclerosis that showed prominent 18F-FDG-PET hypometabolism in bilateral hippocampus with no to little uptake of 18F-Florbetaben amyloid tracer in the hippocampus [23]. These previous studies suggest that non-AD pathology, including TDP-43, can induce an amnestic clinical phenotype resembling AD in absence of a global and hippocampal increase of amyloid PET signal. The association of hippocampal sclerosis with lower levels of hippocampal amyloid PET signal agrees with a clinico-pathological comparison study in 57 cases [24]. In this study, 13 cases were rated as amyloid negative upon autopsy examination, with two of these cases featuring both prominent hippocampal sclerosis and negative 18F-Florbetapen-PET scans. Despite these previous findings, the nature of the direct effect of TDP-43 on hippocampal PVC SUVR remains unresolved. One could assume that in the presence of TDP-43 pathology, less amyloid signal in the hippocampus is necessary for a person to be clinically classified into the AD spectrum; however, increased hippocampus amyloid PET signal occurs only late in the course of AD and therefore is not a major driver for diagnostic classification. The finding on TDP-43 and episodic memory performance from the last available assessment of the ADNI memory score would be compatible with the notion that the presence of TDP-43 is associated with the degree of memory dysfunction when controlling for the level of overall amyloid, i.e., in the presence of TDP-43 it takes less amyloid to reach a similar degree of cognitive impairment. However, this evidence was weak as assessed by the Bayes factor and therefore needs to be confirmed in subsequent studies. In the mediation analysis, higher hippocampus volume was associated with a higher amyloid signal in the hippocampus. This finding indicates that even when using a three compartmental correction for partial volume effects [14, 15] the 18F-Florbetapir-PET signal in the highly convoluted area of the hippocampus with close proximity of white matter, grey matter, and cerebrospinal fluid spaces, was partly driven by the amount of remaining grey matter. Our results agree with findings of a previous study in 104 cognitively normal people where hippocampal 11C-PiB retention values without PVC correlated positively with the volume of the left hippocampus derived from MRI [25].
Our findings are limited by the small number of cases. Our data serve to generate rather than confirm the hypothesis that TDP-43 pathology may be associated with hippocampus SUVR in the AD spectrum and require replication in independent cohorts. Such independent replication efforts could apply our posterior distributions (Table 3a) as their prior distributions, testing our newly-generated hypothesis directly. One should note that our findings relate only to 18F-Florbetapir, as other tracers with other binding properties may yield different results. Taking further confounds into account such as non-AD comorbidities beyond TDP-43, such as Lewy body pathology, would have strengthened our results; however, the small number of cases prohibited further stratification of the sample.
In summary, we found that TDP-43 pathology with and without hippocampal sclerosis was associated with lower levels of hippocampus amyloid PET signal beyond its effect on hippocampal atrophy. The underlying nature of this effect remains unclear, as the hippocampal amyloid PET signal itself was more strongly related to the remaining amount of grey matter in this region than to the local degree of Aβ pathology.
Availability of data and material
Data used for the current analysis from the ADNI cohort are freely available from the ADNI website (http://adni.loni.usc.edu/data-samples/access-data), including autopsy data and amyloid PET scans. Processed partial volume corrected PET scans are available upon request through the corresponding author of this manuscript.
Footnotes
ACKNOWLEDGMENTS
MJG is supported by the “Miguel Servet” program [CP19/00031] of the Spanish Instituto de Salud Carlos III (ISCIII-FEDER).
Data collection and sharing for this project was funded by the Alzheimer’s Disease Neuroimaging Initiative (ADNI) (National Institutes of Health Grant U01 AG024904) and DOD ADNI (Department of Defense award number W81XWH-12-2-0012). ADNI is funded by the National Institute on Aging, the National Institute of Biomedical Imaging and Bioengineering, and through generous contributions from the following: Alzheimer’s Association; Alzheimer’s Drug Discovery Foundation; Araclon Biotech; BioClinica, Inc.; Biogen Idec Inc.; Bristol-Myers Squibb Company; Eisai Inc.; Elan Pharmaceuticals, Inc.; Eli Lilly and Company; EuroImmun; F. Hoffmann-La Roche Ltd and its affiliated company Genentech, Inc.; Fujirebio; GE Healthcare; IXICO Ltd.; Janssen Alzheimer Immuno-therapy Research & Development, LLC.; Johnson & Johnson Pharmaceutical Research & Development LLC.; Medpace, Inc.; Merck & Co., Inc.; Meso Scale Diagnostics, LLC.; NeuroRx Research; Neurotrack Technologies; Novartis Pharmaceuticals Corporation; Pfizer Inc.; Piramal Imaging; Servier; Synarc Inc.; and Takeda Pharmaceutical Company. The Canadian Institutes of Health Research is providing funds to support ADNI clinical sites in Canada. Private sector contributions are facilitated by the Foundation for the National Institutes of Health (![]() ). The grantee organization is the Northern California Institute for Research and Education, and the study is coordinated by the Alzheimer’s Disease Cooperative Study at the University of California, San Diego. ADNI data are disseminated by the Laboratory for Neuro Imaging at the University of Southern California.
). The grantee organization is the Northern California Institute for Research and Education, and the study is coordinated by the Alzheimer’s Disease Cooperative Study at the University of California, San Diego. ADNI data are disseminated by the Laboratory for Neuro Imaging at the University of Southern California.