
Abstract
Background:
Red blood cells (RBCs) contain the majority of α-synuclein (α-syn) in blood, representing an interesting model for studying the peripheral pathological alterations proved in neurodegeneration.
Objective:
The current study aimed to investigate the diagnostic value of total α-syn, amyloid-β (Aβ1–42), tau, and their heteroaggregates in RBCs of Lewy body dementia (LBD) and Alzheimer’s disease (AD) patients compared to healthy controls (HC).
Methods:
By the use of enzyme-linked immunosorbent assays, RBCs concentrations of total α-syn, Aβ1–42, tau, and their heteroaggregates (α-syn/Aβ1–42 and α-syn/tau) were measured in 27 individuals with LBD (Parkinson’s disease dementia, n = 17; dementia with Lewy bodies, n = 10), 51 individuals with AD (AD dementia, n = 37; prodromal AD, n = 14), and HC (n = 60).
Results:
The total α-syn and tau concentrations as well as α-syn/tau heterodimers were significantly lower in the LBD group and the AD group compared with HC, whereas α-syn/Aβ1–42 concentrations were significantly lower in the AD dementia group only. RBC α-syn/tau heterodimers had a higher diagnostic accuracy for differentiating patients with LBD versus HC (AUROC = 0.80).
Conclusion:
RBC α-syn heteromers may be useful for differentiating between neurodegenerative dementias (LBD and AD) and HC. In particular, RBC α-syn/tau heterodimers have demonstrated good diagnostic accuracy for differentiating LBD from HC. However, they are not consistently different between LBD and AD. Our findings also suggest that α-syn, Aβ1–42, and tau interact in vivo to promote the aggregation and accumulation of each other.
INTRODUCTION
Alzheimer’s disease (AD) and Lewy body dementia (LBD), encompassing dementia with Lewy bodies (DLB) and Parkinson’s disease dementia (PDD), are the most prevalent dementia-related neurodegenerative disorders (NDs) in the general population [1–3], with AD representing more than 50% of dementia diagnoses [4]. DLB is the second most common neurodegenerative dementia in older adults, with an incidence rate of 31.6 per 100,000 person-years in the 65-and-older population [5]. In Parkinson’s disease (PD) as well, late-stage patients usually manifest overt cognitive decline, and full-blown dementia, known as PDD, is reported with a point prevalence close to 30% of cases [6].
Since these NDs share comparable pathophysiological mechanisms, namely misfolded protein acc-umulation, they are also collectively referred to as proteinopathies [7]. Far from being strictly independent diseases, concomitant occurrence of multiple misfolded proteins has been commonly found. Thus, together with misfolded α-synuclein (α-syn) aggre-gates—LBD pathologic hallmark—tau and amyloid-β (Aβ) co-pathologies are common [8]. Similarly, various degrees of abnormal deposition of α-syn are seen in nearly half of AD individuals [4]. AD patients have shown a high concentration of cerebrospinal fluid (CSF) α-syn [9], whereas a reduction has been reported in PD and DLB patients [10]. Noteworthy, low CSF Aβ 1–42 (Aβ1–42) concentration predicts the development of cognitive impairment in PD and DLB [11, 12].
Therefore, a substantial overlap of pathophysiological mechanisms involving Aβ, tau, and α-syn metabolisms characterizes the development and progression of these NDs [13]. Beyond co-occurrence, these different pathologies seem to mutually influence and interact each other leading to hybrid oligo-mers (“heteroaggregates” of α-syn, tau, and Aβ1–42) in patients’ brains and cellular models [14–16].
A contemporary evaluation of these pathophysi-ological pathways is mandatory for every biomarker-based study with the objective to identify patients within the AD and LBD spectrum [13].
Research efforts are focusing on peripheral bioma-rkers moving from CSF to blood [10, 15]. Pathologic alterations in blood proteins have been suggested to reflect CSF changes due to simple diffusion or barrier impairment that characterizes neurodegeneration [15]. Red blood cells (RBCs) contain 99% of the circulating α-syn and plasma measurements raised some concerns for possible contamination due to hemolysis [17]. Moreover, RBCs are involved in the accumulation and clearance of the misfolded proteins [18] and may represent an interesting peripheral fluid reflecting neurodegeneration. Previous works on RBCs reported the presence of α-syn “heteroaggregates” in healthy individuals [16], PD [19], and AD patients [20].
The aim of the present study was 1) to compare Aβ1–42, total tau (tau), total α-syn (α-syn), α-syn/Aβ1–42 heterodimers, and α-syn/tau heterodimers in RBCs of patients with AD dementia or prodromal AD (AD group) and patients with PDD or DLB (LBD group), compared to cognitively healthy individuals (HC group); 2) to evaluate whether these markers will help to differentiate between HCs and both AD and LBD, and between AD and LBD participants.
MATERIALS AND METHODS
Population
Participants for this cross-sectional study included 51 individuals in the AD group (37 AD dementia patients and 14 prodromal AD patients), 27 individuals in the LBD group (17 PDD and 10 DLB), all enrolled from the Center of Neurodegenerative Disease of the Neurology Unit at Hospital of Pisa and 60 cognitively healthy controls (HC group) enrolled from patients’ families (without parental relationship) and volunteers.
All participants underwent detailed clinical and neurological assessments, including collecting history from a close relative, neurological examination, and routine blood tests. All patients (AD and LBD groups) underwent an extensive cognitive evaluation, including the Mini-Mental State Examination (MMSE) [21], and a magnetic resonance imaging (MRI) scan to rule out secondary causes of dementia/cog-nitive impairment and parkinsonism.
AD patients received their diagnosis according to the IWG-2 criteria [22], either prodromal AD or AD dementia, and displayed atypical progressive amnestic phenotype, associated with evidence of AD patho-physiological process (either decreased CSF Aβ1–42 together with increased tau or phospho-tau (p-tau), or positive cerebral amyloid PET).
The LBD group consisted of patients with either diagnosis of probable PDD or probable DLB, as defined by the Movement Disorder Society Task Force [23] and the DLB consortium [24], respectively. Study procedures were approved by the local Ethical Committee and the Great North West Area of Tuscany (152/2016) and were in accordance with the provisions of the Declaration of Helsinki. All participants or their representatives gave written informed consent for the use of their clinical data for research purposes.
Patients were anti-dementia drug naïve. No one was taking acetylcholinesterase inhibitors or memantine. None of the patients was either on antipsychotics, anticoagulants, or antiepileptic drugs.
Collection of RBCs
Blood was collected from AD and LBD groups and HC into a tube, containing ethylenediaminetetraacetic acid (EDTA), which was gently inverted 8–10 times to ensure the mixing of the anticoagulant. Following centrifugation at 200 × g at 4°C for 10 min [16], RBCs were separated from plasma. The isolated RBCs were centrifuged at 1000 × g for 10 min, washed with PBS, and frozen at –20°C until use. Freezing-thawing cycles were avoided. When RBCs were employed for experiments, the samples were slowly thawed and then slowly frozen to avoid or at least minimize the hemolysis.
The total amount of proteins in RBCs was calculated through the Bradford method. Before using the RBCs in the immunoenzymatic assay, these cells were suspended in 2 mM SDS to a final concentration of 40 mg of total proteins in 100μl [20].
Quantification of Aβ1–42 in RBCs
To quantify the amount of Aβ1–42 in RBCs (0.2 mg/100μl) an immunoenzymatic assay was emp-loyed, as elsewhere described [16], using a specific capture antibody direct to the C-terminal of Aβ1–42 (ab10148, abcam), a primary polyclonal antibody recognizing the full-length Aβ1–42 (sc-28365, Santa Cruz Biotechnology), and a donkey anti-goat-HRP secondary antibody [19]. The standard curve was obtained using recombinant human Aβ1–42 solutions at different concentrations [16, 20].
Quantification of tau in RBCs
To measure the concentrations of tau in RBCs (0.5 mg/100μl) an immunoenzymatic assay was used, as described elsewhere [16], employing a specific capture antibody direct to the C-terminal of tau (sc-32274, Santa Cruz Biotechnology), a primary polyclonal antibody against the N-terminal of tau (sc-5587, Santa Cruz Biotechnology), and a goat anti-rabbit-HRP secondary antibody. The standard curve was obtained using recombinant human tau solutions at different concentrations [16, 20].
Quantification of α-syn in RBCs
To define the quantity of α-syn in RBCs (0.2 mg/100μl) an immunoenzymatic assay was utilized, as described elsewhere [16], using a specific capture antibody direct to the full-length α-syn (sc-10717, Santa Cruz Biotechnology), a monoclonal primary antibody identifying the C-terminal region of α-syn (sc-12767, Santa Cruz Biotechnology), and an anti-mouse-HRP secondary antibody [16, 26]. The standard curve was obtained using recombinant human α-syn solutions at different concentrations [16, 20].
Detection of α-syn/Aβ1–42 heterocomplexes
Detection of α-syn/Aβ1–42 heterocomplexes in RBCs (40 mg/sample in 2 mM SDS) was performed through “home-made” immunoenzymatic assay [27], using a specific capture antibody direct to the C-ter-minal region of Aβ1–42 (ab10148, abcam), a mouse monoclonal primary antibody against the C-terminal of α-syn (sc-12767 Santa Cruz Biotechnology), and a goat anti-mouse-HRP secondary antibody. The concentration of α-syn-Aβ1–42 in RBCs was measured according to a standard curve [19], using a solution of recombinant human α-syn and recombinant human Aβ1 - 42 at different concentrations in SDS 2 mM, as already described [19, 20].
The limit of detection (LOD) and the lower li-mit of quantification (LLOQ) for the α-syn/Aβ1–42 “home-made” immunoassay are 0.025 ng/ml and 0.175 ng/ml, respectively.
Detection of α-syn/tau heterocomplexes
Detection of α-syn/tau heterocomplexes in RBCs (80 mg/sample in 2 mM SDS) was performed through “home-made” immunoenzymatic assay [16, 27], em-ploying a specific capture antibody direct to the N-terminal of α-syn (sc-514908, Santa Cruz Biotechnology), a rabbit polyclonal primary antibody reco-gnizing the N-terminal region of tau (sc-5587, Santa Cruz Biotechnology), and a goat anti-rabbit-HRP se-condary antibody [19]. The concentration of α-syn/Aβ1–42 in RBCs was measured according to a standard curve [19], using a solution of recombinant hu-man α-syn and recombinant human tau at different concentrations in SDS 2 mM, as already described [19, 20].
The LOD and LLOQ for the α-syn/tau “home-made” immunoassay are 0.0036 ng/ml and 0.025 ng/ml, respectively.
Statistical analysis
The Shapiro–Wilk test was used to test for normality. Normal continuous variables were presented as mean and standard deviation, while variables with a skewed distribution were given as median and [int-erquartile range]. Categorical variables were exp-ressed as a percentage.
Comparisons across groups for cross-sectional an-alyses of biomarker data were performed using a one-way analysis of variance (ANOVA). Tukey’s post-hoc test was applied, where appropriate, to exp-lore a significant difference in marker concentrations between group means. Variables with a skewed distribution were logarithmically transformed for use in ANOVA. We also performed a between group analysis (ANCOVA) correcting for age.
Then, if significant differences had been detected at post-hoc tests, the diagnostic potential of each biomarker was examined calculating the area under the receiver operating characteristic curve (AUROC) and its associated confidence intervals (CI). SPSS-IBM package, version 21, for Mac Os X were used; the statistical significance threshold level was set at p < 0.05.
RESULTS
The clinical-demographic characteristics of the three groups and diagnostic subgroups are reported in Table 1. Participants included 51 individuals in the AD group (37 AD dementia patients and 14 prodromal AD patients), 27 individuals in the LBD group (17 PDD and 10 DLB), and 78 HC.
Demographic and clinical data of participants divided by groups
In italics are reported values relative to diagnosis subgroups. All data, except for N, are indicated as mean±standard deviation and median values (25th and 75th quartiles). N, number of individuals; AD, Alzheimer’s disease group (Alzheimer’s disease dementia and prodromal Alzheimer’s disease); AD-D, Alzheimer’s disease dementia; AD-P, prodromal Alzheimer’s disease; LBD, Lewy bodies dementias group (dementia with Lewy bodies and Parkinson’s disease dementia); DLB, dementia with Lewy bodies; PDD, Parkinson’s disease dementia; HC, cognitively healthy group; MMSE, Mini-Mental State Examination.
The concentrations of the measured RBC proteins (α-syn, tau, Aβ1 - 42, and their heterocomplexes, i.e., α-syn/Aβ1–42 and α-syn/tau) in the three groups are reported in Table 2 and Fig. 1. The data are expressed as the ratio between the ng of the measured proteins, calculated by immunoenzymatic assay, and the total amount of proteins in RBCs expressed in mg, calculated by Bradford assay, as described in the Methods section.
Red blood cells biomarker concentrations of participants
Data are indicated as mean±standard deviation and median values (25th and 75th quartiles). ap = 0.011 versus AD; bp = 0.009 versus LBD; cp = 0.003 versus AD; dp < 0.001 versus AD; ep < 0.001 versus LBD. N, number of individuals; AD, Alzheimer’s disease group (Alzheimer’s disease dementia and prodromal-Alzheimer’s disease); LBD, Lewy body dementia group (dementia with Lewy body and Parkinson’s disease dementia); HC, cognitively healthy group; p, p-value; ns, not significant; Aβ1–42, total amyloid-β peptide 1–42 fraction; tau, total tau protein; α-syn, total α-synuclein; α-syn/Aβ1–42, heterodimer α-synuclein/amyloid-β peptide 1–42 fraction; α-syn/tau, heterodimer α-synuclein/tau protein.
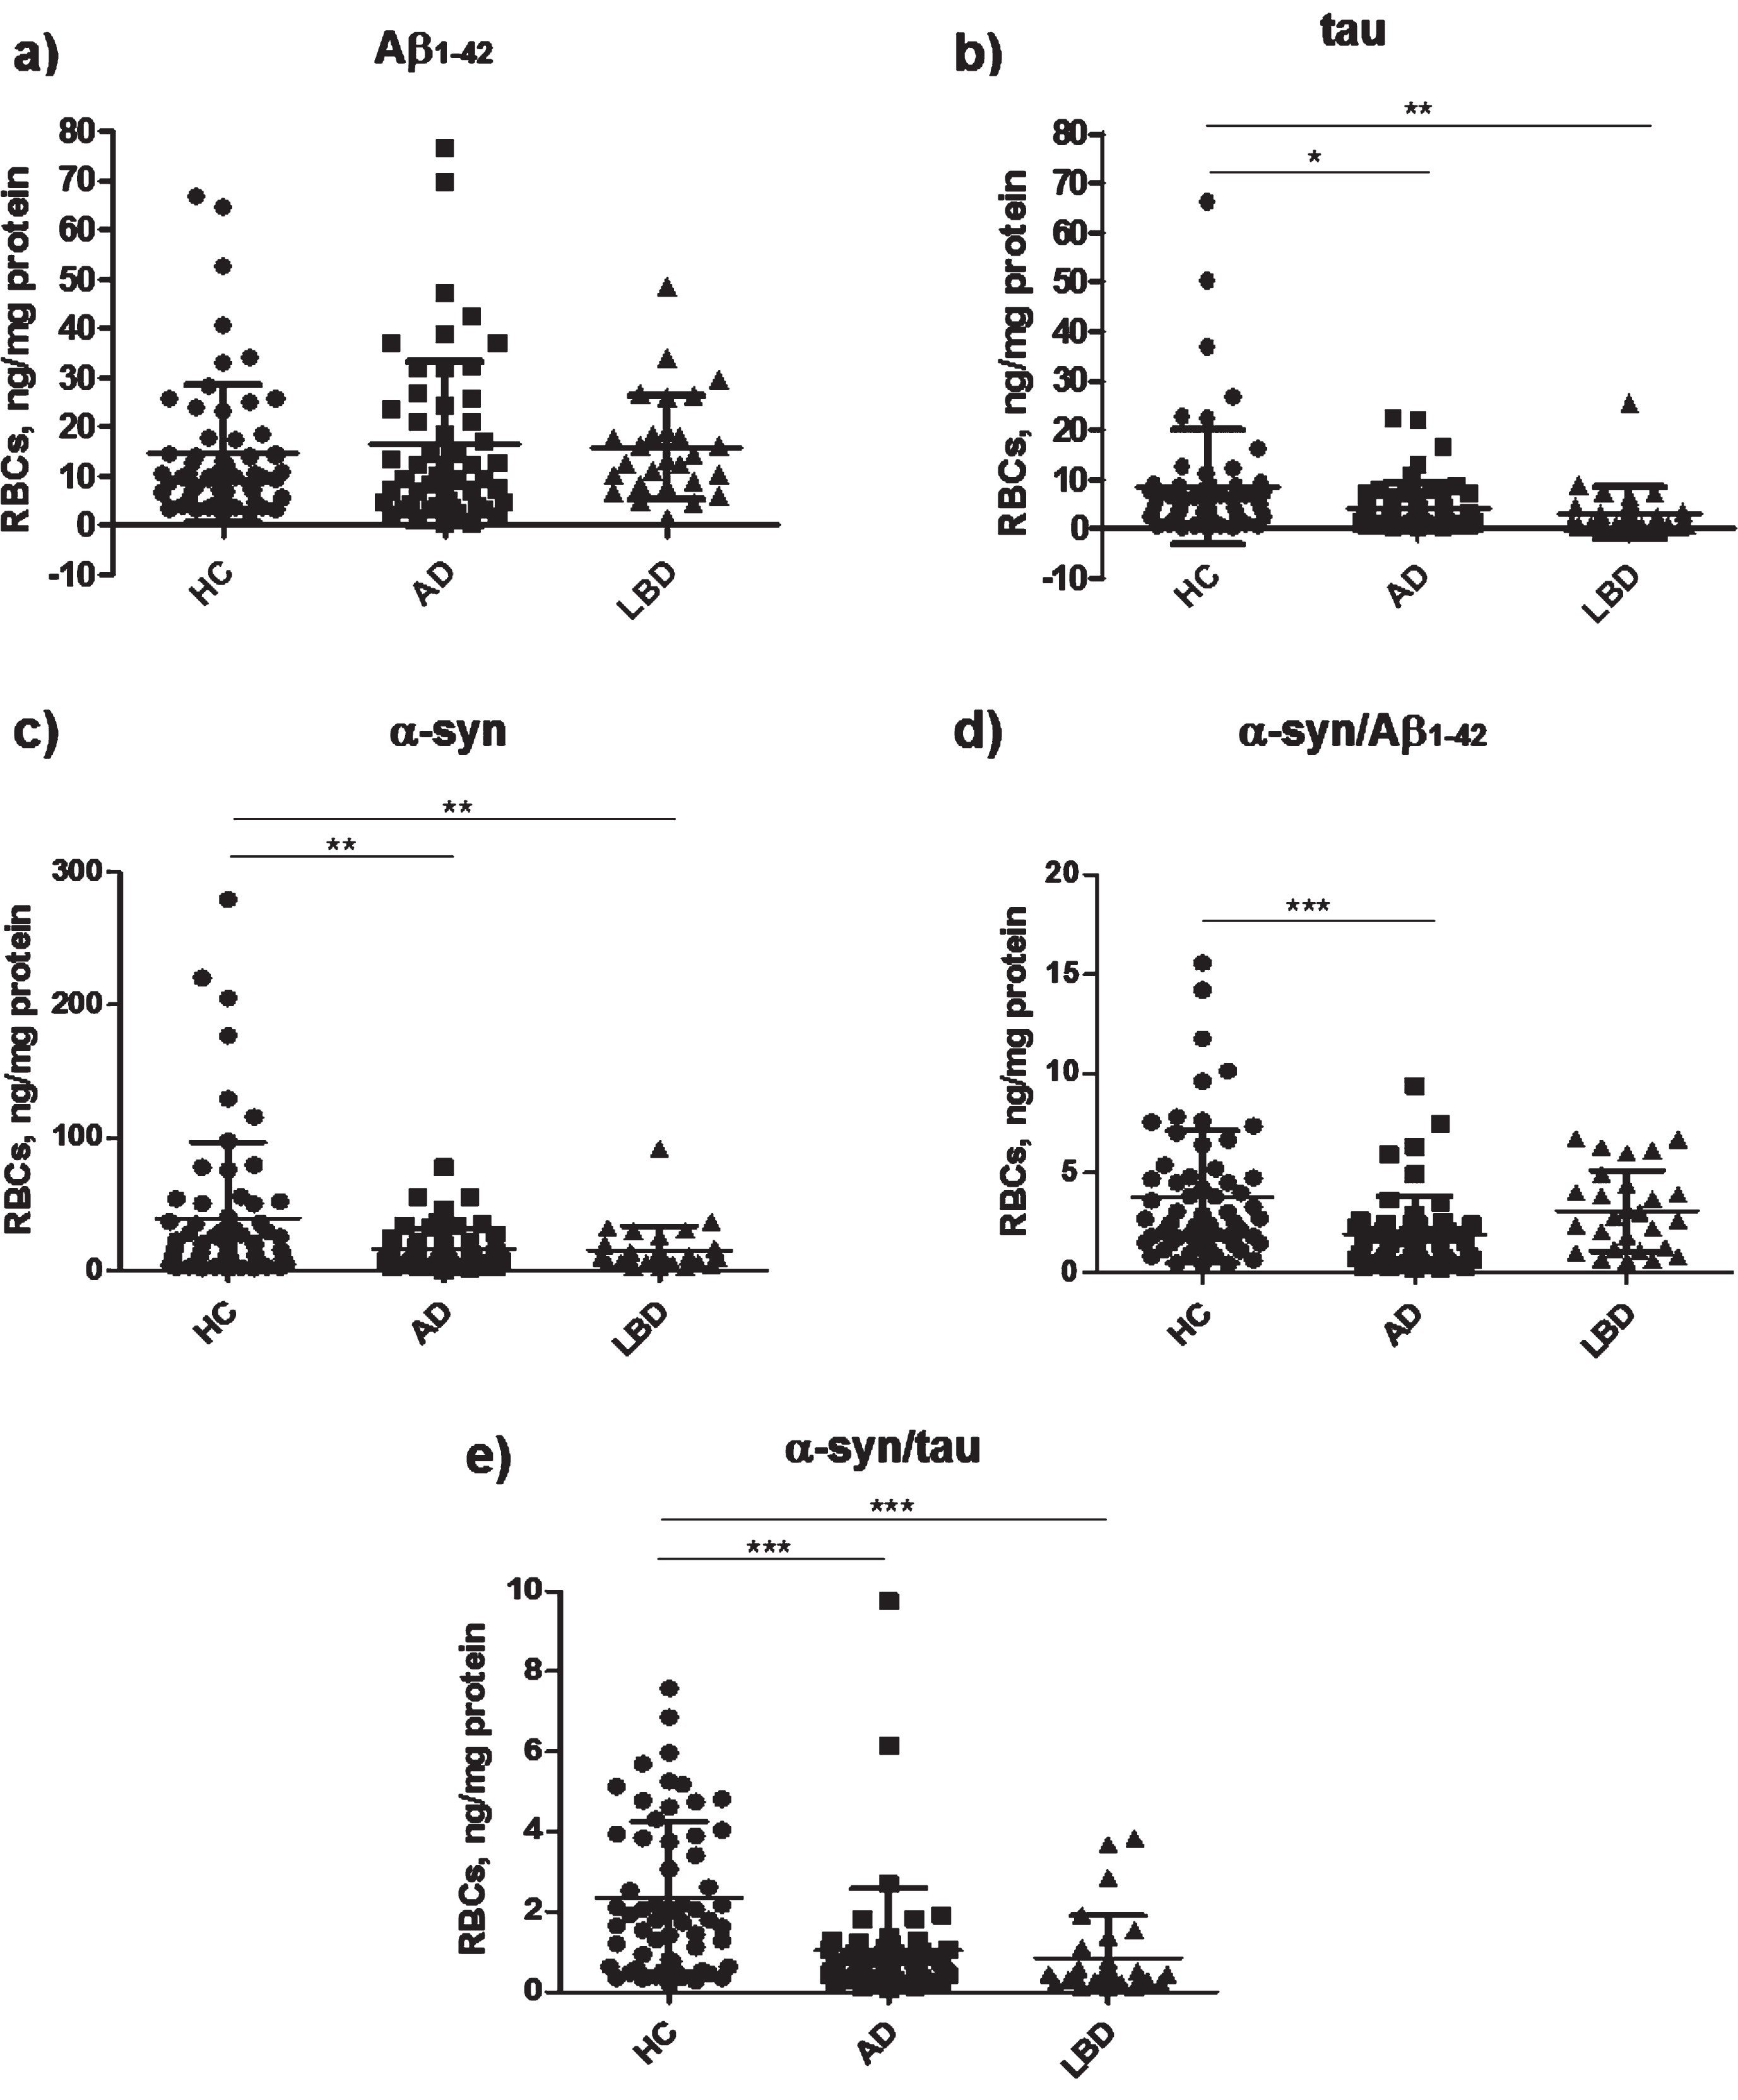
Diagram of RBC concentrations of (a) Aβ1–42, (b) tau, (c) α-syn, (d) α-syn/Aβ1–42, and (e) α-syn/tau in AD, LBD, and HC. Data are expressed as mean ± standard deviation. *p < 0.05, **p < 0.01, and ***p < 0.001 versus HC.
HC had significantly higher concentrations of RBC α-syn and tau than AD and LBD patients. The dif-ferences in tau levels disappeared after age correction. Consistent with these data, α-syn/tau heterodimers concentrations were significantly higher in HC than in patients with AD or with LBD. α-syn/Aβ1–42 concentrations were significantly higher in the HC group than in the AD group only, though this difference disappeared after correcting for age. There were no significant differences in Aβ1–42 concentrations neither between the AD and HC nor between LBD and HC. Finally, comparable concentrations of every measured biomarker were evidenced between AD and LBD.
For the significant differences detected at post-hoc tests, the diagnostic potential of each biomarker was examined calculating the AUROC and its associated CI. Table 3 summarizes the accuracy of RBC biomarkers. The performance of α-syn/tau and α-syn/Aβ1–42 in discriminating AD participants from HC was fair, whereas tau and α-syn poorly differentiated the two groups. α-syn/tau also demonstrated a good ability to discriminate LBD versus HC. Total tau might differentiate LBD patients from HC with fair accuracy, α-syn poorly differentiated LBD from HC while RBC α-syn/Aβ1–42 concentrations were unable to discriminate HC from LBD.
Diagnostic accuracies of the RBCs biomarkers in differentiating HC from AD and LBD
RBCs, red blood cells; AD, Alzheimer’s disease group (Al-zheimer’s disease dementia and prodromal-Alzheimer’s disease); LBD, Lewy body dementia group (dementia with Lewy bodies and Parkinson’s disease dementia); HC, cognitively healthy group; tau, total tau protein; α-syn, total α-synuclein; α-syn/Aβ1–42, heterodimer α-synuclein/amyloid-β peptide 1–42 fraction; α-syn/tau, heterodimer α-synuclein/tau protein; AUROC, area under the receiving operating characteristic curve; CI, confidence interval.
DISCUSSION
The main result of our study was that, among the proposed biomarkers, only tau, α-syn, and α-syn/tau differentiated cognitively healthy from cognitively impaired individuals, with α-syn/Aβ1–42 that could only discriminate between AD and HC. The most performing marker was α-syn/tau, which separated with good and fair accuracy LBD and AD, respectively, from controls. However, none of them was useful in the differential diagnosis between AD and LBD groups.
Emerging data suggest that neurodegenerative diseases are not related to the cerebral deposition of single/specific abnormal proteins, but rather to a mi-xed pattern of these misfolded proteins [15, 28]. Several studies suggest that Aβ1–42, tau, and α-syn interact in vivo to promote aggregation and accumulation of each other and accelerate cognitive dysfunction [29]. Interestingly, their expression levels and aggregation processes are not restricted to the brain, but reach peripheral tissues by the bloodstream, possibly configuring a systemic disease [20]. Among peripheral cells, RBCs were demonstrated to be particularly susceptible to the oxidative stress and accumulation of misfolded proteins [16, 31].
In the present study, Aβ1–42 concentrations in RBCs did not differ between HC and patients (AD and LBD). Previous cross-sectional studies confirmed that plasma Aβ of AD patients is not much different from normal controls [32], but somewhat promising results have been reported for combinations of Aβ1–42 and Aβ1–40. Recent studies measured very low amounts of several Aβ-related peptides in plasma using ultrasensitive techniques, supporting the use of plasma Aβ42/40 ratios as surrogate biomarkers of cerebral Aβ deposition [33, 34]. However, the concordance with the reference standard (cerebral amyloid-PET or CSF examinations) remains variable and further studies should identify the more accurate method to measure Aβ peptides in blood [35].
We explored RBCs Aβ1–42 concentrations as a potential biomarker, finding comparable concentrations between HC and PD individuals [19], or HC and AD [20]. In contrast, Aβ1–42 fibrils were significantly higher in AD patients when compared to HC [36]. However, in this study, the diagnosis was based on purely clinical criteria [37] and Aβ1–42 fibrils were quantified by a different detection method [36]. Taken together, these data highlight the need for uniform protocols to improve the comparability of results.
The contribution of α-syn to LBD diagnosis is more meaningful than Aβ. In our study, RBC total α-syn concentrations were lower in AD, and LBD patients compared to HC. These data confirm previous results obtained in a different cohort of AD [20] and PD individuals [17–19]. Nonetheless, RBC α-syn concentration was not able to discriminate AD individuals from LBD ones.
RBC tau concentration was reduced in AD and LBD individuals compared to HC, without discriminating the two patient populations. To our knowledge, very few studies have assessed the RBC tau protein concentrations in NDs [16]. In a previous investigation, tau protein in RBCs was similar in AD and HC [20], while higher tau concentrations have been demonstrated in plasma of AD patients [38]. Further investigation on tau isoforms and distribution will necessary, considering the potential contribution of tau pathology in LBD progression, where an Aβ1–42 co-pathology is often present.
Heterocomplexes of α-syn with tau and Aβ1–42 have been proven to occur both in cellular models and in patients’ brains [14, 20]. Noteworthy, α-syn forms heterocomplexes with both Aβ1–42 and tau proteins in brain tissues and RBCs of senescence-accelerated mice, similarly to previous data reported in human samples [15, 39]. In our study, both α-syn/Aβ1–42 and α-syn/tau concentrations in RBCs were significantly lower in AD patients than HC, as previously reported [20]. Furthermore, α-syn/tau concentrations were also reduced in LBD individuals than in HC. Overall, these data indicate α-syn heteromers as biomarkers in dementia and LBD. Both α-syn/tau and α-syn/Aβ1–42 heterodimers in RBCs can fairly discriminate AD from HC, and α-syn/tau heterodimers distinguish LBD from HC with good accuracy.
The relevance of RBC α-syn heteromers in the dia- gnostic workup of dementia should be demonstrated in larger studies including frontotemporal dementia (FTD) and vascular dementia patients. Hypothetica-lly, in FTD we expect different profiles depending on the underlying pathology (tau or transactive response (TAR) DNA binding protein (TDP-43) pathology). This could have significant implications in the stratification of neurodegenerative dementia. The role of RBC heteromers as biomarkers for vascular dementia is unpredictable due to the influence of blood brain barrier damage and endothelial dysfunction.
The strength of our study was that AD patients received a biomarker-based diagnosis, and a nigrostriatal degeneration was confirmed in LBD patients. Some caveats are needed. Our sample size is relatively small hindering further stratifications (e.g., specific investigations regarding PDD and DLB subsets). Moreover, our samples are not homogeneous in terms of age, sex prevalence, and disease stages.
The AD group consisted of both prodromal (i.e., prodromal AD) and mild demented patients, whereas the LBD group was only represented by demented patients and did not include a prodromal PD category. Further, RBC α-syn/Aβ1–42 and tau concentrations did not significantly differ between groups after age correction. Given the cross-sectional nature of our study and the lack of adequate follow-up, it is imp-ossible to explore the prognostic value of these bio-markers. We measured biomarker concentrations in RBCs but not in plasma/serum or CSF, not clarifying their clearance process.
Nevertheless, due to the multifactorial etiology of NDs and the existence of multiple elements involved in NDs pathogenesis, it could be interesting to further evaluate RBCs concentrations of phosphorylated tau (specifically reflecting the presence of neurofibrillary tangles), phosphorylated α-syn (since it represents the 90% of insoluble α-syn contained in Lewy bodies), Aβ1–42 fibrils and aggregates (which bind RBCs in a sharply larger share of AD patients compared to HC), and oligomeric α-syn, whose dosage in RBCs has already shown significant results in PD [19]. Moreover, the development of methods detecting the post-translational modifications of α-syn (e.g., phosphorylated α-syn), tau proteins, and Aβ peptide alone or in combination may represent the next step to improve the identification, with peripheral biomarkers, of different pathophysiological pathways, targets for tailored treatments in future disease-modifying trials.
Our results on the role of peripheral RBC biomarkers in the diagnosis of dementia need caution and should be considered only as preliminary. In this re-gard, the most important caveat is the lack of a validation cohort in the study design to confirm the findings of our discovery cohort. However, peripheral RBCs represent a novel potential matrix for the development of blood biomarkers in NDs. In particular, RBC α-syn/tau heterodimer might be a min-imally-invasive and early biomarker to differentiate HC from neurodegenerative dementia, though it failed to differentiate between AD and LBD individuals. Similar investigations from different research groups are mandatory to confirm our findings.
Notably, our data go beyond the clinical setting, suggesting that α-syn, Aβ1–42, and tau dynamically interact in vivo to promote the aggregation and accumulation of each other presumably influencing the progression of cognitive dysfunction. To evaluate and expand our results, additional studies including larger cohorts of patients need to be carried out, including NDs in different stages of the disease, and evaluating the longitudinal changes of the biomarker concentrations [40–43].