
Abstract
Background:
Studies suggest that general anesthetics like isoflurane and sevoflurane may aggravate Alzheimer’s disease (AD) neuropathogenesis, e.g., increased amyloid-β (Aβ) protein aggregation resulting in synaptotoxicity and cognitive dysfunction. Other studies showed neuroprotective effects, e.g., with xenon.
Objective:
In the present study, we want to detail the interactions of inhalational anesthetics with Aβ-derived pathology. We hypothesize xenon-mediated beneficial mechanisms regarding Aβ oligomerization and Aβ-mediated neurotoxicity on processes related to cognition.
Methods:
Oligomerization of Aβ1–42 in the presence of anesthetics has been analyzed by means of TR-FRET and silver staining. For monitoring changes in neuronal plasticity due to anesthetics and Aβ1–42, Aβ1–40, pyroglutamate-modified amyloid-(AβpE3), and nitrated Aβ (3NTyrAβ), we quantified long-term potentiation (LTP) and spine density. We analyzed network activity in the hippocampus via voltage-sensitive dye imaging (VSDI) and cognitive performance and Aβ plaque burden in transgenic AD mice (ArcAβ) after anesthesia.
Results:
Whereas isoflurane and sevoflurane did not affect Aβ1–42 aggregation, xenon alleviated the propensity for aggregation and partially reversed AβpE3 induced synaptotoxic effects on LTP. Xenon and sevoflurane reversed Aβ1–42-induced spine density attenuation. In the presence of Aβ1–40 and AβpE3, anesthetic-induced depression of VSDI-monitored signaling recovered after xenon, but not isoflurane and sevoflurane removal. In slices pretreated with Aβ1–42 or 3NTyrAβ, activity did not recover after washout. Cognitive performance and plaque burden were unaffected after anesthetizing WT and ArcAβ mice.
Conclusion:
None of the anesthetics aggravated Aβ-derived AD pathology in vivo. However, Aβ and anesthetics affected neuronal activity in vitro, whereby xenon showed beneficial effects on Aβ1–42 aggregation, LTP, and spine density.
Keywords
INTRODUCTION
Due to demographic changes, the number of older people is steadily growing. Since age is a major risk factor to develop Alzheimer’s disease (AD) and on average older people more often require surgery, the number of AD patients needing general anesthesia (GA) increases. Although clinical studies are scarce, some demonstrated that patients with different stages of AD are at particular risk of developing lasting neurological and cognitive deficits after GA, but the reasons remain elusive thus far [1]. Several studies suggest a neurotoxic interaction of commonly used inhalational anesthetics with one of the major hallmarks of AD, amyloid-β (Aβ) proteins. They are suspected to accelerate or even trigger the development of the disease [1–4]. Soluble Aβ oligomers seem to be neurotoxic and responsible for brain atrophy and neurodegeneration in AD [5, 6]. Aβ oligomers emerge through aggregation of non-toxic Aβ1–42 monomers, misfolding, or posttranslational modifications [7–9]. Another typical brain lesion in AD patients that is suggested to be enhanced by inhalational anesthetics are neurofibrillary tangles consisting of hyperphosphorylated tau proteins (p-tau). In AD, p-tau detach from microtubules and lead to failures in transport mechanisms of axons [10]. In this work, however, we focused solely on the effect of anesthetics on Aβ. The frequently used volatile anesthetics isoflurane and sevoflurane, both inducing anesthesia mainly via potentiation of gamma-aminobutyric-acid receptors (GABARs) (for review, see [11]), impair hippocampal long-term potentiation (LTP) and may trigger oligomerization of Aβ as was shown in in vitro [1–3, 13], in situ [14], and in vivo experiments in animal models of AD [15–17]. In contrast, other studies indicate neuroprotective properties of these anesthetics such as an improvement of memory function and a reduction of Aβ plaques and oligomers in the brain after application in AD mice [18, 19]. Many of these studies used high and therefore physiological irrelevant concentrations of Aβ with only minor physiological relevance [1, 20]. Obviously, a potential acceleration of Aβ oligomerization by anesthetics and thereby promotion of Aβ toxicity would have critical implications for clinical anesthesia. The single atom xenon has been used as an anesthetic drug since 1951 [21]. Even though the incidence of postoperative nausea and vomiting is higher [22] compared to other frequently used anesthetics, xenon has been shown to have beneficial effects, such as cardiovascular stability [23] and fast recovery of cognitive function [24]. Compared to other frequently used anesthetics, the incidence of postoperative nausea and vomiting is higher for xenon [22]. Due to its high cost and difficult extraction, it is still rarely used [24]. The present study analyzes the interaction of aggregation and synaptotoxicity of Aβ isoforms that are predominantly present in the brain of AD patients: Aβ1–42 and Aβ1–40 (Aβ1–42: ∼5–10%; Aβ1–40: ∼80–90%) [25] with the commonly used inhalational anesthetics isoflurane and sevoflurane as well as xenon. Studies have shown that Aβ peptides can undergo post-translational modifications [26]. We therefore included the investigation of the most abundant modified isoforms pyroglutamate-modified Aβ3–42 (AβpE3, ∼25%of total Aβ [27]) and nitrated Aβ (3NTyrAβ) [26]. These proteins have gained most attention as potential key participants in the pathology of AD due to their oligomerization propensity, cellular toxicity, stability and ability to cause severe neuron loss in transgenic mice [28].
Using time-resolved fluorescence-resonance-energy transfer (TR-FRET) and silver staining as well as recording synaptic plasticity and neuronal activity of the tri-synaptic hippocampal circuit and monitoring cognitive performance in an animal model of AD, we tested interactions between Aβ and anesthetics, applied at more physiological doses, at different levels of complexity.
MATERIAL AND METHODS
Amyloid-β preparation
Aβ1–42 (order number H-1368; Bachem, CH-Bubendorf), Aβ1–40, and AβpE3 were suspended in 100%hexafluoroisopropanol (HFIP; Sigma Aldrich) to 1 mg/400μl and shaken at 37°C for 1.5 h. This solution was aliquoted to 50μg portions in Protein LoBind Tubes (1.5 ml; Eppendorf) and deep-frozen for 30 min at –80°C before HFIP was removed by lyophilization. Before usage, we dissolved Aβ1–42 and AβpE3 in Dimethyl sulfoxide (DMSO; Sigma Aldrich), Aβ1–40 in double distilled (dd)H2O and 3NTyrAβ in 1X phosphate buffered saline (PBS) to a concentration of 100μM. For the experiments, Aβ solutions were further dissolved in artificial cerebrospinal fluid (aCSF; 125 mM NaCl, 2.5 mM KCl, 1.25 mM NaH2PO4-monohydrate, 25 mM D-(+)Glucose-monohydrate, 25 mM NaHCO3, 1 mM MgCl2-hexahydrate, 2 mM CaCl2-dihydrate).
Animals
Experiments including animals were approved by the ethical committee on animal care and use of the government of Bavaria, Munich, Germany (55.2-1-54-2532-58-2017). Mice were housed in environmentally controlled conditions in groups under a rhythm of 12 h (dark/light) with ad libitum intake of water and food (22°C, 60%humidity). For extracellular- and voltage-sensitive dye imaging (VSDI) experiments, male wild-type (WT) C57BL/6J mice were obtained from Charles River Laboratories (Munich, Germany). The transgenic (Tg) Thy1-EGFP MJrs/J mice for spine density imaging were obtained from Jackson Laboratory (Bar Harbor, ME, USA). They express the enhanced green fluorescent protein (EGFP) in their nervous system [29], which labels the morphology of neurons and a variety of neuronal subsets [30]. In our laboratory, Thy1-EGFP X C57BL/6J (male X female) were used to generate Tg EGFP mice (EGFP-M). Littermates were genotyped by Charles River [31]. Both WT and EGFP mice aged to 7–12 weeks. For cognitive testing and ELISA, male ArcAβ mice, a widely used animal model of AD, were used (n = 92). They were obtained from Charles River Laboratories International (Calco, Italy). They overexpress human APP695 with the Swedish (K670N/M671L) and Arctic (Arc) (E693G) mutations. The Arctic mutation affects the Aβ sequence directly while the Swedish mutation affects the β-secretase, augmenting Aβ levels in the mouse brain [32]. They develop an Aβ pathology including cognitive deficits shown by the Morris water maze (MWM) and Y maze starting at 6 months of age, as well as deficits in synaptic plasticity starting at 3.5 months [33]. Animals were 10–14 months old before start of experiments. Due to their more aggressive behavior, ArcAβ mice were kept in single cages. After delivery, ArcAβ mice were given 7 days for accommodation purposes. Animal welfare was assessed daily following a standardized protocol.
Brain slice preparations
For extracellular and VSDI experiments, mice were deeply anesthetized with isoflurane and decapitated. Brains were removed quickly in ice-cold aCSF, the brain hemispheres were separated using a razor blade. ACSF was continuously aerated with a mixture of 95%O2 and 5%CO2 (carbogen) which led to a final buffered pH of 7.4 throughout the experiments. For VSDI experiments, the so called ‘magic cut’ was performed to preserve the tri-synaptic circuit of the hippocampus. To this end, the hemispheres were placed on their medial face of the sagittal plane while the dorsal part of the brain was removed partly with defined angles [34]. The dorsal part was then fixated with histoacrylic glue to the tray of the microtome (Microm International, Walldorf, Germany).
For extracellular experiments (LTP), the brain hemispheres were glued on the tray with their medial face of the sagittal plane to the tray. 350μm slices were cut in ice-cold aCSF saturated with carbogen. Afterwards, slices were left to recover in a submerged chamber for 30 min in a water bath at 34°C. For VSDI, slices were transferred to a small glass container and stained with the voltage-sensitive dye Di-4-ANEPPS (final concentration 20.8μM–26μM; Sigma-Aldrich) for 20–30 min. The slices for VSDI and extracellular experiments recovered for at least 60 min in a holding chamber before start of an experiment. In the recording chamber, the slices were continuously perfused with carbogenated aCSF at a flow-rate of 5–8 mL/min. All experiments were performed at room temperature (20–22°C).
TR-FRET-assay
The TR-FRET assay was modified after [35]. In order to investigate the influence of commonly used anesthetics on aggregation properties of Aβ, MOPS/TRIS buffer (final 56.82 mM, pH 8.1) with MgCl2 (113.64 mM) was prepared. The presence of MgCl2 is needed to promote aggregation of Aβ proteins, without MgCl2 (negative control) Aβ assembly almost does not occur (data not shown). Increasing the concentration of Mg2 + (170.5 mM) in the buffer solution leads to an enhancement of Aβ aggregation and served as control for aggregation acceleration.
The buffer was either untreated (controls) or aerated directly with 65%xenon, 4%sevoflurane (∼210μM), or 2%isoflurane (∼280μM) (the concentrations resemble ∼1 MAC of each inhalational anesthetic [13]; tested in cooperation with the peptide biochemistry workgroup of the Technical University of Munich) for 30 min. In order to start the aggregation assay, 2μM solutions of biotin-labelled Aβ1–42 was prepared in 1μM Tb3 +-SA and Fluorescein-amidites-(FAM)-labelled Aβ1–42 (AnaSpec) as the FRET acceptor, Aβ1–42 and AβpE3 (1μM) in 20 mM NaOH. AβpE3 was added only to trigger Aβ aggregation. These four solutions were again mixed in a ratio of 1:5: 10:4 resulting in an Aβ solution with a total concentration of 200 nM. 5μl of this Aβ stock solution (200 nM total concentration) was mixed with 45μl of the corresponding buffer. Tubes were placed with open lids into a darkened box and anesthetics were applied via an influx tube attached to the box for 1 h. Another tube ensured the efflux of gas from the box. Control solutions were stored in a control box. Afterwards, 50μl of the solution was filled into each well of a 384-well assay plate with a non-binding surface and flat bottom (Corning #3655, Corning, NY, USA). Wavelengths were measured with the EnVision multimode plate reader (PerkinElmer Inc, Waltham, MA, USA), an excitation filter of 340/30 nm and emission filters of 490/10 nm and 520/25 nm for 20 min, interval 3 min. Data points for each emission wavelength of technical replicates were averaged, the ratio for 520/490 nm was calculated and corrected for the ratio in the absence of the FRET acceptor [35].
Silver staining of Aβ proteins
50μg of HFIP-treated Aβ1–42 was dissolved in DMSO to 369.2μM and further diluted in aCSF to 100μM. Samples were incubated in Protein LoBind Tubes at RT for 7 d, 3 d, 1 d, 6 h, 90 min, and 0 min before aeration with 65%xenon, 2%sevoflurane, or 1%isoflurane for 30 min (∼1 MAC). 1μg peptide per lane was loaded onto NuPAGE Bis-Tris 4–12%gels (Life Technologies, Paisely, UK) directly after aeration and gel electrophoresis was started. Silver staining was performed according to [35]. Stained gels were imaged with the ChemiDocTM XRS + System Imager and further analyzed with the Image LabTM Software (Bio-Rad Laboratories, Hercules, CA, USA). To ascertain the differences between control proteins and proteins treated with anesthetics, we evaluated the normalized volume intensity of the different bands (monomers, trimers, tetramers, higher oligomers) and compared them statistically.
Voltage-sensitive dye imaging
To investigate the influence of Aβ and inhalational anesthetics on the distribution of neuronal activity in the hippocampus, we placed a bipolar concentric tungsten electrode in the granule cell layer of the dentate gyrus (DG) to stimulate the distribution of neuronal activity from the DG via the CA3 region (CA, Cornu Ammonis) to the CA1 region (100μs/4–8 V) via the tri-synaptic circuit (Fig. 1A, B). For VSDI and data analysis we used the MiCAM02 hard- and software package (BrainVision, Tokyo, Japan). To record neuronal activity, we used an Olympus BX51WI fluorescence microscope (Olympus, Hamburg, Germany) that includes a MiCAM02-HR camera and a XLFluor4X/340 objective (NA 0.28) with a 480–550 nm band pass excitation filter, a 590 nm dichroic, and a 590 nm low emission filter was used to record neuronal activity. The relative change in recorded fluorescence (ΔF/F), represented as a color-coded fluorescence of the dye, served as the correlate of neuronal activity in the hippocampus and is defined as the “fast depolarization signal” (FDS). We recorded F in an 88×60-pixel frame-size with 36.4×40μm pixel dimensions at a sampling (frame) rate of 2.2 ms. The pixelation of images was reduced with the interpolation function of the MiCAM02 software. The signal-to-noise ratio was improved by recording and averaging 8 stimulation runs in 15 s intervals and data procession with the BrainVision software. The ΔF/F values were spatially smoothed with a 3×3-pixel average filter. Additionally, a temporal filter was applied calculating the fluorescence (F) of a pixel at the frame-number (t) using the equation F(t) = (F(t –1) + F(t) + F(t + 1))/3. For analysis of neuronal activity in hippocampal sub regions, we defined two regions of interest (ROI). The first ROI (“CA3”) was positioned into the CA3 region near the DG, but not overlapping with it. The second ROI (“CA1”) was placed into the CA1 region (Fig. 1A, B). Since CA1 is the main output region of the hippocampus, we present only the results of the CA1 region here. The neuronal activity was analyzed using a customized Macro in MATLAB named ‘VSDI ROI Tool’. With the help of this Macro, FDS was analyzed through certain parameters in defined ROI. The so called “area” is a numeric value counting all active pixels. An active pixel is defined as a pixel inside a ROI where the change of fluorescence (ΔF/F) was at least three times higher than the standard deviation of random background noise at any time within the 512 frames of each movie (Fig. 1C, D). This is a parameter to determine the spread of excitation upon stimulation. Within the current study, the value FDSAUC (AUC = area under the curve), which resembles the AUC of the graph depicting the FDSAreaInt (Area x Int; Int = intensity), was chosen to represent neuronal activity. The value FDSAreaInt represents the sum of the intensities of every activated pixel within a defined ROI for each of the 512 frames of a movie. The value FDSAUC therefore reflects an overall effect. It includes the propagation of the neuronal signal in the hippocampus (Area), the intensity (Int), and the duration of excitation. For Aβ control experiments, slices were pre-incubated with Aβ1–42, Aβ1–40, AβpE3, and 3NTyrAβ (50 nM) for 90 min before recording FDS. For anesthetic control experiments, slices were aerated for 40 min with 1%isoflurane (final concentration in solution: 0.37 mM [13]) and 2%sevoflurane (final concentration in solution: 0.42 mM [13]) (both washed into the aCSF by passing carbogen through a calibrated agent specific vaporizer (Dräger, Lübeck, Germany)). Application of xenon was performed via polytetrafluoroethylene tubing (VWR International, Darmstadt, Germany) at an approximate flow rate of 0.3–0.5 L/min to the aCSF reservoir, with additional application of carbogen at the same flow rate (final xenon concentration in solution: 1.9 mM [36]). To assure a sufficient oxygen supply and to avoid a change in pH during the slice experiments, the maximum xenon concentration which can be applied is limited to 65%. As such, for baseline conditions, a nitrogen control gas (65%N2, 30%O2, 5%CO2) admixture was co-applied with carbogen to the aCSF and exchanged with a pre-calibrated gas mixture composed of 65%xenon, 30%O2, abd 5%CO2. Under these conditions, the CO2 and O2 partial pressure were kept constant and the concentration of dissolved xenon in aCSF was 1.9±0.5 mM as determined by headspace gas chromatography [36]. It is not possible to apply a pure xenon anesthesia at normobaric conditions to rodents since the “MAC immobility” for rodents is hyperbaric with 1.61 atm (standard atmosphere; ∼160 Vol%) [37]. 65%xenon is close to 1 MAC xenon for humans (57–71%, volume is age-dependent [38]) and frequently used in previous studies [39]. The chosen concentrations for isoflurane and sevoflurane were also close to 1 MAC for humans (age-dependent; isoflurane: 0.91–1.49%; sevoflurane: 1.4–2.29%[38]) and correlated with the applied vapor dial settings in a linear fashion. The concentrations are presented as volume percent (Vol%) [40]. Under baseline and washout conditions, the xenon gas mixture was replaced by 65%N2 + 30%O2 + 5%CO2. To investigate a possible synergistic effect of the different Aβ species plus anesthetics, brain slices were incubated with Aβ for 90 min after baseline recordings, then aerated with anesthetics for 40 min and recovered for 60 min (washout).
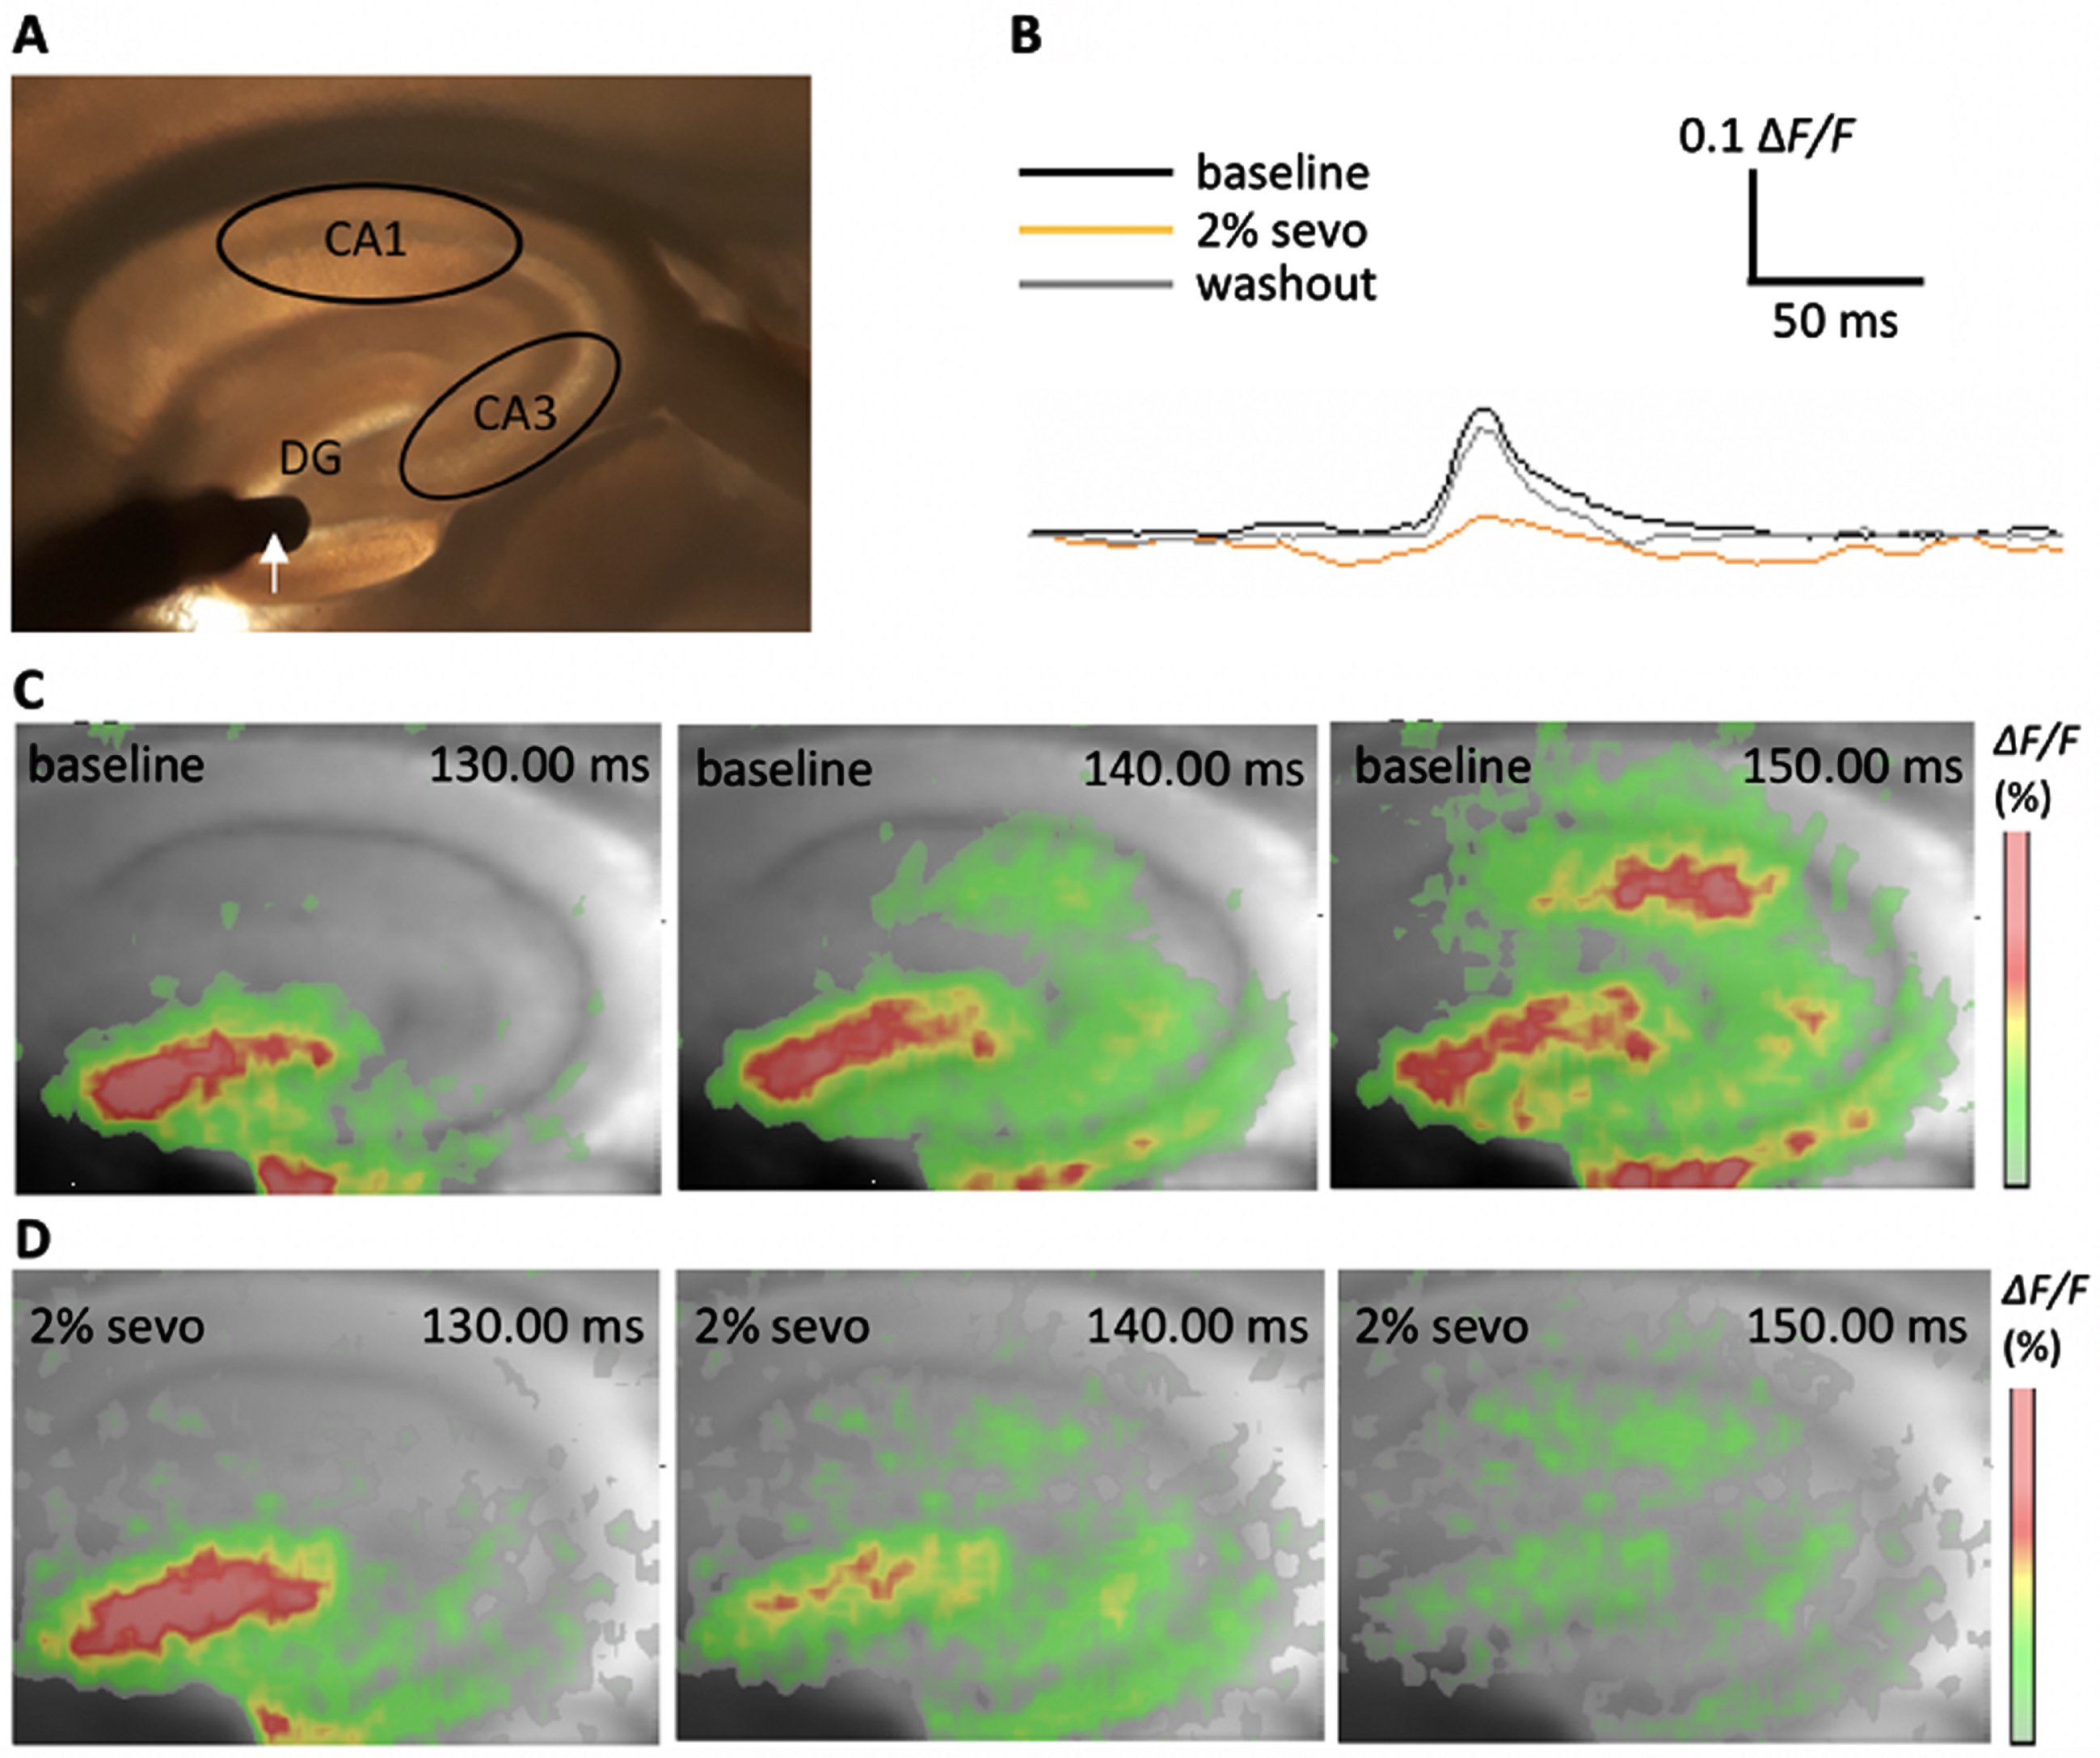
Principle of voltage-sensitive dye imaging (VSDI) of neuronal activity propagation in the tri-synaptic formation of the murine hippocampus. A) Camera image of the hippocampus with defined regions of interest: CA1, CA3, and dentate gyrus (DG). The white arrow indicates the stimulation electrode in the DG granule cell layer. B) Representative VSDI recording traces showing the time courses of the average of ΔF/F values within the CA1 region at baseline conditions, in the presence of 2%sevoflurane and after washout of sevoflurane. C) Representative images of a filmstrip showing the propagation of a depolarization-mediated VSDI signal from the DG to the CA1 region upon stimulation at baseline conditions. Warm colors (red; see color bar) represent higher values of the fractional change in fluorescence (ΔF/F) and indicate a stronger FDS. D) Example for neuronal activity depression after aeration with 2%sevoflurane for 40 min. Images taken at same time points as depicted in C.
Field excitatory postsynaptic potentials
Field excitatory postsynaptic potentials (fEPSPs) were evoked in the striatum of the CA1 region of the hippocampus through alternately delivering an electrical stimulus (20μs; 4-5 V) via one of two bipolar tungsten electrodes placed into the striatum. The slices were permanently aerated with carbogen. fEPSPs were recorded with a borosilicate glass micropipette (Clark Electromedical Instruments, Pangbourne Reading, United Kingdom) filled with aCSF (open tip resistance 1-2 MΩ) that was placed between the two electrodes. Through this positioning, non-overlapping populations of the Schaffer collateral-associated commissural pathway were stimulated and allowed the measurement of an internal control [31, 41]. At the beginning of an experiment, baseline measurements were performed until a stable response of about 25–30%of the maximal response could be recorded. In control experiments, a high frequency stimulus (HFS; 100 pulses delivered at 100 Hz) was induced via one of the electrodes to evoke LTP. The effect was recorded for 60 min with the same stimulation settings used for baseline recordings. Aβ was then incubated for 90 min at 50 nM and LTP was evoked again and recorded for 60 min. For xenon experiments, Aβ was incubated before the first HFS. Slices were aerated with carbogen + 65%N2 + 30%O2 +5%CO2. After Aβ incubation, this gas admixture was replaced by carbogen + 30%xenon + 35%N2 + 30%O2 + 5%CO2 (pH 7.3–7.4; final xenon concentration in solution: 1.1 mM [36]) for 20 min before LTP was evoked in the other electrode. After HFS, the aCSF was aerated for an additional 10 min with carbogen + 30%xenon + 35%N2 + 30%O2 + 5%CO2 (Fig. 2). Recorded data were amplified, filtered (3 kHz), and digitized (9 kHz) using a laboratory interface board (ITC-16, Instrutech Corp., NY, USA), recorded with the WinLTP program (WinLTP Ltd., Bristol, UK; available from http://www.ltp-program.com) [42] and re-analyzed offline with the WinLTP ReAnalysis Software. Measurements of the slope of the fEPSP were taken between 20 –80%of the peak amplitude. Slopes of fEPSPs were normalized to the last 10 min of the baseline control period before HFS.
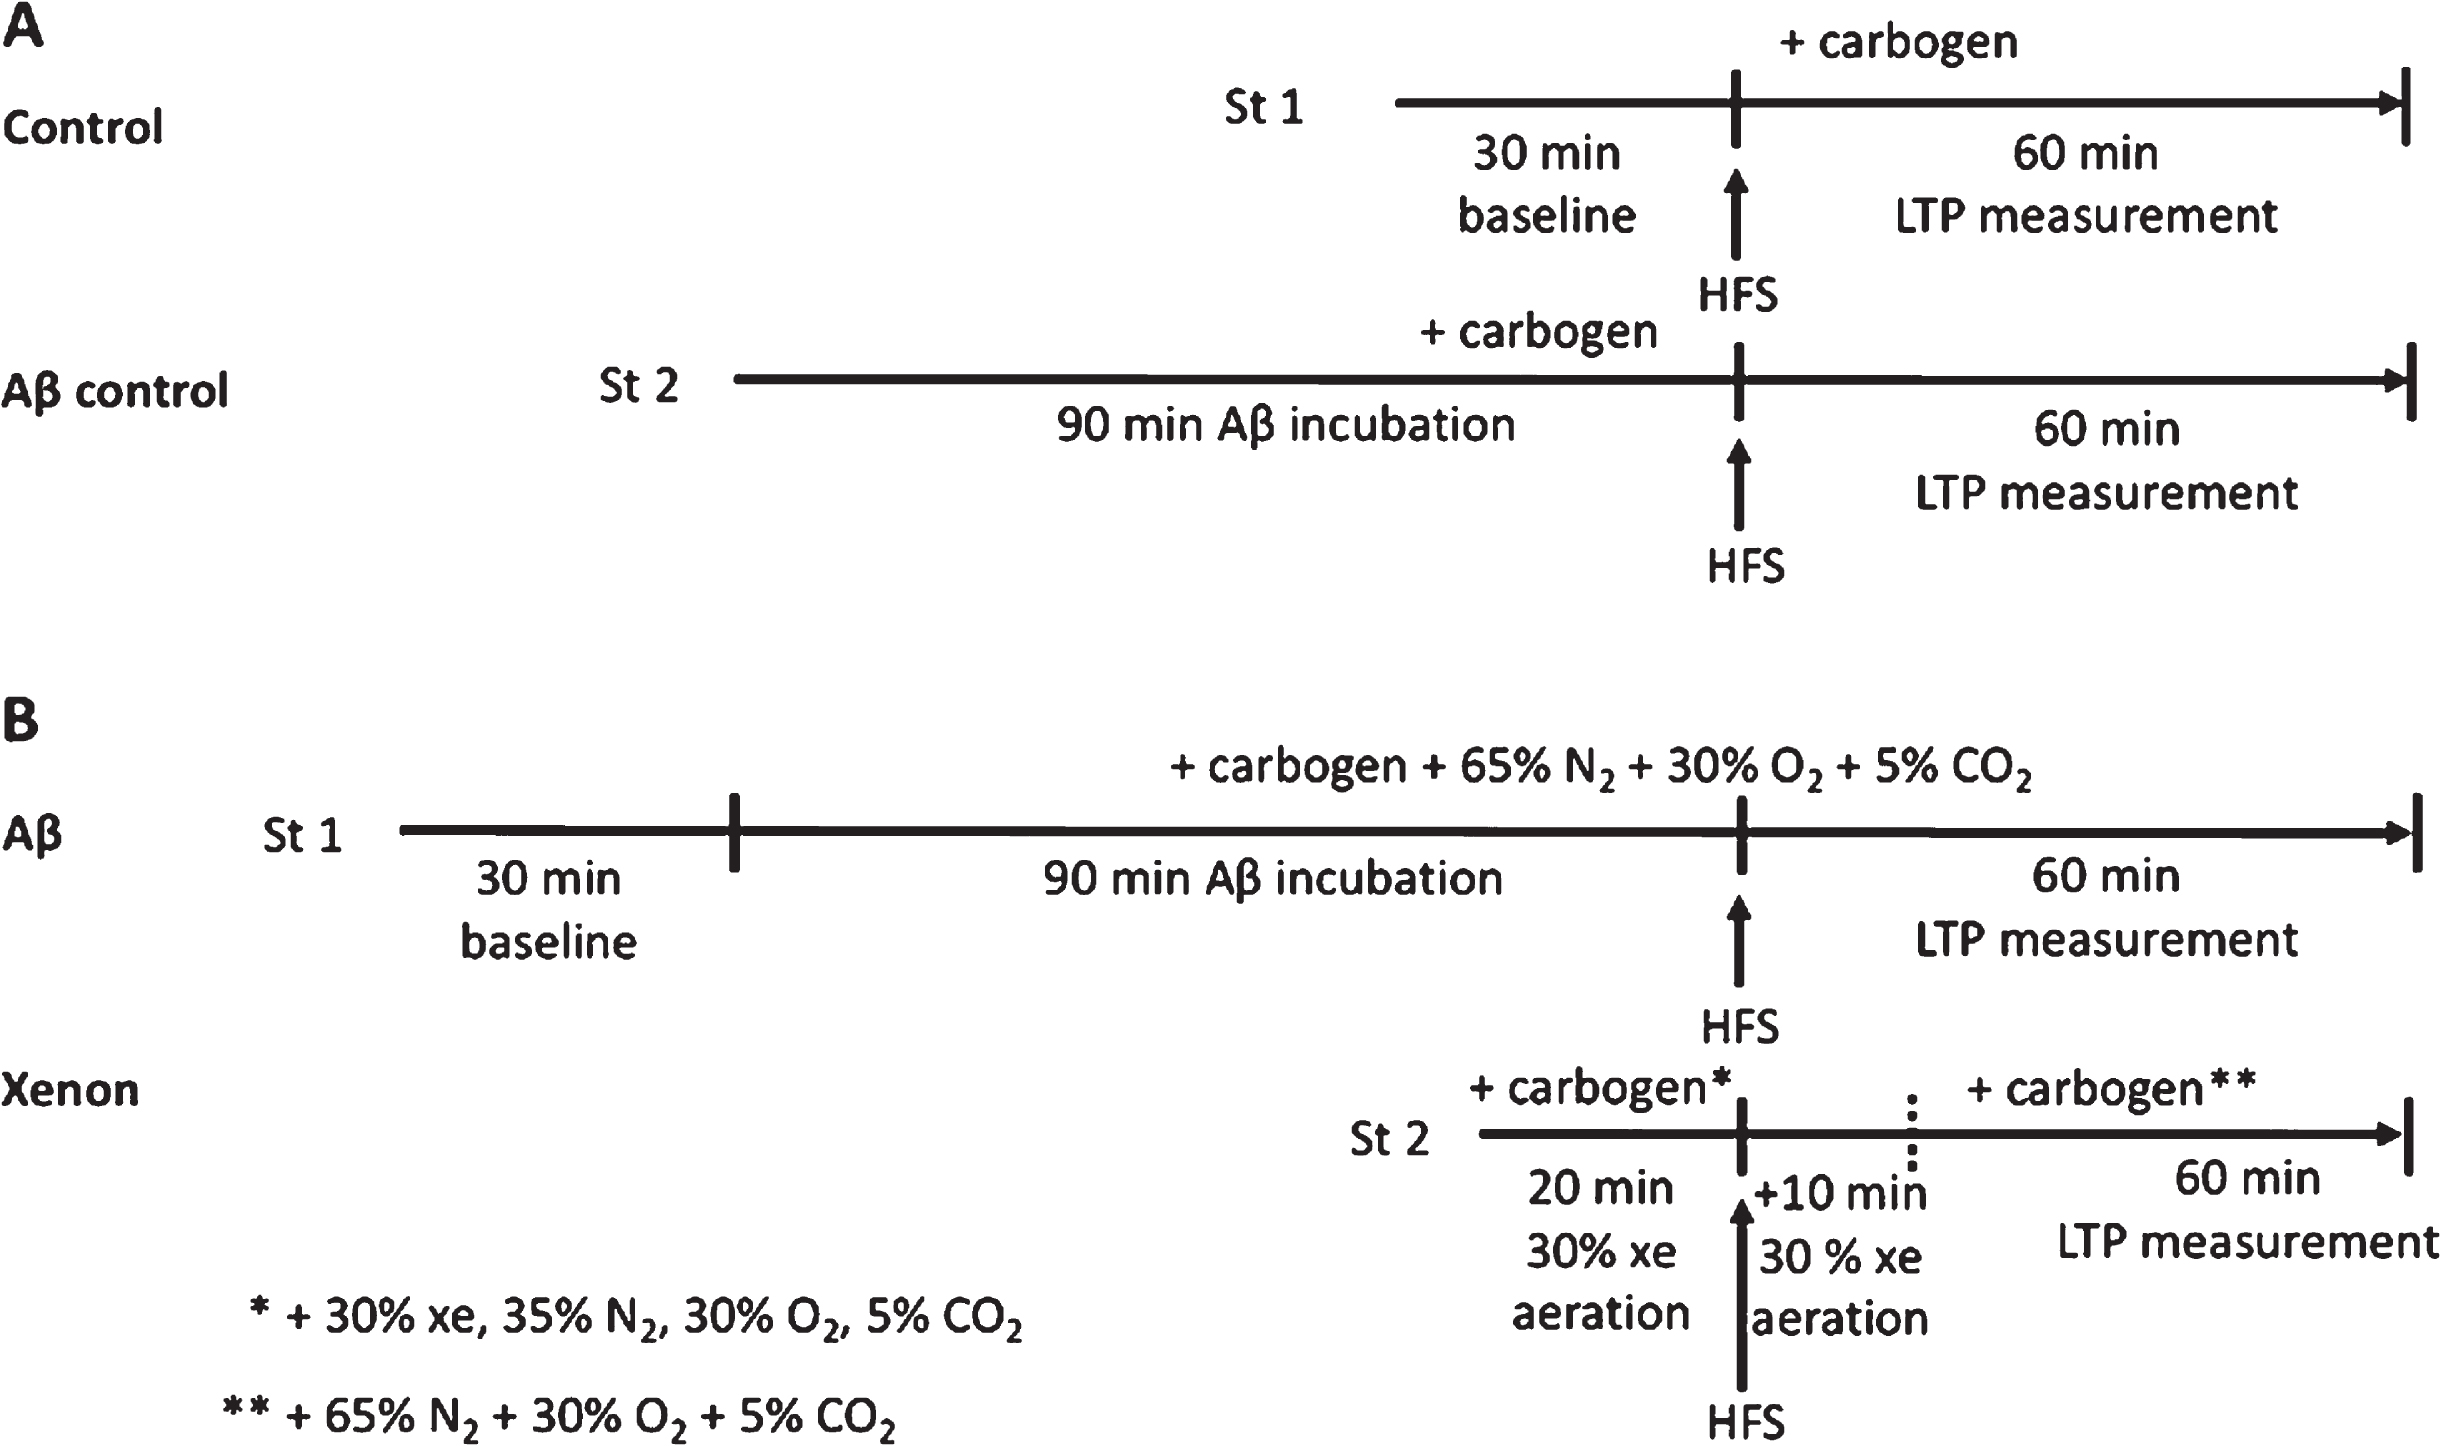
Schematic showing the time course of following experiments using two independent synaptic inputs (stimulation electrode 1 and 2 = St 1, St 2). A) After baseline recording, a high frequency stimulation (HFS) was triggered in St 1 and long-term potentiation (LTP) was measured as the control. In the same slice, St 2 induced HFS after incubation of respective Aβ at 50 nM. ACSF was aerated with carbogen. B) After Aβ incubation, St 1 induced HFS and a potential LTP was measured. ACSF was aerated with carbogen + 65%N2 + 30%O2 + 5%CO2. St 2 induced HFS after aeration of the slice with 30%xe + 35%N2 + 30%O2 + 5%CO2, for 20 min. After HFS, gas mix was applied for an additional 10 min before it was replaced with carbogen + 65%N2 + 30%O2 + 5%CO2.
Dendritic spine density
Brains of EGFP mice were cut sagittaly into 100μm slices. Slices containing the hippocampus were collected and recovered in a holding chamber at 34°C before recovering another 60 min at RT. For Aβ control experiments, we incubated 50 nm Aβ1–42 in aCSF for 90 min. For the main experiments, we incubated Aβ1–42 for 90 min before gases were applied for 60 min. Slices were then fixated with 4%Paraformaldehyde (PFA) overnight (ON) at RT. To intensify the fluorescent signal of GFP-labelled-neurons, we immunostained the slices with an GFP rabbit IgG antibody (1:200). Dendritic spines were analyzed by confocal microscopy (LSM780; oil-immersion objective; 40x magnification) to detect GFP fluorescence signals. The ZEN software (Carl Zeiss Microscopy GmbH) was used for acquisition, and all 13 layers were detected in a Z-stack interval of 0.61 mm. The final images were generated in a constant frame size of 512 x 256 pixels. 8–10 dendrites were analyzed per mouse. Figures show maximum intensity projections of the dendrites (Fig. 10), while the analysis was performed in 3D images.
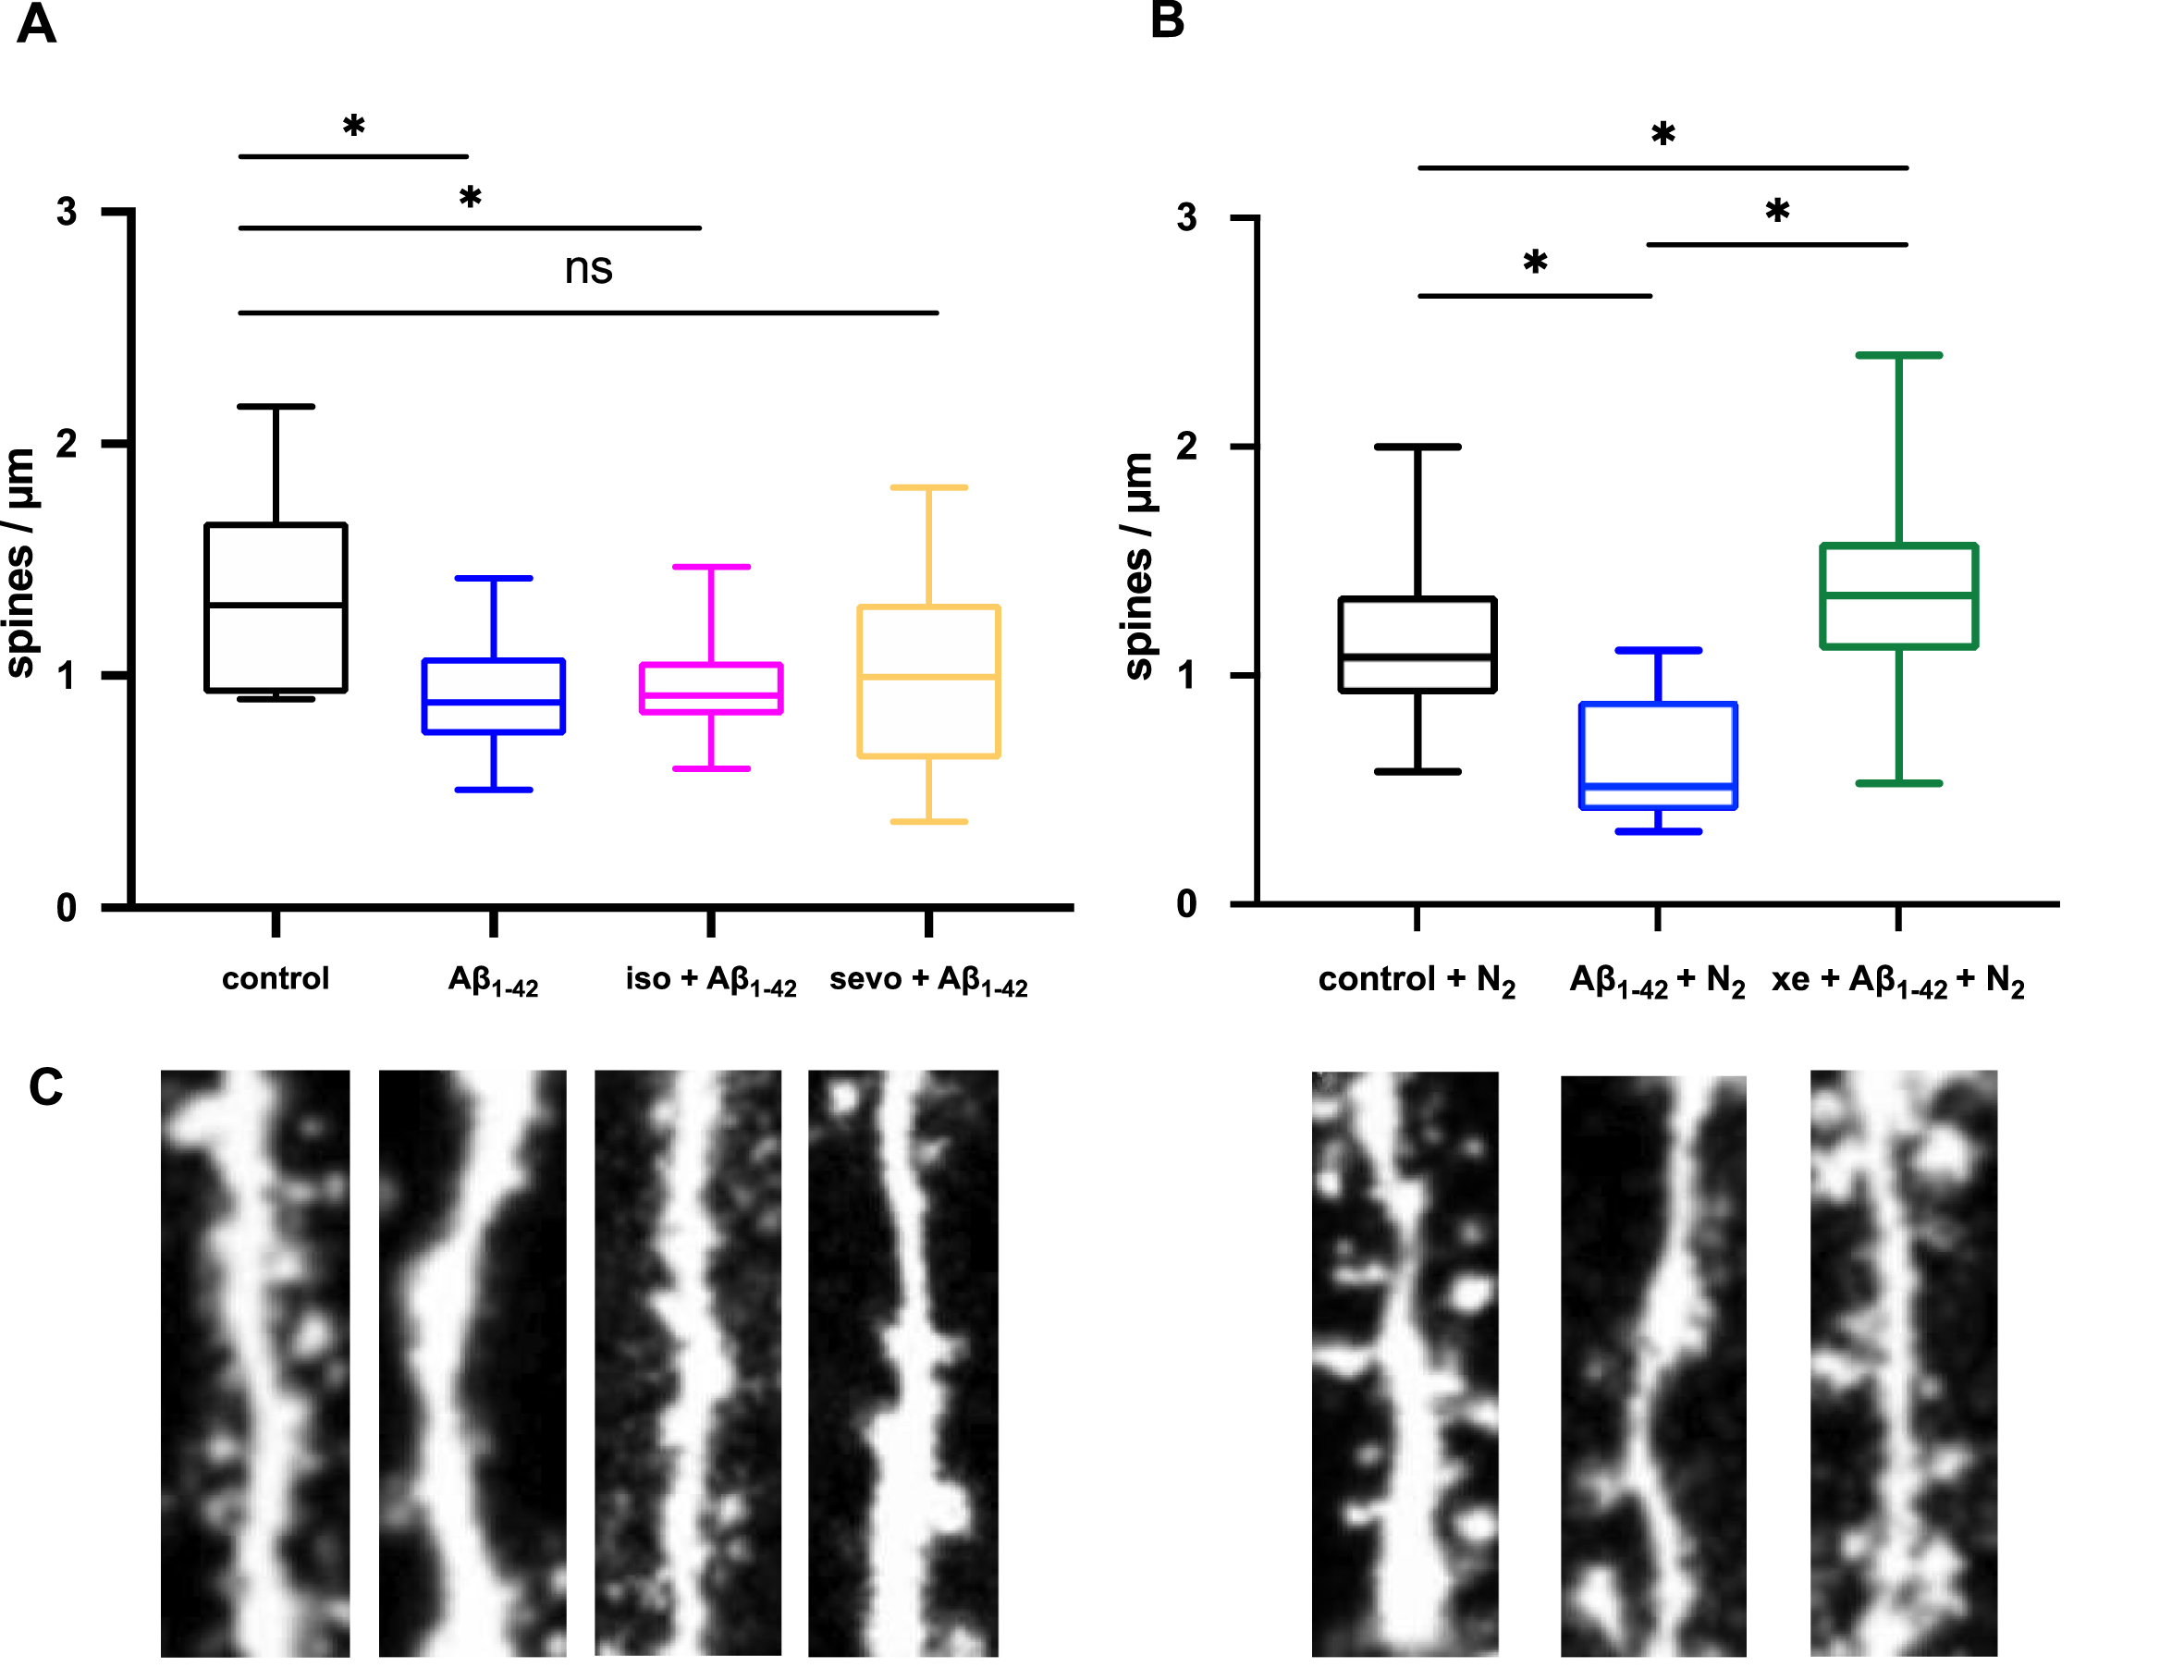
Xenon and sevoflurane restore Aβ1–42-induced spine density attenuation in the hippocampus. A) Aβ1–42 significantly decreased dendritic spine density (control: 1.30±0.5 spines/μm, n = 6, Aβ1–42: 0.89±0.3 spines/μm, n = 22, p = 0.0275). Even though the number of spines was decreased in the presence of 2%sevoflurane (sevo), and Aβ1–42 (sevo + Aβ1–42: 0.92±0.21 spines/μm, n = 10, p = 0.1888) the mean was not statistically different to control. 1%isoflurane (iso) had no influence on toxicity of Aβ1–42 (iso + Aβ1–42: 0.99±0.44 spines/μm, n = 60, p = 0.0125). B) N2 + Aβ1–42 decreased spine density (N2 + control: 1.08±0.31, n = 35, N2 + Aβ1–42: 0.51±0.21 spines/μm, n = 10, p < 0.0001). 65%xenon (xe) restored synaptic toxicity of N2 + Aβ1–42 (Aβ1–42 + xe: 1.35±0.35 spines/μm, n = 42, p = 0.035). Whiskers represent minimum and maximum values. C) Representative images of dendrites.
Cognitive performance and Aβ1–42-plaque burden after anesthesia
Water cross maze
The Water Cross Maze (WCM) was developed and established as a highly sensitive tool to assess hippocampal-dependent place learning in small animals [43]. These properties make this test highly suitable for the detection of cognitive deficits developed in ArcAβ mice which is supposed to be amplified after anesthesia. The WCM [43] consists of 0.5 cm thick acrylic glass panes forming a cross. The transparent panes allow orientation of animals by looking at the environment in the room (sink, cupboard, door opening, pipes on the ceiling). Each arm is 50 cm long, 10 cm wide and 30 cm high, labelled as N, E, S, and W in clockwise direction. The WCM was filled daily with fresh tap water to a height of 11 cm (23±1°C). By blocking the arm opposing the starting arm with a transparent acrylic glass disk, the WCM was transformed into a T-Maze. Depending on the applied protocol, the 8×8 cm large transparent platform was placed either in the east or west arm, 1 cm below the water surface and not visually recognizable for the animals [43]. After each test run, the animals were put back into their home cage with the aid of a metal grid attached to a pole and placed in front of a heat lamp to prevent hypothermia. Published human MACs of xenon for immobilization (MACimmobility) is 71%[44] whereas MACimmobility for rodents is hyperbaric (1.61 atm; [37]). Due to these obvious constraints, it is impossible to anesthetize mice at normo-baric conditions with xenon alone. Therefore, to guarantee an anesthesia at around 1 MAC, we applied xenon (mean = 43%) [45] concomitantly with a continuous infusion of sevoflurane (mean = 3.1%) until the end of anesthesia. Additionally, a pure desflurane (mean = 11%) and sevoflurane (mean = 4%) anesthesia was performed. While several studies already investigated the influence of isoflurane on AD animal models [16, 19], much less is known about the potential effects of the widely used and chemically similar [46] volatile anesthetic desflurane. Therefore, we decided to apply desflurane instead of isoflurane in our cognitive tests. Cognitive testing of Tg and WT mice was performed before and after anesthesia. Mice were trained in groups of 6 in the dark phase of the circadian cycle. Each mouse had to perform 6 runs per day for 7 consecutive days. On the 8th day, mice were anesthetized, and on day 9 the first cognitive test was performed, again consisting of 6 runs per day, which was repeated for 4 weeks at intervals of 7 days. The platform was placed in the same arm every day, while the starting arms varied daily. All cognitive tests after anesthesia were performed according to the tests before anesthesia. When starting a run, the mouse was placed in the water with its head facing the experimenter, standing behind the start arm during the test. A run was completed when the animal had found the platform and climbed on it (stayed for 10 s) or at the latest after 30 s search time. The following parameters were observed and recorded: “Accurate runs”: A run was considered accurate if the platform in the target arm was directly found in time and the mouse did not visit another arm. “Latency”: Total time needed to find the platform, marked 31X if the platform was not found within 30 s.
Anesthesia
We applied the anesthetic (sevoflurane or desflurane) into an acrylic glass chamber until the animal lost consciousness. After loss of postural reflexes, mice were placed on a warming pad (rectal temperature was measured and maintained at 37.5°C). GA was maintained for 2 h with 1 MAC of desflurane or sevoflurane respectively, or with a mixture of 50%xenon and sevoflurane (PEEP = 5, FiO2 =∼50%). Desflurane and sevoflurane were administered using a nose chamber in a semi-open anesthesia circuit. Due to the characteristics of the noble gas xenon, GA could not be induced and maintained using this gas alone. Also, a semi-open anesthesia circuit seemed higly impracticable. We therefore decided to use a mixture of sevoflurane and xenon in a closed-circuit gas delivery system. After induction of GA with sevoflurane in an acrylic glass chamber, mice were placed in a nosecone mask including an adjustable snout clamp and GA was maintained with 50%xenon and 2.7%sevoflurane. The inspiratory xenon concentration was measured using a thermal conductivity sensor (provided by AGA AB, Lidingo, Sweden/now Linde AG) [47]. Mice breathed spontaneously with an applied PEEP of 5. During anesthesia, we continuously monitored temperature, inspiratory oxygen concentration, end-tidal CO2 concentrations, gas concentrations as well as heart rate and respiratory rate. The depth of GA was monitored using the tail clamp test [48] and adjusted accordingly by modifying the anesthetic gas concentration. Xenon was recovered by cleansing the animal’s exhalations from CO2 using soda lime absorption. After 2 h, mice were again placed in an oxygen enriched acrylic glass chamber until full recovery from anesthesia. Afterwards the mice were placed in single cages.
Quantitation of Aβ1–42 using the sandwich ELISA assay
Aβ1–42 was detected with a sandwich ELISA assay by using a Human Aβ1–42 ELISA Kit (Invitrogen, CA, USA). From each sample, a piece of hippocampus and cortex were separately weighed, homogenized with 10 times its weight of guanidine buffer, and incubated for 3.5 h at room temperature (RT). Thereafter, the 10-fold weight of casein buffer was added, and the mix was centrifuged at 4°C for 20 min at 13.000 rpm. The supernatant was transferred to a new tube and stored at –80°C until further use. 50μl of standard and each probe was added to appropriate wells of a 96-well plate (every probe was measured twice to determine a mean concentration). 50μl of human Aβ1–42 detection antibody was added and the mix was incubated ON at 4°C. The solution was aspired, and the wells washed 4 times with 1X wash buffer. 100μl anti-rabbit IgG HRP was added and incubated for 30 min at RT. After adding 100μl of stabilized Chromogen to the wells, the plate was incubated for 30 min at RT in the dark. 100μl of Stop Solution were added, and the absorbance was read at 450 nm. For every probe, the absorbance was measured twice, and the mean concentration was determined by comparing the results of the absorbance to a standard curve (newly established for each plate).
Determination of plaque burden using Methoxy-X04 staining and fluorescent microscopy
Prior to the staining, the microscopy slides with the brain sections (50μM) were stored for 20 min at –20°C to avoid crystallization. For fixation, the slides were incubated for 20 min in ice-cold acetone/isopropanol solution (1:1) and washed twice with 1X PBS-EtOH solution for 10 min. The sections were stained in the dark with cooled Methoxy-X04 staining solution (10 mg Methoxy-X04; Tocris, Bio-Techne GmbH, Wiesbaden, Germany) solved in 100μl DMSO with 450μl Isopropanol, 10μl 4 M NaOH, and 450μl 1X PBS. 800μl of this solution were mixed with 100 ml EtOH and 100 ml 1X PBS) for 30 min and washed 3 times with washing solution for 5–10 min. The sections were then washed 3 times for 10 min with distilled water and dried for 30 min. To cover the sections with coverslips, Dako fluorescent mounting medium (Dako North America Inc., Carpintera, CA, USA) was used. The sections dried ON in the dark. Fluorescence microscopy of the slices was performed with an Apotome AxioImager.M2 f (Carl Zeiss, Oberkochen, Germany), a 10x objective and a 4’, 6-diamidino-2-phenylindole (DAPI) reflector to gain images of the hippocampus and cortex. They were further processed with ZEN blue (Zeiss). Plaque size and number was determined using ImageJ.
Statistical analysis
TR-FRET
For analysis of the TR-FRET assay results, a Kruskal-Wallis-test followed by the Dunn-Sidak post-hoc analysis was performed using MATLAB R2017b (The Mathworks, Natick, MA, USA). The boxplots present the median (central mark), the 1st and 3rd quartile (bottom and top edges of the box). The whiskers span the most extreme values that are not considered outliers. Outliers are presented as ‘+’.
Silver staining
Statistical analysis was performed with GraphPad Prism 6.0f (Graph Pad Software, La Lolla, CA, USA). To test for statistical significance between ‘control’ and ‘+iso/sevo/xenon’, the Mann-Whitney-U-test was performed. To test for differences between incubation times, the Kruskal-Wallis test, followed by the Dunn-Sidak post-hoc analysis was performed. Graphs represent the mean±SEM. Asterisks (*) represent a statistical significance (p < 0.05).
VSDI
Statistical analysis was performed with GraphPad Prism 6.0f. A paired t-test was used to test for significance between baseline-neuronal activity and activity after Aβ incubation. An Ordinary one-way ANOVA was used to test for statistical differences between all groups (baseline –anesthetic –washout; baseline/Aβ –anesthetic - washout). Bonferroni’s post-hoc multiple comparisons test was then used to test between different states of neuronal activity –baseline, anesthetics and washout/recovery. Asterisks (*) represent a statistical significance (p < 0.05).
LTP
MATLAB R2017b was used to perform the Wilcoxon signed rank test to investigate possible differences between control and experimental conditions. In order to quantify the strength of the effects Cohen’s U31 was calculated. This is a measure that quantifies the fraction of the difference in %between control and experimental conditions that are below a comparison value which was set to a difference of 0%in our case. In addition to the U31 value, we calculated 95%confidence intervals using 10k-fold bootstrapping. The boxplots present the median (central mark) and the 1st and 3rd quartile (bottom and top edges of the box). The whiskers span the most extreme values that are not considered outliers. Outliers are presented as ‘+’. For calculation of U31, we used the MATLAB-based MES toolbox (REF: PMID: PMID: 22082031). Asterisks (*) represent a statistical significance (p < 0.05).
Spine density
Statistical comparison was made pairwise using the Mann-Whitney-U-test in GraphPad Prism 6.0f. Asterisks (*) represent a statistical significance (p < 0.05).
Cognitive performance
The comparison for the significance for all groups was a one-way ANOVA performed with Bonferroni’s post-hoc multiple comparisons test in GraphPad Prism 6.0f. Results are shown as (mean±SEM). All statistical comparisons were made pair wise using the Student’s t-test. Asterisks (*) represent a statistical significance (p < 0.05).
We based our sample size analysis on previously reported results using the same behavioral tests [44]. In this work, group sizes with n ∼10 were used. Further, the paper reports strong effects (g > 3) of the strain on the performance in the WCM test. Assuming that our effects between the strains may not be as strong, we defined our effect size for sample size calculation to be g = 1.5. We calculated the sample size with g*Power using following parameters: alpha error probability: 0.05; power: 0.8; allocation ratio: 1:1, and effect size: 1.5 for a Mann Whitney U test. This resulted in a required group size of a minimum of n = 9. For further analysis, the quantification of Aβ levels and plaque load has been conducted exclusively with brain tissue harvested from those animals tested in the WCM.
RESULTS
Xenon decreased aggregation of Aβ1–42 to toxic oligomers
In the absence of MgCl2 200 nM Aβ1–42 did not aggregate and fluorescein-Aβ1–42 was not in the vicinity of Tb3 +-Aβ. Therefore, almost no emission at 520 nm occurred after excitation at 340 nm, and the ratio 520 nm/490 nm was small. In the presence of 113 mM MgCl2 small Aβ1–42 oligomers were formed, Tb3 +-and fluorescein-Aβ were in close proximity, and TR-FRET could occur with increased emission at 520 nm and higher 520 nm/490 nm ratios.
TR-FRET assays revealed that 2%isoflurane and 4%sevoflurane did not affect continuous aggregation properties of Aβ1–42 (Fig. 3). Furthermore, 65%xenon instead directly prevented early protein/protein interactions between monomeric Aβ1–42 and significantly (p < 0.05) inhibited the formation to higher Aβ aggregates when compared to control, isoflurane, and sevoflurane. Increasing the Mg2 + concentration up to 170,5 mM accelerated the aggregation. Here we show that the anesthetics tested did not accelerate Aβ aggregation per se. Xenon in contrast, similar to an aggregation inhibitor rather lowers Aβ1–42 oligomerization.
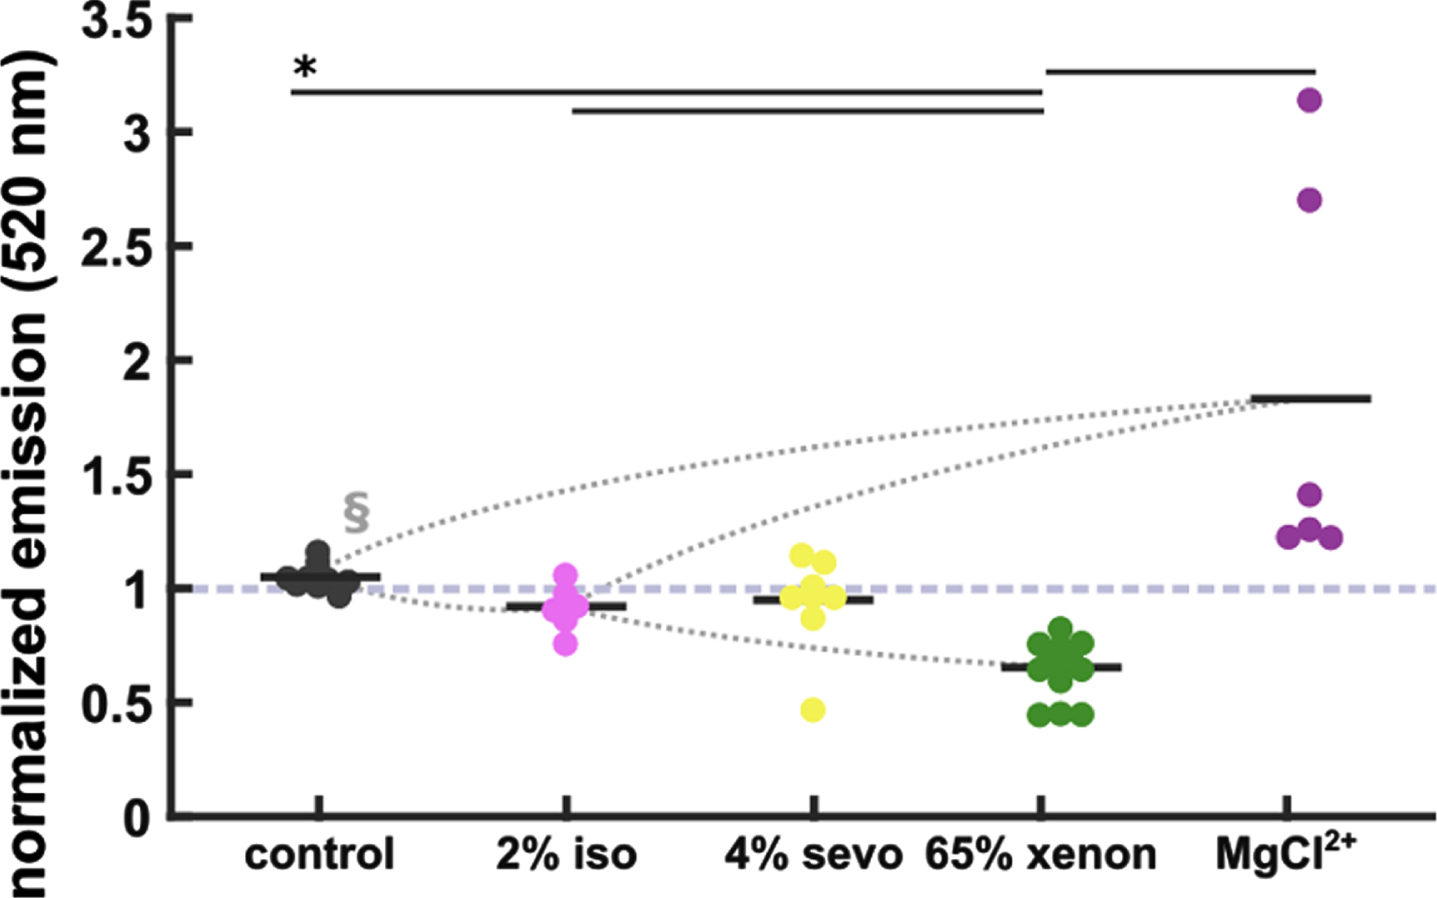
Xenon reduces Aβ aggregation. No significant reduction of Aβ aggregation in the 2%isoflurane (iso)- and 4%sevoflurane (sevo) groups when compared to control (control: 1.04±0.002, n = 9; 2%iso: 0.91±0.04, n = 6; 4%sevo: 0.96±0.07, n = 8). 65%xenon reduced Aβ aggregation significantly (0.64±0.03, n = 13) when compared to control and iso/sevo groups. Elevated MgCl2 + (170.5 mM) accelerated aggregation (1.33±0.27, n = 6). Statistics: Black horizontal bars below the * indicate a significant difference (p < 0.05 corrected) between the groups as derived by the Dunn-Sidak post-hoc analysis. The curved dotted lines indicate very strong (AUC > 0.9, §) effects as indicated by AUC and 10k-fold bootstrapped 95%confidence intervals (CI).
No significant effects of anesthetics on Aβ1–42-aggregation using silver staining
After gel-electrophoresis and staining of the gels with silver nitrate, Aβ1–42 proteins (100μM) were visible as dark bands of monomers (4 kDa), trimers (15 kDa), and tetramers (20 kDa). Higher oligomers (25 kDa –260 kDa) were not visible as bands but as smears of protein (Fig. 4A-F). The aggregation properties (represented as the relative staining intensities of the protein bands) after 0 min, 90 min, and 6 h incubation did not differ significantly from each other. The staining intensity of the protein bands decreased the longer the proteins were incubated in aCSF. Especially after 3 d and 7 d incubation, Aβ protein numbers of monomers, trimers and tetramers decreased significantly (data on trimers and tetramers not shown). The number of oligomers remained at a steady level. We did not find significant differences in staining intensity of monomers, trimers, tetramers and higher oligomers between control Aβ1–42 peptides and Aβ1–42 probes treated with either 65%xenon, 2%sevoflurane or 1%isoflurane before separation of the proteins through electrophoresis (Fig. 4A-F).
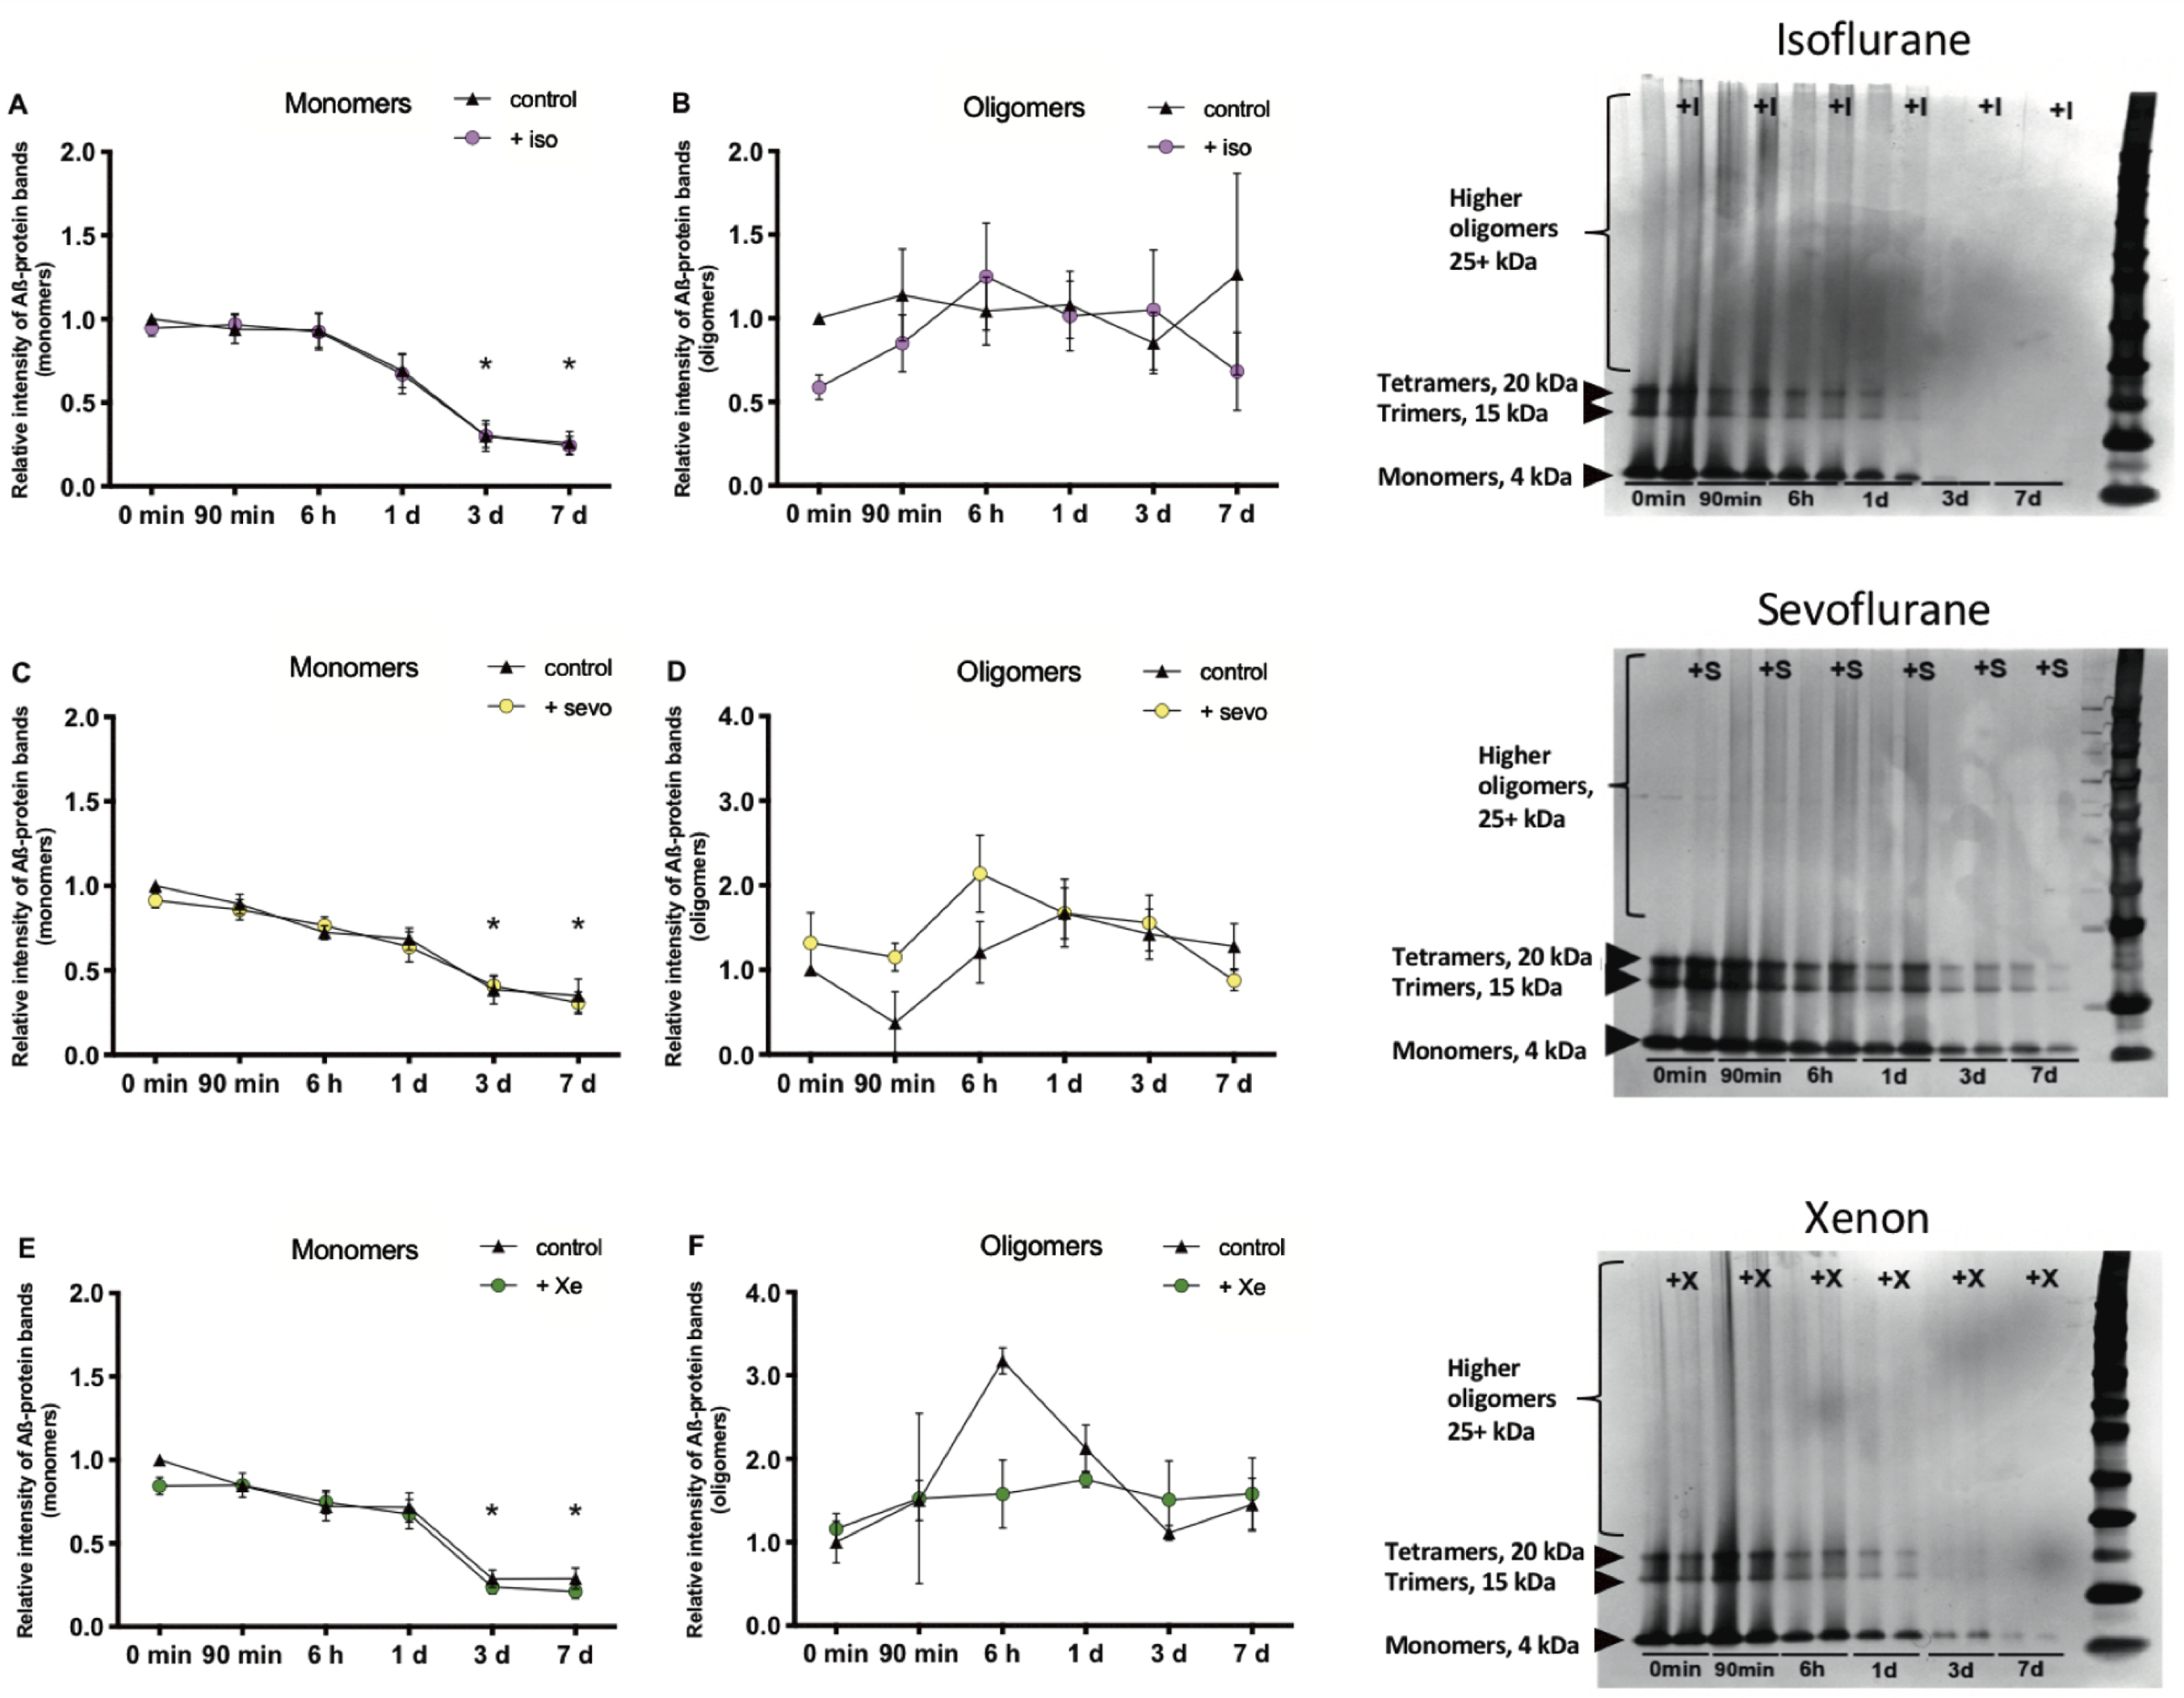
Isoflurane, sevoflurane and xenon do not influence Aβ1–42 aggregation. Isoflurane (iso) (n = 7): A) The number (nb) of monomers (4 kDa) decreased the longer the probes were incubated. After 3 d (control (cont): p = 0.0020, iso: p = 0.0059) and 7 d (cont: p = 0.0009, iso: p = 0.0037), the nb decreased significantly compared to the 0 min-control. B) Oligomers (25 + kDa) did not change significantly over time.
It should be noted that these experiments were hampered by the technical need to use very high concentrations of Aβ1–42 (100μM) and, according to the LTP experiments (see below) the resulting stoichiometric requirement (∼2*103:1 xenon: Aβ) to use even higher concentrations of xenon are physically not achievable.
Similar to the TR-FRET experiments, none of the anesthetics produces an acceleration of Aβ1–42 aggregation also after long-term incubation.
Effects of different Aβ species combined with anesthetics on neuronal activity in the hippocampus
Control experiments showed that monitoring for 4 h and longer did not affect the quality of neuronal signal propagation in the hippocampus of WT mice and VSDI was not accompanied by run-down. We pre-incubated the hippocampal slice with different isoforms of Aβ (50 nM) before applying the respective anesthetics. We were also interested in the analysis of neuronal activity after washout of anesthetics. Except for Aβ1–40 (p = 0.0049), the different Aβ isoforms did not per se affect FDS propagation in the CA1 region (Fig. 5). In anesthetic control experiments, FDSAUC in the CA1 region decreased significantly during application of anesthetics (iso: p = 0.0006; sevo: p = < 0.0001; xe: p = 0.0382). After washout of the gases for 60 min, FDS recovered back to baseline levels (Fig. 6). The combined application of either Aβ1–42, Aβ1–40, AβpE3, or 3NTyrAβ together with either 1%isoflurane, 2%sevoflurane, or 65%xenon reduced FDS of the CA1 region in a similar fashion as when gases were applied alone (Fig. 7). However, when slices were treated with either Aβ1–42, Aβ1–40, AβpE3 plus 1%isoflurane, or 2%sevoflurane FDS did not recover to baseline/control levels after washout of the gases for 60 min (Fig. 7A1, A2, B1, B2, C1, C2). Similar, in combination with Aβ1–42 or 3NTyrAβ, 65%xenon reduced FDS irreversibly (Fig. 7A3, D3), even after washout for 2-3 h (data not shown).
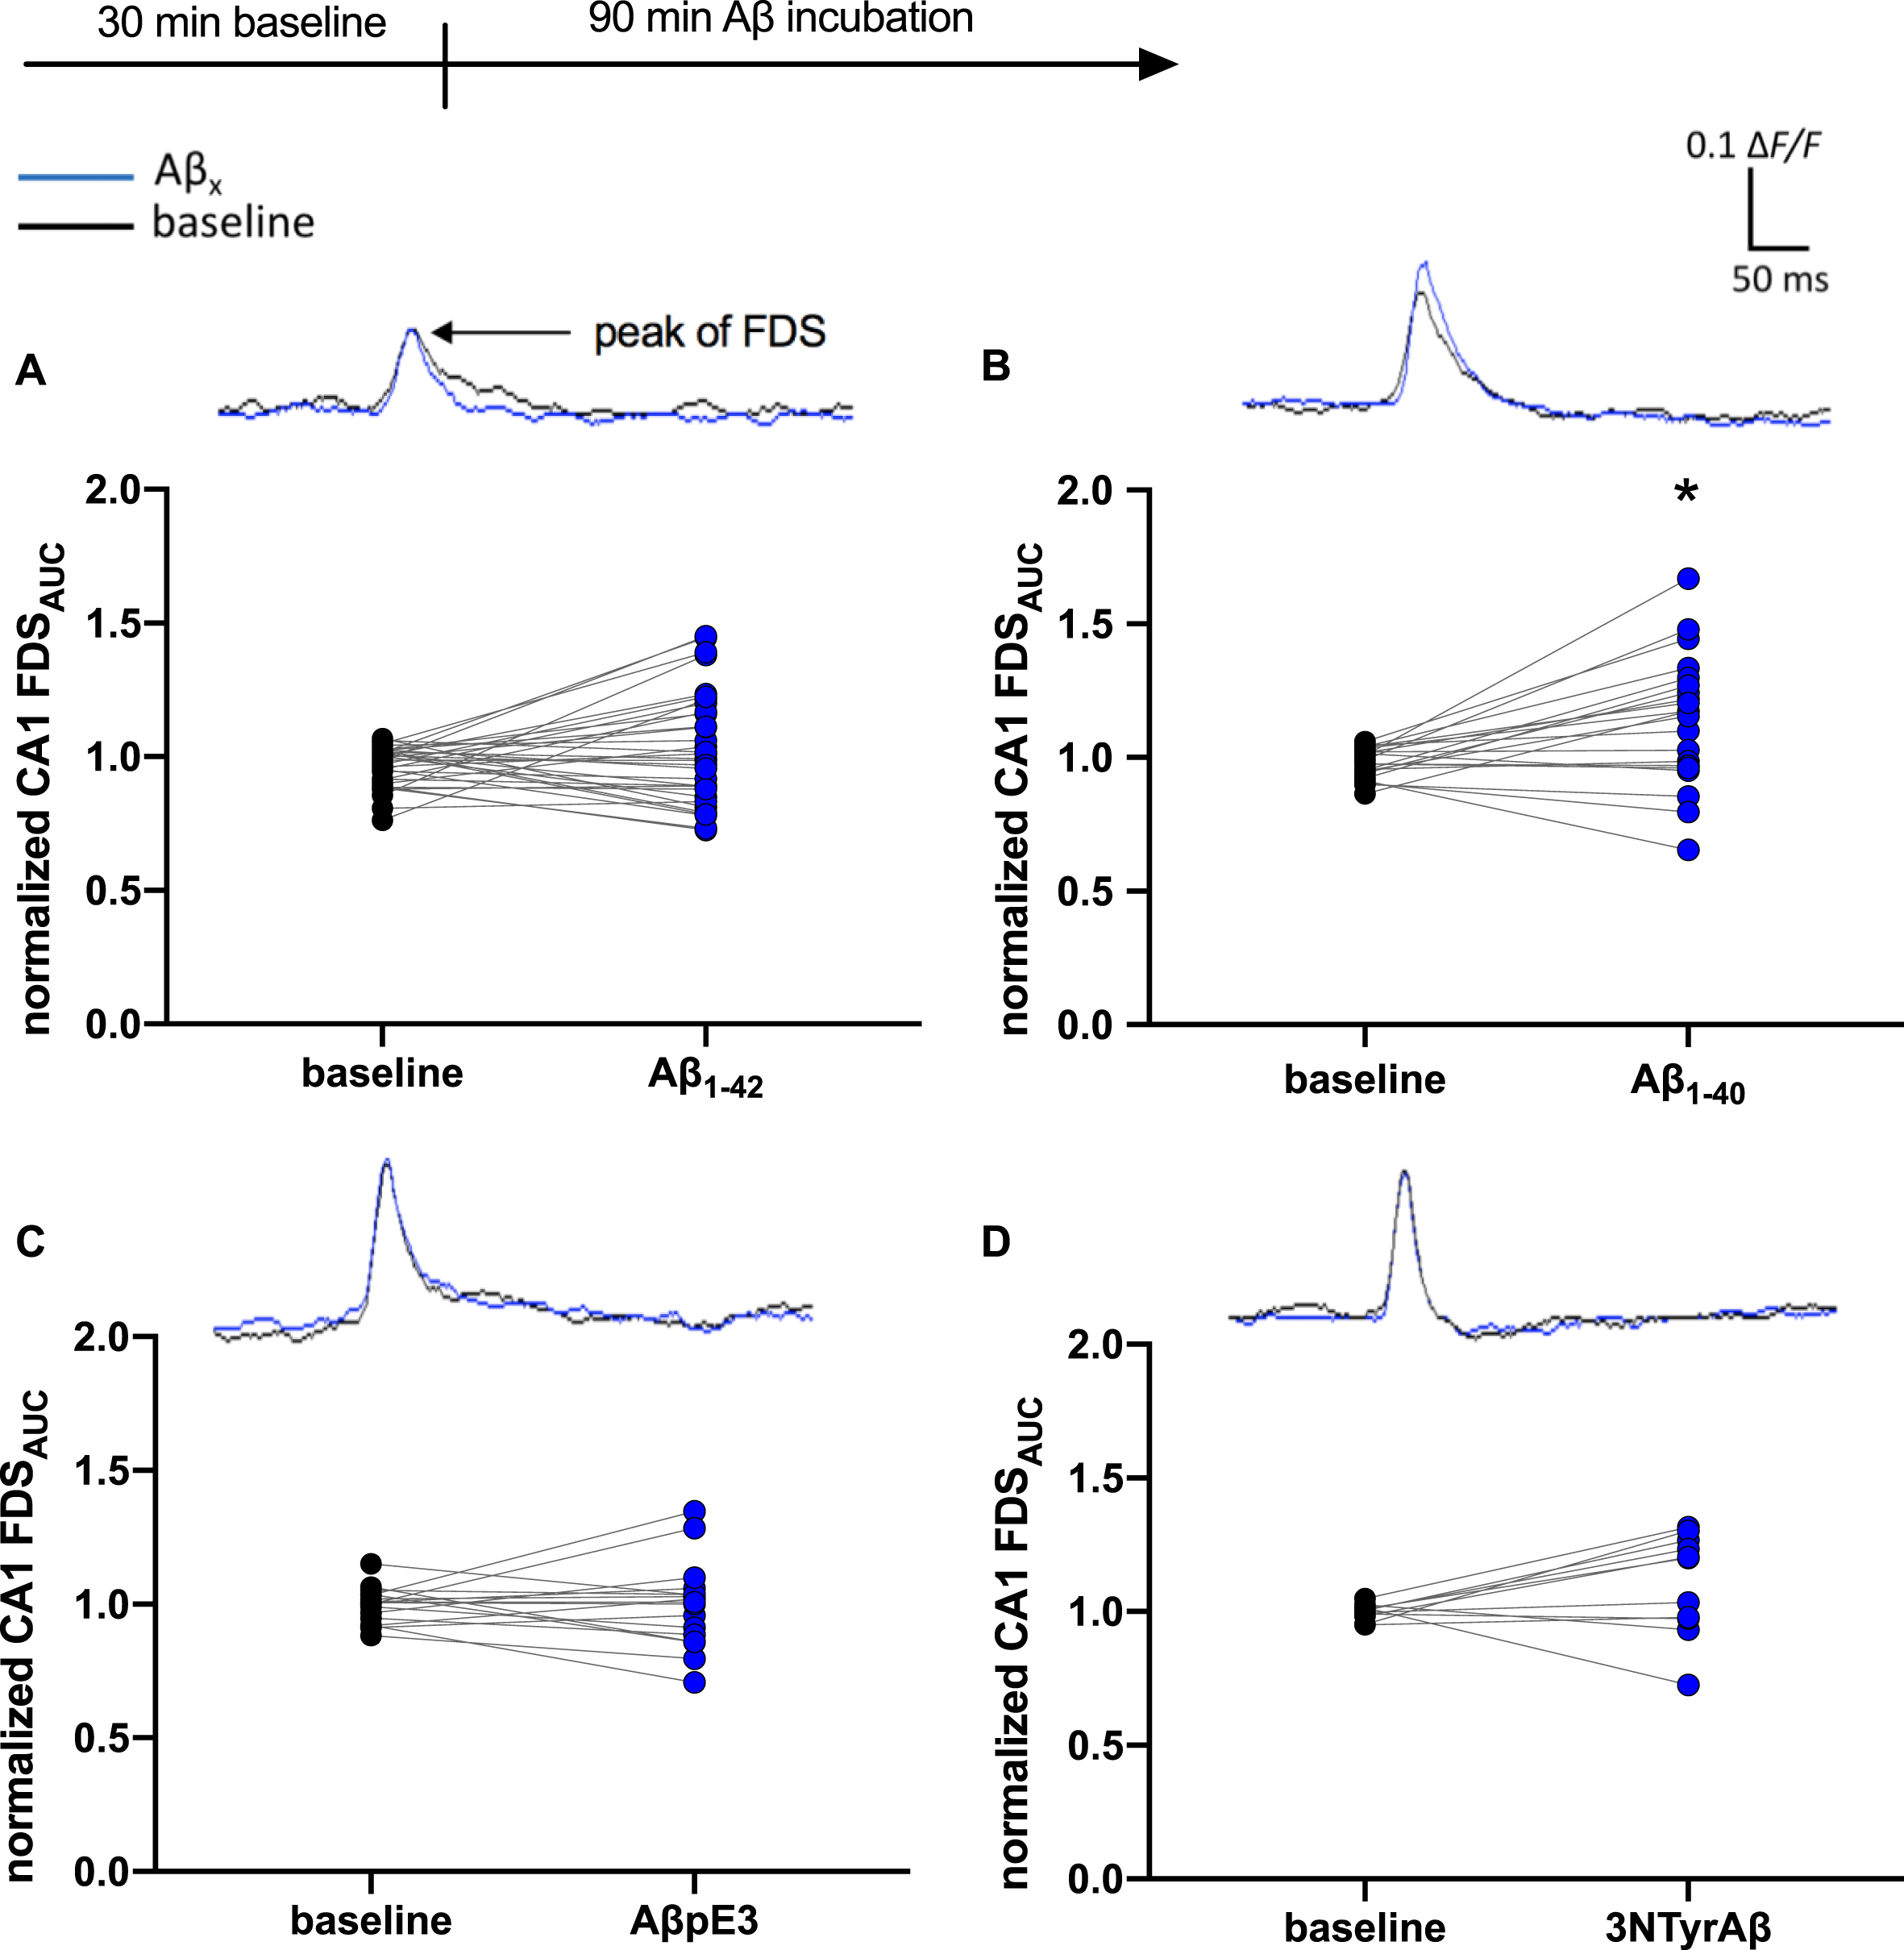
Aβ1–40, but no other Aβ species, changed neuronal activity in the CA1 region. Baseline (bl) measurements indicate control conditions (black circles). The incubation of Aβ1–40 for 90 min changed neuronal activity in the CA1 region of the hippocampus represented here as the normalized FDSAUC (ΔF/F) of the VSDI signal significantly (B: (mean±SEM) bl: 0.97±0.01, Aβ1–40: 1.17±0.05; p = 0.0049, n = 21). No change of FDSAUC through incubation with Aβ1–42 (A: bl: 0.99±0.01, Aβ1–42: 1.00±0.04; p = 0.19, n = 34), AβpE3 (C: bl: 1.00±0.01, AβpE3:1.00±0.03; p = 0.75, n = 17) and 3NTyrAβ (D: bl: 1.00±0.01, 3NTyrAβ: 1.20±0.06; p = 0.12, n = 11). Representative VSDI recording traces represent the time courses of the average of ΔF/F values within the CA1 region before and after treatment with different Aβ species.
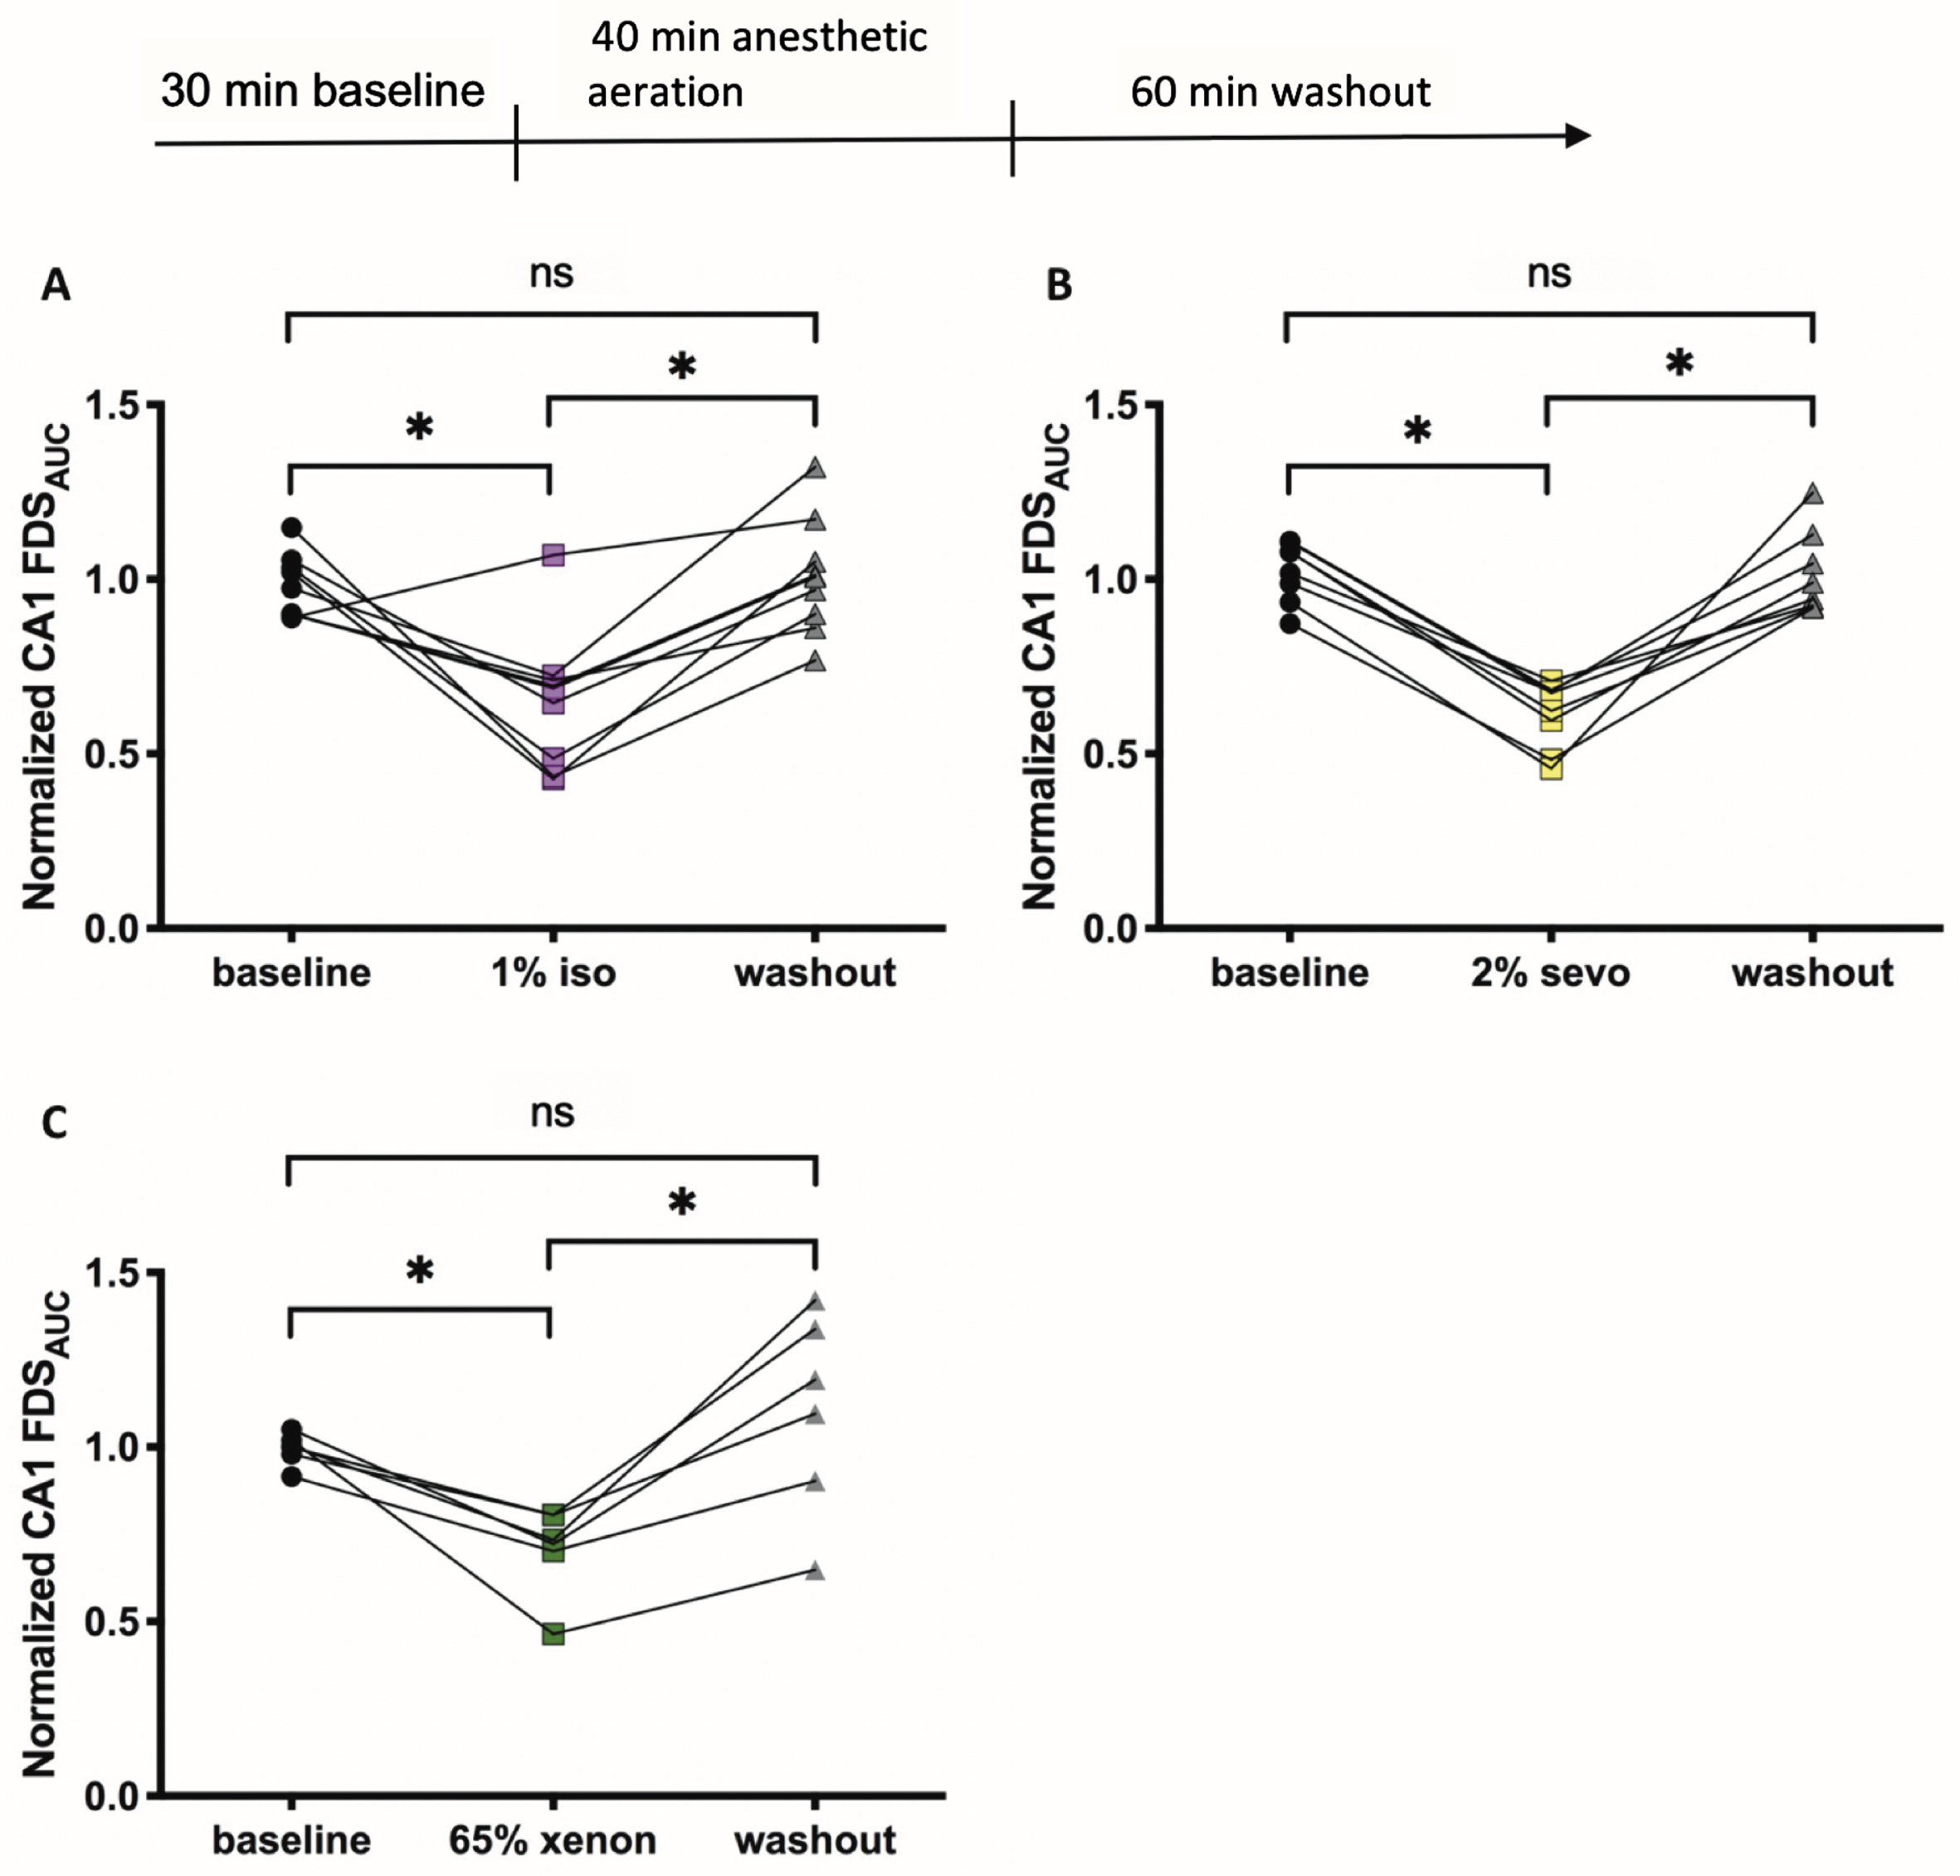
Effects of anesthetics on neuronal activity in the hippocampus. A) 1%isoflurane (iso) decreased neuronal activity represented here as the normalized FDSAUC (ΔF/F) of the VSDI-signal in the CA1 region significantly (baseline: 0.97±0.03, 1%iso: 0.69±0.06, p = 0.0006; n = 8). The activity recovered back to baseline (bl) levels after a washout (wo) of 60 min (wo: 1.01±0.05; p = > 0.9999, n = 8). B) 2%sevoflurane (sevo) decreased neuronal activity significantly (bl: 1.05±0.03, 2%sevo: 0.65±0.03; p = < 0.0001, n = 8). The activity recovered back to baseline levels after a washout of 60 min (wo: 0.97±0.04; p = > 0.9999, n = 8). C) 65%xenon decreased neuronal activity significantly (bl: 1.00±0.02, 65%xenon: 0.73±0.05; p = 0.0382, n = 6). The activity recovered back to baseline levels after a washout of 60 min (wo: 1.14±0.12; p = 0.5879, n = 6). Recording traces can be found in the supplementary material (Supplementary Figure 1).
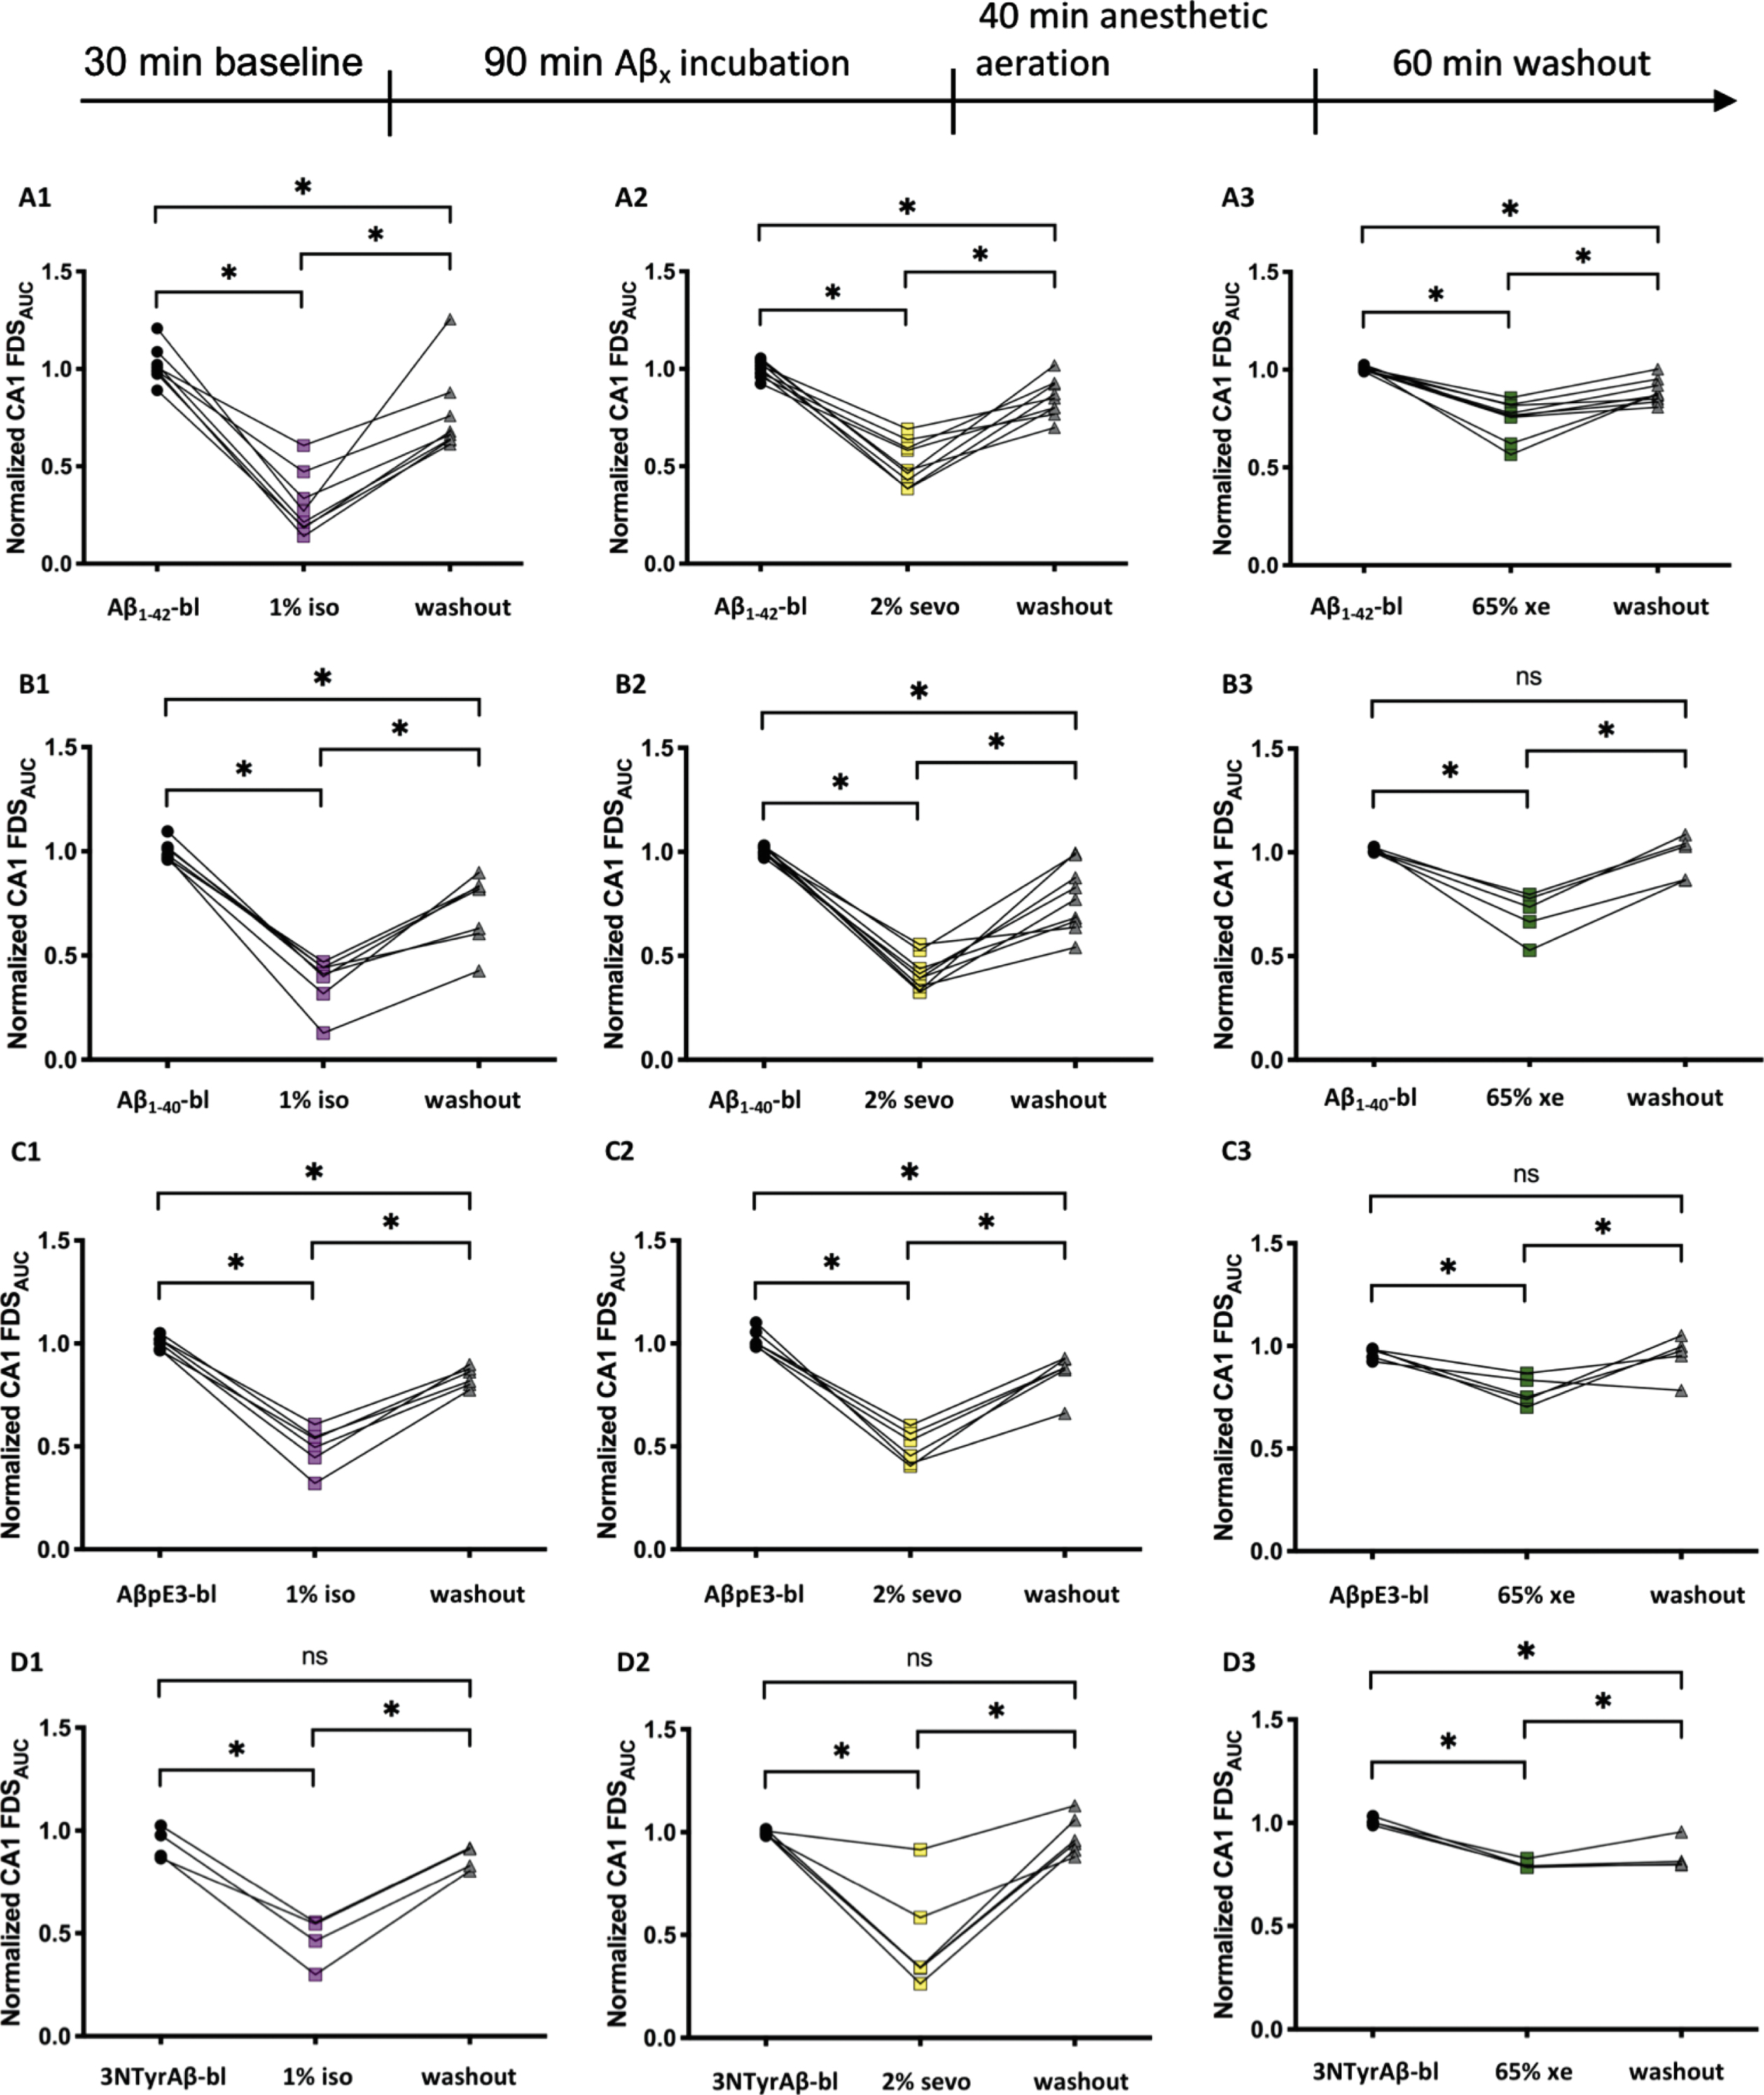
After removal of anesthetics, neuronal activity tends not to fully recover in the presence of Aβ isoforms. A1-A3) 1%isoflurane (iso), 2%sevoflurane (sevo) and 65%xenon (xe) decreased neuronal activity in the presence of Aβ1–42 significantly (A1: Aβ1–42-bl: 1.00±0.03, 1%iso: 0.24±0.06; p = < 0.0001, n = 8; A2: Aβ1–42-bl: 1.00±0.01, 2%sevo: 0.48±0.04; p = < 0.0001, n = 9; A3: Aβ1–42-bl: 1.00±0.004, 65%xe: 0.77±0.03; p = < 0.0001, n = 9). The activity did not recover back to Aβ1–42-bl-levels after a washout (wo) of 60 min (A1: wo: 0.67±0.08; p = 0.0165, n = 8; A2: wo: 0.85±0.03; p = 0.0054, n = 9; A3: wo: 0.87±0.02; p = 0.0025, n = 9). B1-B3) 1%iso, 2%sevo and 65%xe decreased neuronal activity in the presence of Aβ1–40 significantly (B1: Aβ1–40-bl: 0.98±0.02, 1%iso: 0.41±0.04; p = < 0.0001, n = 7; B2: Aβ1–40-bl: 1.00±0.007, 2%sevo: 0.39±0.03; p = < 0.0001, n = 9; B3: Aβ1–40-bl: 1.00±0.006, 65%xenon: 0.74±0.05; p = 0.0003, n = 5). Activity of B1 and B2 did not recover back to Aβ1–40-bl-levels after a wo of 60 min (B1: wo: 0.82±0.06; p = 0.0014, n = 7; B2: wo: 0.77±0.05; p = 0.0003, n = 9; B3: wo: 1.03±0.05; p = 0.0330, n = 5). C1-C3) 1%iso, 2%sevo and 65%xe decreased neuronal activity in the presence of AβpE3 significantly (C1: AβpE3-bl: 1.00±0.01, 1%iso: 052±0.04; p = < 0.0001, n = 6; C2: AβpE3-bl: 1.00±0.02, 2%sevo: 0.49±0.03; p = < 0.0001, n = 6; C3: AβpE3-bl: 0.98±0.01, 65%xenon: 0.75±0.03; p = 0.0048, n = 5). Here, only the activity of group C3 recovered back to AβpE3-bl-levels after a wo of 60 min (C1: WO: 0.84±0.02; p = 0.0017, n = 6; C2: wo: 0.88±0.04; p = 0.0079, n = 6; C3: wo: 0.97±0.045; p = > 0.9999, n = 5). D1-D3) 1%iso, 2%sevo and 65%xe decreased neuronal activity in the presence of 3NTyrAβ significantly (D1:3NTyrAβ-bl: 0.93±0.04, 1%iso: 0.5±0.06; p = 0.0400, n = 4; D2:3NTyrAβ-bl: 0.99±0.005, 2%sevo: 0.34±0.10; p = < 0.0001, n = 6; D3:3NTyrAβ-bl: 1.00±0.009, 65%xenon: 0.79±0.01; p = 0.0004, n = 4). The activity of D3 did not recover back to 3NTyrAβ-bl-levels after a wo of 60 min, D1 and D2 recovered (D1: wo: 0.87±0.03; p = > 0.9999, n = 4; D2: wo: 0.95±0.04; p = > 0.9999, n = 6; D3: wo: 0.81±0.04; p = 0.0023, n = 4). Recording traces can be found in the supplementary material (Supplementary Figure 2).
Interestingly, incubation with either Aβ isoform did not change neuronal activity per se. However, whereas neuronal activity recovered after removal of anesthetics when given alone, the additional application of Aβ affected neuronal signaling indicating residual changes in activity propagation.
Xenon restores pyroglutamate-Aβ but not nitrated-Aβ-induced synaptotoxic effects on LTP
Recently, we have shown that xenon prevents the synaptotoxic effects of Aβ1–42, but not Aβ1–40 on LTP [49]. Post-translational modified Aβ, such as AβpE3 (50 nM) and 3NTyrAβ (50 nM) effectively blocks LTP [31]. In the present study, we wanted to know how xenon affects the AβpE3 (50 nM)- and 3NTyrAβ (50 nM)-mediated impairment of LTP. After pre-incubation of slices with either Aβ-species for 90 min, hippocampal CA1-LTP was blocked significantly (AβpE3: p = 0.0312; 3NTyrAβ: p = 0.0156; Fig. 8A, B). The application of 30%xenon for 40 min directly after incubation of Aβ partially reversed the neurotoxic effects of AβpE3 (p = 0.0312), but not 3NTyrAβ on LTP (p = 0.4285; Fig. 9A, B). Xenon, applied at 30%did not affect LTP per se [49] and was confirmed also in the present study (see Fig. 9C). Figure 9C summarizes the xenon-induced rescue of the detrimental effect of the different Aβ species on LTP. For comparison, we included also the effects of Aβ1–40 and Aβ1–42 taken from [49] and summarized the total Aβ-mediated effect of all species against LTP.
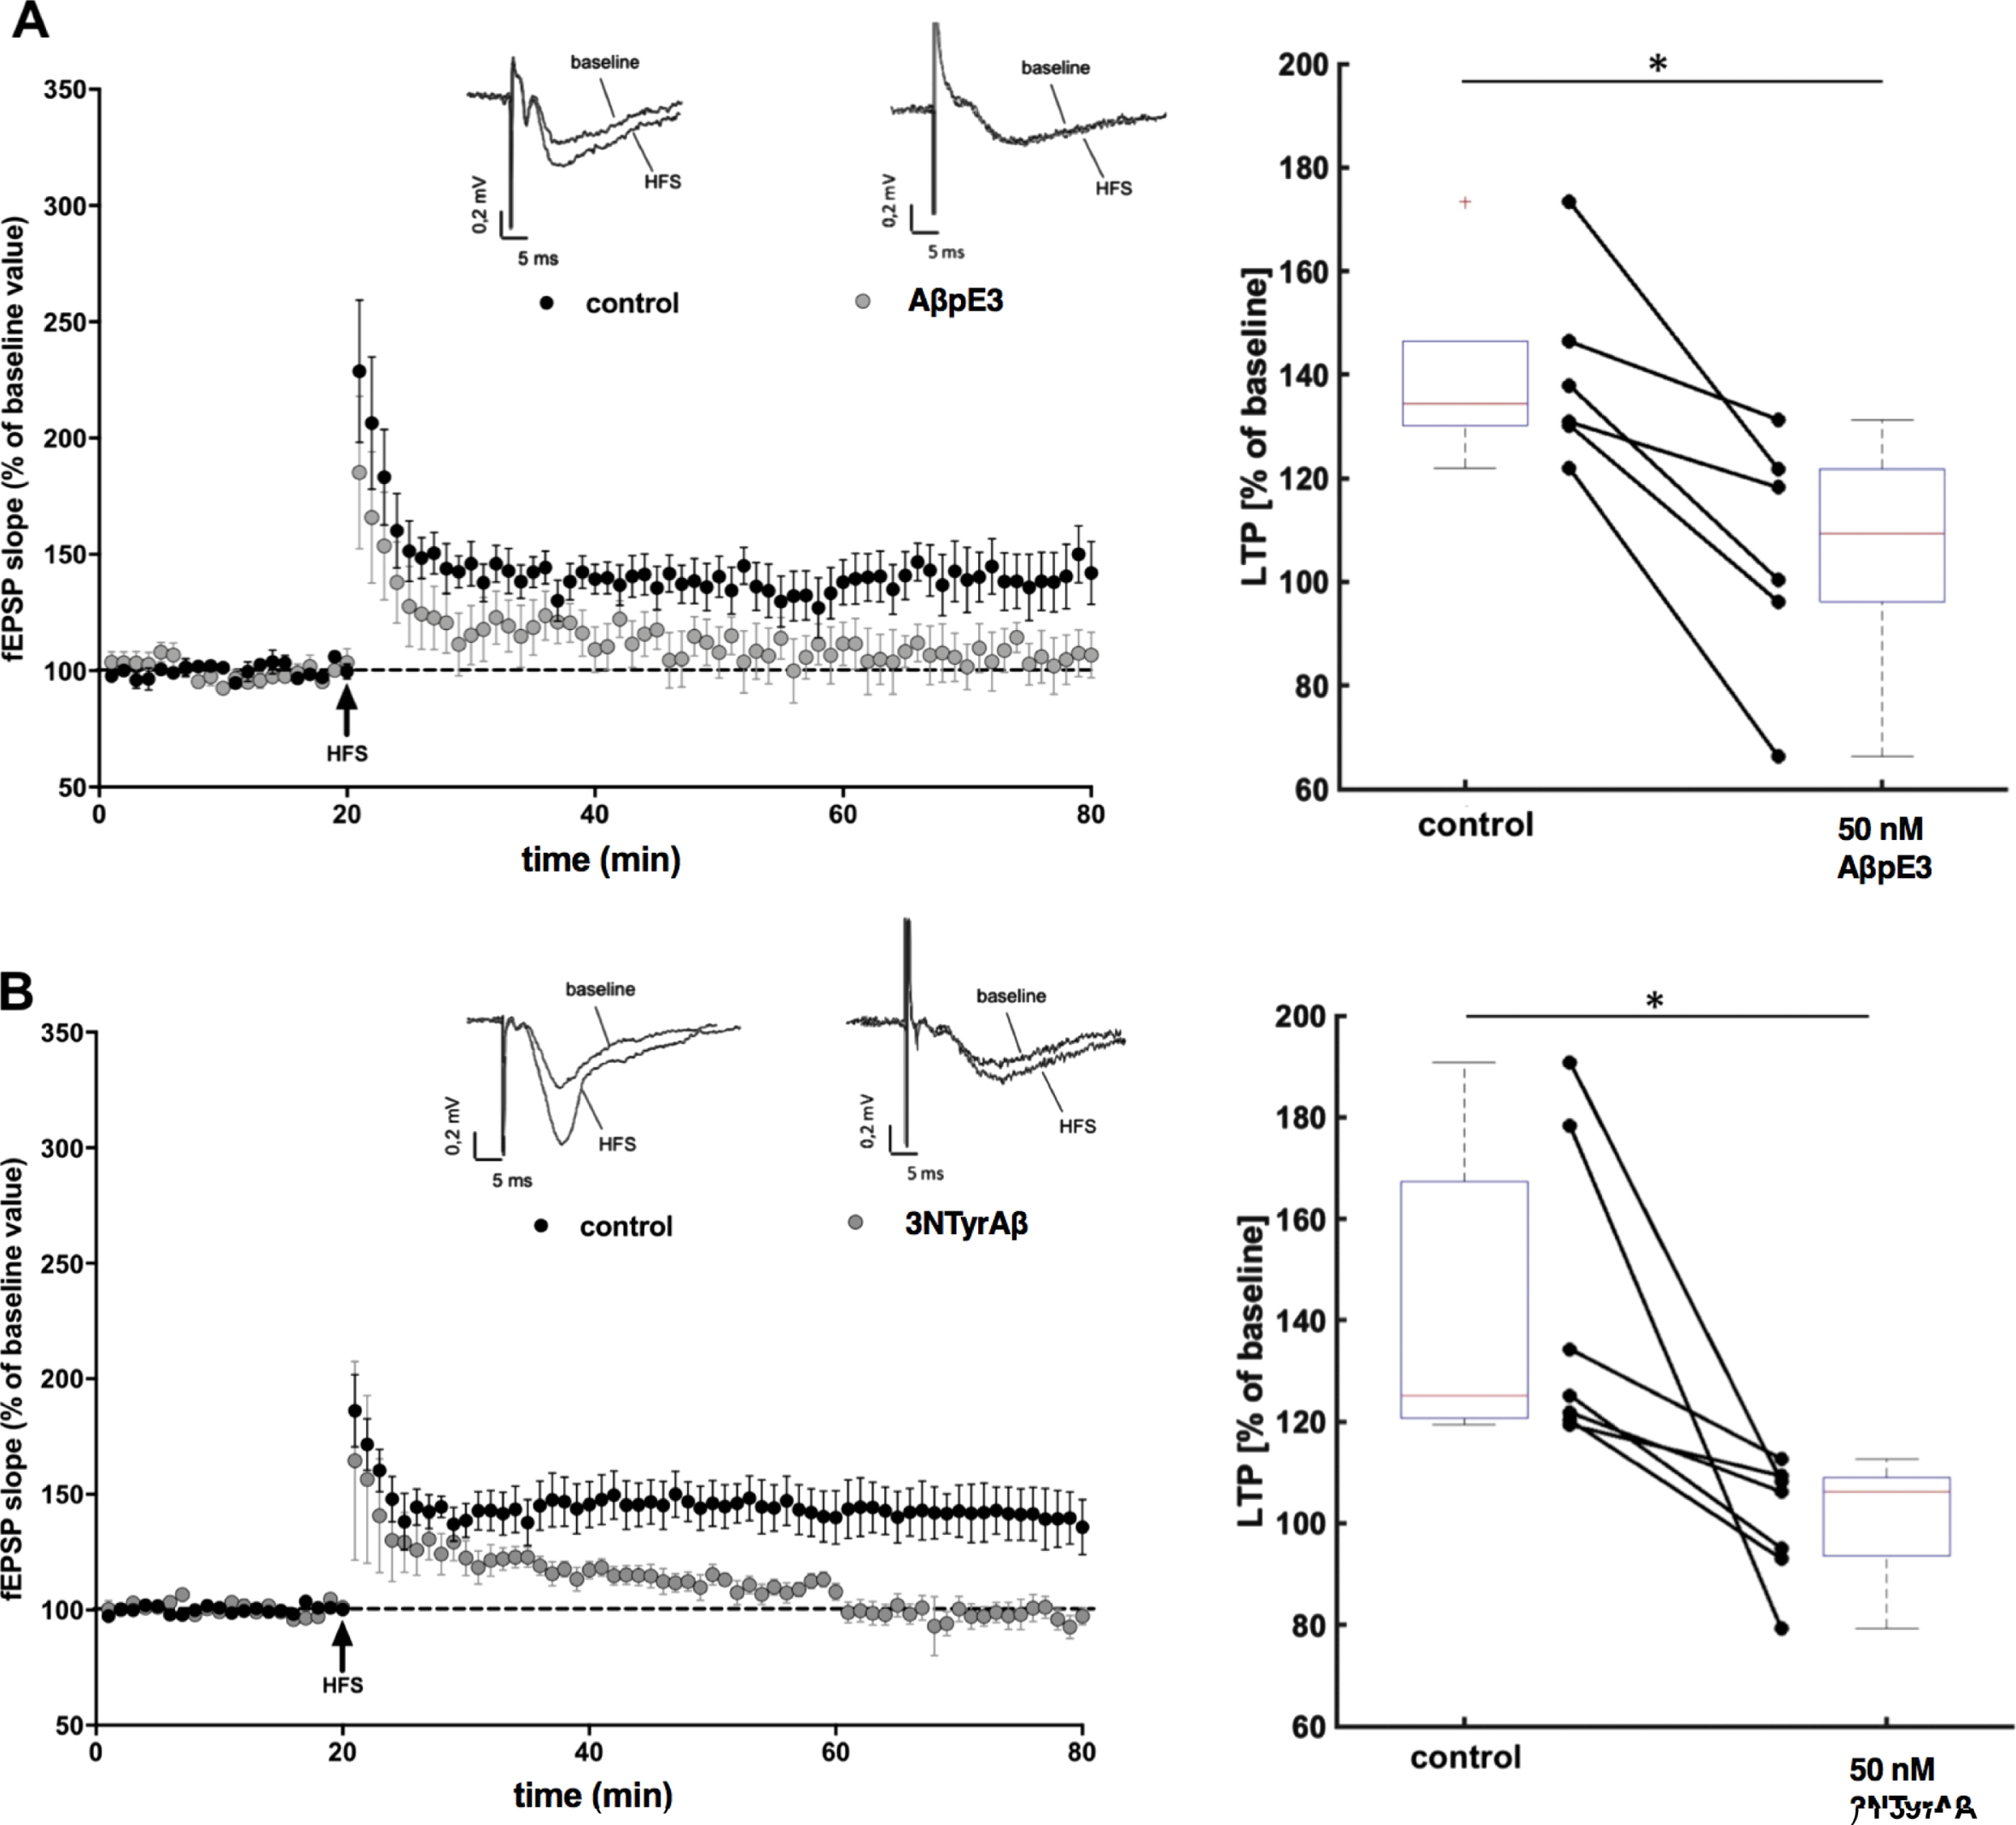
Pyroglutamate-modified Aβ3–42 (AβpE3) and nitrated Aβ (3NTyrAβ) impair long term potentiation (LTP). A, B) Under control conditions (black circles) high frequency stimulation (HFS) induced LTP (n = 6). After incubation of AβpE3 (A; grey circles, n = 6) and 3NTyrAβ (B; grey circles, n = 7) for 90 min before HFS significantly reduced CA1-LTP. Each symbol represents the average field excitatory postsynaptic potential (fEPSP) slopes (mean±SEM) normalized to the 10 min baseline period before HFS induction at every minute. Insets above graphs show representative fEPSP traces before and after HFS. Box- and connected dot-plots on the right show the effects of AβpE3 and 3NTyrAβ 60 min after induction of HFS. AβpE3 significantly (p = 0.0312) reduced CA1-LTP from 134%[121%173%] (median, 1st and 3rd quartile) to 109%[66%131%]. 3NTyrAβ reduced CA1-LTP significantly (p = 0.0156) from [125%] [120%190%] to 106%[79%112%]. LTP was reduced in both experiments reflected by a very strong effect (U31 = 0 [0 0]).
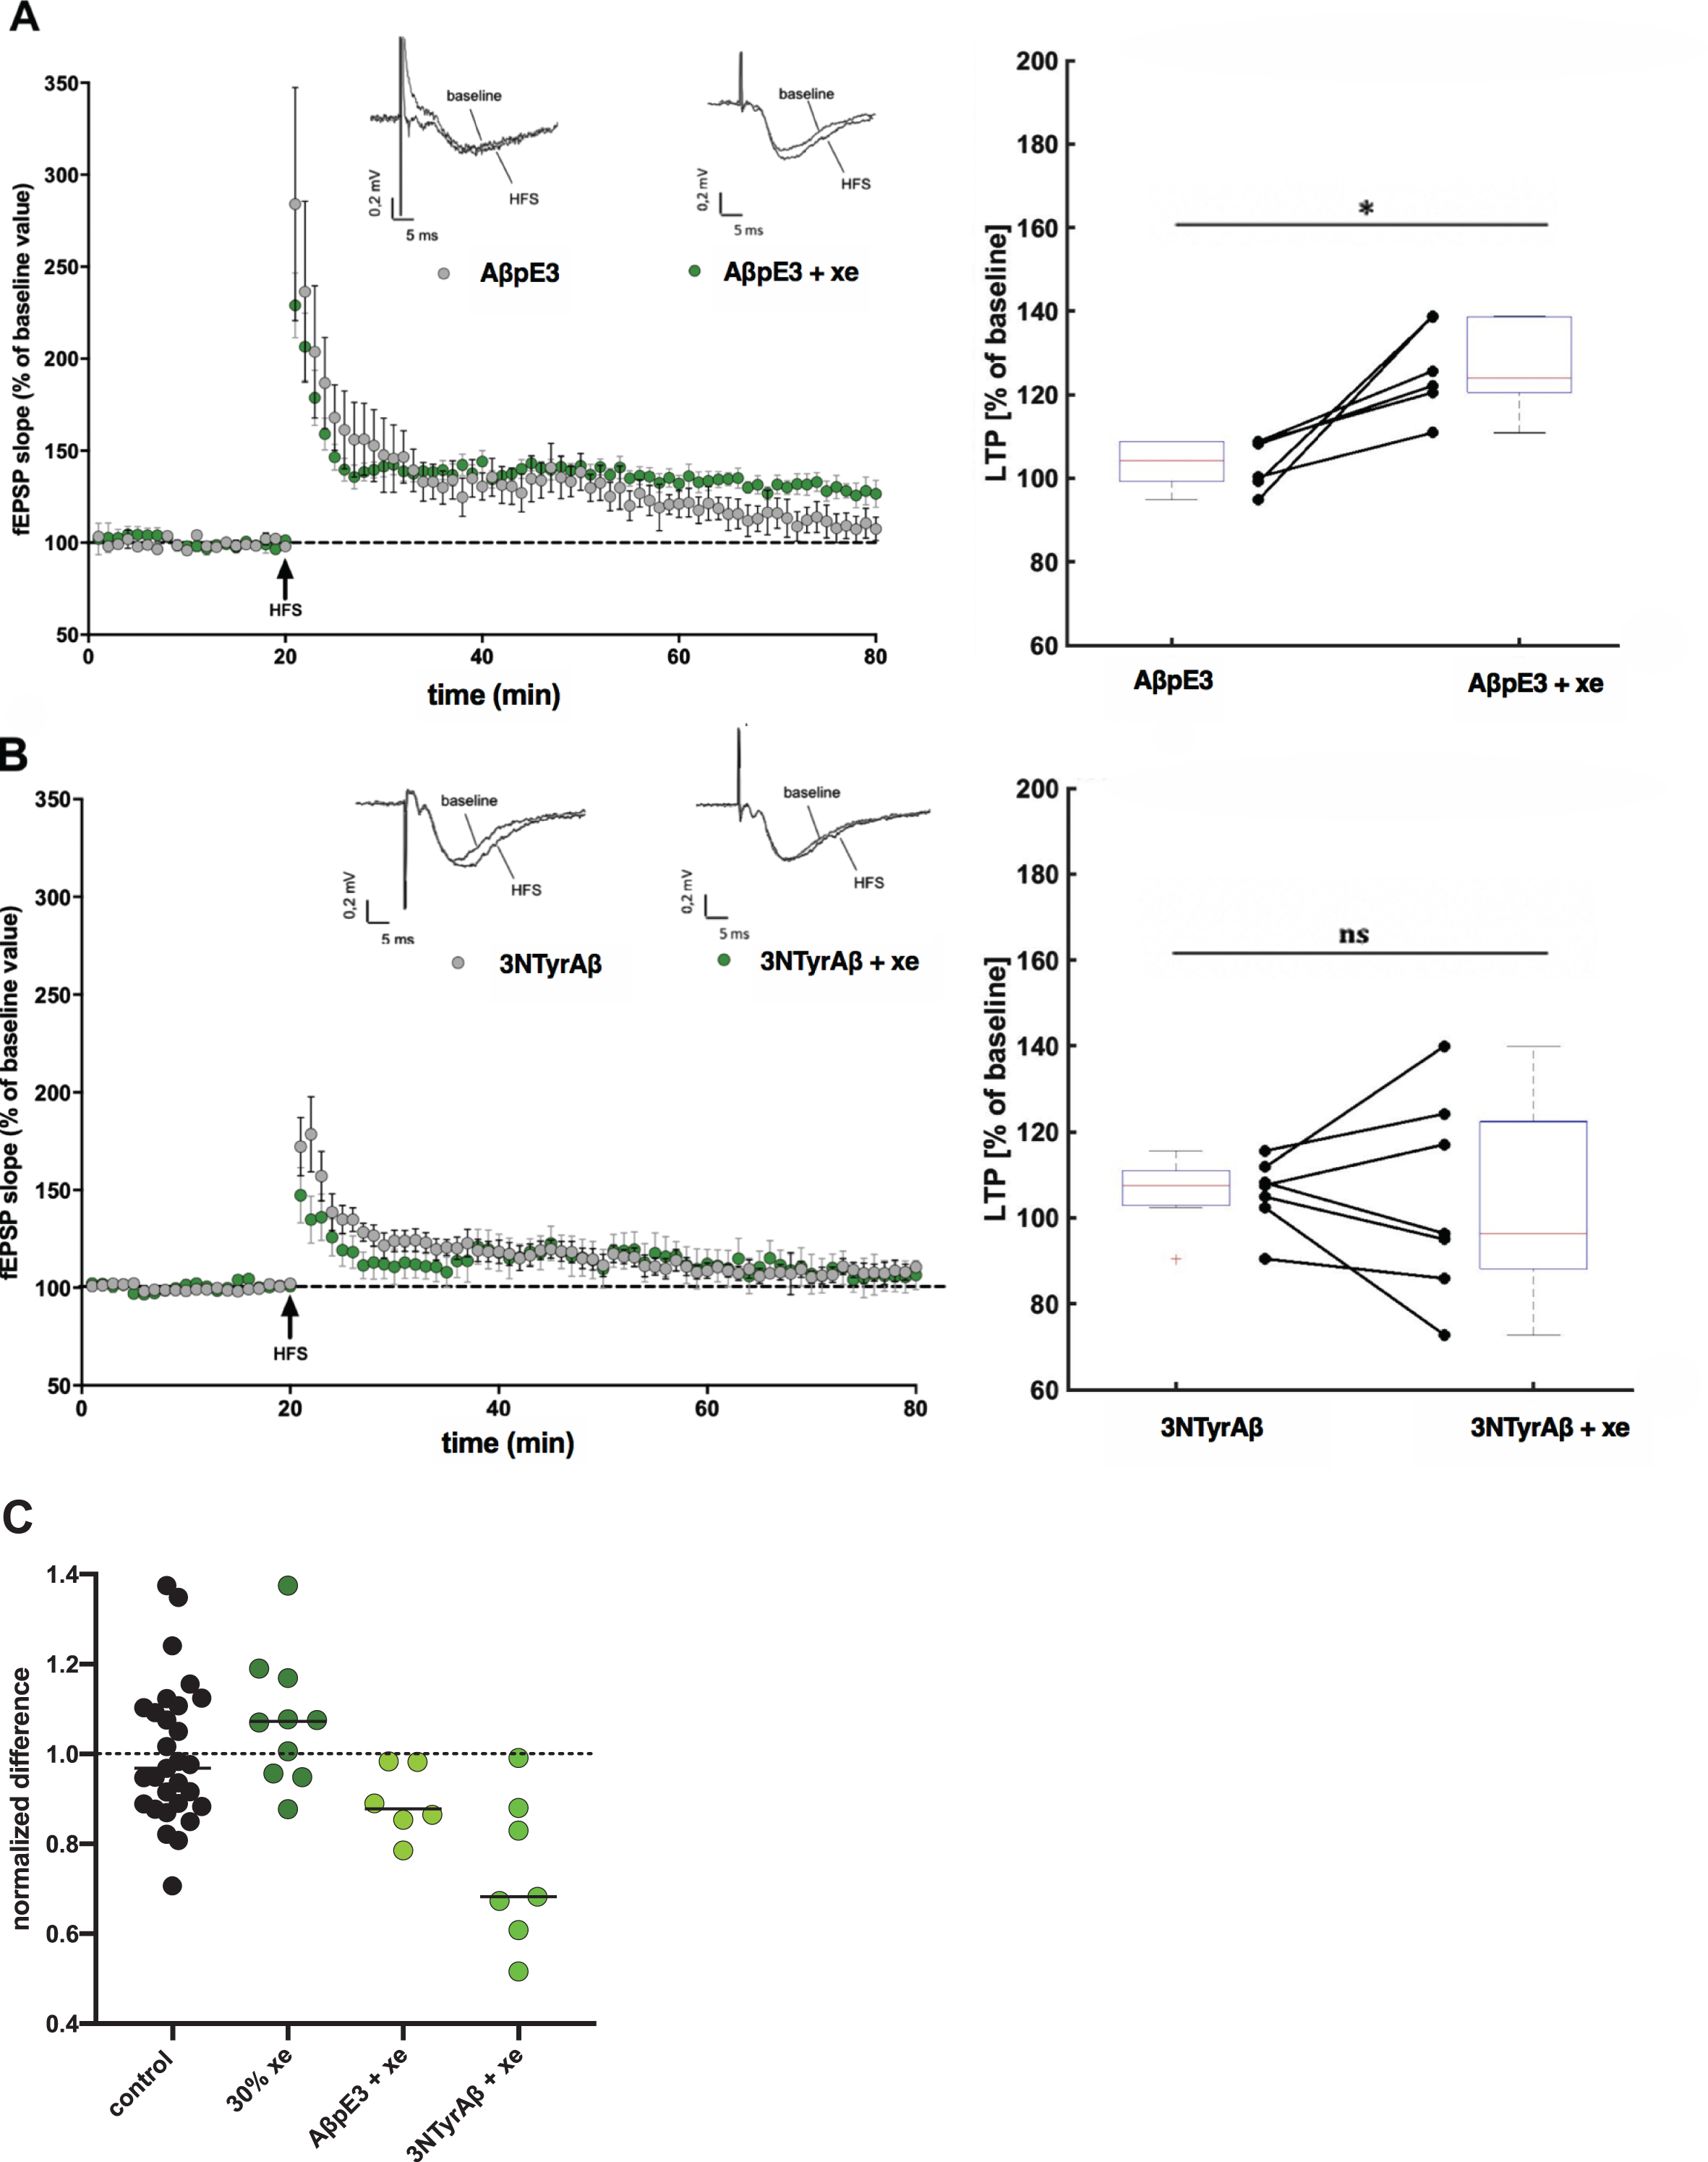
Application of 30%xenon restores AβpE3-induced but not 3NTyrAβ-induced LTP deficit. A) The application of AβpE3 (grey circles, n = 7, 104%[94%108%]) and B) 3NTyrAβ (grey circles, n = 7, 107%[90%115%]) for 90 min before high frequency stimulation (HFS) significantly reduced LTP. Each symbol represents the average field excitatory postsynaptic potential (fEPSP) slopes (mean±SEM) normalized to the 10 min baseline period before HFS induction at every minute. Insets above graphs show representative fEPSP traces before and after HFS. Box- and connected dot-plots on the right show that the LTP blockage induced by AβpE3 was significantly (p = 0.0312) restored after application of 30%xenon (xe) for 30 min to 124%[111%139%] (median, 1st and 3rd quartile; green circles), whereas 3NTyrAβ could not be restored (p = 0.4285, 96%[72%139%]; green circles). C) Normalized LTP rescue induced by xenon against different Aβ species. Shown are the effects of AβpE3 and 3NTyrAβ. Dotted line indicates normalized mean potentiation of fEPSPs after HFS and dashed line indicates the normalized mean detrimental effect of Aβ on LTP.
In this section, we could show that xenon exerts neuroprotection also against post-translational modified Aβ isoforms hypothesized as potential key participants in the pathology of AD due to their abundance in AD brain.
Xenon significantly reverse Aβ1–42-induced attenuation on spine density
Aβ1–42 has been reported to have higher tendency to aggregate than Aβ1–40, and has therefore been ascribed to be the main pathogenic form of Aβ. Consistent with [31], Aβ1–42 reduced spine density in the hippocampus of EGFP-mice significantly (p = 0.0275). The application of Aβ1–42 + 65%xenon reversed this effect and led to no significant difference compared to control. The number of spines even increased compared to control (p = 0.035, Fig. 10B). Even though not significant to control, 2%sevoflurane shows the tendency not being able to reverse the neurotoxic effect of Aβ1–42 (p = 0.1888; Fig. 10A). 1%isoflurane showed no significant effect.
In accordance with the LTP data, xenon reversed the synaptic toxicity of Aβ1–42 on spine density.
Cognitive performance
Without prior anesthesia, ArcAβ mice showed a weaker cognitive performance than WT mice. On average, WT mice learned the task successfully (> 83%of runs completed) on day 2, whereas ArcAβ mice learned the task significantly later on day 4 (p < 0.05, Fig. 11A). Next, we tested the accuracy after animals had undergone anesthesia. On the first testing day (T1, 1 d after anesthesia) and on the weekly testing afterwards (T2-T4), all non-anesthetized WT mice were able to complete the task (96–99%accuracy d7-T4, Fig. 11B). The anesthetized WT mice had a numerical, but not statistically significant decrease in the percentage of accuracy on testing days T1-T3 but all groups recovered on T4. The most pronounced but not significant attenuation of accuracy was shown for WT mice anesthetized with sevoflurane (mean = 4%, mean accuracy 94%on T2 and 86%on T3) and, for a lesser extent when anesthetized with desflurane (mean = 11%). WT mice anesthetized with xenon/sevoflurane (mean = 43%/3.1%) showed only a slight decrease of accuracy on T3, also rising to 100%on T4. These differences were not statistically significant. While in the WT control group the accuracy maintained at nearly 100%during the entire experiment, a slight decline occurred in non-anesthetized ArcAβ Tg mice on T3 (Fig. 11C). Similar as in the WT groups, Tg groups treated with sevoflurane and the Tg control group accomplished a near 100%of accuracy on T4. The ArcAβ mice anesthetized with sevoflurane had a decrease in accuracy on T2, with near 100%accuracy during the rest of the behavioral testing, while the Tg group treated with desflurane had a decrease from near 100%accuracy (T1) to a minimum of 92%(T2). Xenon applied to Tg mice attenuated accuracy to 94–95%over the entire testing time. All differences were not significant on a p < 0.05 level. We also analyzed the accuracy of WT and ArcAβ mice after anesthesia expressed as the percentage of accurate learners per day (data not shown). No differences were observed between all groups. This analysis indicates that the on the one hand the mutation affects the individual animals in a uniform way, on the other hand, anesthesia produces a high interindividual variability between the tested animals. Finally, we calculated the latency which defines spatial memory, stress load, motivation, locomotor skills and perception deficits. No differences were observable in all groups (data not shown).
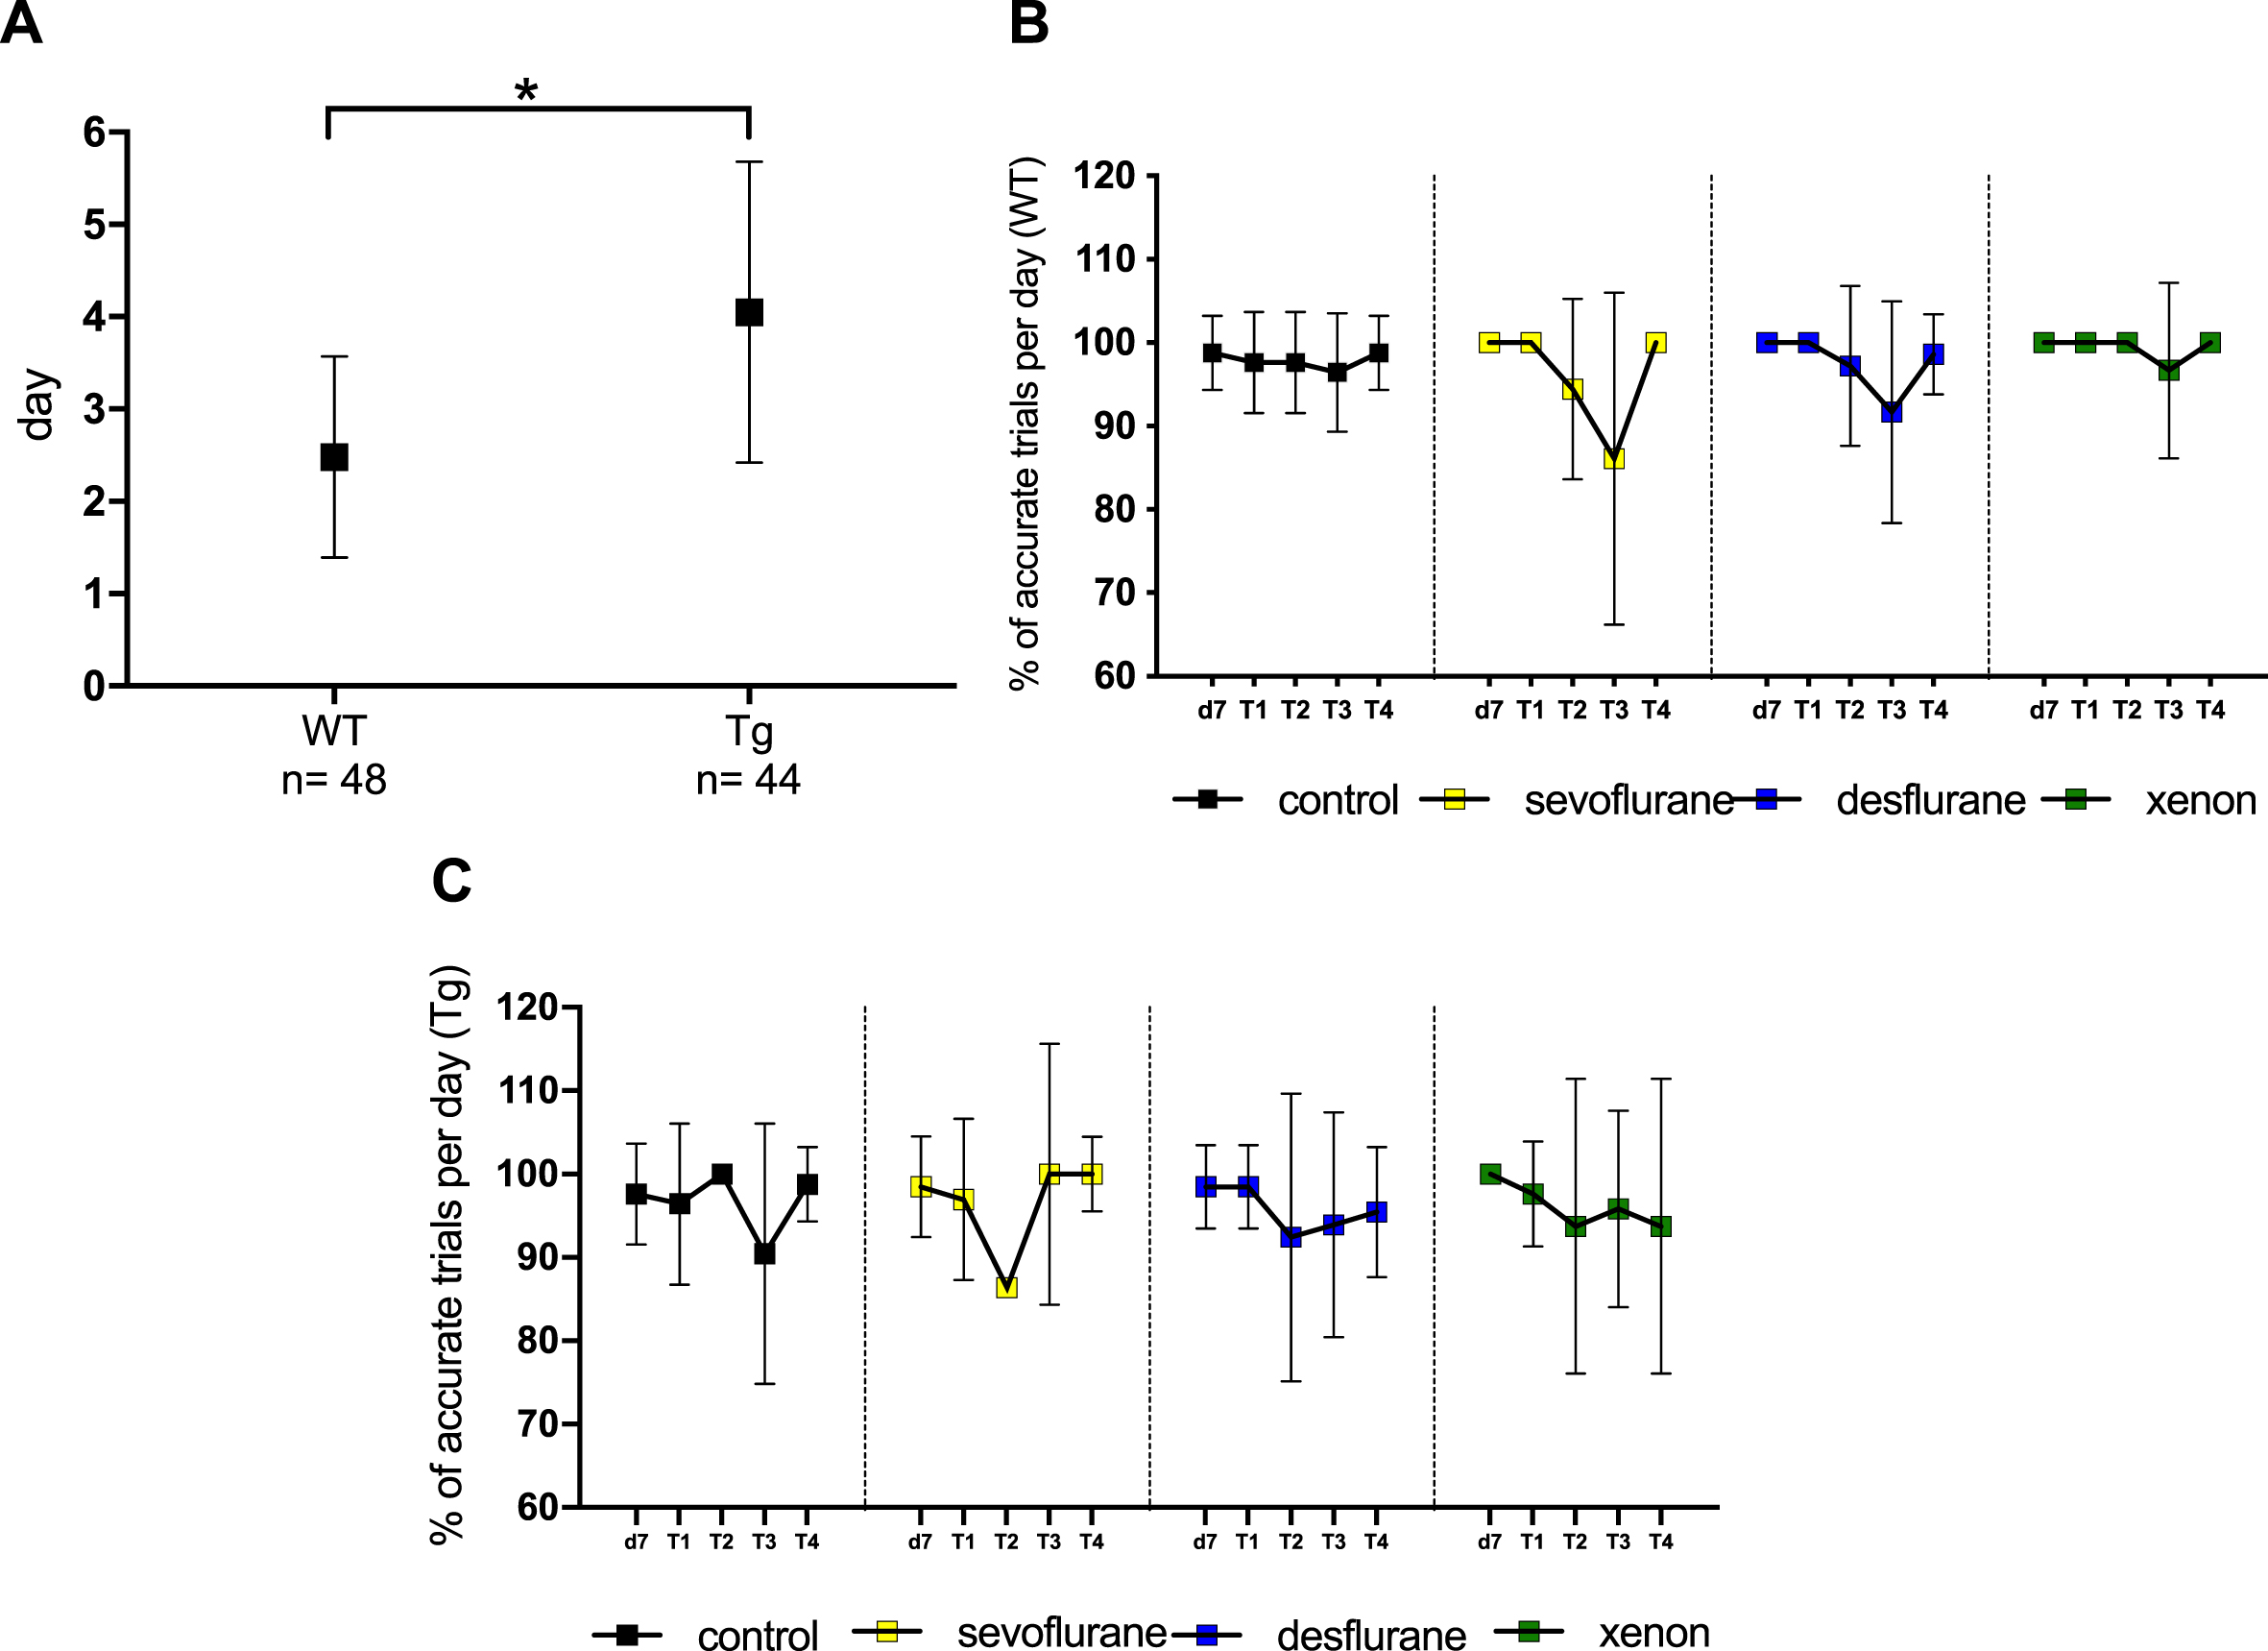
Cognitive performance is not altered when ArcAβ mice were anesthetized with different anesthetics. A) Comparison of the learning capacity of wildtype (WT) and transgenic (Tg) mice. Shown is the mean of the first day when mice learned to complete the task successfully (≥86%of runs completed). WT mice learned the task on average on day 2 (2.48), Tg mice significantly later on day 4 (4.05) (p≤0.001). B) Accuracy of WT mice treated with different anesthetics, expressed as the percentage of accurate trials on every trial performed per day (mean±SD). Control: n = 14, sevoflurane: n = 12, desflurane: n = 12, xenon: n = 10. No statistically significant differences between the groups. C) Accuracy of Tg mice treated with different anesthetics, expressed as the percentage of accurate trials on every trial performed per day (mean±SD). Control: n = 14, sevoflurane: n = 11, desflurane: n = 11, xenon: n = 8. No statistically significant differences between the groups.
These data demonstrate that at least under our experimental conditions, neither anesthetic produces cognitive deficits, even weeks after anesthesia.
No influence of inhalational anesthetics on Aβ protein levels
The total Aβ1–42 levels in Tg mice were highly increased (Fig. 12A). Whereas the Aβ1–42 amount in the cortex (hippocampus) in WT mice was 128±455 pg/ml (115±230 pg/ml) in ArcAβ mice (n = 22) we found 1505±924 pg/ml (646±341pg/ml) in the cortex (hippocampus). In WT and ArcAβ mice, anesthesia with desflurane and sevoflurane did not significantly alter the amount of Aβ1–42 neither in the cortex (power: desflurane =0.441; sevoflurane = 0.145; xenon = 0.379) nor in the hippocampus (power: desflurane = 0.054; sevoflurane 0.495; xenon = 0.553) (Fig. 12B). Without anesthesia, the mean amount of Aβ1–42 in the cortex was determined as 1521±887 pg/ml (control), while the value of sevoflurane results was determined as 1088±1352 pg/ml. Even though treatment with desflurane reduced the Aβ1–42 levels to 631±461 pg/ml in the cortex, values were not significantly different. The mean value of Aβ1–42 in Tg mice anesthetized with xenon was 2780±2373 pg/ml in the cortex—a numerical, but not significant increase in Aβ1–42 levels. In the hippocampus more homogeneous Aβ1–42 levels have been detected: when mice were not treated with any anesthetic, ELISA revealed hippocampal Aβ1–42 levels of 377±399 pg/ml, after sevoflurane anesthesia of 997±861 pg/ml and of 331±338 pg/ml in the desflurane group. In the hippocampus of xenon anesthetized mice, we found 880±463 pg/ml Aβ1–42. The observed changes were not significant on a p < 0.05 level (Fig. 12B). Additionally, there were no significant differences in plaque size, plaque number or plaque area in the methoxy staining of the Tg mice brain slices after anesthesia. WT mice did not show any plaques (Fig. 12C). These results indicate that neither anesthetic tested significantly altered Aβ production nor plaque elimination.
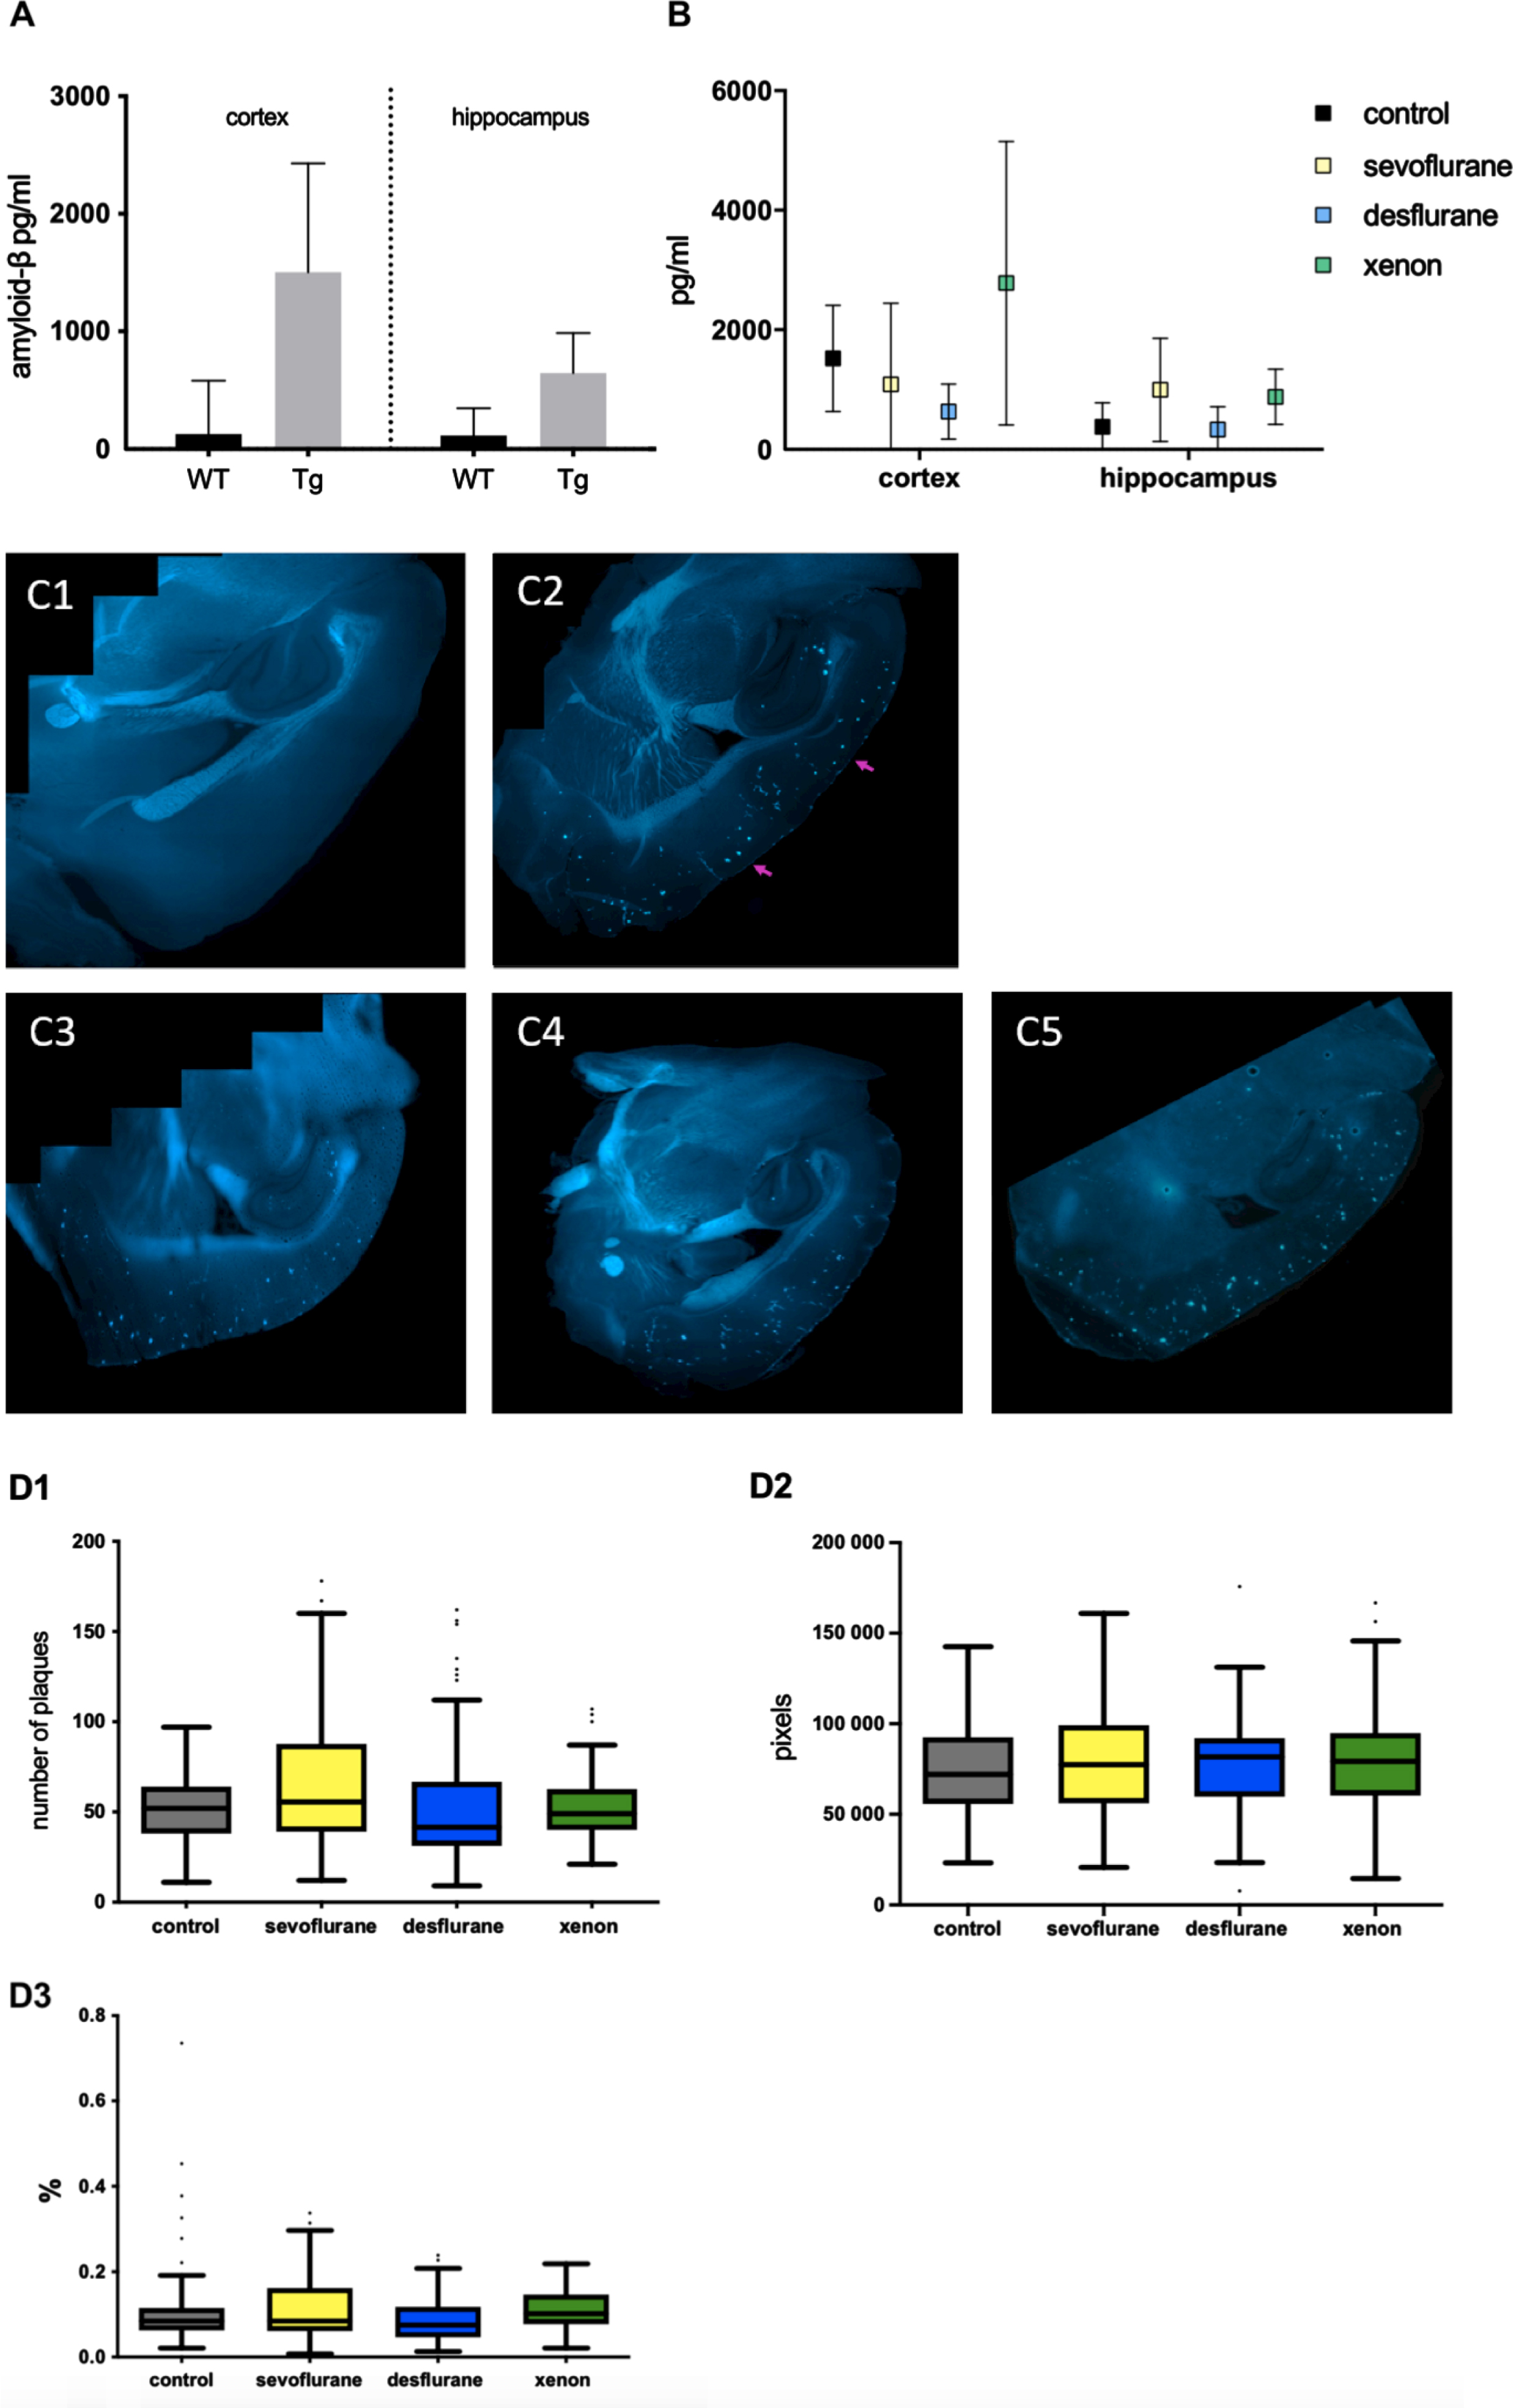
Neither anesthetic tested altered Aβ production or plaque elimination significantly. A) Total amount of Aβ1–42 in the hippocampus and cortex of WT and Tg mice determined by ELISA. Whereas in WT mice, the amount of Aβ1–42 was on average 128 pg/ml in the cortex and 115 pg/ml in the hippocampus, in Tg animals the Aβ levels were clearly elevated to 1505 pg/ml in the cortex and to 645.88 pg/ml in the hippocampus. B) Aβ1–42 levels in the cortex and hippocampus of Tg mice 4 weeks after anesthesia. No significant differences between the groups on a p < 0.05 level C) Representative fluorescent microscopy images of cortex and hippocampus after methoxy staining. 1: WT mouse, no plaques to be seen. 2: Tg mouse control, plaques clearly visible (arrows). 3: Tg mouse after sevoflurane anesthesia. 4: Tg mouse after desflurane anesthesia 5: Tg mouse after xenon anesthesia. D) Statistical analysis of plaque number (1), plaque size in pixel (2) and plaque area as %of area of hippocampus and cortex (3). Represented are the median, 1. & 3. quartile as well as the minimum and maximum of every group. No significant differences between the groups on a p < 0.05 level.
DISCUSSION
Many patients, especially the elderly, suffer from mild to severe and long-lasting cognitive deficits subsequent to GA with frequently used inhalational anesthetics. AD patients are at particular risk of developing cognitive dysfunction following GA and several studies hypothesize an association between exposure to GA and the risk of accelerating or even triggering AD [1–4, 50]. The etiology is of high interest, but there is no consensus about the physiological mechanisms behind thus far. Clinical studies are scarce and contradictory [51, 52]. The present study demonstrates in general that the commonly used inhalational anesthetics isoflurane and sevoflurane as well as xenon do not affect Aβ-derived neurotoxicity through acceleration of oligomerization in our experimental setting and that they do not aggravate Aβ protein burden and cognitive deficits in an AD mouse model after GA. Furthermore, the noble gas xenon even showed a beneficial pharmacology against Aβ aggregation and Aβ-induced disturbance of synaptic plasticity, indicating a possible neuroprotective effect. Previous studies indicate direct neurotoxic effects of certain anesthetics such as an increase of Aβ production and oligomerization [1, 20]. Many studies use widely divergent experimental conditions regarding anesthesia and the treatment is partly carried out with non-physiological Aβ concentrations. In the current study, we mostly applied Aβ at a low nM concentration, resembling more pathophysiological amounts of Aβ [31, 53]. Physiological amounts of Aβ in the healthy rodent brain are in the picomolar range. Studies have shown that an Aβ concentration around 200 pM enhances synaptic plasticity and memory [54] and has numerous important physiological functions such as regulation of synaptic function and promotion of recovery from brain injury [55]. An aberrant production of Aβ with amounts above ∼20 nM and an aggregation into toxic oligomers determines the transition of a benign protein to a neurotoxic one [54].
In the present study, TR-FRET assays demonstrated that physiologically relevant concentrations of isoflurane or sevoflurane did not affect oligomerization. Interestingly, xenon (at ∼1 MAChuman) even attenuated the formation of Aβ oligomers. A further evaluation of the formation of different Aβ oligomeric assemblies has been performed in a longitudinal analysis (silver staining) of Aβ1–42 aggregation levels in the presence of anesthetics. Consistent with the findings from Economou et al. (2016) [56], who monitored Aβ oligomerization via AFM, Aβ proteins aggregated very quickly from their initial monomeric and therefore non-toxic state [9] to toxic oligomers (25–260 kDa). This analysis revealed that anesthetics do not modify Aβ oligomerization, i.e., monomers (as well as trimers and tetramers) wane and oligomers remain at a steady state, without or in the presence of anesthetics. Unfortunately, unlike in the TR-FRET assay, the reducing effect of xenon on Aβ aggregation could not be verified. One reason for this inconsistency might be the unfavorable stoichiometry between xenon and Aβ: silver staining experiments were hampered by the technical need to use very high concentrations of Aβ1–42 (100μM) and the resulting stoichiometric requirement to use even higher (> 65%) concentrations of xenon. According to LTP data a stoichiometric excess of ∼2×10³ xenon over Aβ is required to reverse the synaptotoxic effect of Aβ1–42. The needed identical stoichiometry for the silver staining experiments is physically simply not achievable.
It should be noted that there was an apparent “mass balance” deficit in our gels and the disappearance of monomers is not reflected in an increase of oligomers. This might be explained by the long incubation period promoting the formation to larger amorphic aggregates (> 260 kDa) and, possible due to precipitation, which got lost during sample preparation/incubation resulting in empty start wells (see [35]). Altogether, Aβ aggregation was not affected by the anesthetics tested, whereby xenon, when applying physiological Aβ concentrations, inhibits aggregation.
Aβ oligomers are known to cause neuronal hyperexcitation and epileptiform activity in the hippocampus producing neuronal dysfunctions and neurodegeneration [57, 58]. VSDI offers the ability to monitor the spatiotemporal dynamics of neuronal population with micrometer spatial and millisecond temporal resolution. From all Aβ species tested in the tri-synaptic hippocampal circuit via VSDI, we found only Aβ1–40 to significantly increase the FDS signal, whereas the other Aβ isoforms did not affect FDS propagation evoked either in the CA3 (data not shown) nor the CA1 region per se. Presumably, to induce a change in basal synaptic activity, a longer than 90 min Aβ incubation is needed in this experimental setup.
To assure monitoring viable neuronal activity in slices, higher concentrations than 65%xenon are difficult to achieve [39]. Due to these constraints, we applied xenon, isoflurane, and sevoflurane at human MAC equipotent concentrations. After the application of anesthetics, FDS monitored in the CA1 region recovered quickly to baseline activity levels after washout. Interestingly, when combining Aβ and anesthetics, FDS of the CA1 region recovered in only 4 of 12 combinations after the removal of anesthetics. Dependent on the applied anesthetic, FDS did not fully recover at least in one of the monitored hippocampal regions, e.g., FDS recovered in experiments including Aβ1–40 and AβpE3 only after xenon removal. An explanation of these findings could be a synergistic neurotoxic effect of Aβ in combination with inhalational anesthetics. Aβ1–42 interferes with the glutamatergic system predominantly through overactivation of NMDAR function [31, 60], as well as with α-amino-3-hydroxy-5-methyl-4-isoxazolepropionic acid receptor (AMPAR) function [61, 62]. NMDARs are crucial for the induction of LTP [64] and are therefore key mediators of synaptic transmission. Aβ has also been described to strongly elevate resting Ca2 + in neuronal culture and in AD mouse models [63, 64] and moreover, elevated levels of Ca2 + are a hallmark of AD pathophysiology [65]. Increased Ca2 + levels lead to inhibition of LTP, a gradual loss of neuronal function through mitochondrial dysfunction, apoptosis, neurodegeneration and cognitive deficits [9]. The lasting synaptic depression after Aβ incubation and treatment with anesthetics in the present study may result from NMDAR desensitization and internalization through the excessive overactivation of NMDARs plus elevation of Ca2 + by oligomeric Aβ. Through this strong activation of NMDARs by Aβ, NMDARs indirectly induce activation of GABARs for inhibition of excitation [66]. Additionally, the presence of isoflurane and sevoflurane increases the release of the neurotransmitter GABA and the activation and expression of GABARs, thereby strongly inhibiting synaptic activation. There is also evidence that isoflurane and sevoflurane inhibit NMDARs and presumably AMPARs to a certain extent, resulting in an additional decrease in neuronal activity [67]. This synergistic effect of isoflurane and sevoflurane in combination with Aβ may explain the lasting reduction of neuronal activity in our VSDI experiments. In contrast, xenon as a low NMDAR-antagonist, decreases directly the detrimental effect of Aβ resulting in a less strong lasting inhibition of neuronal activation [49].
It is likely that the different Aβ species used in our experiments act via different target receptor/subunits (e.g., NMDAR, AMPA, calcium-channels or are even capable of forming their own ion channels [68] to induce certain intracellular responses that may lead to similar downstream changes (e.g. Ca2 +-influx, synaptic excitation/depression) [49]. Since TR-FRET and silver staining experiments did not show a direct impact of anesthetics on aggregation properties of Aβ, the lack of neuronal recovery is most likely not caused by increased Aβ oligomer levels through aeration with anesthetics.
Another important feature of AD neuropathogenesis is tau hyperphosphorylation which has also been shown to be increased by inhalational anesthetics such as sevoflurane [69] and isoflurane [10, 70]. A study found isoflurane to trigger tau hyperphosphorylation possibly due to Aβ aggregation induced by isoflurane anesthesia in WT and Tg mice [70]. Therefore, we cannot completely exclude the possibility that incubation of hippocampal slices with certain oligomeric Aβ species and anesthetics elevates p-tau and leads to a depression of neuronal activity [71].
Very recently we found that xenon administered at subanesthetic concentrations (30%) partially restored Aβ1–42- (but not Aβ1–40-) induced impairment of LTP pointing to protective properties of xenon in the context of pathological distorted synaptic physiology [49]. In the present study, we tested the putative neuroprotective effects of xenon against AβpE3- and 3NTyrAβ-induced synaptotoxicity. Nanomolar concentrations of different Aβ oligomer species are known to inhibit the formation of LTP ex vivo and in vivo in the CA1 layer of the hippocampus, thereby inhibiting normal function of cognition and inducing neurotoxicity [8, 53]. NMDARs are crucial for the induction of LTP and NMDAR antagonists delivered at concentrations which still allow physiological activities in vitro are able to prevent synaptic toxicity by Aβ1–42 and other isoforms [31, 53]. Interestingly, specifically NMDAR subunit 2B (GluN2B) might be highly involved in mediating Aβ-induced detrimental effects on synaptic activity [31]. Xenon has been identified as a low affinity NMDA antagonist [41]. In our TR-FRET assays, 30%xenon did not attenuate the formation of Aβ1–42 aggregates, excluding the possibility that xenon at low concentrations restores the toxic effect of Aβ simply by reducing its aggregation to oligomers. Xenon restored LTP distortion induced by AβpE3 but not 3NTyrAβ indicating that the target receptors/subunits mediating such synaptotoxicity may differ between the different Aβ species. This agrees with our interpretation of the heterogenous findings in VSDI experiments and is further supported by showing beneficial effects of radiprodil against Aβ1–42, Aβ1–40 and 3NTyrAβ, but not AβpE3-induced synaptotoxicity [31, 49]. Since radiprodil is a specific GluN2B antagonist, whereas xenon shows no preference for NMDAR subunits [40], this finding speaks in favor that AβpE3 rather targets GluN2A. However, one question remains: Why was xenon not able to restore the Aβ1–40 and 3NTyrAβ-induced impairment of LTP? One explanation might be, as already discussed, that the target receptors/subunits mediating such synaptotoxicity may differ between the different Aβ species tested. Another hypothesis might be a generally higher potency of 3NTyrAβ against LTP than Aβ1–42 or AβpE3 (but see [31]). Due to experimental constraints, we applied xenon at a concentration which does not interfere with LTP (30%[49]). Even though xenon applied at 65%has been shown to impair LTP [41], this effect was reversible. As such, increasing the xenon concentration up to 1 MAChuman (65%) might be more protective against Aβ toxicity (including 3NTyrAβ and Aβ1–40) during anesthesia [49] and additionally, the combination of a NMDAR antagonism and the inhibitory effect on Aβ aggregation may finally be beneficial under clinical conditions.
To further investigate changes in synaptic plasticity through anesthetics and Aβ, we examined the density of dendritic spines of the hippocampus. Dendritic spines are highly dynamic structures [72] whereby the elimination and synthesis of spines is critical for the function of neural circuits [73] and synaptic plasticity [72, 74]. The density is highly decreased in neurodegenerative diseases such as AD [75]. Cell-derived Aβ oligomers decrease dendritic spine density in the hippocampus by an NMDAR-dependent signaling pathway [76] and a loss of spines can be seen in Tg mice and acute hippocampal slices treated with Aβ [31, 77]. Spine density is also influenced by volatile anesthetics such as isoflurane and sevoflurane. Studies show contradictory results and scientists suggest that the effect of anesthetics might be dependent on the developmental stage during application [78, 79]. Interestingly, and consistent with LTP results, xenon reversed the detrimental effect of Aβ1–42 on spine density in our study. Interestingly, in the presence of Aβ1–42 and sevoflurane the spine number was not significantly altered to control implying at least a small recovery. However, the mean spine density resembles that of the spine reduction induced by Aβ1–42 alone, thereby excluding a strong neuroprotective effect of sevoflurane. Importantly, the volatile anesthetics did not further promote the loss of spines indicating no additive or synergistic synaptotoxicity. Altogether, the results revealed from LTP and spine density data underline a potential neuroprotective effect of xenon on Aβ induced synaptotoxicity.
In order to transfer our in vitro/ex vivo findings to the living organism, we tested cognitive performance in the WCM which is highly suitable for the detection of cognitive deficits developed in ArcAβ mice [32].
As expected, ArcAβ mice showed a weaker cognitive performance as WT mice per se demonstrating the validity of the WCM. In our experimental design, neither sevoflurane nor xenon caused cognitive deficits, a change in soluble Aβ1–42 levels or an increase/decrease in plaque burden, both in ArcAβ or WT mice 4 weeks after exposure.
Our data clearly suggest that anesthesia is not associated with a triggering and/or acceleration of Aβ-derived pathology, e.g., increased AβPP processing, Aβ accumulation, and cognitive decline. Biophysical and molecular constraints challenge the experimental design and interpretation, in particular with regards to Aβ proteins and inhalational anesthetics, especially xenon. Firstly, it is simply not possible to apply a pure xenon anesthesia to rodents at normo-baric conditions [37]. For this study, a xenon/sevoflurane mixture of 43%/3.1%was applied to guarantee anesthesia at around 1 MAC and a sufficient oxygen supply. This modification was already tested and recommended in clinical trials but might be an explanation for the lack of an improved cognition in ArcAβ mice anesthetized with xenon compared to sevoflurane or desflurane [80]. In order to achieve an equipotent anesthesia depth (monitored by the tail-clamp-test), ArcAβ mice needed a higher sevoflurane dose compared to WT. This observation is consistent with an increased MAC for isoflurane in another mouse model for AD [81]. One reason might be an advanced neuronal damage in ArcAβ mice, accompanied by an increased excitability and reflected in an epileptiform activity [57, 58] demanding higher concentrations of anesthetics to achieve similar anesthetic depths. Secondly, ArcAβ animals might have developed a coping strategy with the inflicted cognitive impairment or the task was not demanding enough hence leaving a sufficient minimal cognitive impairment subliminal. Thirdly, a possible relearning effect of the task during the testing weeks might have altered the accuracy in the WCM after anesthesia. A relearning of tasks in water mazes in rodents is known to happen at a faster rate than the original learning of the task [82]. The weekly testing may lead to a new relearning of the task every week, therefore masking a possible cognitive influence.
However, physical, biophysical, and molecular constraints and limitations make the interpretation of the presented results complicated, especially when dealing with Aβ proteins and anesthetics, specifically xenon. To determine the toxicity of soluble Aβ species and the potential interactions of Aβ with anesthetics it is important that the design of in vitro and in vivo studies closely reflects physiological/pathophysiological conditions. One crucial parameter for this goal is the application of physiologically relevant concentrations of Aβ and the respective anesthetic to generate data with high significant impact. Regarding the modulation of Aβ aggregation and cognitive performance after xenon anesthesia this parameter is extremely difficult to address. Xenon reduces aggregation when using Aβ concentrations (200 nM) closer to the physiological situation, but not when applied at irrelevantly high 100μM concentrations. Similarly, when AD transgenic mice were subjected to xenon anesthesia, no beneficial cognitive effects were obvious. Simply arguing, xenon shows no protection against Aβ neurotoxicity falls well short of the mark. It is physically not feasible to adapt the xenon/Aβ stoichiometry to the Aβ concentration necessary for silver staining. Regarding anesthesia and hence cognitive testing, it is impossible to apply a pure xenon anesthesia to rodents under normo-baric conditions. All these caveats have to be considered for interpretation and/or extrapolation and may provide an explanation for the occurrence of contradictory results concerning Aβ toxicity and the interaction with xenon.
In all our experiments, only male mice were used. This might be a limitation since many diseases are sex-specific. AD as such is more frequent in females than in males [83]. However, the goal of the current study was to investigate general interactions between inhalational anesthetics and Aβ proteins. The WCM was developed and established as a highly sensitive tool to assess hippocampal-dependent place learning in small animals and is less demanding than the MWM [84]. These properties should ensure that the majority of the transgenic animals would reach the learning criterion by the end of training to specifically study the interdependence between Aβ accumulation and different anesthetics. The validity of the WCM as suitable spatial memory task has been revealed in previous studies, demonstrating hippocampus-dependency [43], sensitivity to local disinhibition within the dorsal hippocampus [85] or genetic modifications [86, 87] and age-related cognitive impairments in association with changes in volume of the dorsal hippocampus in the WCM [88]. Focusing on deficits in the acquisition instead of the retrieval of spatial memory, more challenging cognitive tasks, such as the MWM, might be the appropriate choice. Moreover, our results show a high interindividual variability between the animals. This implies that only few individuals are susceptible to detrimental effects of anesthesia while others are resistant. Thus, interindividual differences in susceptibility have to be considered in future studies.
In conclusion, this study focused on the neuroprotective potential of xenon in the specific context of Aβ-induced neurotoxicity analyzing multiple levels of complexity. Our results demonstrated that commonly used anesthetics may interfere with Aβ-dependent pathophysiology of AD, whereby in contrast to other inhalational anesthetics, xenon showed some beneficial effects.
Footnotes
ACKNOWLEDGMENTS
We thank Sebastian Berger and Rami Eisawy of the TUM for programming the ROI tool in MatLab, as well as Dr. Markus Kummer and Angelika Griep for providing 3NTyrAβ. This work is dedicated to Christopher G. Parsons, who passed away shortly before submission of this manuscript.
This work was supported by grant RA 689_9-3 from the German Research Society (Deutsche For-schungsgemeinschaft), Bonn, Germany. The funding source was not involved in study design, in collection, analysis and interpretation of data, in writing of the report or in the decision to submit the article for publication.