
Abstract
Background:
Alzheimer’s disease (AD) is the most prevalent form of dementia worldwide. This neurodegenerative syndrome affects cognition, memory, behavior, and the visual system, particularly the retina.
Objective:
This work aims to determine whether the 5xFAD mouse, a transgenic model of AD, displays changes in the function of retinal ganglion cells (RGCs) and if those alterations are correlated with changes in the expression of glutamate and gamma-aminobutyric acid (GABA) neurotransmitters.
Methods:
In young (2–3-month-old) and adult (6-7-month-old) 5xFAD and WT mice, we have studied the physiological response, firing rate, and burst of RGCs to various types of visual stimuli using a multielectrode array system.
Results:
The firing rate and burst response in 5xFAD RGCs showed hyperactivity at the early stage of AD in young mice, whereas hypoactivity was seen at the later stage of AD in adults. The physiological alterations observed in 5xFAD correlate well with an increase in the expression of glutamate in the ganglion cell layer in young and adults. GABA staining increased in the inner nuclear and plexiform layer, which was more pronounced in the adult than the young 5xFAD retina, altering the excitation/inhibition balance, which could explain the observed early hyperactivity and later hypoactivity in RGC physiology.
Conclusion:
These findings indicate functional changes may be caused by neurochemical alterations of the retina starting at an early stage of the AD disease.
INTRODUCTION
Alzheimer’s disease (AD) is the most prevalent form of dementia worldwide and is becoming a global public health problem [1]. Its main symptoms are memory loss, cognitive impairment, and behavioral alterations [2–5]. Although the complete etiology of AD remains unknown, several hypotheses have been put forward to explain the mechanisms of the disease [6]. One dominant hypothesis, supported by research on transgenic mice expressing familial mutations of the human amyloid-β protein precursor (AβPP), involved cellular dysfunctions such as cell growth, survival, and repair [7, 8]. The accumulation and deposition of amyloid-β (Aβ) leads to alterations in neuronal plasticity, astrogliosis, oxidative injury, the formation of neurofibrillary tangles, cell death, and neurotransmission alterations in brain areas, which are responsible for the cognitive dysfunctions in AD [5, 6]. Although the precise mechanism by which accumulation of Aβ oligomers causes synaptic dysfunction remains unclear [9], their presence affects synaptic function in vitro [10], producing reactive oxygen species [11, 12], and also alters cognitive function [13]. In brief, AD involves a multiagent and multifunctional network failure in which diverse mol-ecular [14] and physiological agents participate [10].
Transgenic mice are useful to study the effect of genetic variants of AD [15–17]. For example, the increase in expression of Aβ peptides, mainly on the temporal, parietal lobe, frontal cortex, and cingulate gyrus [18] has been associated with cognitive deficits in animals [19]. Moreover, the visual system, particularly the retina, is also affected during AD [20, 21]. The retina is an accessible part of the brain which presents advantages for conducting experiments in physiology, biochemistry, and imaging and allows following the course of neurodegeneration [22]. The retina, organized in stratified nuclear and synaptic layers with significant diversity at the molecular and cellular levels, produces multiple parallel neuronal pathways [23–25], which are differentially vulnerable during neurodegenerative processes [26]. The interplay between AD etiology and its effect on vision [16, 27] has been reviewed extensively [28–31]. Human and animal studies have linked the presence of Aβ plaques, neurofibrillary tangles, and neurovascular deregulation with neurodegeneration of retinal ganglion cells (RGCs), the retinal nerve fiber layer (RNFL), and the ganglion cell layer (GCL) [21, 32–36] leading to visual dysfunction [32, 37–50]. The quest for early retinal AD biomarkers, as reported in human AD and the APP-PS1 mice, has been based on detection of Aβ plaques [51]. Clinical biomarkers include retinal thickness measurements: in humans with severe cases of AD, the RNFL decreases in the macular area upper quadrant [52], with approximately 25% loss of RGCs [38, 39]. In contrast, the lower quadrant is affected at the early stages of AD [39, 42], which correlates with cognitive deficits [42]. Similarly, the loss of RGCs observed in transgenic mice during aging correlates well with the accumulation of Aβ peptide [21, 53–57]. Although there are an important number of studies on retina morphological and molecular changes in AD in humans and mice [21], little is known about the effect on retinal function and its physiology.
Observed changes in neuronal excitability correspond well with important manifestations of nervous system dysfunction. For example, the hippocampus of the APP-PS1 mice, where there are pathological levels of Aβ peptides, presents with episodes of neural hyperactivity during early stages of cognitive impairment [58–62] and is associated with GABA decrease [59, 63]. Brain hyperactivity is also present in Mild Cognitive Impairment patients, where the administration of antiepileptic drugs decreased cognitive impairment and increased their memory performance [64].
Neural hyperactivity is observed in the degenerating retina [26] and in the rd10 mice, is modulated by blocking retinal gap junctions, which also improves light sensitivity [65]. Furthermore, in the rd1 mice [66, 67], hyperactivity involves 70% of RGCs and amacrine cells [26], where carbenoxolone, a gap junction blocker, compensates by reducing 30% of this hyperactivity. Hyperactivity affecting ON-type RGCs has been observed in 3-4-month-old diabe-tic mice, and seems to be a common mechanism in AD [68]. Not all retinal pathways are affected similarly, and depending on the neurodegenerative model studied [26], retinal dysregulation affects different neuromodulators (e.g., glutamate, nitric oxide, dop-amine, GABA). Recently, changes in the GABA and glutamate neurotransmitters were shown to moderate Aβ and to determine functional connectivity in AD in humans [69] and animal models [59, 60]. Interesti-ngly, the modulation of Aβ and glutamate has been associated with retinal dystrophy in AD models, wh-ere GABA inhibition prevented neurotoxicity [70].
Here, we study the RGC physiological alterations and neurotransmitters levels in the retinal layers of the 5xFAD mouse, both during asymptomatic and symptomatic AD stages [51, 72].
MATERIAL AND METHODS
Animals
5xFAD (Jackson laboratory, Bar Harbor, ME, USA) is a transgenic mouse model of AD that exp-resses mutant forms of the human AβPP and PSEN1 genes and develops amyloid plaque accumulation, loss of neurons and synapses, and has cognitive dysfunction in an age-dependent manner [19]. B6SJLF1/J is the background strain to the 5xFAD and these mice were used as wild-type (WT) control. These animals were maintained in the animal facility at Universidad de Valparaiso, under a 12:12 light/dark cycle in a controlled temperature environment, with water and food ad libitum. The animals were grouped by age and strain into young (2–3-month-old), when they start to accumulate Aβ peptide in the brain, and adults (6–7-month-old) at the beginning of cognitive impairment. In our analysis, we observed no differences between gender and therefore collected data were pooled together. The number of animals used in this study is displayed in Table 1. All experimental procedures followed bioethics protocols approved by Universidad de Santiago de Chile (approval bioethics committee #457) following international guidelines on animal handling and manipulation and the Chilean National Agency for Research and Development (ANID) bioethics and biosecurity standards.
Total number of animals, sex, and total number of RGCs evaluated in this study
Number of retinal cells evaluated in this work.
Electrophysiological recordings of the RGCs using MEA
The experimental protocol for electrophysiological recordings has been described in our previous publications [73, 74]. Briefly, a Multi-Electrode Array (MEA) (USB256, Multichannel Systems GmbH, Reutlingen, Germany) with 252 electrodes and sampling at 20 kHz was used to record RGCs from a small piece of the isolated retina. All the recordings were stored in a computer for offline analysis. Before the experiments, the animals were dark-adapted for 30 min and then profoundly anesthetized with Isofluorane (Baxter, Deerfield, IL, USA) and euthanized. Eyes were quickly enucleated under dim red light, and eyecups were prepared immersed in Ames medium with bicarbonate buffer (Sigma-Aldrich, St. Louis, MO, USA) at 32°C and pH 7.4 continuously oxygenated in a mixture of 95% O2 & 5% CO2. Small pieces of the retina were gently separated from the retinal pigment epithelium and positioned on a ring of dialysis membrane (MWCO-25000, Spectrumlabs, Rancho Dominguez, CA, USA), covered with polylysine (Product P4707, Sigma-Aldrich, St. Louis, MO, USA) to facilitate contact between the RGCs side of the retina and the surface of the MEA.
Visual stimulation of the retina
Different visual stimuli were build using MATLAB software (Natick, MA, USA) and delivered to the retina using a conventional LED projector (PB60G-JE, LG, Seoul, South Korea). A custom-made optical bench was used to adjust and focus the sti-muli onto the photoreceptor layer while placed on an inverted microscope (Eclipse T200, Nikon, Minato, Tokyo, Japan). The average irradiance of each stimulus was 70 nW/mm2 (Newport Corporation, Irvine, CA, USA). At 460 nm and 520 nm, the spectral emi-ssion was calibrated using a USB4000 spectrophotometer (Ocean Optics Inc, Dunedin, FL, USA). All the visual stimuli were of the same size (pixel≈4μm) and fully covered the≈2×2 mm retinal sample at the MEA array. The visual stimulation protocol was: 20 min of white noise (WN), 5 min of a sequence of natural images (NI), 5 min of scotopic activity (SA), and 5 min of photopic activity (PA). The image timing was controlled using custom-built software based on Psychtoolbox for MATLAB (Fig. 1).

A schematic drawing of the setup for MEA recordings from the retina. A piece of the retina is mounted on the MEA array, where the RGCs, in the GCL, are in direct contact with the electrodes. The various stimuli (top) are precisely focused on the photoreceptor layer. ONL, outer nuclear layer; OPL, outer plexiform layer; INL, inner nuclear layer; IPL, inner plexiform layer; GCL, ganglion cell layer; WN, white noise; NI, natural images; SA, scotopic activity; PA, scotopic activity.
Electrophysiological data analysis
The electrical activity at the RGCs level, generated by spontaneous conditions, response to darkness, or in response to light, white noise, and natural im-ages was collected. The Mc-Rack software (Multichannel Systems GmbH, Reutlingen, Germany) was used to acquire the data and a hard disk to store it for later analysis. A spike sorting software (SS) [75] was used to calculate the number of RGCs recorded on each retina patch. The SS algorithm considers the raw data passed through a high pass filter of 300 Hz and detects spike waveforms to identify and isolate cells from the full register. This study considered all cells passing a signal/noise criterion and interspike interval violation of ≤2.5%. A signal/noise criterion was applied to measure how well a cell responded to the stimuli, and it is defined as
Post-embedding immunogold staining of the retina
Retinas were fixed in 4% paraformaldehyde with 0.01% glutaraldehyde for 1 h and washed in PBS before the immunohistochemistry procedure. The tissue was then embedded in resin before cutting it into 500 nm thickness sections using an ultramicrotome. The primary antibodies, anti-L glutamate 1:5000 (Abcam; Ab9440) and anti-GABA 1:500 (Abcam; Ab9446), were used and were detected using a 1.4 nm Nanogold conjugated secondary antibody (Nanogold-IgG Goat anti-Rabbit IgG) diluted 1:100 in the buffer. Silver intensification was used over the nanogold staining as previously described [76, 77]. The images were acquired with a Leica DM RA2 microscope (Leica Microsystems, Wetzlar, Germany), using a 40x objective and converted into a 16-bit binary image using ImageJ software (NIH). The intensity of the pixels (PI) was normalized against the image background pixel value. The PI was assessed in vertical retinal sections, with ten measures for each retinal image and in 4 specific layers or locations of the retina: bipolar cells (BCs), amacrine cells (ACs), inner plexiform layer (IPL), and GCL. Statistical differences between WT and the 5xFAD mice were evaluated by paired comparison of PI values. Finally, the images were made into figures using Photoshop CS6 software (Adobe Systems Incorporated, San José, CA, USA).
Statistical analysis
Data are displayed as median and 25% –75% percentile. A normality distribution tested was done for all data (Shapiro-Wilk normality test, p < 0.0001). A Mann-Whitney test (unpaired, two-tailed) was used to compare WT and 5xFAD mice groups differences (The significance level used in statistical test were p < 0.0001, p < 0.001, p < 0.01, and p < 0.05). The statistical analyses and fitting methods were performed using GraphPad Prism software (GraphPad Software Inc, San Diego, CA).
RESULTS
RGC functional changes
The electrical activity of 3790 RGCs from different retinas (WT Young: 1145 cells, 5xFAD Young: 673 cells, WT Adult: 780 cells, 5xFAD Adult: 1192 cells) using various illumination conditions was obtained and recorded. The analysis only considered RGCs recordings with a good quality index response as per the experimental paradigm (see methods) which resulted in a variable number of RGCs per group.
Figure 2 shows representative raster plots for RGCs obtained in response to natural images from young and adult WT and 5xFAD retina. Young retinas displayed high spike activity compared to adult WT or 5xFAD, which displayed low spike activity. Figure 3 and Table 2 show the FR responses for the experimental groups using different visual stimuli. Firstly, we noticed that the FR depended on the type of stimulus: higher for WN and NI than for SA and PA at all ages and conditions (WT versus 5xFAD comparison). These results could be explained by the stimuli complexity: SA or PA activate either OFF or ON RGCs population separately, while WN and NI activate both ON and OFF retinal pathways in a dynamic way. Secondly, young 5xFAD had significatively higher FR values (hyperactivity) than WT for all stimuli except WN, and adult 5xFAD had significatively lower FR values (hypoactivity) than adult WT for all stimuli except PA (Fig. 3A, Table 2). In general, adults tended to have lower FR response than young animals to all stimuli, except for the FR response to SA in the WT. Similarly, the young 5xFAD and WT retina showed higher accumulated frequency response values than the adult, whereas 5xFAD had the lowest values, except for PA (Supplementary Figure 1 and Supplementary Table 1).
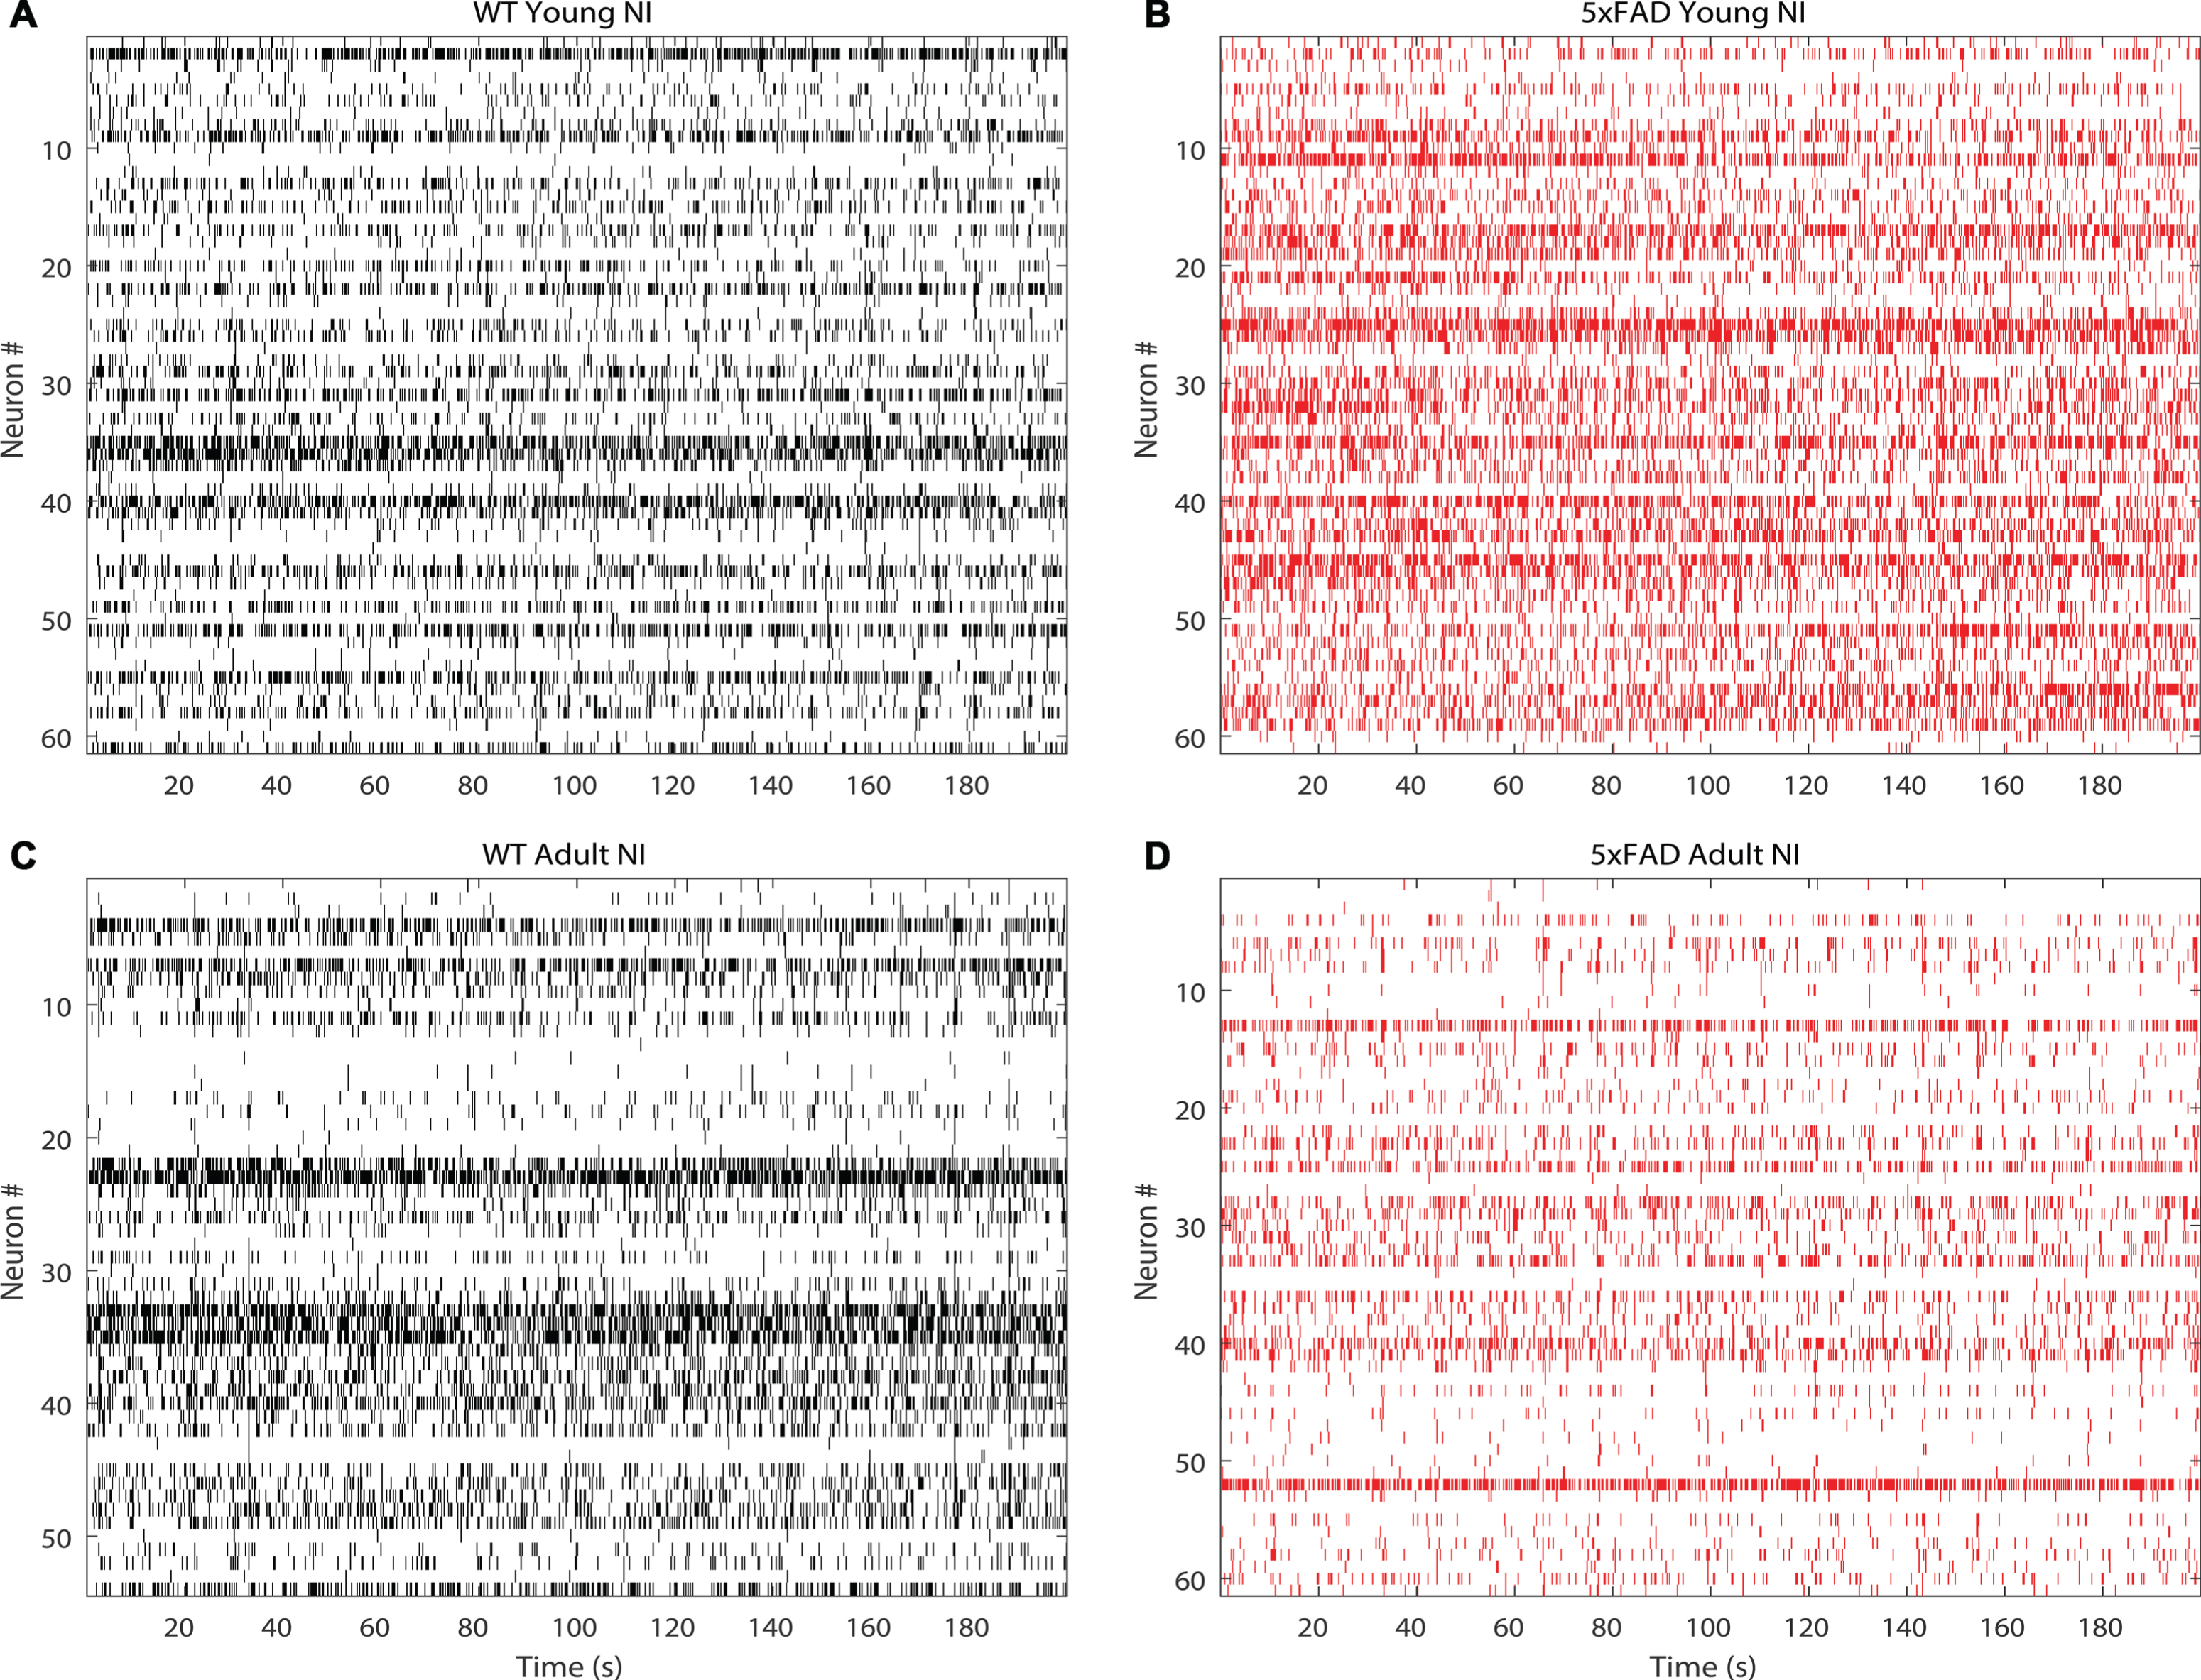
Representative raster plot graph, obtained after spike sorting showing the activity of 60 RGCs stimulated with a natural images (NI) for 200 s. A) WT young retina, B) 5xFAD young retina, C) WT adult retina, D) 5xFAD adult retina.
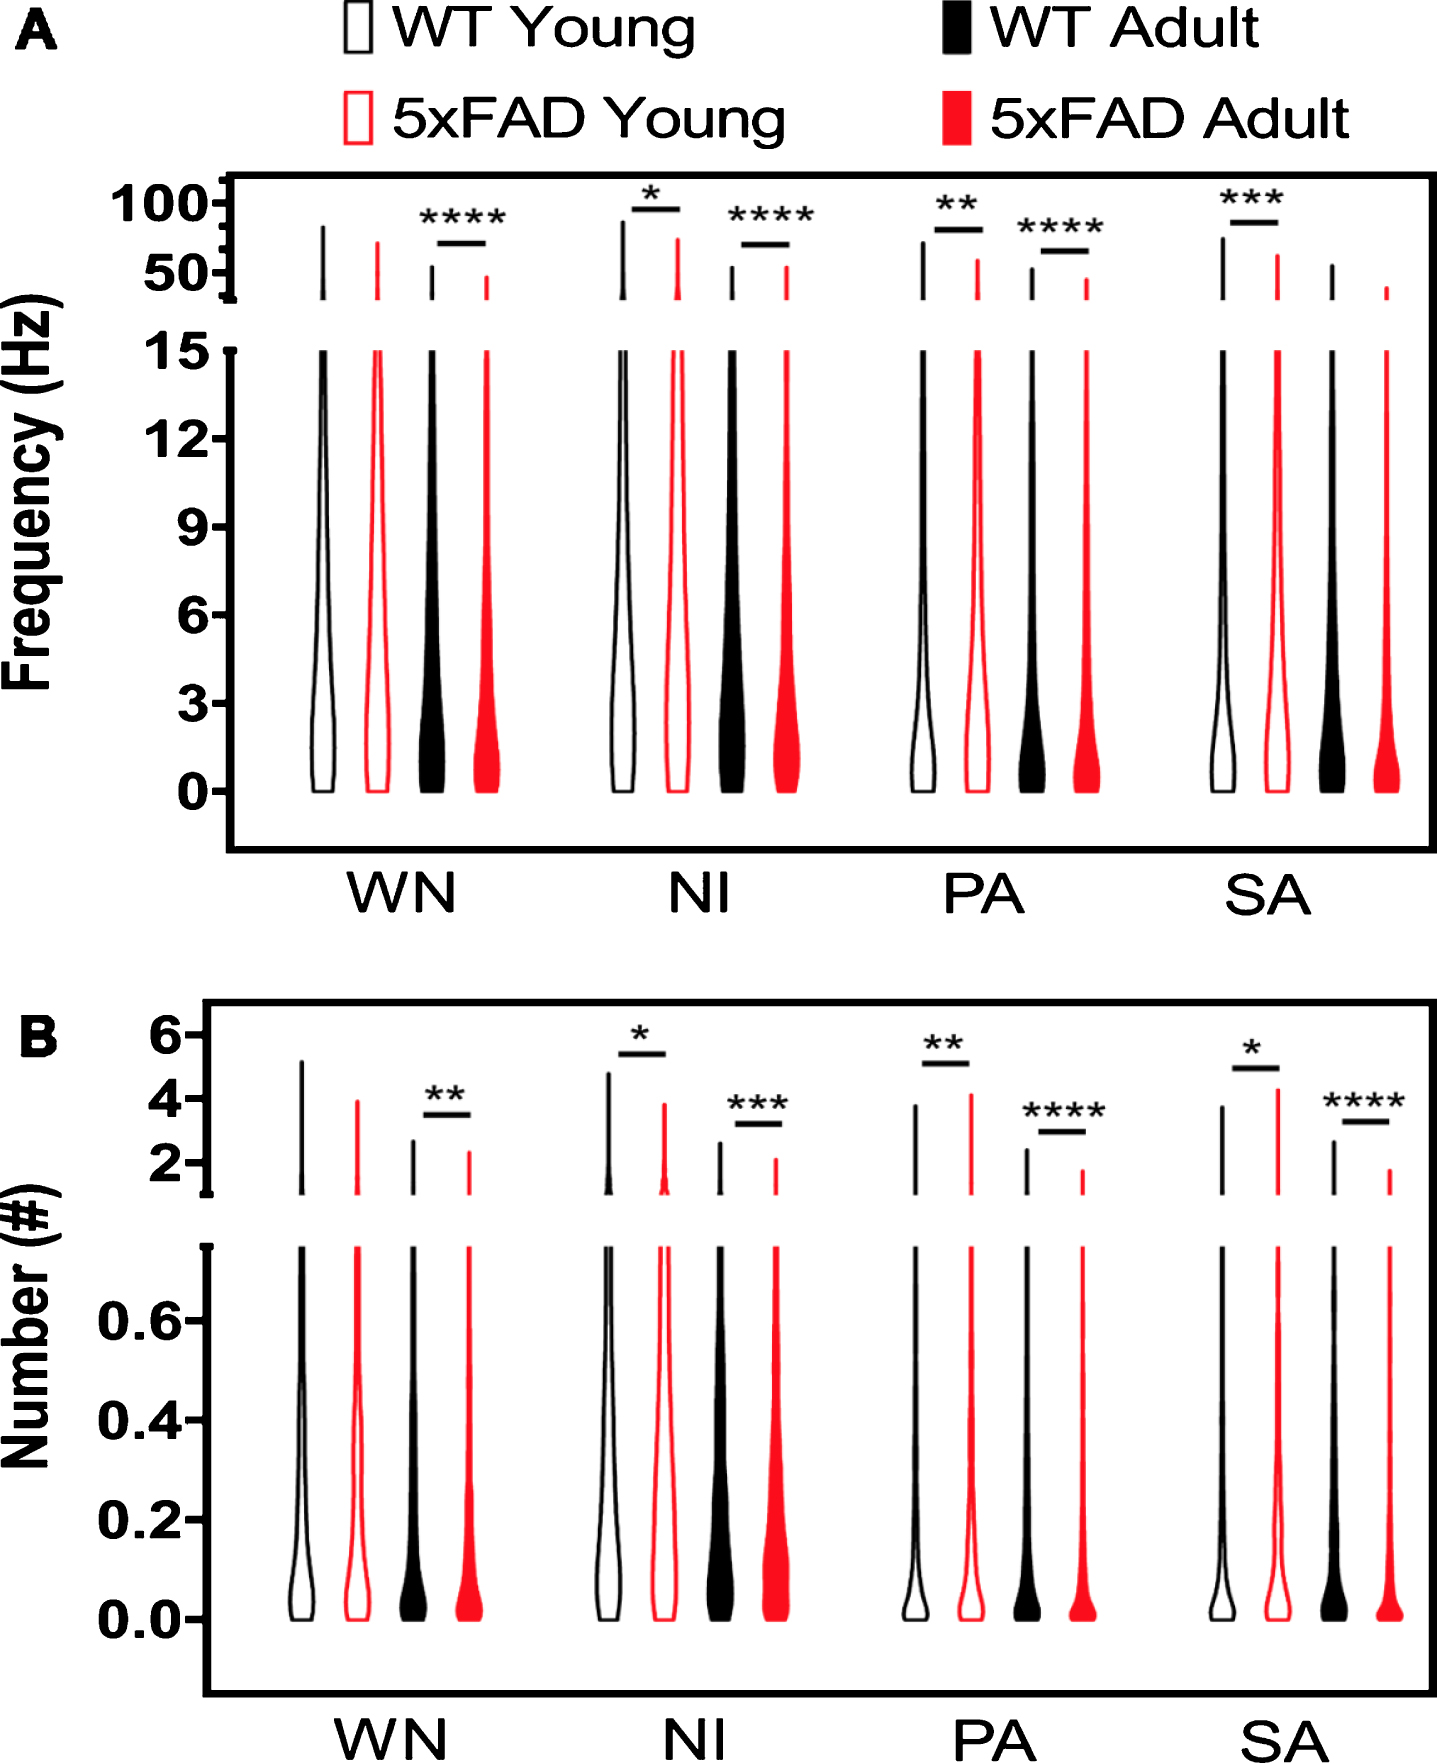
Representative FR response and Burst in 5xFAD and WT at different ages and using various stimuli. A) FR values are shown in a violin plot. B) Number of Bursts. WN, white noise; NI, natural image; SA, scotopic activity; PA, photopic activity. Mann-Whitney test: *p < 0.05, **p < 0.01, ***p < 0.001, ****p < 0.0001.
The median (M) and 25% –75% percentile to firing rates (FR) values of RGCs elicited by each stimulus (S). All the values are displayed in Hz. WN, white noise; NI, natural image; SA, scotopic activity; PA, photopic activity; n.s., non-significant; MW, Mann Whitney (p < 0.0001, p < 0.001, p < 0.01, p < 0.05)
Firing rates values of RGCs under illumination conditions.
The burst response analysis is summarized in Fig. 3B and Table 3. Young 5xFAD and WT retinas had significantly higher burst values than 5xFAD adults in response to WN and NI stimulus. The young 5xFAD had significantly higher burst values than the WT (Fig. 3B) except for the response to WN stimulus (Table 3). The adult 5xFAD had the lowest burst values, for all stimuli, compared to WT (Fig. 3B, Table 3). Consequently, the accumulated frequency response shows the adult 5xFAD had significantly lower values when compared to the WT and for all stimuli (Supplementary Figure 2 and Supplementary Table 2). Furthermore, the young 5xFAD retina had the highest accumulated frequency response to NI, PA, and SA compared to the WT retina.
The median (M) and 25% –75% percentile (P25 and P75 respectively) to Burst values of RGCs elicited by each stimulus (S). WN, white noise; NI, natural image; SA, scotopic activity; PA, photopic activity; n.s., non-significant; MW, Mann Whitney (p < 0.0001, p < 0.001, p < 0.01, p < 0.05)
Burst values of RGCs under illumination conditions.
Interestingly, the most complete and complex stimuli we used here is the natural stimuli NI (a short movie with a natural sequence of images, including movement, stops, intensity, and contrast variation) and is the one that best discriminates RGC responses among our experimental groups.
In brief, young retinas tended to have higher FR response than adults, and young 5xFAD had higher FR and burst values than the WT, strongly suggesting physiological hyperactivity in early stages of AD neurodegeneration. Conversely, adult 5xFAD had lower FR and burst values than the WT, suggesting physiological hypoactivity at this later stage of the AD disease. We conclude that both hyperactivity and hypoactivity support the idea of functional alterations in RGCs in the 5xFAD retina. These alterations are dependent on the disease stage and the visual stimuli used (e.g., NI).
Changes in glutamate and GABA levels
To understand the neurochemical mechanisms un-derlying the electrophysiological results, we analy-zed the labeling pattern of glutamate and GABA neurotransmitters, both essential for excitatory/inhi-bitory balance. We analyzed the presence of glutamate and GABA neurotransmitters in different retinal layers by comparing the WT and 5xFAD labeling patterns.
Figure 4 and Table 4 show glutamate labeling in the retinal layers. In young WT (Fig. 4A, B), glutamate labeled the whole retina. However, it was more pronounced in the inner nuclear layer (INL), more intense among the BCs in the outer part of the INL and weaker in the inner part of the INL, where ACs are located. Labeling was also observed in the IPL, with the weakest labeling seen in the GCL. Retinas of adult WT (Fig. 4E, F) showed a similar labeling pattern than the young WT, displaying intense labeling in the INL and weaker labeling in the GCL. On the other hand, young 5xFAD retinas (Fig. 4C, D) showed weaker labeling in the INL, but intense labeling was observed at the level of the GCL. Moreover, in the adult 5xFAD, intense labeling was observed in the GCL (Fig. 4G, H). For better visualization of Glutamate labeling in the retina, see Supplementary Figure 3 that has larger retinal images.
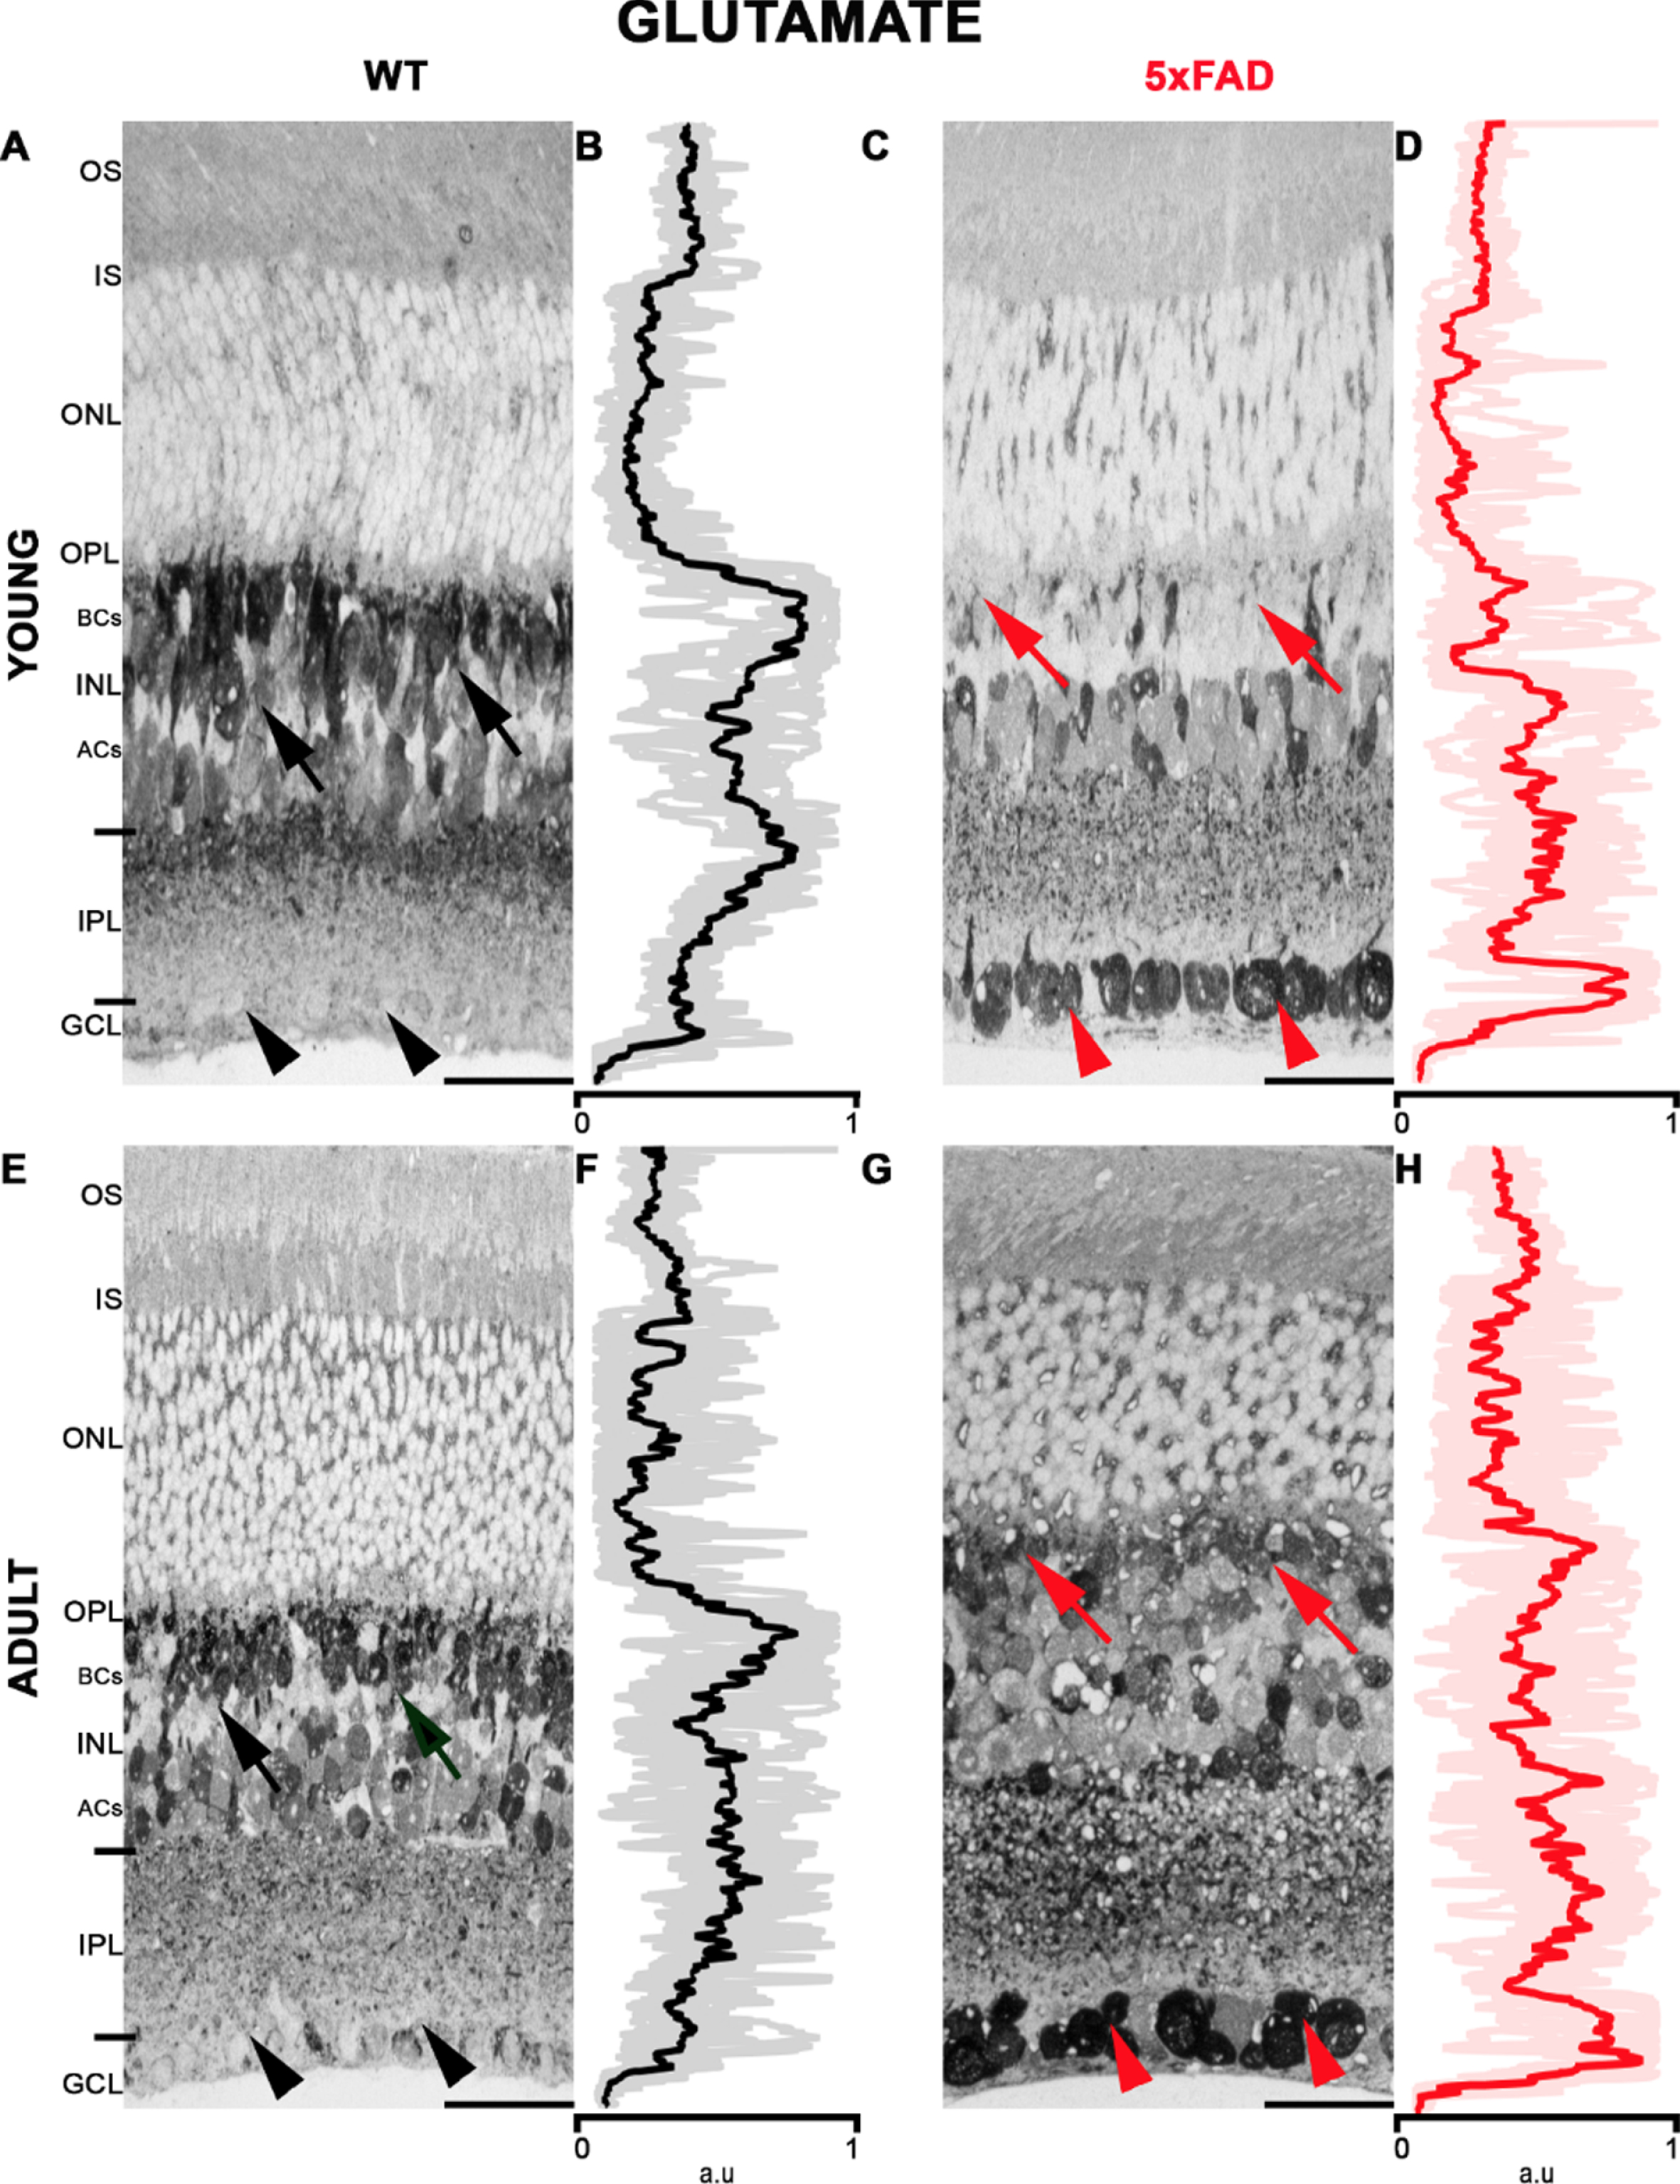
Glutamate labeling in 5xFAD and WT retinas. A) Young WT has a strong labeling pattern in the INL (black arrows) and weaker in GCL (black arrowhead). C) Young 5xFAD with strong labeling in the GCL (head of red arrows) and weak in INL (red arrows). E) Adult WT labeling in the INL (arrows black) and GCL (black arrowhead). G) Adult 5xFAD showed labeling in the INL (red arrows) and intense labeling in GCL, like the young 5xFAD retina (arrowheads). B, D, F, and H show the retinal average pixel value plot. These panels indicate the intensity of Glutamate staining in all layers of the retina. The average and standard deviation of the measurements are displayed. AU, arbitrary unit. Scale bar 15μm.
Glutamate quantification obtained from sampled cells and retina layers (values are median (M) and 25% –75% percentile of Pixel Intensity). BCs, bipolar cells; ACs, amacrine cells; IPL, inner plexiform layer; GCL, ganglion cell layer; n.s., non-significant; MW, Mann Whitney Test (p < 0.0001, p < 0.01)
Glutamate quantification in the retina.
In the young 5xFAD and WT retinas, GABA labeling was intense in the IPL while weak in the GCL; see Fig. 5 and Table 5. In young WT retinas (Fig. 5A, B), GABA was observed in the inner part of the INL, corresponding to the ACs area. Strong labeling was also observed in the IPL, while it was weak in the GCL. The retinas of adult WT (Fig. 5E, F) showed a similar GABA labeling pattern than young WT. The young 5xFAD (Fig. 5C, D) had a pattern of labeling similar to the young WT, but labeling was more intense in the internal part of the INL and the IPL. In the adult 5xFAD (Fig. 5G, H), intense labeling was seen in the INL and in the IPL. However, weak or no GABA labeling was observed among cells in the GCL. For better visualization of GABA in the retina, Supplementary Figure 4 contains larger retinal images.
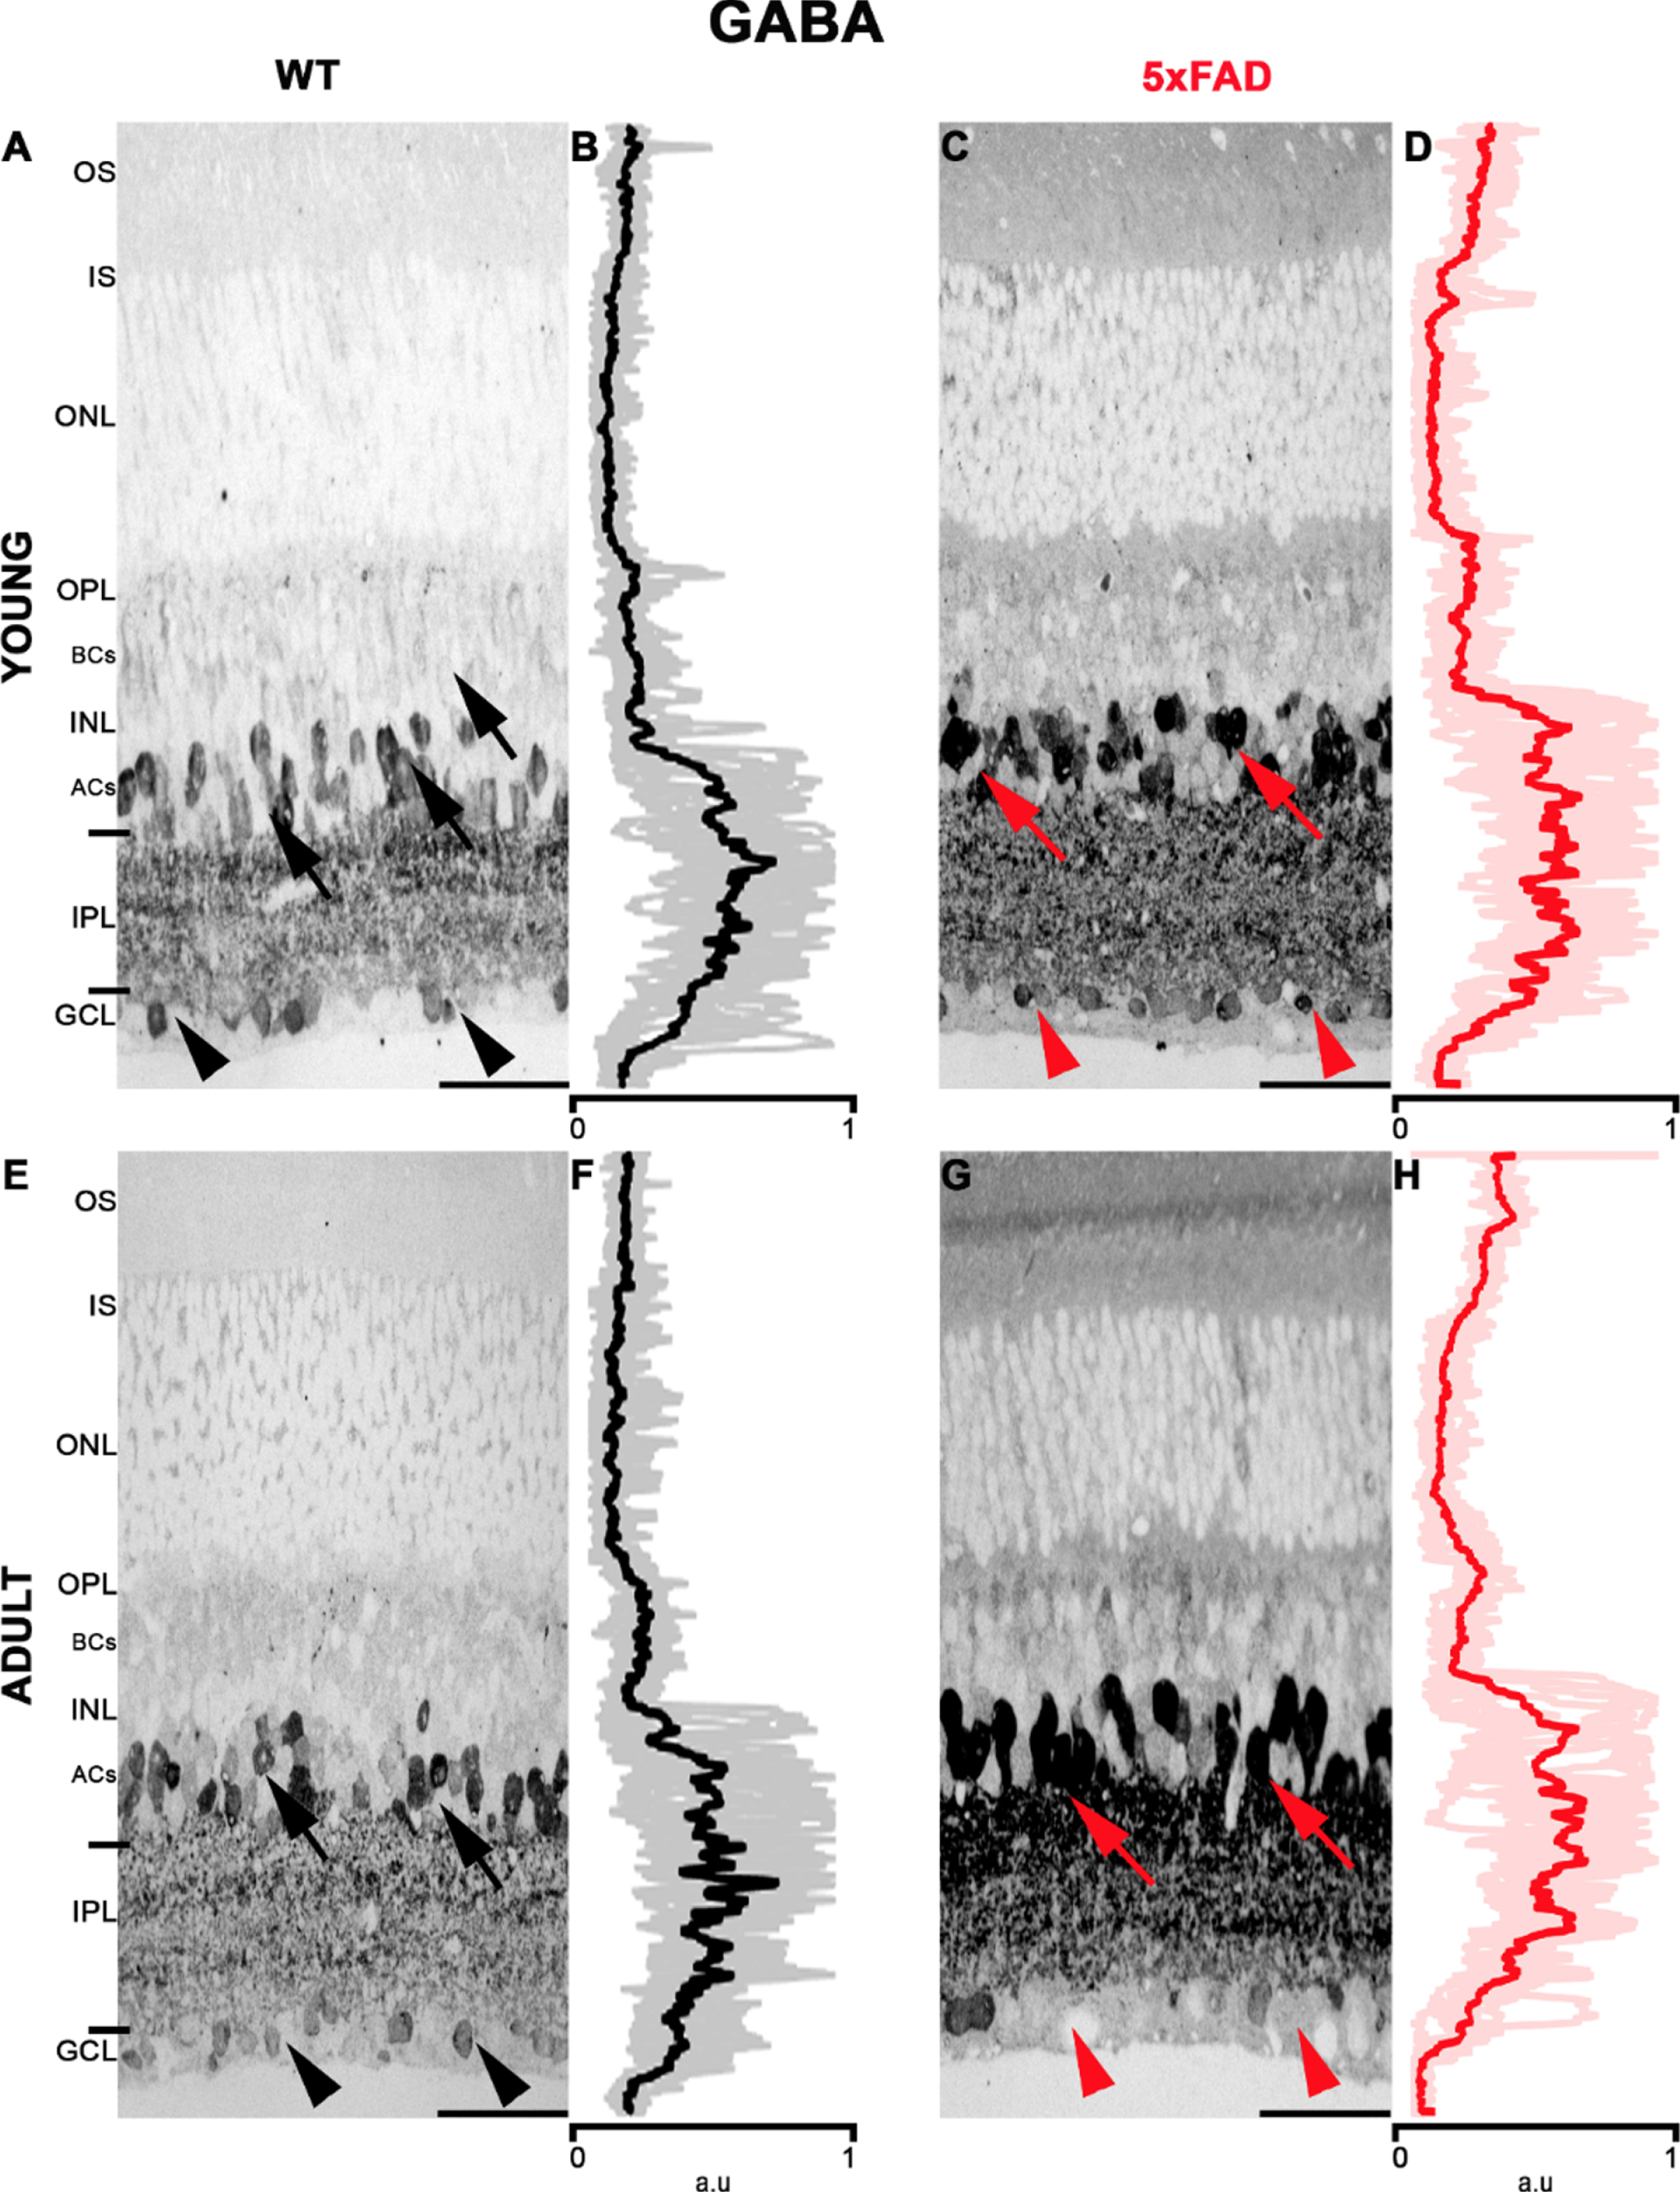
Strong GABA labeling in the INL in 5xFAD retinas. A) Young WT retina showed specific labeling in the internal INL (black arrow), in the IPL and the GCL (black arrowhead). C) Young 5xFAD showed a strong signal in the INL (red arrow), IPL, and the GCL (red arrowhead). E) Adult WT showed labeling in the INL (black arrow), in the IPL and the GCL (black arrowhead). G) Adult 5xFAD showed strong labeling in the INL (red arrow), IPL, but there was reduced labeling in the GCL (head of red arrow). B, D, F, and H, show the average pixel value for the corresponding retinal layers. The average and standard deviation of the measurements are displayed. AU, arbitrary unit. Scale bar 15μm.
GABA quantification obtained from sampled cells and retina layers (values are median (M) and 25% –75% percentile of Pixel Intensity). ACs, amacrine cells; IPL, inner plexiform layer; GCL, ganglion cell layer; n.s., non-significant; MW, Mann Whitney Test (p < 0.0001, p < 0.05).
GABA quantification in the retina.
DISCUSSION
The 5xFAD mouse has been used in many studies to understand the progress of AD. An exciting and critical part of the nervous system is the retina for its accessibility and functionality, where the role of genes, molecules, and the physiology of neural networks can be tested. Here, we compared the response of RGCs in the 5xFAD and WT mice during the course of aging and neurodegeneration. It has already been reported that the accumulation of Aβ peptide starts during an asymptomatic stage of AD in humans followed by a clinical-stage with cognitive alterations [4]. The later has an equivalent in the adult 5xFAD transgenic mice [19]. We observed that changes in the RGCs in the 5xFAD started in the young mice, which showed neuronal hyperactivity compared to WT. Hypoactivity was observed in the adult, comparable to the clinical stage of AD in humans. When those electrophysiological results were compared to the Glutamate and GABA neurotransmission levels during aging, a good correlation was obtained (Fig. 6). We observed that the high FR of RGCs (hyperactivity) in the young 5xFAD correlated well with a significant glutamate increase in the GCL layer. Moreover, GABA was sli-ghtly higher in young 5xFAD compared to young WT.

Proposed model comparing the firing rate in 5xFAD and WT response to a natural stimulus (NI). Dashed and continuous lines are a fitted function to the indicated parameters. All the data were normalized to the maximum % value to fit a Gaussian distribution. Glu, glutamate; FR, fire rate; GCL, ganglion cell layer; IPL, inner plexiform layer.
On the other hand, the FR in the adult 5xFAD dec-reased (hypoactivity) considerably compared to the young 5xFAD. Glutamate levels in adult 5xFAD in-creased only slightly compared with young 5xFAD. However, GABA significantly increased in the adult 5xFAD. This alteration of glutamate and GABA levels observed in 5xFAD, contribute to important changes in excitation-inhibition balance, which could explain the hyperactive and hypoactive physiological states of RGC.
As the retina is a neural network formed by genetically, molecularly and structurally diverse neurons, it is not expected in AD to see generalized damage, because not all neuronal circuits are affected equally by, for example, Aβ deposition during aging and neurodegeneration. In the rd10 and rd1 transgenic mouse model of retinal neurodegeneration, there is aberrant neural hyperactivity [26], which can be specifically modulated using gap junction blockers to improve light sensitivity. On the other hand, there is evidence supporting the origin of RGCs aberrant hyperactivity in ACs and BCs associated with an imbalance in excitatory and inhibitory signals [26]. Furthermore, hyperactivity is supported by dysregulation of neuromodulators (nitric oxide, dopamine) or gap jun-ctions in glaucoma mice models [78]. Neuronal hyperactivity also affects diabetic mice, particularly ON-type RGCs, suggesting the functional changes is similar to what is observed in the AD model [68].
During aging, the P23H transgenic rat has a dec-rease in the size of RGCs receptive field, with an increase in response latency (from P37 to P600) compared to WT. Although ON RGCs usually respond to light, the spontaneous spike firing activity was decreased [79]. In our study, both adult WT and 5xFAD show a functional decrease of RF compared to young mice, which can be associated to the changes in glutamate and GABA levels. Young WT showed an increase in glutamate levels in BCs and ACs and lower levels in the IPL and GCL compared to the 5xFAD. Those values decreased in BCs and ACs in the adult WT but increased in the 5xFAD, whereas the IPL and GCL levels increased in adult WT and 5xFAD. In the 5xFAD retina, GABA showed increased labeling in INL and IPL with age. We suggest that a differential expression of the glutamate neurotransmitter in different retinal neurons and layers during aging influences the observed RGC response in this transgenic AD model. In particular, the activation of Müller and astrocyte cells, which are described to be involved in AD mice [80, 81], correlates well with the observed transition from hyperactivity to hypoactivity.
Interestingly, when we compared the FR and burst activity with glutamate and GABA levels during aging, we observed a good correlation with the retinal physiology and neurochemical change, particularly with the RGCs in the GCL. Hyperactivity observed at a preclinical stage and hypoactivity at a clinical stage suggest good biomarkers to determine the stage and severity of neurodegeneration during the course of aging and AD. In this work, we have not evaluated the presence of Aβ peptides in the retina, but other reports have indicated that the accumulation of peptides in the retina, in animal models or AD patients, causes changes in synaptic transmission by activation of GABA receptor [21, 82]. In conclusion, we suggest distinct functional and molecular changes in the retina at different stages AD: RGC hyperactivity is an early pre-clinical biomarker and hypoactivity is a late-stage biomarker of the progressive neuropathology of AD.
Footnotes
ACKNOWLEDGMENTS
We appreciate the support from ANID Scholarship #21171156 (JA), FONDECYT #1200880 (AGP), #1180186 (CH), #1181659 (MC), MILENIO ICM-ANID #P09-022-F (AGP), #P09-015-F (CH), CINV (AGP), Alzheimer’s Association #2018-AARG-591107 (CDA), AFOSR #FA9550-19-1-0002 (MJE) and #20RT0419 (CH), FONDAP #15150012 (CH), FONDEF #ID16I10223 (CH) and #D11E1007 (CH), ECOS-ANID #C17S02 (CH), Michael J. Fox Foundation #ID 12473.01 (CH).