
Abstract
Background:
There is a need for more reliable diagnostic tools for the early detection of Alzheimer’s disease (AD). This can be a challenge due to a number of factors and logistics making machine learning a viable option.
Objective:
In this paper, we present on a Support Vector Machine Leave-One-Out Recursive Feature Elimination and Cross Validation (SVM-RFE-LOO) algorithm for use in the early detection of AD and show how the SVM-RFE-LOO method can be used for both classification and prediction of AD.
Methods:
Data were analyzed on n = 300 participants (n = 150 AD; n = 150 cognitively normal controls). Serum samples were assayed via a multi-plex biomarker assay platform using electrochemiluminescence (ECL).
Results:
The SVM-RFE-LOO method reduced the number of features in the model from 21 to 16 biomarkers and achieved an area under the curve (AUC) of 0.980 with a sensitivity of 94.0% and a specificity of 93.3%. When the classification and prediction performance of SVM-RFE-LOO was compared to that of SVM and SVM-RFE, we found similar performance across the models; however, the SVM-RFE-LOO method utilized fewer markers.
Conclusion:
We found that 1) the SVM-RFE-LOO is suitable for analyzing noisy high-throughput proteomic data, 2) it outperforms SVM-RFE in the robustness to noise and in the ability to recover informative features, and 3) it can improve the prediction performance. Our recursive feature elimination model can serve as a general model for biomarker discovery in other diseases.
Keywords
INTRODUCTION
Alzheimer’s disease (AD) is the most common form of dementia with rates estimated to reach well over 13 million by 2050 [1]. Despite efforts by the Centers for Medicare and Medicaid Services to implement a cognitive examine within their annual wellness visit, due to time limitations and lack of rapid screening measures, this effort has been increasingly unmet [2]. Therefore, the growing prevalence rate of AD has only placed greater burden on the healthcare system [3]. As a result, increased focus has turned towards filling the gap in obtaining a cost and time effective screening procedure, which has moved blood-based biomarkers towards the forefront due to their many advantages.
Our prior work has shown that a blood test for AD is not only possible but has the capacity to serve as the first step in a multi-stage diagnostic work-up [4–30]. The proposed mechanism for an AD blood test has been geared towards establishing a matched system with other specialties (cardiology, oncology) that utilize blood tests to decrease the number of individuals referred on for additional diagnostic procedures [16, 32]. For an AD blood test to be comparable to other mechanisms that fall under the coverage of diagnostic screener, the test itself needs to have a high negative predictive power for purposes of cost containment within the healthcare system and be able to reduce the degree of patient burden.
Of the work examining a blood-based algorithm for the detection of AD, the number of biomarkers necessary for adequate detection has decreased [4–6]. The blood-based biomarkers identified and integrated into the applied algorithms across multiple studies have been done so via examination of relative importance plots [5] thereby enabling those biomarkers with the greatest degree of impact on the distinction between two diagnostic categories to be teased apart from those with a lower degree of impact. This method of utilizing Gini Plots has yielded high diagnostic accuracy; however, limitations are that it holds the potential to be biased towards biomarkers that are more robustly found. As with any method, decision trees, such as those applied to obtain Gini Plots, hold advantages as they are capable of handling noise, outliers and missing data [33, 34]. Support vector machine (SVM) methods have been more robustly utilized and add additional statistical advantages such as being a powerful and accurate classifier as well as being effective with high dimensional data [33, 35–37].
Within the field of AD, machine learning techniques such as SVM have been extensively applied for the purpose of determining diagnostic and prognostic algorithms for disease detection across neuroimaging modalities. One study conducted in the ADNI cohort found that when using MRI features, the Linear Discriminant Analysis (LDA) with Leave-One-Out Validation (LOO CV) method was able to accurately diagnose 70% of those who went on to develop AD after 3 years as well as 76% of those who developed AD at 6 months [38]. When the high-dimensional pattern classification approach with Leave-One-Out Validation (LOO CV) using similar neuroimaging biomarkers was further applied to detect the following diagnosis 1) AD versus cognitively normal controls (NC), 2) mild cognitive impairment (MCI) versus NC, and 3) AD versus MCI, the approach obtained classification accuracies ranging from 94.3%, 81.8%, to 74.3%, respectively [39]. Additional MRI research examining AD versus NC has also reported similar accuracy levels with the LOO CV method, with detection levels reaching 90–92% [40, 41].
The field of oncology has more extensively applied SVM methods including the Support Vector Machine Recursive Feature Elimination (SVM-RFE) approach for gene selection as it has been shown to successfully select informative genes for cancer classification [42]. This success is in part due to the fact that the SVM-RFE models use a backward selection approach that enables genes to be identified according to their influence (weight) on a support vector machine. It first works by calculating ranking criteria based on the SVM weights and then eliminates features with the smallest ranking criterion. Lastly, it repeats the process until the highest classification accuracy is achieved.
SVM-RFE is used to find discriminate relationships within clinical datasets and within gene expression datasets created from micro-arrays of tumor versus normal tissues. However, the feature elimination method is sensitive to small perturbations of the training set. The features that are extracted from the training set may not perform as well in an independent testing set. This is probably caused by overfitting, which arises when 1) the number of features is large and the number of training patterns is comparatively small or 2) some regularities appear in the training data that do not appear in the test data.
In order to avoid the overfitting and achieve the best prediction accuracy for the testing set, this study aimed to build an SVM-based model using the Recursive Feature Elimination and Leave One Out (SVM-RFE-LOO) in order to extract optimal features. We propose for the first time a multi-marker panel development solution for AD by using a SVM-RFE-LOO, and sought to show how the SVM-RFE-LOO model could be utilized to aid with classification and prediction. We further compared the classification and prediction performance of SVM-RFE-LOO to that of SVM and SVM-RFE.
Materials and Methods
Participants
Serum samples were analyzed from clinically evaluated n = 150 AD cases and n = 150 NC cases. Briefly, each participant underwent an annual standardized assessment at one of the five participating the Texas Alzheimer’s Research and Care Consortium (TARCC) sites, which includes a medical evaluation, neuropsychological testing, and a blood draw. A diagnosis of AD was based on the National Institute of Neurological and Communicative Disorders and Stroke and the Alzheimer’s Disease and Related Disorders Association (NINCDS-ADRDA) criteria [43, 44]. The TARCC consortium was initiated in 2005 and is ongoing [45]. Only baseline samples and data were used for this study. The rationale of selection of these 300 patients is not only based on NINCDS-ADRDA criteria but also the 21 serum markers of interest which provide significant advantages [46]. Control participants were those who performed within normal limits on psychometric testing. Normal limits were defined as performance for which is expected given age and education level and for which did not meet NINCDS-ADRDA criteria for cognitive impairment. Institutional Review Board approval was obtained at each site and written informed consent is obtained for all participants.
Assay
Blood samples were collected as follows: 1) fasting blood collected using 21 g needle, 2) sample tubes collected in the following order: blood culture tube, coagulation tube, serum, heparin, plasma EDTA tube, 3a) serum tube allowed clot for 30 min at room temperature in a vertical position, 3b) plasma tubes gently inverted 5–10 times, 4) centrifuged for 10 min at 2000×g within 1 h of collection, 5) 1.0 mL aliquots of serum will be transferred into polypropylene (cryovial) tubes, 6) sample ID (Freezerworks™ is used for TARCC biorepository) affixed to each aliquot, and 7) samples placed into –80°C freezer within 2 h of collection.
Samples were prepared for proteomic using the Hamilton Robotics StarPlus system. Serum samples were assayed via a multi-plex biomarker assay platform using electrochemiluminescence (ECL). ECL technology uses labels that emit light when electrochemically stimulated, which improves the sensitivity of detection of many analytes at very low concentrations. ECL measures have well-established properties of being more sensitive and requiring less volume than conventional ELISAs. A total of 500μl of serum was obtained from each TARCC sample. Stringent QA procedures were maintained producing excellent inter- and intra-assay variability (all CVs <.10% with the majority <5%).
Recursive Feature Elimination (SVM-RFE) method based on Leave-One-Out Method
SVM-RFE was introduced by Guyon et al. for selecting genes from microarray data analysis for cancer classification [42]. The method involves four steps 1) train an SVM on the training set, 2) calculate ranking criteria based on the SVM weights, 3) eliminate features with the smallest ranking criterion, and 4) repeat the process [47]. The feature elimination method is sensitive to small perturbations of the training set. Therefore, we adopted a leave-one-out method to improve the stability and robustness of the SVM-RFE. In addition, we chose AUC as ranking criteria instead of W2 in the SVM-RFE algorithm, which makes optimization selection more accurate.
The SVM Recursive Feature Elimination method based on Leave-One-Out (SVM-RFE-LOO) is described as follows. And we implemented the pseudo code using e1071 package in R programming language (v4.0.3).
k=
E=E0; #threshold for minimum AUC
while (E > = E0)
{
E0 = E
k= k[AUC == E] #remove the feature with maximum AUC; if AUC are equal, remove features with maximum Precision.
for (i in k)
{
Build a SVM i after removing the ith feature;
Calculate the AUC i and Precision i for SVM i with five-fold cross-validation;
}
}
Enumeration method for validation
The enumeration method based on feed forward neural network was previously used by our group to identify optimal biomarker panels [48]. Similarly, we designed an enumeration method based on SVM and five-fold cross-validation to verify whether the biomarkers identified by the SVM-RFE-LOO had the best prediction performance.
We randomly chose M combinations of N out of all of the 21 proteins and built M SVMs. We measured the area under the curve (AUC) for receiver operating characteristics (ROC) one by one for all combinations to find the optimal classifier. The combinations were ranked as followed,
Cross-validation
A k-fold cross-validation was used to increase the number of estimates and improve the accuracy of the prediction model by avoiding overfitting. In k-fold cross-validation, the original sample is randomly partitioned into k subsamples. Of the k subsamples, a single subsample is retained as the validation data for testing the model and the remaining k-1 subsamples are used as training data. The cross-validation process is then repeated k times, with each of the k subsamples used exactly once as the validation data. The k results from the folds can then be averaged to produce a single estimation. The advantage of this method over repeated random sub-sampling is that all of the observations are used for both training and validation, and each observation is used for validation only once. If k equals the sample size, this is called leave-one-out cross-validation.
Performance measurements
The following five measurements were involved in our evaluation: 1) Sensitivity (also called recall), the proportion of actual positive pairs which are correctly identified; 2) Specificity, the proportion of negative pairs which are correctly identified; 3) Precision, the probability of correct positive prediction; 4) Accuracy, the proportion of correctly predicted pairs; and 5) Area Under the Curve.
RESULTS
Table 1 shows the demographic characteristics of the study cohort. When examining group differences, the AD group was found to be older and have lower education as compared to the NC group (p-values<0.05). No significant difference was found for gender. Figure 1 shows the automatic tuning recursive feature elimination for the number of features selected and the leave-one-out. Training of the SVM-RFE-LOO was performed using leave-one-out and five-fold cross-validation. AUC was calculated to help evaluate the predictive performance of features selected by SVM-RFE-LOO. The highest AUC with the least number of features was found when the number of features equaled 16 (Fig. 1). The heatmap of the 16-marker panel is shown in Fig. 2. N = 141 out of 150 AD samples and n = 140 out of 150 NC samples were correctly predicted. Table 2 shows the direction and strength of expression changes for the 16 biomarkers. With the 16 biomarkers, we obtained a high performance (AUC = 0.980, precision = 93.4%, accuracy = 93.7%, sensitivity = 94.0%, specificity = 93.3%) (Table 3).
Demographic characteristics of the cohort
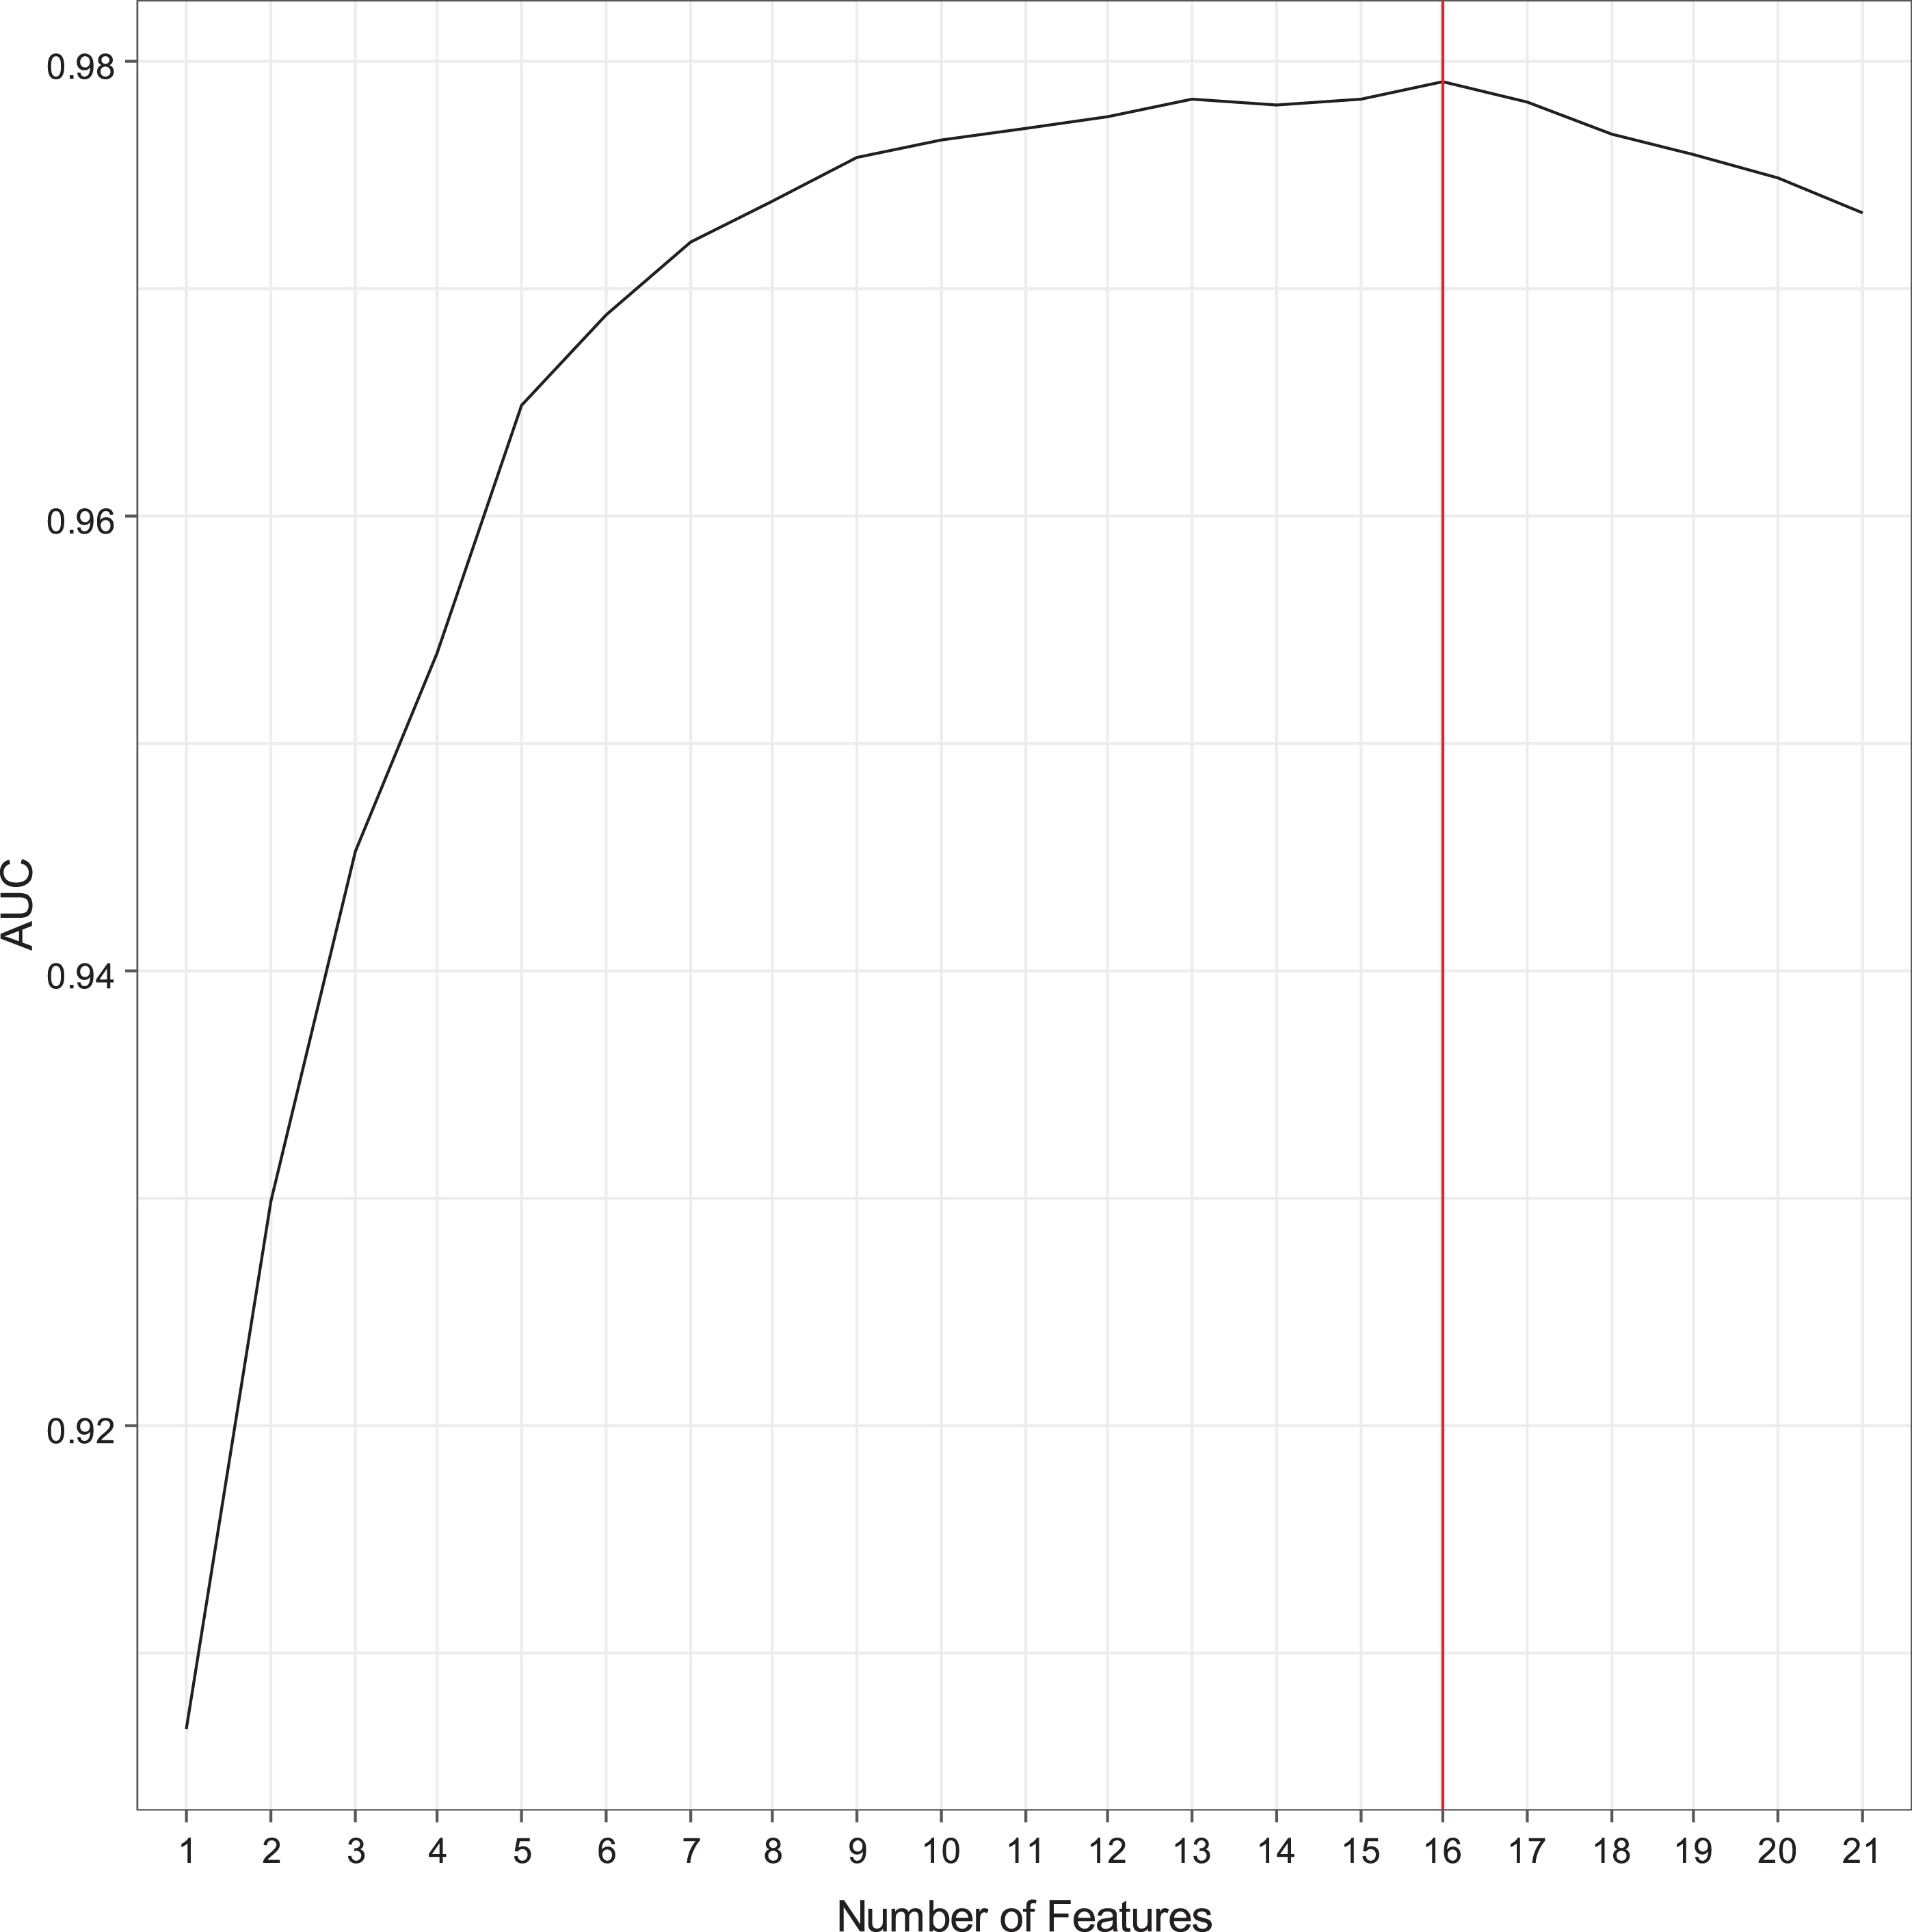
Recursive feature elimination with automatic tuning of the number of features selected.
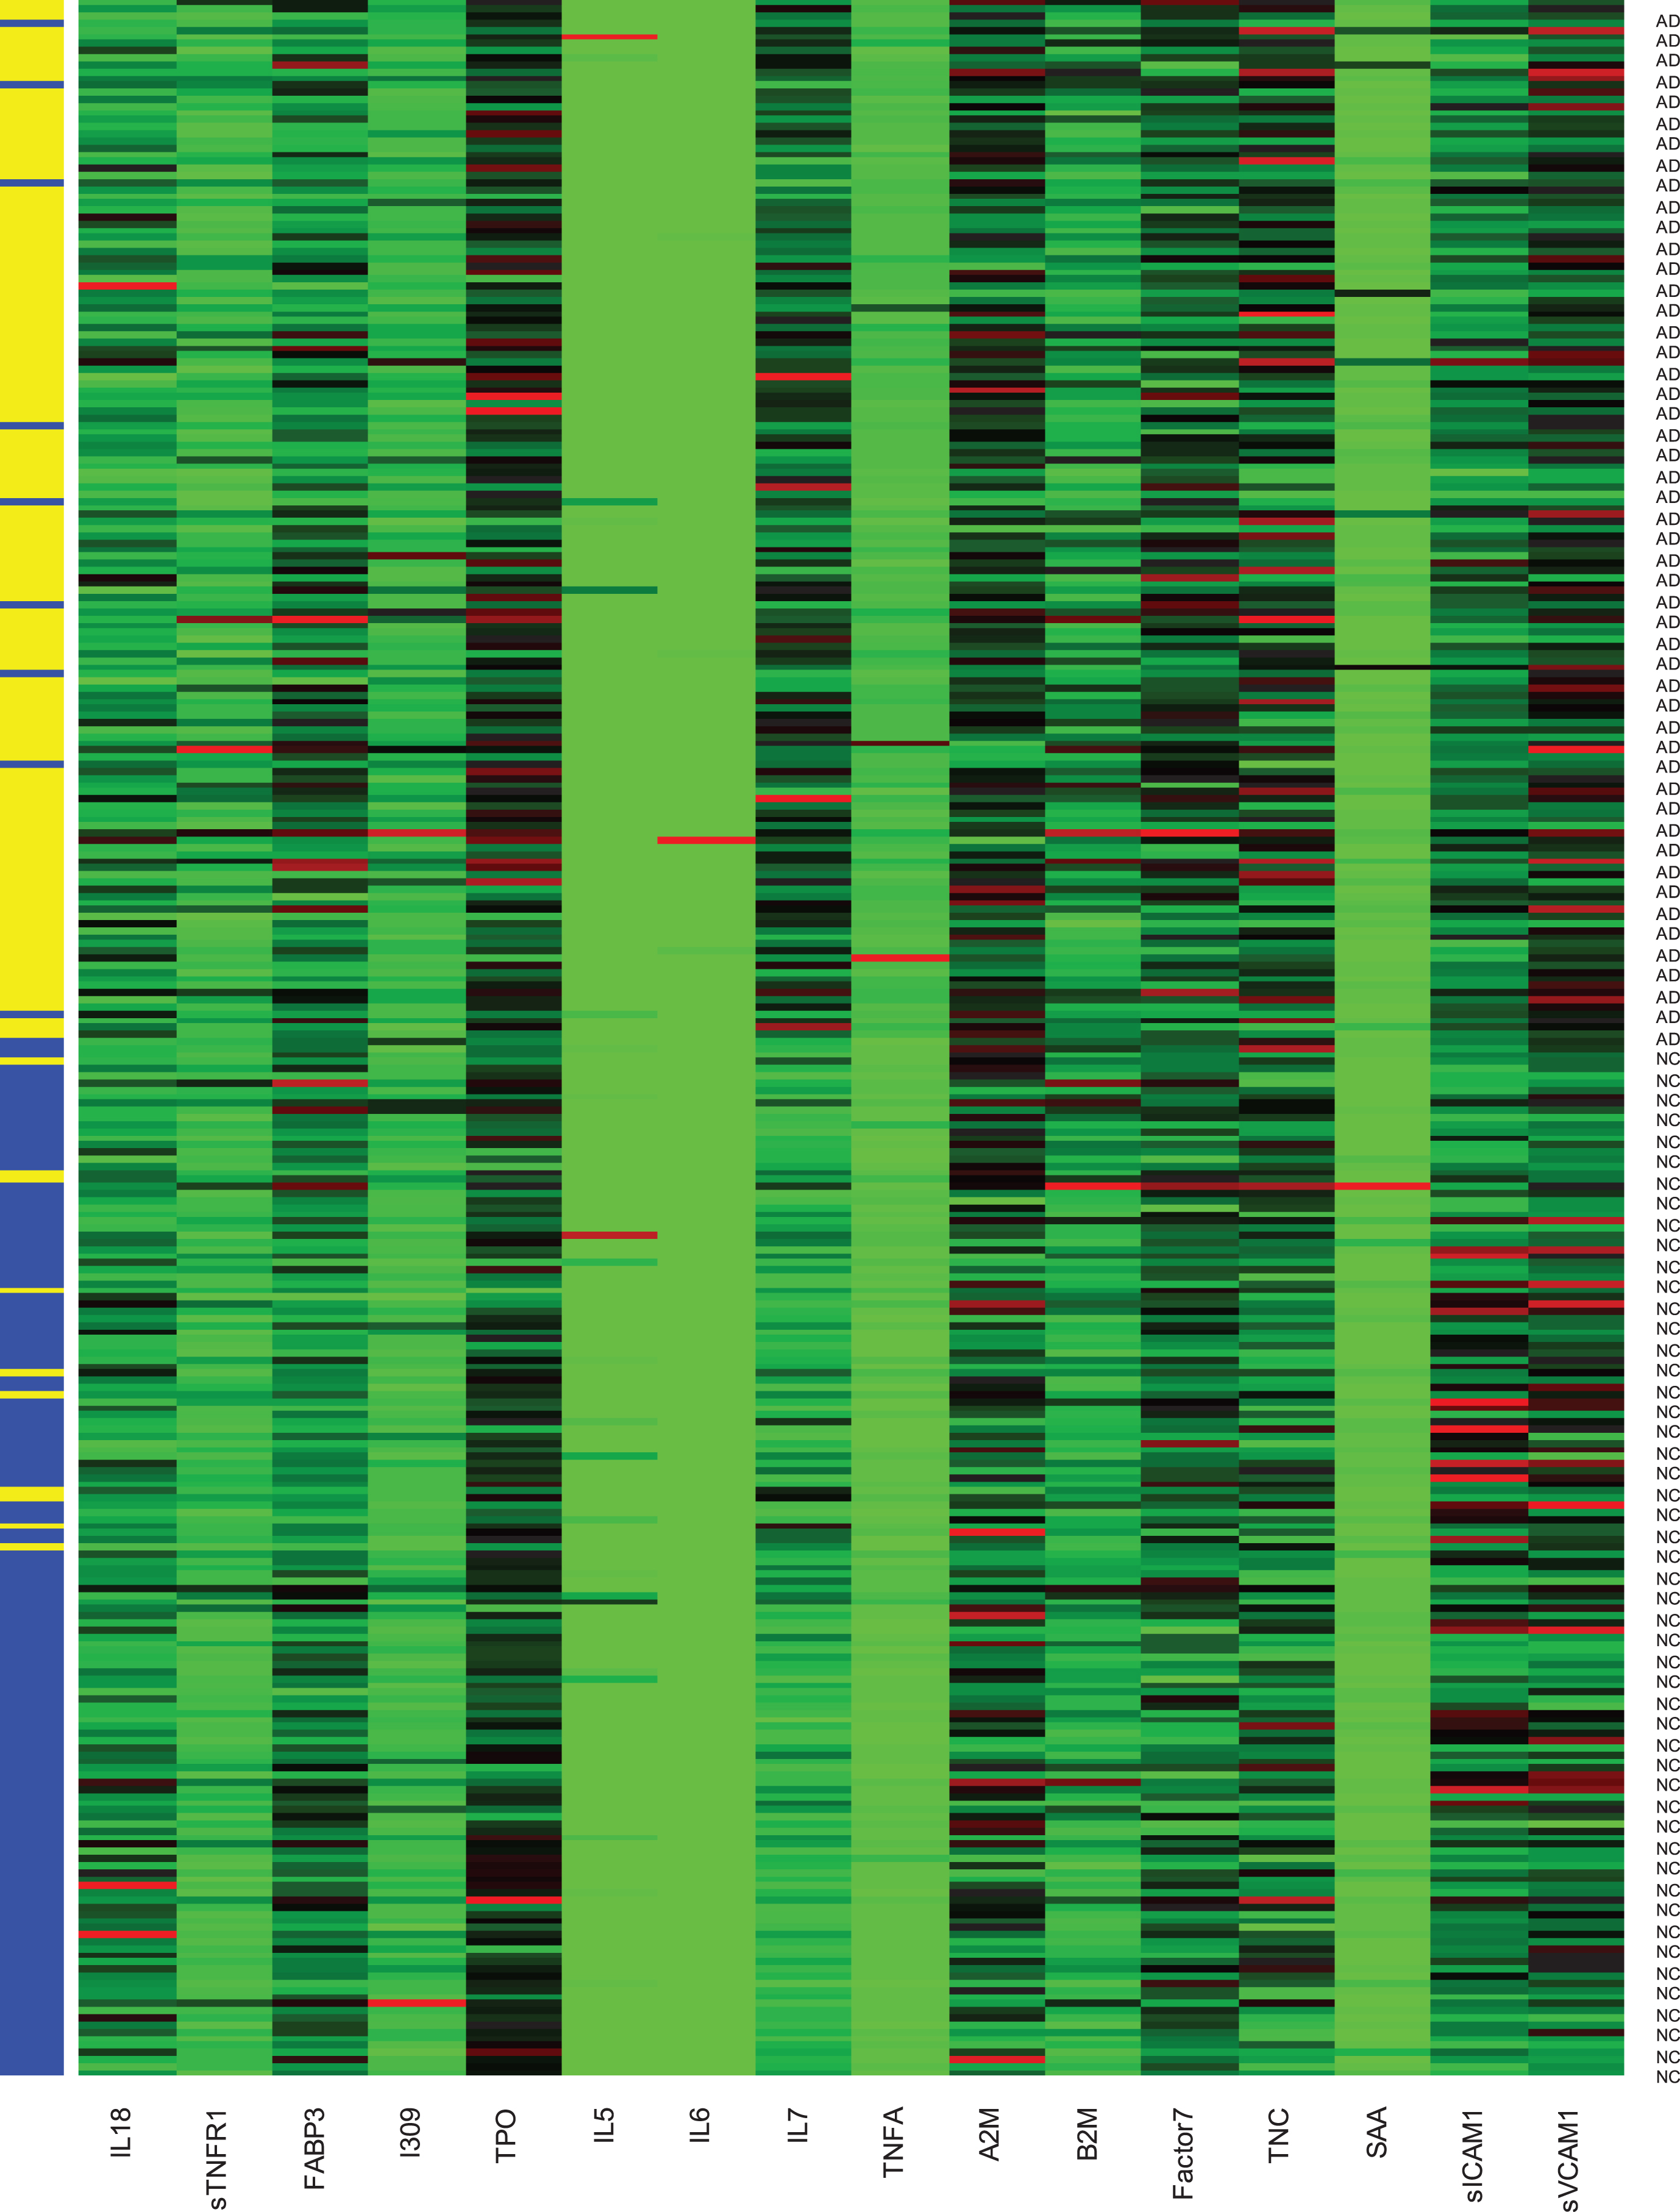
16 biomarkers predicting the AD and normal control samples with five-fold cross-validation.×axis is the 16 biomarkers. Y-axis shows the 150 AD and 150 normal control samples (NC, blue; AD, yellow). The left column means predicted status. The right column is the true status.
Protein changes in the 16-marker panel
Performance comparison of SVM, SVM-RFE, and SVM-RFE-LOO
In order to validate our prediction method, we compared the ROCs for the 16-marker panel determined by the SVM-RFE-LOO with the ROCs for 4 best randomly selected 16-marker panels and 4 worst randomly selected 16-marker panels from the 21 candidate biomarkers (Fig. 3) using the Enumeration Method for Validation described in the method section. As shown in Fig. 3, the 16-marker panel determined by the SVM-RFE-LOO (red solid line) produced the best sensitivity-specificity-tradeoff performance as compared to others chosen randomly from the 21 candidate biomarkers. We checked prediction probability for discrimination power with the 16-marker panel. When we trained SVM with ‘probability = TRUE’, the performance we obtained remained same.
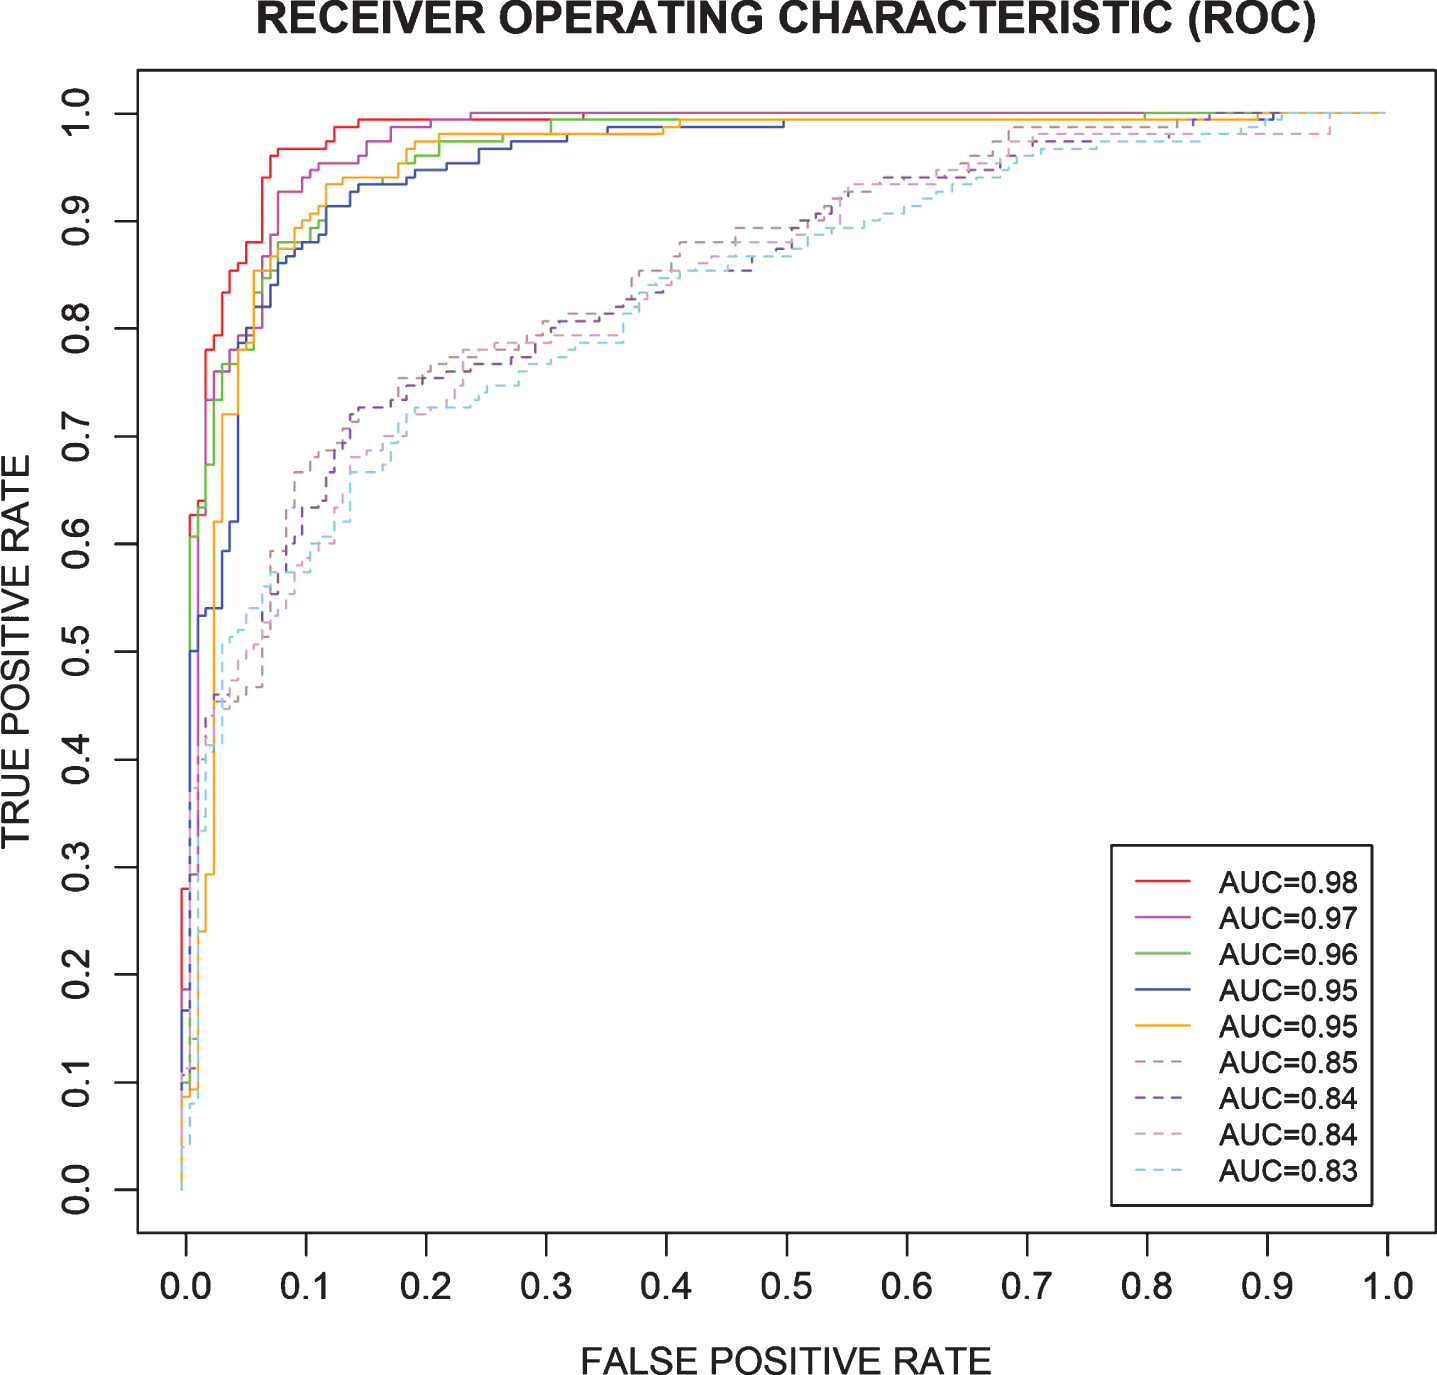
16-marker panel compared to 4 best randomly selected 16-marker panels (solid lines, out of 21 candidates) and 4 worst randomly selected 16-marker panels (dotted lines, out of 21 candidates). The 16-marker panel was compared with the best four 16-marker panels (solid lines) and the worst four 16-marker panels (dotted lines) which were randomly selected out of the 21 candidates.
We also compared the classification and prediction performances of the three algorithms: SVM, SVM-RFE, and SVM-RFE-LOO (Table 3). All three algorithms produced a high performance for the five-fold cross validation of the training set. The SVM-RFE-LOO generated a slightly higher AUC than the SVM-RFE, with the other performances also slightly higher than the SVM-RFE. The SVM method does not eliminate the features and SVM-RFE only eliminates one protein biomarker. The SVM-RFE-LOO reduces the features (i.e., biomarkers) from 21 to 16 with AUC performance increasing from 0.973 to 0.980. p-value for DeLong’s test for ROC curves between SVM-RFE-LOO and SVM-RFE is 0.041485 <0.05. And p-value for DeLong’s test for ROC curves between SVM-RFE-LOO and SVM is 0.03477 <0.05. SVM-RFE-LOO model has a significantly different AUC from SVM-RFE and SVM with p-value < 0.05 (Fig. 4).
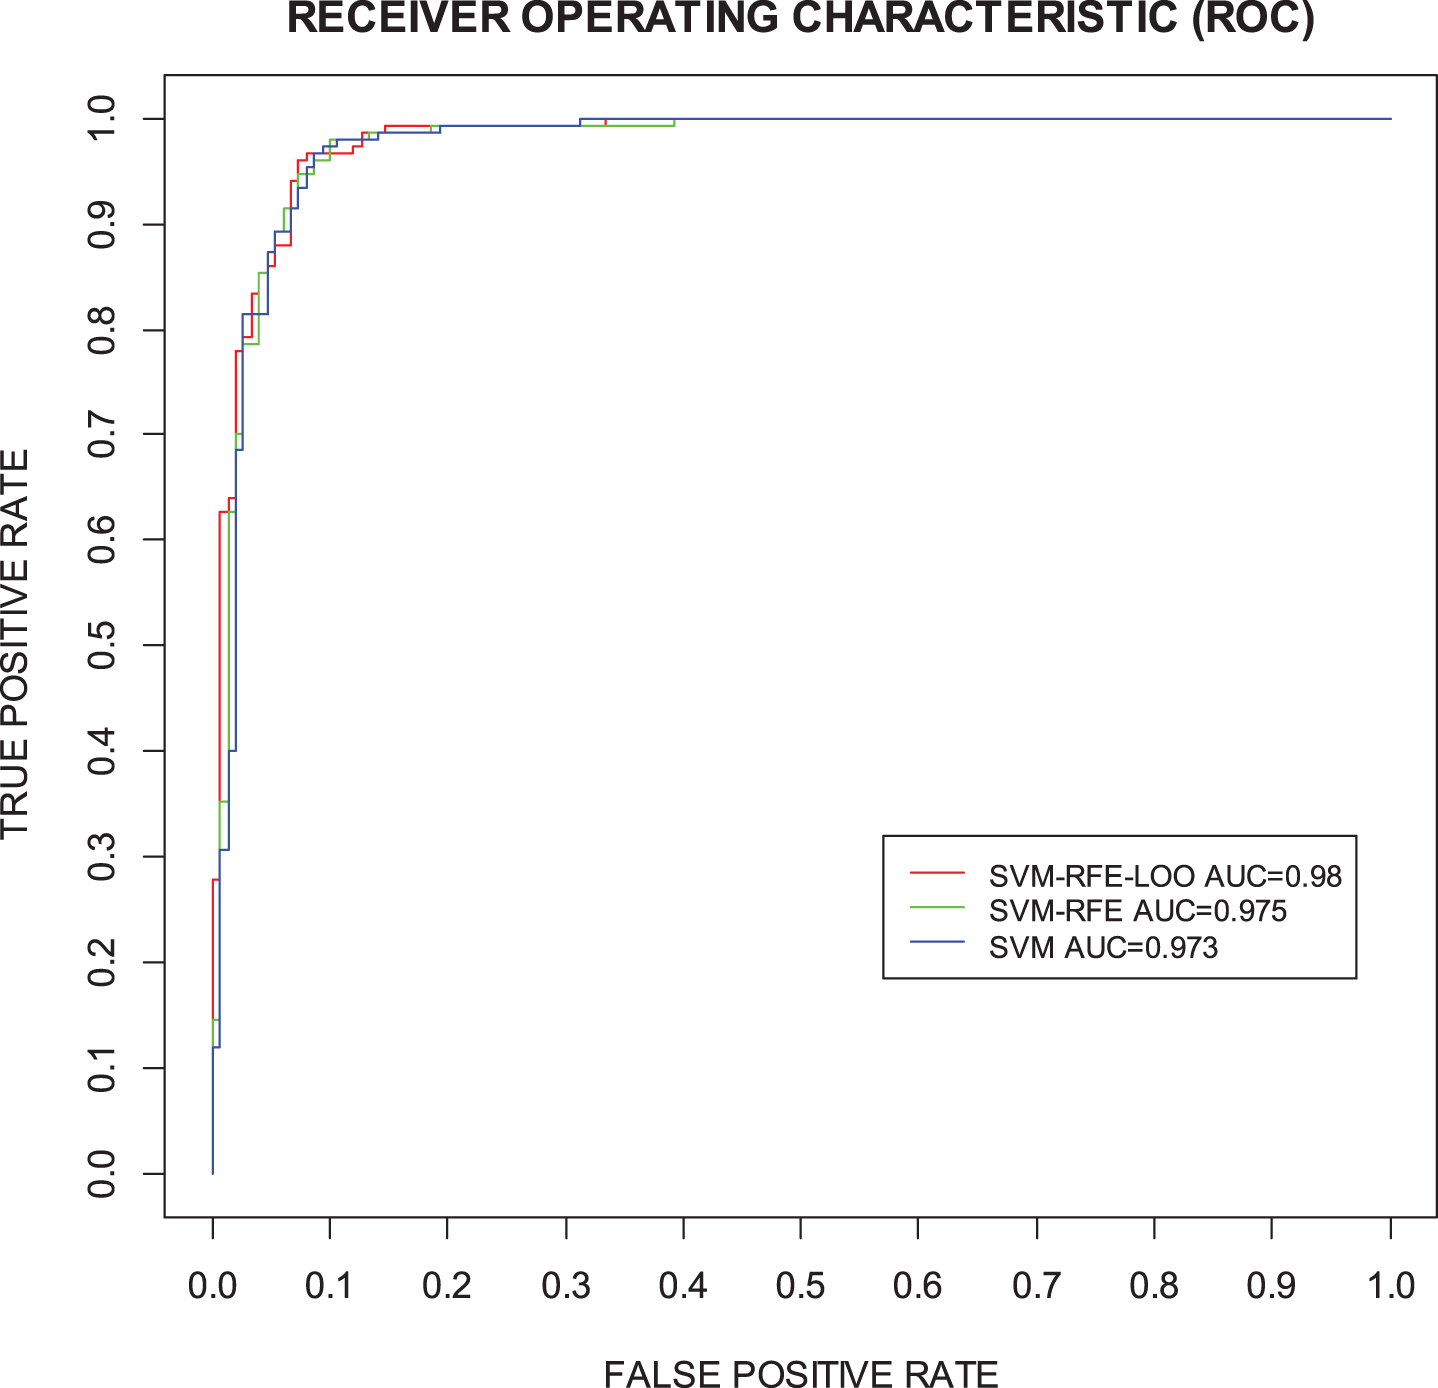
Comparison of ROC curves between SVM, SVM-RFE, and SVM-RFE-LOO.
DISCUSSION
This study identified how the SVM-RFE-LOO approach could improve selection and application of machine learning techniques to detect AD. Our findings outlined a combination of 16 serum biomarkers that could produce AUCs of 97-98% for discriminating AD from NC. When our method is compared to previously published findings, we find that our prediction performance (AUC = 0.980, precision = 93.4%, accuracy = 93.7%, sensitivity = 94.0%, specificity = 93.3%) (Table 3) outperformed the other studies. This could be the result of introducing a more distinct combination of blood-based biomarkers as optimal predictors into our models.
Our study sought to compare our prediction performance using blood-based markers with those utilizing other biomarkers. Eskildsen et al. utilized patterns of cortical thickness as measurements to predict AD among participants with MCI. Despite using a novel technique for pattern recognition of cortical regions between AD and MCI, the authors note accuracy levels of 70% for detecting future onset of AD in 3 years compared to 76% accuracy for detecting onset at 6 months [38]. By adding a feature selection process, the prediction accuracies increased to 73% and 81%, respectively [38]. Ferrarini et al. also utilized neuroimaging markers and trained SVMs in n = 25 ADs and n = 25 NCs cases. This study revealed higher accuracy rates of 90% (sensitivity 92%) for markers in the left hippocampus, and accuracy (and sensitivity) of 80% for markers in the right hippocampus [41]. When compared to prior efforts utilizing multivariate analysis of blood-based biomarkers to classify AD from NC, MCI from NC, and AD from MCI, Fan et al. reported classification accuracies that were comparable to those obtained from neuroimaging markers with AUCs ranging from 74–94%. When expanded to discriminate among MCI cases who progressed to AD versus those who did not progress, the same study team accurately classified 87% of cases [39]. Additional MRI-based work by Duchesne et al. used an Automated Computer Classification (ACC) technique based on SVM and achieved a 92% prediction accuracy for distinguishing n = 75 ADs versus n = 75 NCs [40].
The leave-one-out cross-validation method is an exhaustive cross-validation method, which learns and tests all possible ways to divide the original sample into a training and validation set. For example, leave-p-out cross-validation requires training and validating the model
We have presented an integrated computational approach that combines SVM, LOO, and cross-validation to achieve recursive feature elimination for AD. It automatically learned non-linear relationships between features and outcomes to generate the optimal predictive model with the least number of features, producing an AUC = 0.980 with a sensitivity of 94.0% and a specificity of 93.3% in the data set of n = 150 ADs and n = 150 NCs. SVM-RFE-LOO is an efficient approach for eliminating features from a big dataset for feature selection.
Limitations and potential clinical use of the model and implications for future research
The recursive feature elimination model has several potential applications in the field of clinical trials and research. Feature selection could result in improvements in marker collection, identifying diseases and diagnosis, drug discovery and manufacturing, medical imaging diagnosis, classifier performance, biomarker discovery, improved data interpretation, and treatment development [49]. Clinical trials cost a lot of time and money and can take years to complete in many cases. Applying the recursive feature elimination model to identify most important markers can help researchers find the best trait size to be tested, draw a pool from a wide variety of data points, such as previous doctor visits, social media, etc., and leverage the power of data records to reduce data-based errors. With small modification, this model can even be used for identifying potential clinical trial candidates for personal medicine.
The recursive feature elimination model also has some limitations. One limitation is AUC as measure of performance sometimes may be limited in certain use cases. For example, in case where it may be critical to minimize either false negatives or false positives, AUC is not a useful metric for this type of optimization. Another limitation is errors can occur because of lack of data. If the model is fed poorly, it will yield poor results. The larger the training data, the more viable results produced. To solve these problems, we will have more data in the future and enhance our models with different performance measurement.
Footnotes
ACKNOWLEDGMENTS
Research reported in this publication was supported by the National Institute on Aging of the National Institutes of Health under Award Number R01AG058537. The content is solely the responsibility of the authors and does not necessarily represent the official views of the National Institutes of Health.