
Abstract
Background:
Disturbances in the autophagy/endolysosomal systems are proposed as early signatures of Alzheimer’s disease (AD). However, few studies are available concerning autophagy gene expression in AD patients.
Objective:
To explore the differential expression of classical genes involved in the autophagy pathway, among them a less characterized one, DEF8 (Differentially expressed in FDCP 8), initially considered a Rubicon family member, in peripheral
blood mononuclear cells (PBMCs) from individuals with mild cognitive impairment (MCI) and probable AD (pAD) and correlate the results with the expression of DEF8 in the brain of 5xFAD mice.
Method:
By real-time PCR and flow cytometry, we evaluated autophagy genes levels in PBMCs from MCI and pAD patients. We evaluated DEF8 levels and its localization in brain samples of the 5xFAD mice by real-time PCR, western blot, and immunofluorescence.
Results:
Transcriptional levels of DEF8 were significantly reduced in PBMCs of MCI and pAD patients compared with healthy donors, correlating with the MoCA and MoCA-MIS cognitive tests scores. DEF8 protein levels were increased in lymphocytes from MCI but not pAD, compared to controls. In the case of brain samples from 5xFAD mice, we observed a reduced mRNA expression and augmented protein levels in 5xFAD compared to age-matched wild-type mice. DEF8 presented a neuronal localization.
Conclusion:
DEF8, a protein proposed to act at the final step of the autophagy/endolysosomal pathway, is differentially expressed in PBMCs of MCI and pAD and neurons of 5xFAD mice. These results suggest a potential role for DEF8 in the pathophysiology of AD.
INTRODUCTION
Alzheimer’s disease (AD) is the leading cause of dementia worldwide (60–70%of the cases), affecting an estimated 47 million individuals [1], a number that is predicted to reach 130 million by 2050 [2]. Despite the high prevalence and social burden it poses, no effective treatments or strategies for preventing AD have been found thus far. Mild cognitive impairment (MCI) is the transitional period between healthy aging and dementia, characterized by memory failure, without impairment in usual activities of the patient’s daily life [3, 4]. In a one year follow-up, the conversion rate to dementia is 10–30%, compared to cognitively healthy elders who tend to develop dementia at a rate of 1-2%per year [3, 5–7]. AD is a progressive neurodegenerative disorder in which the histopathological features are present in the brain several years before the first clinical symptoms manifest [3, 8]. The accumulation of dysfunctional organelles in the central nervous system (CNS), such as mitochondria and misfolded proteins, is a characteristic of neurodegenerative diseases, including AD [9–11]. Cell biology studies have proposed disturbances in intracellular vesicle systems responsible for their clearance, specifically autophagy and endolysosomal pathways, as early AD hallmarks [12–19]. Furthermore, genomic and bioinformatic approaches comparing postmortem tissues from AD patients and healthy age-matched individuals have consistently highlighted autophagic and endolysosomal systems as central molecular pathways involved in AD pathogenesis [20–24].
Autophagy comprises a group of three degradation processes that share the lysosome as the final destination. Macroautophagy (hereafter referred to as autophagy) is the only intracellular catabolic system able to deliver to the lysosome soluble and misfolded proteins, protein aggregates, and entire organelles through the de novo formation of a double-membrane vesicle named autophagosome [25, 26]. Once the autophagosome is formed, it must be transported to the perinuclear region, where active lysosomes are placed. The formation, maturation, and the final fusion of the autophagosome with the lysosome are tightly regulated by autophagy-related (ATG) genes [27]. An incomplete autophagic flux due to impairment of the autophagosome fusion with the lysosome or reduced lysosomal activity is associated with neurodegeneration, especially in AD [11, 28–32]. Electron microscopy studies have shown the accumulation of autophagosomes and autolysosomes vesicles in postmortem brain tissues of late-stage AD patients, which were absent in healthy samples [13], suggesting an impairment in the last steps of the pathway. However, the expression profile of autophagy genes in patients with MCI and early AD stages is limited.
Current research defines MCI and AD as systemic diseases, meaning that manifestations at the CNS level could be reflected in other organisms’ systems, with peripheral blood mononuclear cells (PBMCs) being the most representative example of them [33, 34]. To gain some clues regarding autophagy pathway activity at different stages of the disease, we first evaluated the transcriptional levels of genes participating in the autophagy machinery in PBMCs from MCI and probable AD patients (pAD). We assessed the expression of autophagy genes involved in the initial steps of the pathway (ATG5, ULK1, AMBRA1, BECLIN1), the ubiquitin-cargo receptor SQSTM1 (Sequestosome 1 or P62), and genes that participate at the final steps of the pathway (RUBICON, PACER), including a less characterized gene, DEF8 (Differentially expressed in FDCP 8) [35, 36]. Rubicon, Pacer, and DEF8 share a common carboxy-terminal (C-terminal) region containing a Rubicon homology domain (RH), hence were defined as being a protein family [35, 37]. Rubicon and Pacer have been reported to participate in the maturation step of autophagosome and endocytic processes, showing antagonist roles [38, 39]. Mutations in the RUBICON gene were shown to cause a type of recessive ataxia [35, 36], and we recently found reduced levels of PACER in the spinal cord of sporadic amyotrophic lateral sclerosis (ALS) patients [40]. In the case of DEF8, a study has shown increased transcriptional levels in tissues from the SAMP8 (senescence-accelerated mouse-prone 8) mice, a premature-aging model, after treatment with a Chinese neuroprotector tea [41]. However, the profile of DEF8 expression has not yet been explored in AD. Together, these observations suggest a potential role of this family of proteins in neurodegeneration.
In the present work, we found decreased transcriptional levels of DEF8 in MCI and pAD patients. At the protein level, we observed increased levels of DEF8 in lymphocytes from MCI patients compared to controls; interestingly, the levels were similar to controls in pAD. Furthermore, in a transgenic AD mouse model (5xFAD), we found that DEF8 is expressed in neurons and not in glial cells in the brain cortex and hippocampus. DEF8 presented a similar profile of expression in the brain of 5xFAD as in PBMCs of MCI patients: reduced mRNA levels and increased protein levels in transgenic mice compared to wild-type mice. To our knowledge, this is the first study exploring DEF8 expression in MCI or pAD patients and its cell-expression in brain tissues.
MATERIALS AND METHODS
Subjects
Forty-eight individuals, 19 healthy controls (HC), 21 MCI, and 8 pAD, were recruited. The definitive diagnosis of AD is based not only on the clinical examination but also on biomarker measurement or postmortem evaluation. For that reason, in this case, the correct classification is pAD [8]. The present study was carried out following the recommendations of the Ethics Committee of the Hospital Clínico de la Universidad de Chile (HCUCh) (HCUCh Human Subject Protocol Number #082). All subjects gave written informed consent under the Declaration of Helsinki. AD diagnosis was established following the Alzheimer’s Association guidelines and the National Institute on Aging [42]. Dementia severity was evaluated with the Clinical Dementia Rating scale (CDR), the Montreal Cognitive Assessment (MoCA) [43] test, validated in Spanish in our country [44], and the Montreal Cognitive Assessment Memory Index Score (MoCA-MIS) (34). Early pAD was defined as CDR 1. The maximum score for MoCA is 30, with lower scores associated with more significant cognitive deterioration. The MoCA-MIS score ranging from 0 to 15 was calculated by adding the number of words remembered in free delayed recall multiplied by 3, category-cued recall multiplied by 2, and multiple-choice–cued recall multiplied by 1 [34]. HCs were submitted to the same neurological and neuropsychological evaluations. Table 1 shows the demographic data of the study participants.
Reference line characteristics of the population
CDR, clinical dementia rating; HC, healthy control; MCI, mild cognitive impairment; MoCA, Montreal Cognitive Assessment; MoCA-MIS, Montreal Cognitive Assessment Memory Index Score, SEM, standard error of the mean.
PMBCs extraction from human donors
The extraction of PMBCs was performed from peripheral blood collected in sodium heparin vacutainer tubes, according to [45, 46]. Blood samples were taken between 10 and 12 AM in non-fasting patients. Briefly, cells were separated from whole blood by Ficoll-Hypaque density centrifugation, and mononuclear cells (Lymphocytes-Monocytes) were rescued. Three million cells were preserved in 1 ml of TriZol (Ambion) and stored at –80°C for mRNA extraction or cryopreserved in fetal bovine serum and 10%dimetilsulfóxido (DMSO) for flow cytometry assay.
Extraction of mRNA
Total mRNA was isolated using TriZol reagent (Thermo Fisher). A DNAase digestion step with TURBO DNA- freeTM Kit was included to remove any genomic DNA contamination. The 260/280-abs-orbance ratio assessed RNA purity. The quality and quantity of RNA in all participants were confirmed. cDNA was synthesized from total RNA (1μg) using the High Capacity cDNA Reverse Transcription Kit (Thermo Fisher) in the T100TM Thermal Cycler (Bio-Rad).
Real-time PCR
Real-time quantitative PCR (qPCR) was perfor-med in an amplification system CFX96 TM Real-time System, using the DNA binding dye SYBR Green (Bio-Rad). A CFX96 real-time PCR detection system (Bio-Rad) was used to assess the mRNA levels of ULK1, BECLIN1, ATG5, AMBRA1, P62, PACER, RUBICON, DEF8, and the two housekeeping genes (SDHA and 18S). For mouse samples, actin was used as a housekeeping gene. The sequences of the primers are described in Table 2. Transcript levels were quantified by using the ΔCt value method. RT-PCR conditions were: 1 cycle at 95°C for 3 min, followed by 40 cycles at 95°C for 30 s.
Sequences of the primers used in the study
Flow cytometry assay of PBMCs
Flow cytometry was performed from cryoprese-rved PBMCs extracted from human blood samples resuspended in a PBS solution supplemented with 10%fetal bovine serum. PBMCs were washed with PBS 3%FBS and fixed using the Cytofix-Cytope-rmTM kit (BD Biosciences). Lymphocytes and granulocytes were morphologically different and easily detected in the FSC and SSC flow parameters. Antibodies used for DEF8 were (anti-DEF8, Byorbit, rabbit, 1:50), and the secondary, anti-rabbit Alexa 488 (Thermo Fisher Scientific, A27034, 1:1000). Cells were incubated with a specific antibody for detecting Def8 for 16 h at 4°C, and then the samples were washed twice with PBS 3%FBS. The secondary sta-ining was performed in PBS 3%FBS for 1 h at room temperature and washed twice with PBS 3%FBS. Finally, the analysis was performed using a Cytoflex (Beckman Coulter) flow cytometer and FlowJo software v10.0.10. The cell population considered by each sample for the analysis was 100,000 cells.
Transgenic AD mouse model
As an AD animal model, we employed the 5xFAD mouse model (006554, B6SJL-Tg APPSwFlLon, PSEN1*M146L*L286V) 6799Vas/Mmjax), which overexpresses the human APP gene, containing the Swedish, Florida, and London FAD mutations along with human PS1 harboring two FAD mutations [47]. As a result, 5xFAD mice start to develop Aβ aggregates at the age of 60 days with the presence of Aβ senile plaques. By the age of 120–240 days old, a substantial increase of aggregates, together with neuronal loss, synaptic degeneration, neuroinflammation, and cognitive impairment can be described. Also, the presence of intraneural APP fragments is reported. We employed six animals per group, together with age- and sex-matched littermate controls. At different time-points (60 and180 days of age), mice were sacrificed by isoflurane anesthesia and perfused with PBS 1X. After dissection, brains were separated into two equal portions, one hemisphere for (i) histology and the other for (ii) biochemical assays. Analyzed brain structures in this study were the hippocampus and cortex. For biochemical assays, tissues were resuspended in PBS 1X with protease inhibitors (Thermo Fisher) and then maintained at –80°C until use. The animal care and all animal experiments were performed according to procedures approved by “Guide for the Care and Use of Laboratory Animals” (Commission on Life Sciences, National Research Council. National Academy Press 2011) and approved by the Bioethical Committee of the Universidad Mayor (Protocol #03/2016E2).
Mouse samples histology
Brain samples, once extracted, were fixed in 4%PFA for 24 h. Next, tissues were dehydrated, cleared in xylene, and embedded in paraffin by the Thermo Scientific™ STP 120 tissue processor. Using the Thermo Scientific™ HistoStar equipment, the tissues were included in paraffin molds. Coronal sections of 10μm were obtained using the Leica RM2125 RTS Thermo Scientific™ HM 325 microtome. The tissues were recovered from the flotation bath at 40°C Leica HI1210 on 76×26 mm Star Frost loaded slides (Knittel Glass) and subsequently dried at 60°C for 2 h. Next, the brain slices were dewaxed and hydrated. For immunofluorescence, epitopes were exposed with citrate buffer at 96°C for 1 h. After this, slides were washed three times, with 0.05%Tween20 in PBS 1X, as previously described [40]. The blocking of non-specific binding sites was done with 3%BSA in PBS 1X solution for 40 min at room temperature. Slides were incubated with primary antibodies diluted in 3%BSA–0.05%Tween20 in PBS solution overnight at 4°C. Primary antibodies and dilutions were as follows: anti-DEF8 (Byorbit, rabbit, 1:100); anti-GFAP (EMD Millipore Corp., rabbit 1:1000); and anti-NeuN (EMD Millipore Corp., mouse, 1:1000). Secondary antibodies and dilutions were: anti-mouse Alexa 555 (Thermo Fisher Scientific, 1:1000) and anti-rabbit Alexa 488 (Thermo Fisher Scientific, 1:1000) prepared in a 3%BSA–0.05%Tween20 in PBS 1X solution with DAPI (Invitrogen, 1:10000), incubated for 2 h. For DEF8 and Thioflavin S (ThS) staining, sections were incubated in ThS solution (Sigma, 0.025%in 50%ethanol) after the secondary incubation for 10 min [48]. Then, the slides were washed and mounted with Fluoromount-G (Invitrogen). Sections were dehydrated in graded ethanol, cleared in xylene, and coverslipped with Entellan mounting medium (Merck). All samples were analyzed using an inverted microscope (Leica Dmi8), and then quantification analysis was performed using the ImageJ software. Images were taken with a Leica TCS SP8 confocal microscope with 40X and 63X objective magnifications. ImageJ (NIH) and LAS X software were used to process the stacked images.
Western blot
Protein extracts were solubilized in RIPA 1x buf-fer. Protein quantification was performed with the BCA kit (Visual Protein), and SDS-Page was carried out. We used specific antibodies to detect DEF8 (anti-DEF8, Biorbyt, rabbit, 1:1000), Rubicon (anti-Rubicon, Invitrogen, rabbit, 1:2000), Pacer (an-ti-Pacer, Abnova, rabbit, 1:1000), and β-actin (Cell signaling, rabbit, 1:10000) protein levels (as a lo-ading control). A secondary HRP-conjugated anti-rabbit (Life Technologies, 1:3000) antibody was employed. Images were obtained using ChemiDoc Imaging Systems (Bio-Rad).
Statistical analysis
The statistical analysis used to compare the expression of each of the genes between the different groups was performed using the Mann-Whitney test. The evaluation of the correlation between gene expression and the scores on the MoCA and MoCA-MIS test was carried out through the Spearman correlation test. To perform this analysis, all patients were grouped according to their cognitive test scores. To evaluate the results obtained from the flow cytometry, the Kruskal-Wallis test was carried out. All tests performed corresponded to non-parametric analysis. N indicates the number of biological replicates. On all graphs, error bars represent SEM (standard error for the media). GraphPad Prism software was used for statistical analysis.
RESULTS
Demographic and baseline characteristics
According to the CDR scale, the cognitive status was stratified as CDR 0 for HC individuals, CDR 0.5 for MCI patients, and CDR 1 for pAD patients. There were no significant differences in the age of patients between the different groups. The scholarship analysis between groups showed that patients with MCI had a significantly lower educational level than HC, and there was a tendency for lower education in the pAD group, without significant differences between the MCI and pAD groups. The MoCA and MoCA-MIS scores of the three groups were significantly different. The MCI group had significantly better MoCA and MoCA-MIS scores than pAD patients. There were no significant differences between groups in the prevalence of hypertension, insulin resistance/diabetes, or smoking. Regarding anti-dementia treatment, no significant differences between groups were observed (Table 1). Nevertheless, few patients were taking anti-dementia medications since the Government does not subside them in Chile.
A transcriptional profile of autophagy genes shows DEF8 as a differentially expressed gene in PBMCs of MCI and early probable AD patients
To assess the expression of autophagy genes at the earlier stages of the AD process in humans, we evaluated transcriptional levels of genes involved in autophagy machinery in PBMCs of MCI and pAD patients. We present the results in the canonical order of participation of proteins in the autophagic pathway. ULK1 is an orthologue of the yeast Atg1 that participates in the autophagosome initiation process [49]. We found lower levels of expression of ULK1 mRNA in PBMCs of MCI compared to pAD patients (Fig. 1A, p = 0.0308). A similar expression profile was observed for ATG5, a protein that participates in a complex with ATG12, critical for the autophagosome formation (Fig. 1C, p = 0.0159). However, ATG5 transcriptional levels were decreased in MCI individuals compared to HC as well (p = 0.0437). No significant differences in transcriptional levels between groups were observed for the other autophagic gene expressions examined, such as BECLIN1 (Fig. 1B), a protein that participates in two different complexes in the autophagy machinery [50, 51], AMBRA1 (Fig. 1D), a gene that participates with BECLIN1 at the nucleation complex [52], or SQSTM1/P62 (Fig. 1E), that encodes the selective autophagy receptor P62. We then evaluated the expression of genes involved in autophagosome vesicle maturation and fusion with the lysosome; two steps proposed to be impaired in AD [19, 53]. PACER is a protein with sequence homology with RUBICON that was recently revealed to positively regulate autophagosome maturation by interacting with UVRAG and BECLIN1 [38, 39]. We have also shown that PACER is essential for proteostasis in mutant proteins linked to ALS [40]. Levels of mRNA PACER were not changed between groups (Fig. 1F). RUBICON is a negative regulator of the autophagy maturation process that was shown to contrast PACER and UVRAG activity. Like PACER, we did not observe any significant RUBICON expression differences between groups (Fig. 1G). Finally, we explored the levels of DEF8, a less characterized protein that shares domains with RUBICON and PACER, and that is involved in lysosomal movement [37, 54]. We obs-erved a reduced expression of DEF8 in MCI and pAD patients (Fig. 1H, p = 0.0463 MCI versus HC and p = 0.0407 pAD versus HC). Also, we assessed whether there were correlations between the MoCA and MoCA-MIS scores and the gene expression values. Our results show a significant positive relationship (Spearman correlation) between the scores in the MoCA and MoCA-MIS neurocognitive tests with mRNA DEF8 expression (Table 3), in which lower levels of mRNA DEF8 expression correlated with worse MoCA and MoCA-MIS scores. No significant correlations were found for ULK1, BECLIN, ATG5, AMBRA1, P62, PACER, or RUBICON (Table 3). Overall, our results show an increased transcriptional expression of genes involved in autophagy’s initial steps in pAD patients. Instead, genes of the final steps were not significantly changed, except for DEF8, whose expression in PBMCs from MCI and pAD was reduced. We, therefore, explored DEF8 protein levels in the same patients.
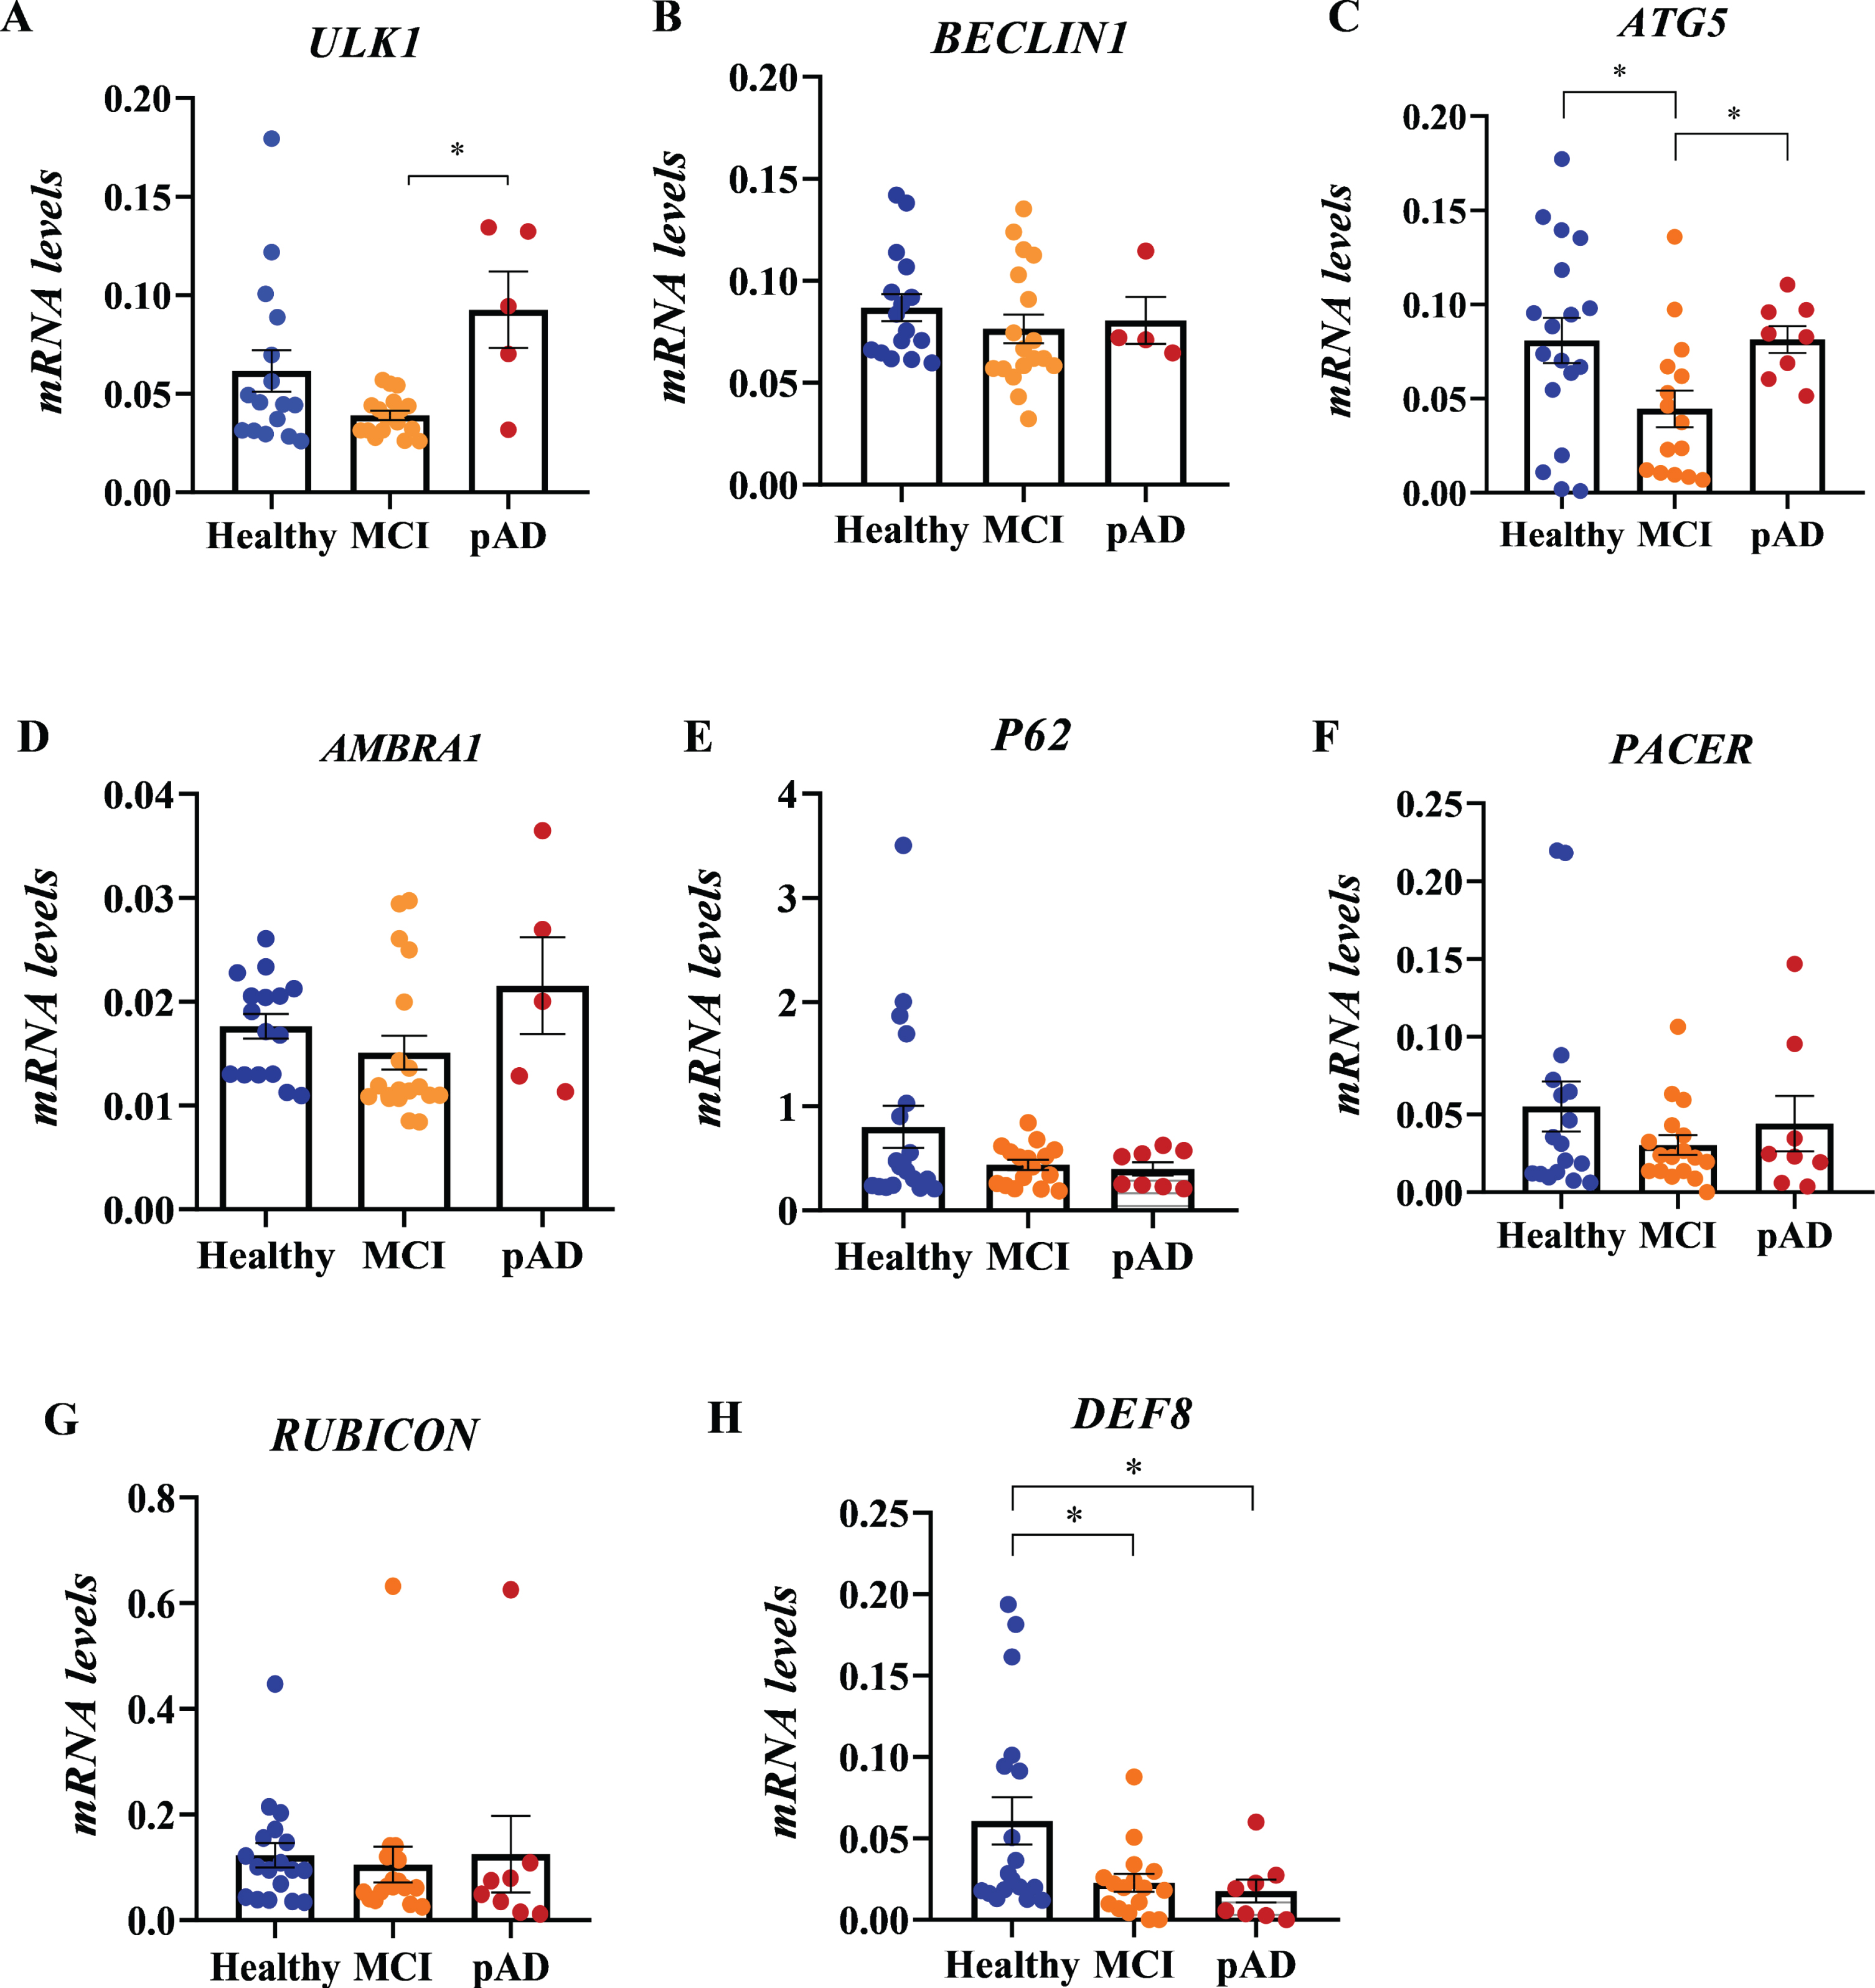
Transcriptional profile of autophagy genes in PBMCs from MCI and probable AD patients. Relative mRNA levels of ULK1 (A), BECLIN1 (B), ATG5 (C), AMBRA1 (D), P62 (E), PACER (F), RUBICON (G), and DEF8 (H) in PBMCs from healthy control (HC, n = 19), mild cognitive impairment (MCI, n = 21), and probable AD patients (pAD, n = 8) were determined by quantitative PCR. 18S and SHDA were used as housekeeping genes. Data shown are mean±SEM, *p < 0.05.
Correlation between gene expression and neurocognitive test scores
MoCA, Montreal Cognitive Assessment; MoCA-MIS, Montreal Cognitive Assessment Memory Index Score.
DEF8 protein levels are increased in lymphocytes from MCI patients
We assessed the protein levels of DEF8 in PBMCs samples by flow cytometry. As shown in Fig. 2A, the populations of interest within each sample were selected according to their morphology (lymphocytes and granulocytes), discarding the population presumably unviable (cell debris). Once the populations to be studied were selected, the percentage of positive staining cells and the mean mark of the sampled cells were analyzed. In MCI lymphocytes, there was an increase in the percentage of positive cells (Fig. 2B, C, p = 0.0294) and in the mean mark in each cell compared to the HC group (Fig. 2E, p = 0.0325). Instead, the levels of DEF8 in pAD patients were similar to HC donors. Regarding the results obtained from the granulocytes analysis, there were no significant differences between groups in the percentage of positive staining cells for DEF8 (Fig. 2D). However, we observed a significant increase in the mean mark in granulocytes from early AD patients (Fig. 2F, p = 0.0225). DEF8 protein levels were not correlated with neurocognitive test scores (data no show). Thus, despite the reduced transcriptional levels of DEF8 in total PBMCs (Fig. 1H), protein levels of DEF8 were augmented approximately five times in lymphocytes from MCI patients (Fig. 2C).
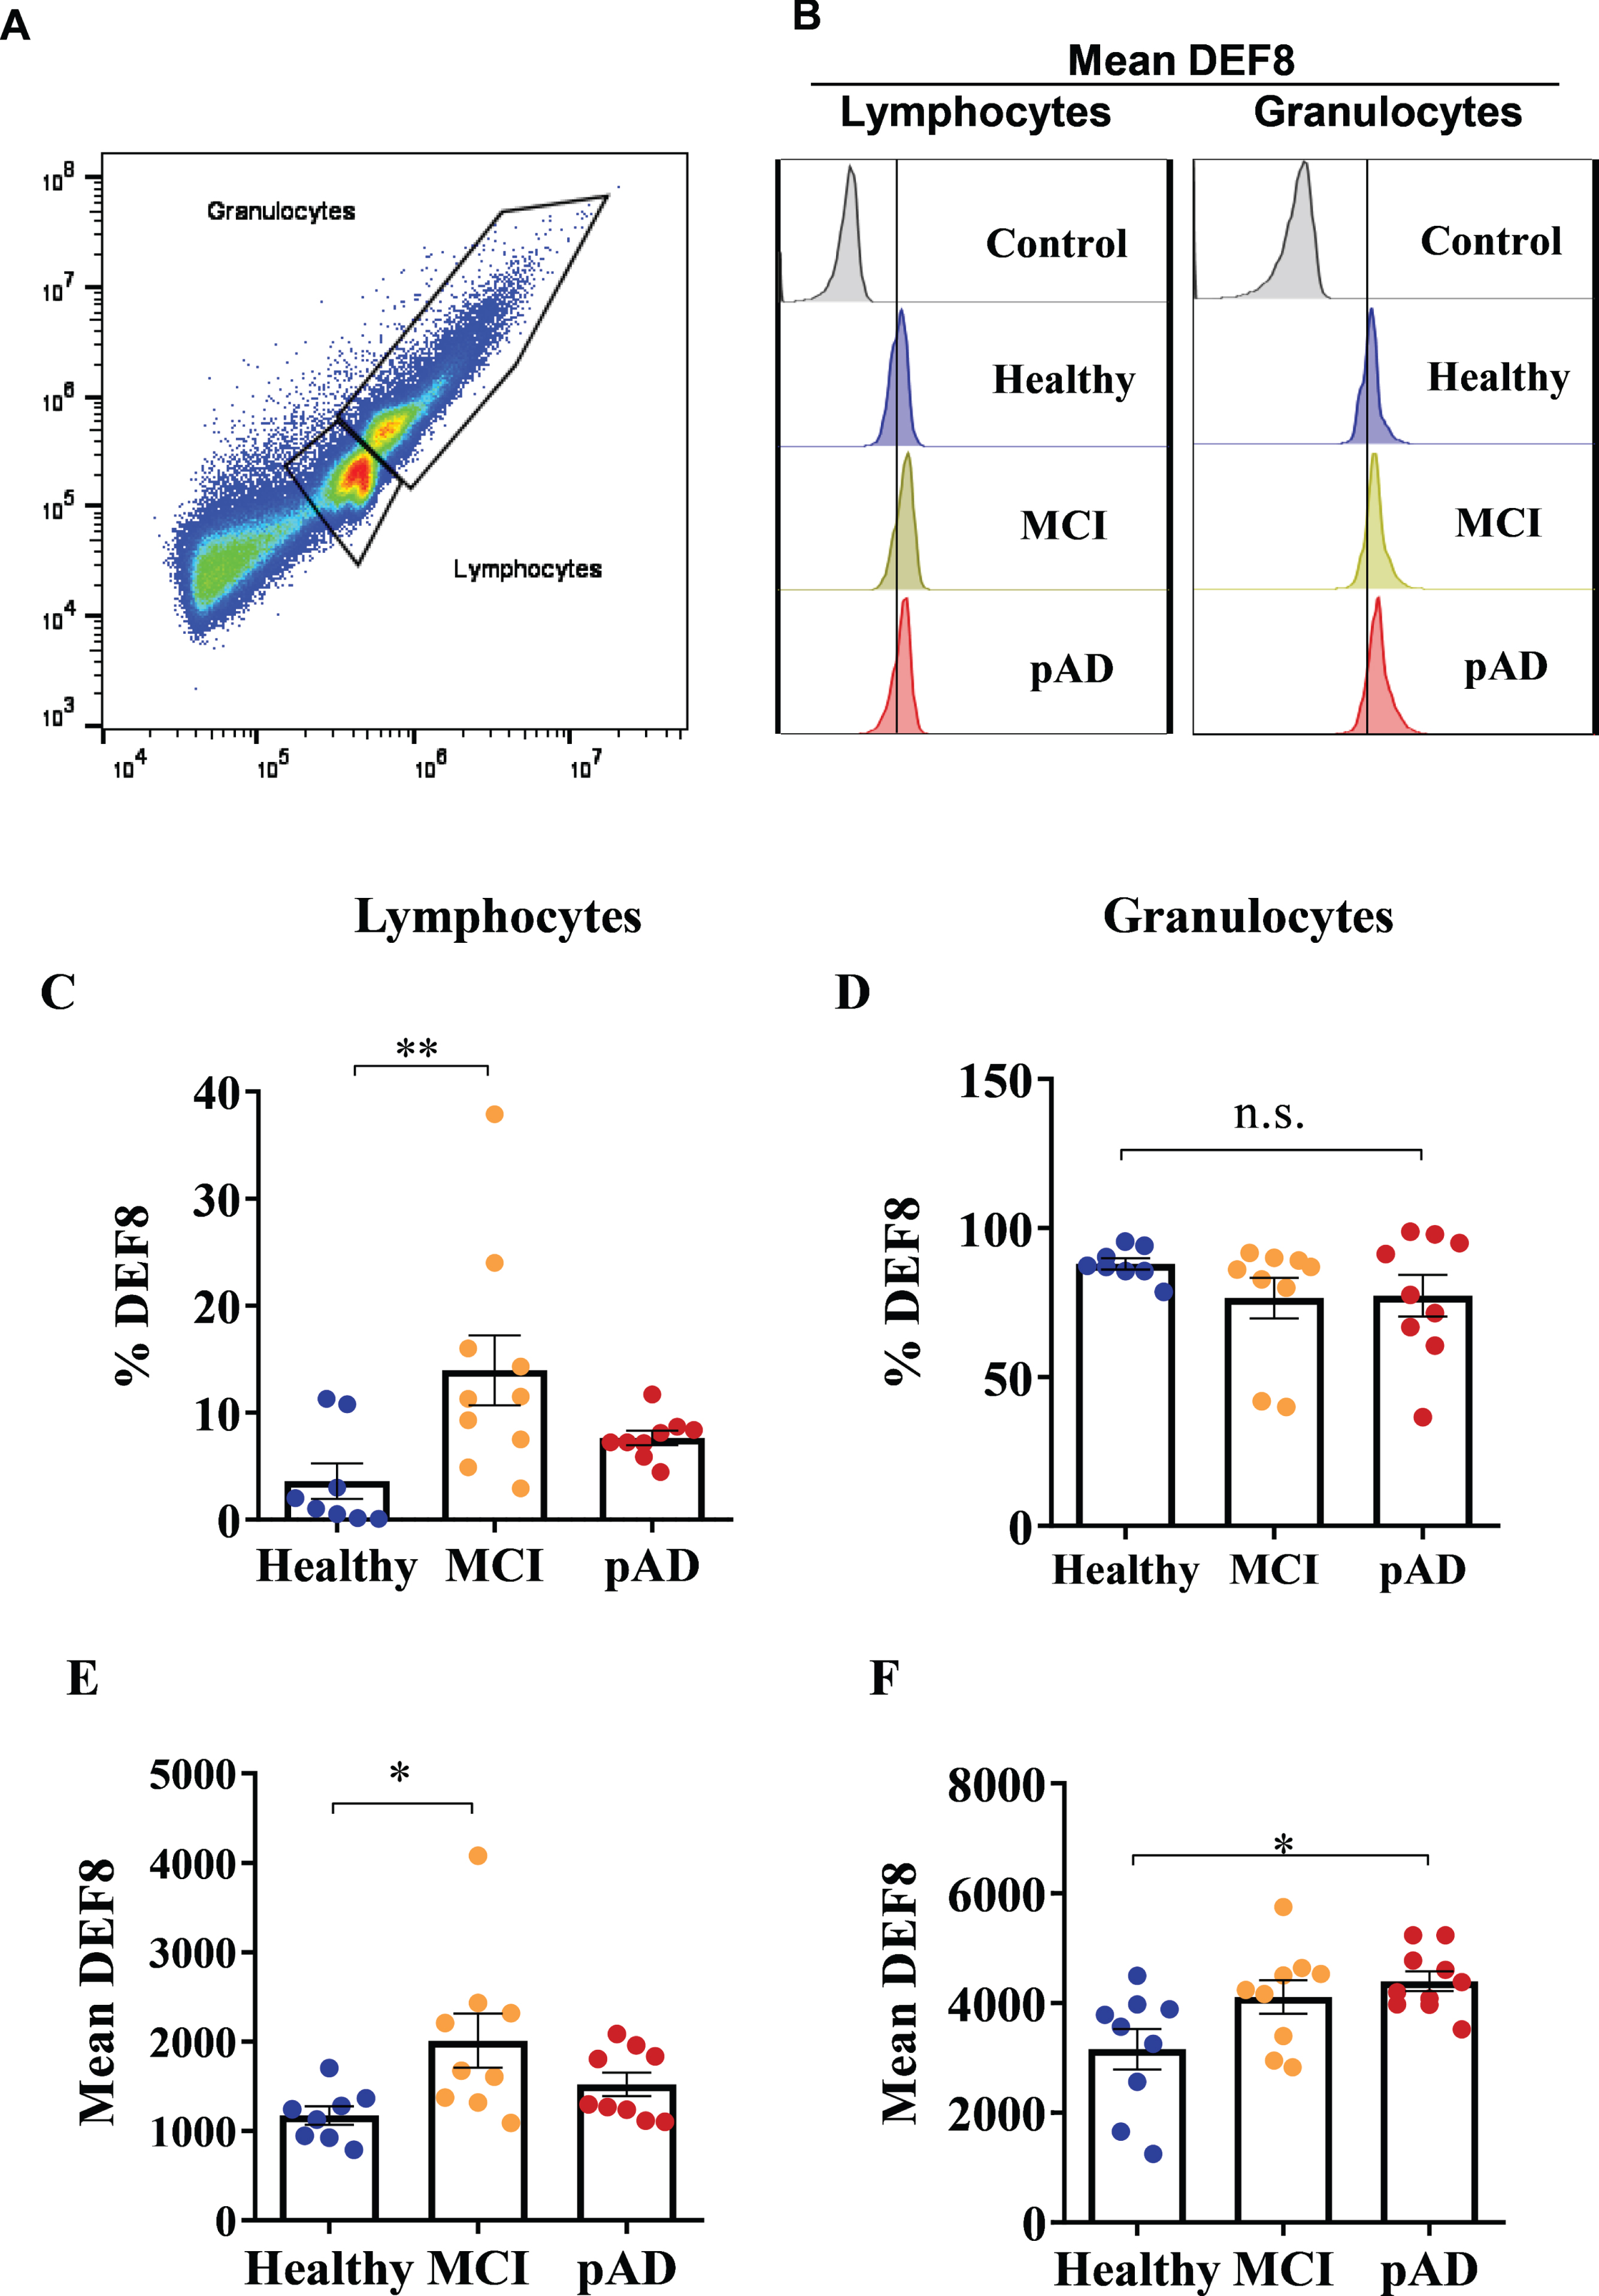
DEF8 protein levels in lymphocytes and granulocytes from MCI patients and probable AD patients. A) Selection of lymphocytes and granulocytes populations by flow cytometry. B) Representative fluorescence histogram of mean DEF8 in healthy control (HC, blue), MCI patients (yellow), and probable AD patients (pAD, red) in lymphocytes (left panel) and granulocytes (right panel). A shift of the fluorescence peak can be observed in lymphocytes and granulocytes of MCI and probable AD patients compared to healthy control. C, D) Percentage of positive DEF8-staining lymphocytes (C) and in granulocytes (D). E, F) DEF8-mean mark in lymphocytes (E) and granulocytes (F). Data shown are mean±SEM, *p < 0.05, **p < 0.005.
DEF8 has a neuronal profile, and its levels are increased in a transgenic mouse model of AD
Next, we evaluated the expression profile of DEF8 in brain tissues derived from the AD mouse model at different ages (60 and 180 days old). 5xFAD mouse model is based on human APP and PSEN1 mutations, partially recapitulating the Aβ plaque pathology from AD brains. For that purpose, we performed immunofluorescence staining and confocal microscopy of brain tissues from 60-day-old 5xFAD mice and age-matched wild-type (Non-Tg) littermates to assess DEF8 cell-expression. DEF8 was expressed preferentially in the cortex’s neurons in both conditions (Fig. 3A), presenting a cytoplasmatic profile, with no detection in astrocytes (Fig. 3B). We detected the same DEF8 expression profile in symptomatic 180-day-old mice, both in the brain cortex (Supplementary Figure 1) and hippocampus samples from wild-type and 5xFAD mice (Supplementary Figure 2).
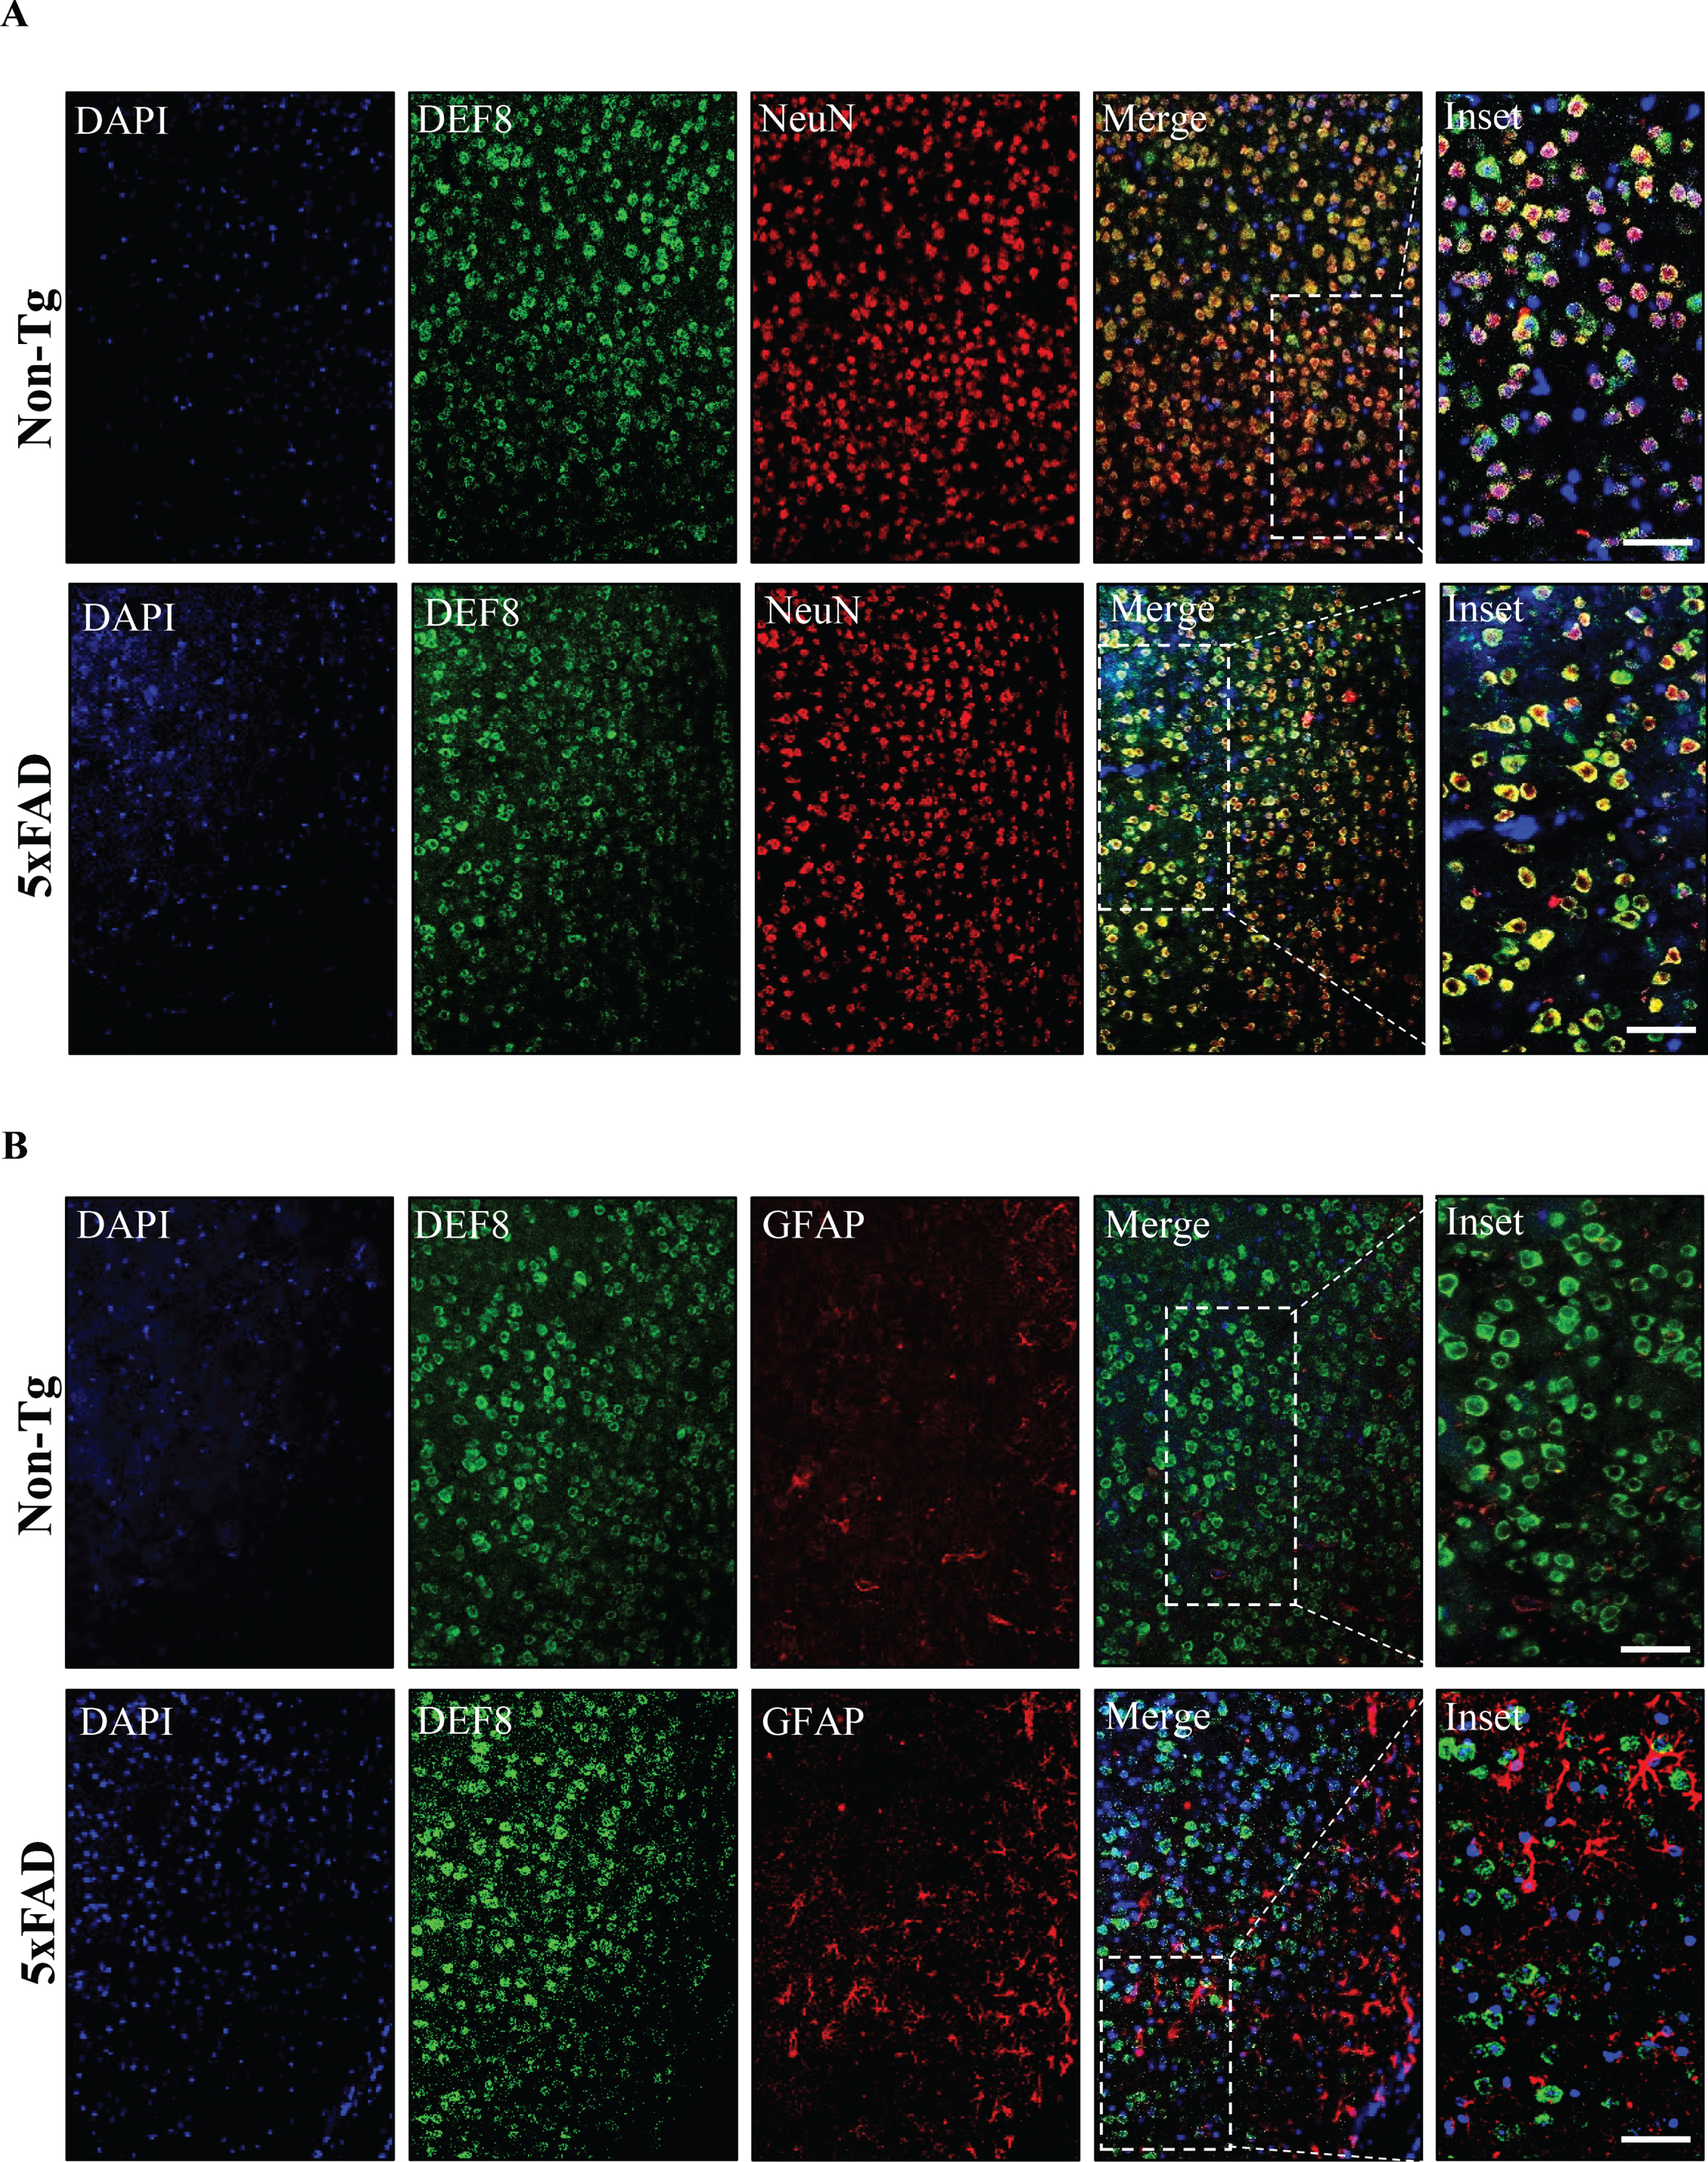
DEF8 immunofluorescence expression in the brain cortex of wild-type and 5XFAD mice at the early stages of the disease. Confocal microscopy of cortex sections of 60 days old wild-type (Non-Tg, upper panels) and age-matched 5xFAD mice (lower panels). A) Z-stack of confocal images showing detection of DEF8 (green), the neuron marker NeuN (red), or the (B) astrocytes marker GFAP (red) by immunofluorescence. Nuclei are stained with DAPI. Images are representative of at least three animals for each genotype. Scale bar: 50μm.
We also visualized DEF8 expression in the brain cortex and hippocampus samples co-stained for ThS to visualize amyloid plaques (Fig. 4A, control images in Supplementary Figure 3). Finally, we asked if the protein level of DEF8 was changed in 5xFAD compared to age-matched wild-type mice. Western blot experiments showed a significant increase in DEF8 levels in transgenic 5xFAD mice’s cortex compared to wild-type littermates at 180 days of age (Fig. 4B), while DEF8 transcriptional levels were reduced in transgenic mice (Fig. 4F). In the same samples, we found increased Rubicon levels in transgenic mice compared to wild-type animals (Fig. 4B, D), as already reported in a different AD model [55], while there were no differences for Pacer (Fig. 4B, E). Taken together, our results show that DEF8 is mainly a neuronal protein, with increased protein levels compared to wild-type mice.
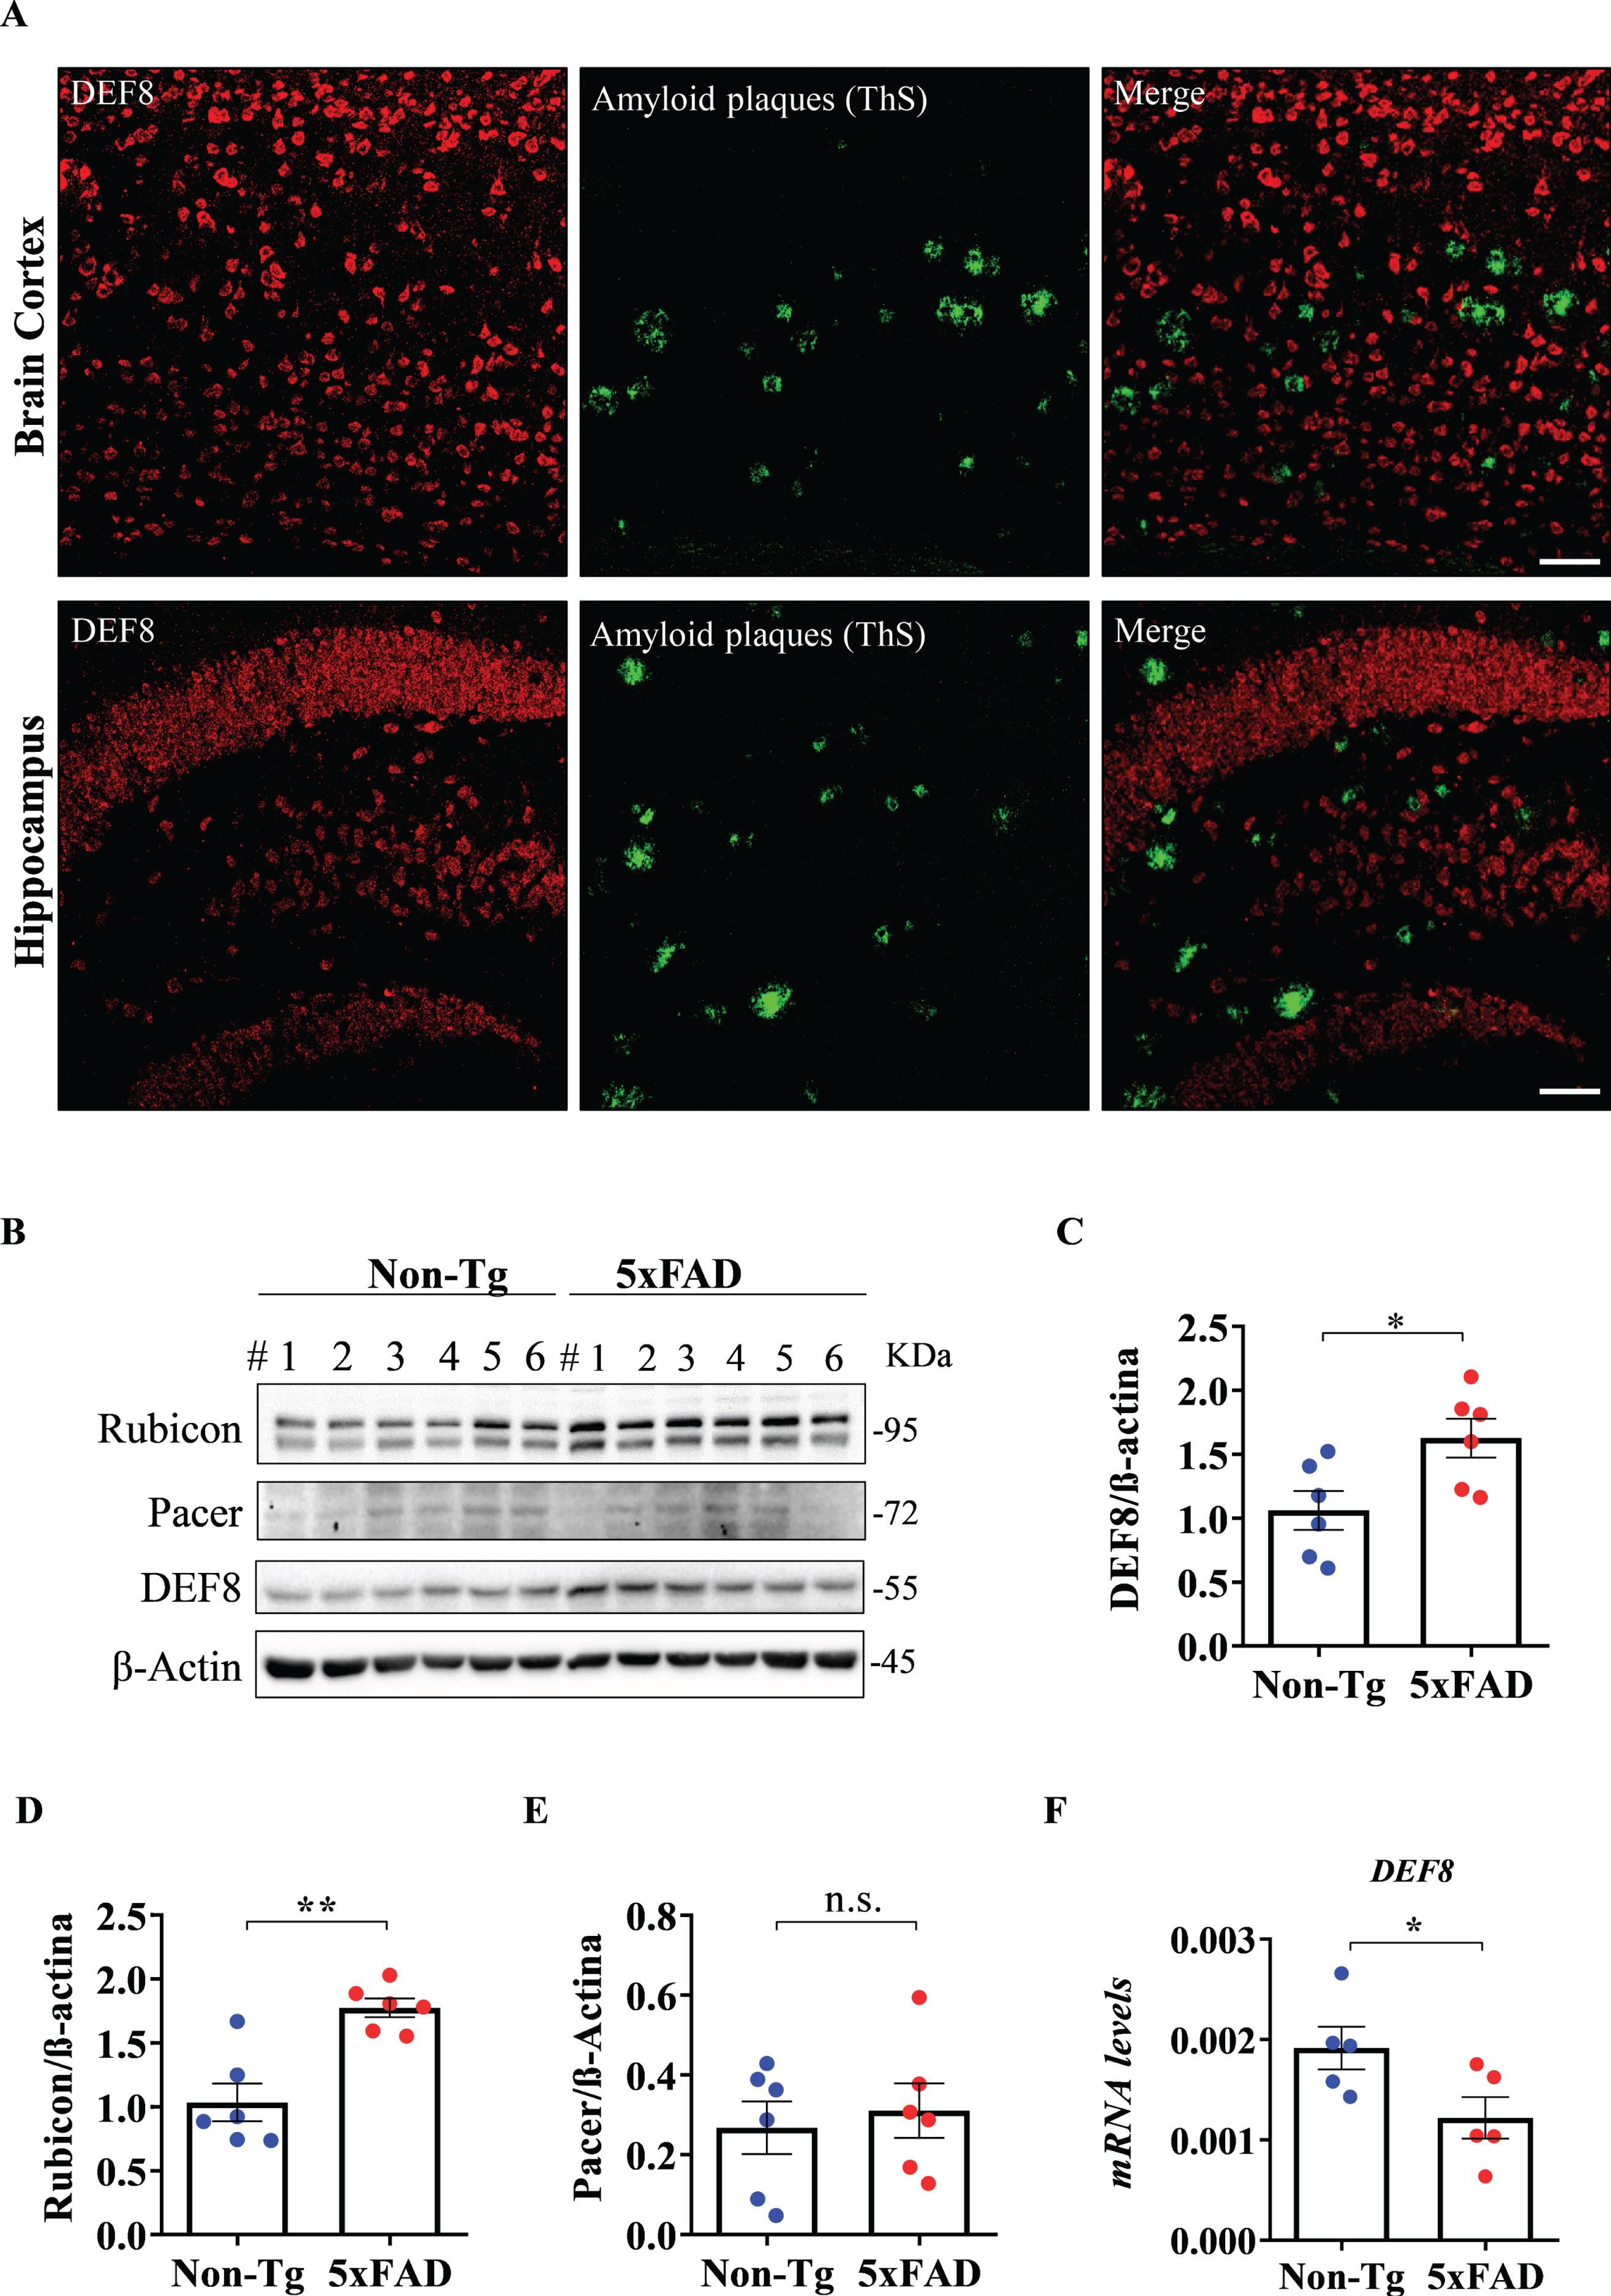
DEF8 localization and levels of expression in the brain cortex of 5XFAD mice. A) Amyloid plaques in the cerebral cortex and hippocampus sections (lower panels) of 180-day-old 5xFAD mice were detected by thioflavin S (ThS, green) staining by confocal microscopy. In red, DEF8. Images are representative of at least three animals. Scale bar: 50μm. B) Western blot from brain cortex protein extracts of 180-day-old wild-type (Non-Tg) and 5xFAD mice for Rubicon (upper band), Pacer, and DEF8. β-Actin was used as a loading control. Each lane represents one independent animal (n = 6 for each genotype). C-E) Densitometric quantification for DEF8 (C), Rubicon (D), and Pacer (E). F) DEF8 transcriptional levels in the same tissues. Data shown are mean±SEM, *p < 0.05.
DISCUSSION
Dysfunction of the autophagy and endolysosomal pathways in AD has been shown in animal models of the disease and brain samples of AD patients, which can be observed even years before Aβ accumulation [13, 56–58]. Studies in postmortem AD brain tissues have also shown the accumulation of autophagosomes and autolysosomes, which were absent in healthy brains, suggesting an impairment in the last steps of the pathway [13]. In mice, inhibition of lysosome activity promotes AD-like neurodegeneration [29, 30]. Furthermore, FAD-linked mutations in PSEN1 were shown to promote defective lysosomal proteolysis in mouse models due to V-ATPase pump deficient transport to the lysosome, preventing the correct acidification of the lysosome [28]. Conversely, as a potential feedback response, studies in AD postmortem samples suggest increased activity of the autophagy pathway’s initial step, contributing to worsening the dysfunction at the last steps [53, 54]. Despite the growing literature connecting autophagy dysfunction with AD using animal models and postmortem patients samples, few studies are available regarding autophagy genes or proteins associated with endolysosomal pathways in patients at earlier AD stages.
Increasing evidence has suggested that manifestations of AD extend beyond the brain. These systemic alterations could reflect underlying processes linked to the progression of the disease [33, 59]. For instance, researchers have recently reported that genes associated with ubiquitin-degradation systems in MCI patients’ blood cells are downregulated compared to AD samples [60], highlighting the idea that the expression patterns in MCI and AD are different. However, no details were shown about autophagy or associated genes. Thus, to complement those findings, our results have initially focused on studying autophagy gene expression in PBMCs from MCI and pAD patients. Because our diagnostic criteria are based on the patients’ clinical characteristics and not on the postmortem brain evaluation or blood/cerebrospinal fluid biomarkers, we classified our patients as pAD. Our results show augmented transcriptional levels of ULK1 in pAD compared to MCI patients (Fig. 5). ULK1 is an orthologue of yeast Atg1 that participates in the initiation of the autophagosome formation induced by amino acid deprivation [61], accumulation of protein aggregates [62], or mitophagy [63]. Accumulation of intracellular aggregates, including neurofibrillary tangles from tau hyperphosphorylation or intracellular Aβ, and dysfunctional mitochondria are hallmarks of neurodegenerative diseases, including AD, which could explain the transcriptional overexpression of ULK1. Our data of elevated ULK1 transcriptional levels in PBMCs from early pAD patients compared to MCI could be correlated with increased ULK1 levels reported in CA1 hippocampal neurons evaluated by microarray in an AD patient [64, 65]. We also found ATG5 decreased levels in MCI compared to pAD or HC individuals, indicating a dysregulation in the early stages of the disease (Fig. 5). This result is unlike the one reported in a recent work, in which levels of ATG5 were found to increase in AD patients’ plasma by the ELISA assay [66]. Also, the authors evaluated levels of ATG5 mRNA, finding increased expression in AD patients. The discordant results could be due to the number of patients (in Cho and co-researchers, two patients for HC and AD). Interestingly, this is the first time that the ATG5 expression has been evaluated in MCI samples. In another recent work evaluating PBMCs from Parkinson’s disease (PD) patients, transcriptional levels of proteins participating at initial steps of the autophagy, the machinery was downregulated, included ULK1 and ATG5, suggesting a differential response in both neurodegenerative diseases. We found no significant differences in the expression of BECLIN1, AMBRA1, P62, PACER, or RUBICON among the studied groups (Fig. 5).
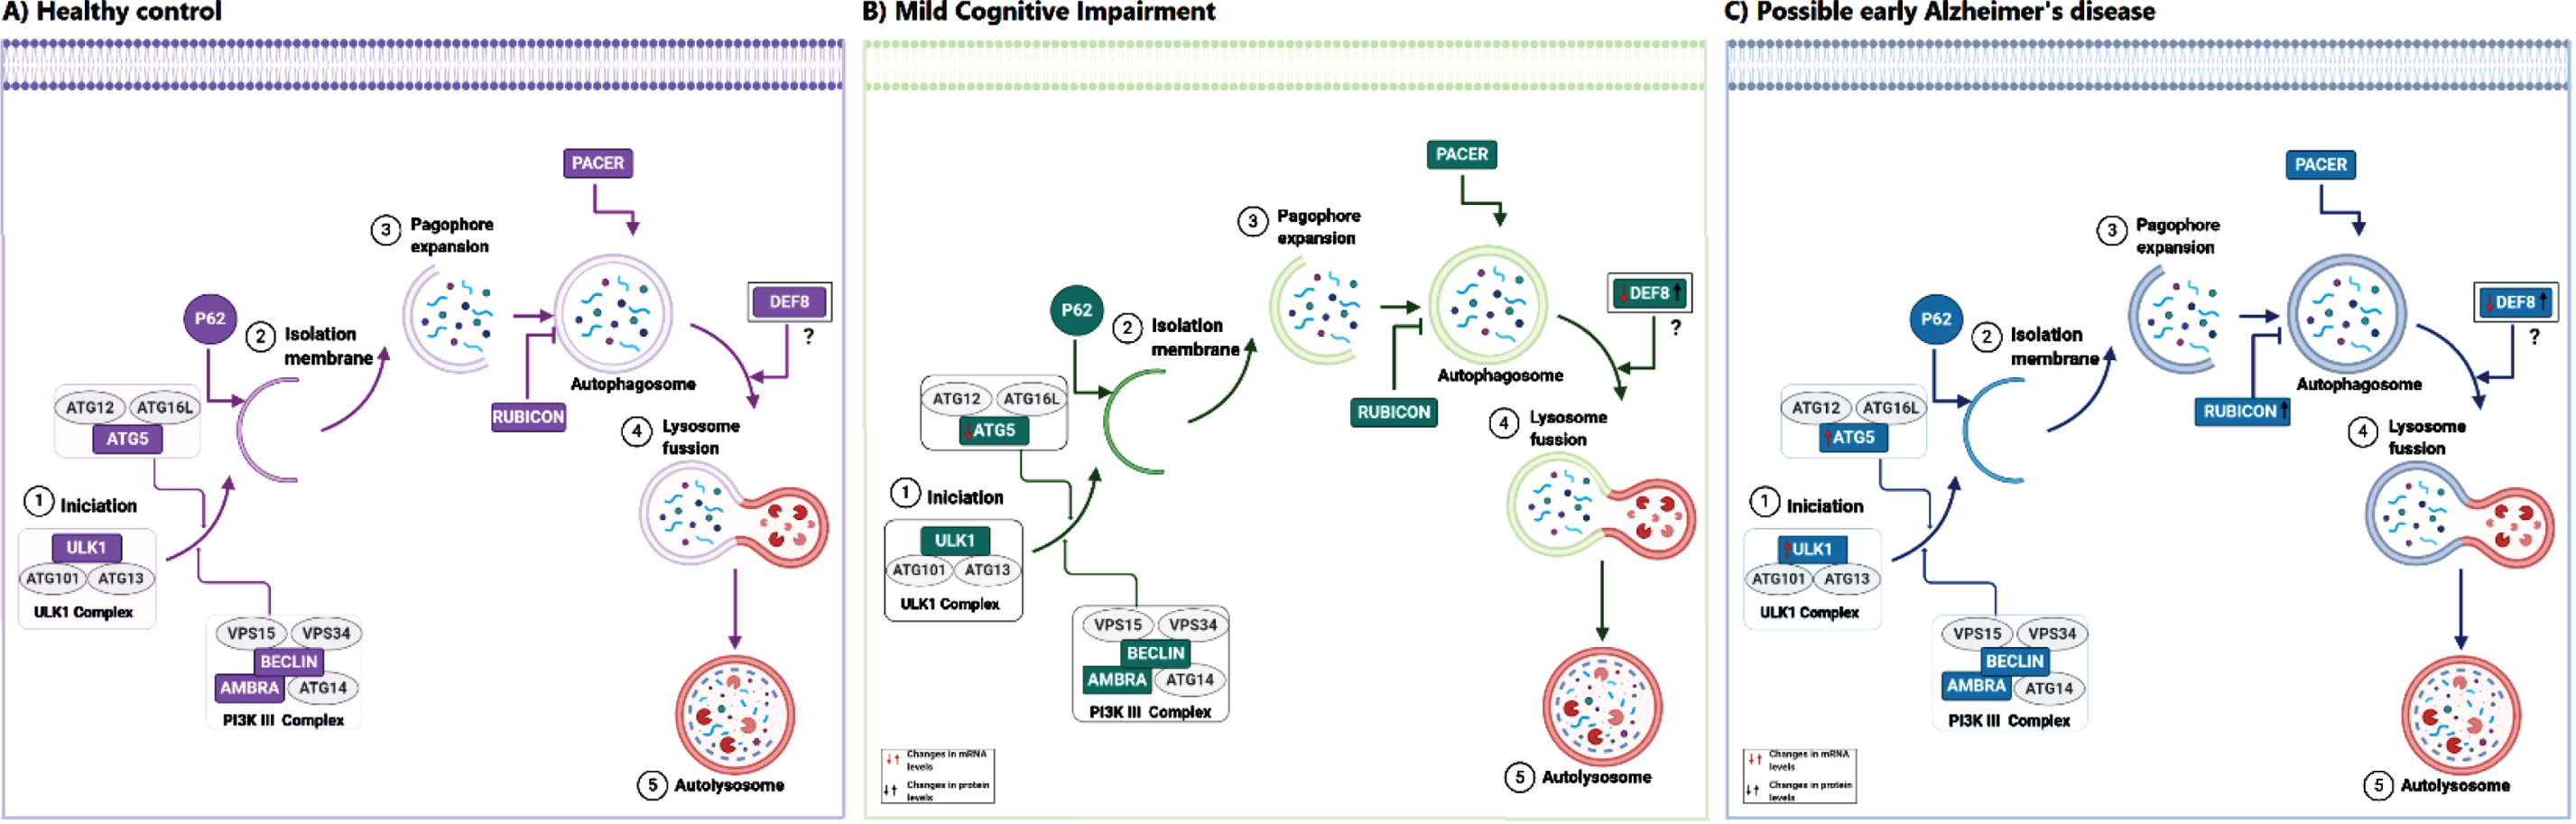
Proposed model of the role of DEF8 in Alzheimer’s disease. The autophagy pathway with the main complex of proteins is schematized for Healthy control (A), mild cognitive impairment (B), and probable Alzheimer’s disease patients (C). Proteins evaluated in our work are shown in green. In panels B and C, arrows indicate the changes found for mRNA (red arrows) or protein levels (black arrows) compared to Health donors. DEF8, a protein sharing a C-termini domain with Rubicon and Pacer, is proposed to act at the pathway’s last steps, affecting the lysosomes’ movement and fusion rate lysosomes and autophagosomes.
Instead, we did find a differentiated expression of DEF8 in MCI and pAD patients compared to age-matched HCs samples (Fig. 5). Indeed, transcriptional levels of DEF8 were positively correlated with MoCA and MoCA-MIS scores in patients. Interestingly, when we separated PBMCs in lymphocytes and granulocytes by flow cytometry, we observed increased protein levels of DEF8 in lymphocytes from MCI individuals compared to HCs or pAD. A similar mRNA and product protein pattern were observed for ULK1 in a PD study [67]. While ULK1 transcriptional levels were reduced in PBMCs from PD patients, protein levels were increased [67]. The transcriptional and protein expression differences found for DEF8 can be due to several factors, including modification of mRNA molecules, mRNA block by the action of miRNA or lncRNA regulatory molecules, and mRNA stability may be decreased in some pathological conditions. The translation can be upregulated by RNA binding proteins or other factors implicated in a disease context in the same line. Post-translational modifications may increase protein stability, or the protein may be a long-lived protein accumulated over time while the mRNA turnover is faster [62, 63]. This is an exciting result that leads to studying the transcriptional and translational regulation mechanisms of DEF8 in MCI and AD conditions. Overall, this is the first work that explores DEF8 levels in patients with MCI and pAD to the best of our knowledge.
DEF8 is a less characterized protein considered initially by bioinformatic studies to belong to the same family as Rubicon and Pacer. The family was defined by a common C-terminal containing an RH domain, which mediates the binding to Rab7 [38, 55]. Due to Rab7 and effectors’ central role in the autophagy and endolysosomal pathways, the loss of their functions is associated with several brain disorders. Missense mutations in Rab7 are responsible for Charcot-Marie-Tooth type 2B (CMT2B), characterized by progressive muscle tissue loss and touch sensation [68]. A mutation in the RUBICON gene’s C-terminal region was reported to cause a type of recessive cerebral ataxia [35, 36]. The mutation causes the C-terminal domain’s loss, preventing mutant RUBICON from localizing to the late endosome and lysosome [35, 36]. By bioinformatic analysis, we have uncovered PACER as an ALS disease gene candidate [40]. We found reduced PACER levels in postmortem spinal cord samples of sporadic ALS patients [40]. In an animal model of AD, the levels of Rab7 were reduced and of Rubicon increased [55]. Rubicon was also reported to mediate Aβ plaque clearance via microglia in an AD animal model in an autophagy-independent manner [69]. We found increased Rubicon and no differences in Pacer protein levels in the brain cortex of 5xFAD symptomatic samples. Rubicon is a negative regulator of autophagosome and endosome maturation, which levels are also increased in an age-dependent manner in several organism models, such as D. melanogaster [70]. LC3B (the canonical marker for autophagosome and autolysosomes) and p62, one of the selective autophagy receptors and a substrate for the pathway, are increased in brain samples of 5xFAD mice, indicating an impairment of the degradative activity of the process [55, 72]. In the case of DEF8, we observed a similar profile observed in PBMC, with a reduced mRNA expression and augmented protein levels in 5xFAD compared to age-matched wild-type mice.
Previous studies regarding DEF8 in the literature are mostly related to genetic screenings in cancer samples [32, 74], and one study observing DEF8 expressed differentially in plasma samples of patients with Bowel disease after thiopurine metabolite treatment [75]. In a gene expression study, DEF8 mRNA levels were elevated in the brain cortex of SAMP8 mice under treatment with a neuroprotector Chinese tea [41]. SAMP8 mice develop an early aging process associated with brain Aβ deposition, microglial proliferation, and memory deficits [76]. At the molecular level, less is known about its function. DEF8 has been reported to participate in lysosomes’ movement to the intracellular periphery in osteoclasts by binding to Rab7 and PLEKHM1, another protein sharing an RH domain, in mice [54]. In this work, DEF8 stabilizes the PLEKHM1 binding to Rab7, allowing the movement of lysosomes.
We report that DEF8 presents a neuronal profile in cortex and hippocampus samples of wild-type and 5xFAD mice, lacking expression in astrocytes. We propose that DEF8 would be a relevant target in the AD progression, with a potential role in the movement of lysosomes and autophagy dysfunction. More studies are needed to elucidate the role of DEF8 in autophagy and lysosome dysfunction in AD pathogenesis, which will contribute to candidate DEF8 as a potential therapeutic target for the disease.
Footnotes
ACKNOWLEDGMENTS
We would like to acknowledge all the patients and their families for their participation in this research. The grants supporting this work were, Fondo Nacional de Desarrollo Científico y Tecnológico, Fondecyt, from the Chilean Government, grants numbers 11160288 (MN), 11171061 (CSM), and 11190258 (PM), 1190958 (MB), 1150743 and 1200459 (UW). CDA is partially supported by 2018-ARRG-591107 and ANID/FONDEF ID20110152.