
Abstract
Alzheimer’s disease (AD) is a heterogeneous disease with different subtypes. Studying AD subtypes from brain structure, neuropathology, and cognition are of great importance for AD heterogeneity research. Starting from the study of constructing AD subtypes based on the features of T1-weighted structural magnetic resonance imaging, this paper introduces the major connections between the subtype definition and analysis strategies, including brain region-based subtype definition, and their demographic, neuropathological, and neuropsychological characteristics. The advantages and existing problems are analyzed, and reasonable improvement schemes are prospected. Overall, this review offers a more comprehensive view in the field of atrophy subtype in AD, along with their advantages, challenges, and future prospects, and provide a basis for improving individualized AD diagnosis.
Keywords
THE BRAIN ATROPHY SUBTYPES OF ALZHEIMER’S DISEASE
Alzheimer’s disease (AD) is the most common type of dementia. However, the pathogenesis of it is still unclear [1]. It is widely believed that AD is triggered by senile plaque formed by amyloid-β (Aβ) sedimentation and neurofibrillary tangles (NFTs) formed by hyperphosphorylation of tau protein [2]. In the brain of typical AD (TAD) patients, these pathological characteristics follow certain development rules. For instance, NFTs induced by tau protein accumulation originated from the entorhinal cortex, then invaded the association cortex through the hippocampus, and finally reached the primary cortex [3]. According to an autopsy study, however, the tau protein tangles in about 25% of the included AD samples presented different development rules, indicating that AD is a heterogeneous disease [4]. Brain atrophy is also heterogeneous among AD patients, and the corresponding dysfunctions vary with the pattern of brain atrophy [5]. For example, some people with AD show obvious visual impairment or language disorder [6]. Furthermore, studies demonstrate demographic characteristics, clinical course, and pathological characteristics also vary with different individuals [7, 8]. Hence, the exploration of AD subtype will contribute to a better understanding of AD topographical characteristics and provide a basis for improving individualized AD diagnosis [9].
Structural magnetic resonance imaging (sMRI) has attracted increasing attention in AD research in recent years [10]. Neuroimaging is easily acquired and could capture abnormal brain structural information in the prodromal or early stage of AD [11]. Whitwell et al. [12] constructed AD subtypes with the pattern of brain structural atrophy acquired from sMRI, and found that the brain atrophy presented different development rules among the patients. Based on the recent research on AD subtype construction using T1-weighted MRI pattern of brain atrophy, the definition mode, brain atrophy region, cognitive decline and disease development characteristics of TAD and three atypical AD types were discussed in this study. Thus, it provides a necessary reference for atrophy pattern-based AD subtype research and is expected to facilitate the research on AD heterogeneity.
OVERVIEW OF sMRI-BASED AD SUBTYPE DEFINITION AND ANALYSIS PROCESS
This literature search was conducted of the PubMed database, one of the most extensive biomedical and life science archives, from January 1, 2010 to June 30, 2020. The keywords to retrieve potentially suitable papers included ‘Alzheimer’s Disease’, ‘subtype’, ‘heterogeneity’, ‘imaging pattern’, and ‘brain atrophy’. The literature search identified a total of 414 records. The title and abstract of each article were re-viewed to determine whether it met inclusion criteria (Fig. 1): 1) full text; 2) human subjects; 3) research papers; 4) in vivo research. Next, literature was excluded using the following criteria: 1) biopathology only; 2) lacking sMRI alone defined subtype; 3) other neurological diseases (e.g., Parkinson’s) or other stages of dementia alone (e.g., subjective cognitive decline); 4) lacking AD subtype defined (e.g., AD diagnosis or classification). As a result, 15 articles met the approval standard and are included in Table 1.

Study screening flowchart. CSF, cerebrospinal fluid; APOE ɛ4, Apolipoprotein E ɛ4; PET, positron emission tomography; SPECT, single photon emission computed tomography; DTI, diffusion tensor imaging; fMRI, functional MRI; EEG, electroencephalography; MCI, mild cognitive impairment; SCD, subjective cognitive decline.
Although these studies vary in research method, analysis emphasis, and experimental design, the basic flow of sMRI-based AD subtype definition and analysis can be summarized as follows: feature extraction, subtype construction and definition, and comprehensive analysis.
The main sources of sMRI data used in AD subtype research were from open databases, such as the Alzheimer’s Disease Neuro imaging Initiative (ADNI) [13] and Add NeuroMed [14]. The studies on subtype construction using T1-weighted MRI atrophy pattern are listed in Table 1. Among them, one study of multimodality imaging combined the features of positron emission tomography (PET) and sMRI [15]. The feature construction and subtype analysis methods are described below (Fig. 2). The feature extraction of T1-weighted MRI brain atrophy is realized mainly in two ways: 1) Gray matter density features are generated via voxel-based morphometry (VBM) [16] or regional analysis of volumes examined in normalized space (RAVENS) [17] method; 2) cortical (or subcortical) volume or thickness features are extracted through FreeSurfer [18]. After subtypes construction will be generally implemented through three methods: 1) machine learning [15, 19–27], which is mainly an unsupervised or semi-supervised approach. The clustering result is compared with the healthy control (HC) group and named according to the difference in brain regions; 2) prior hypothesis method [28, 29], which pre establishes brain regions highly correlated with AD, and in most cases, the definition is given by using the ratio of hippocampal features to features of the whole cerebral cortex; 3) assessment of AD subtypes using visual rating scales (VRS) [30]. The VRS is mainly including posterior atrophy (PA), global cortical atrophy-frontal (GCA-F), and medial temporal atrophy (MTA) subscale for AD subtype definition [31]. Different from the first two methods, which rely upon software in feature extraction, when the third method is used, a medical professional will give scores to the atrophy pattern in regions of interests (ROIs) contained in each scale from T1-weighted MRI and corresponding to each subtype of atrophy [32–34]. In the stage of comprehensive analysis, the statistics and comparison of subtypes will be conducted mainly from three aspects, demographic, neuropsychology, and neuropathology are included.
Summary of T1-weighted MRI atrophy pattern defined by AD subtypes studies
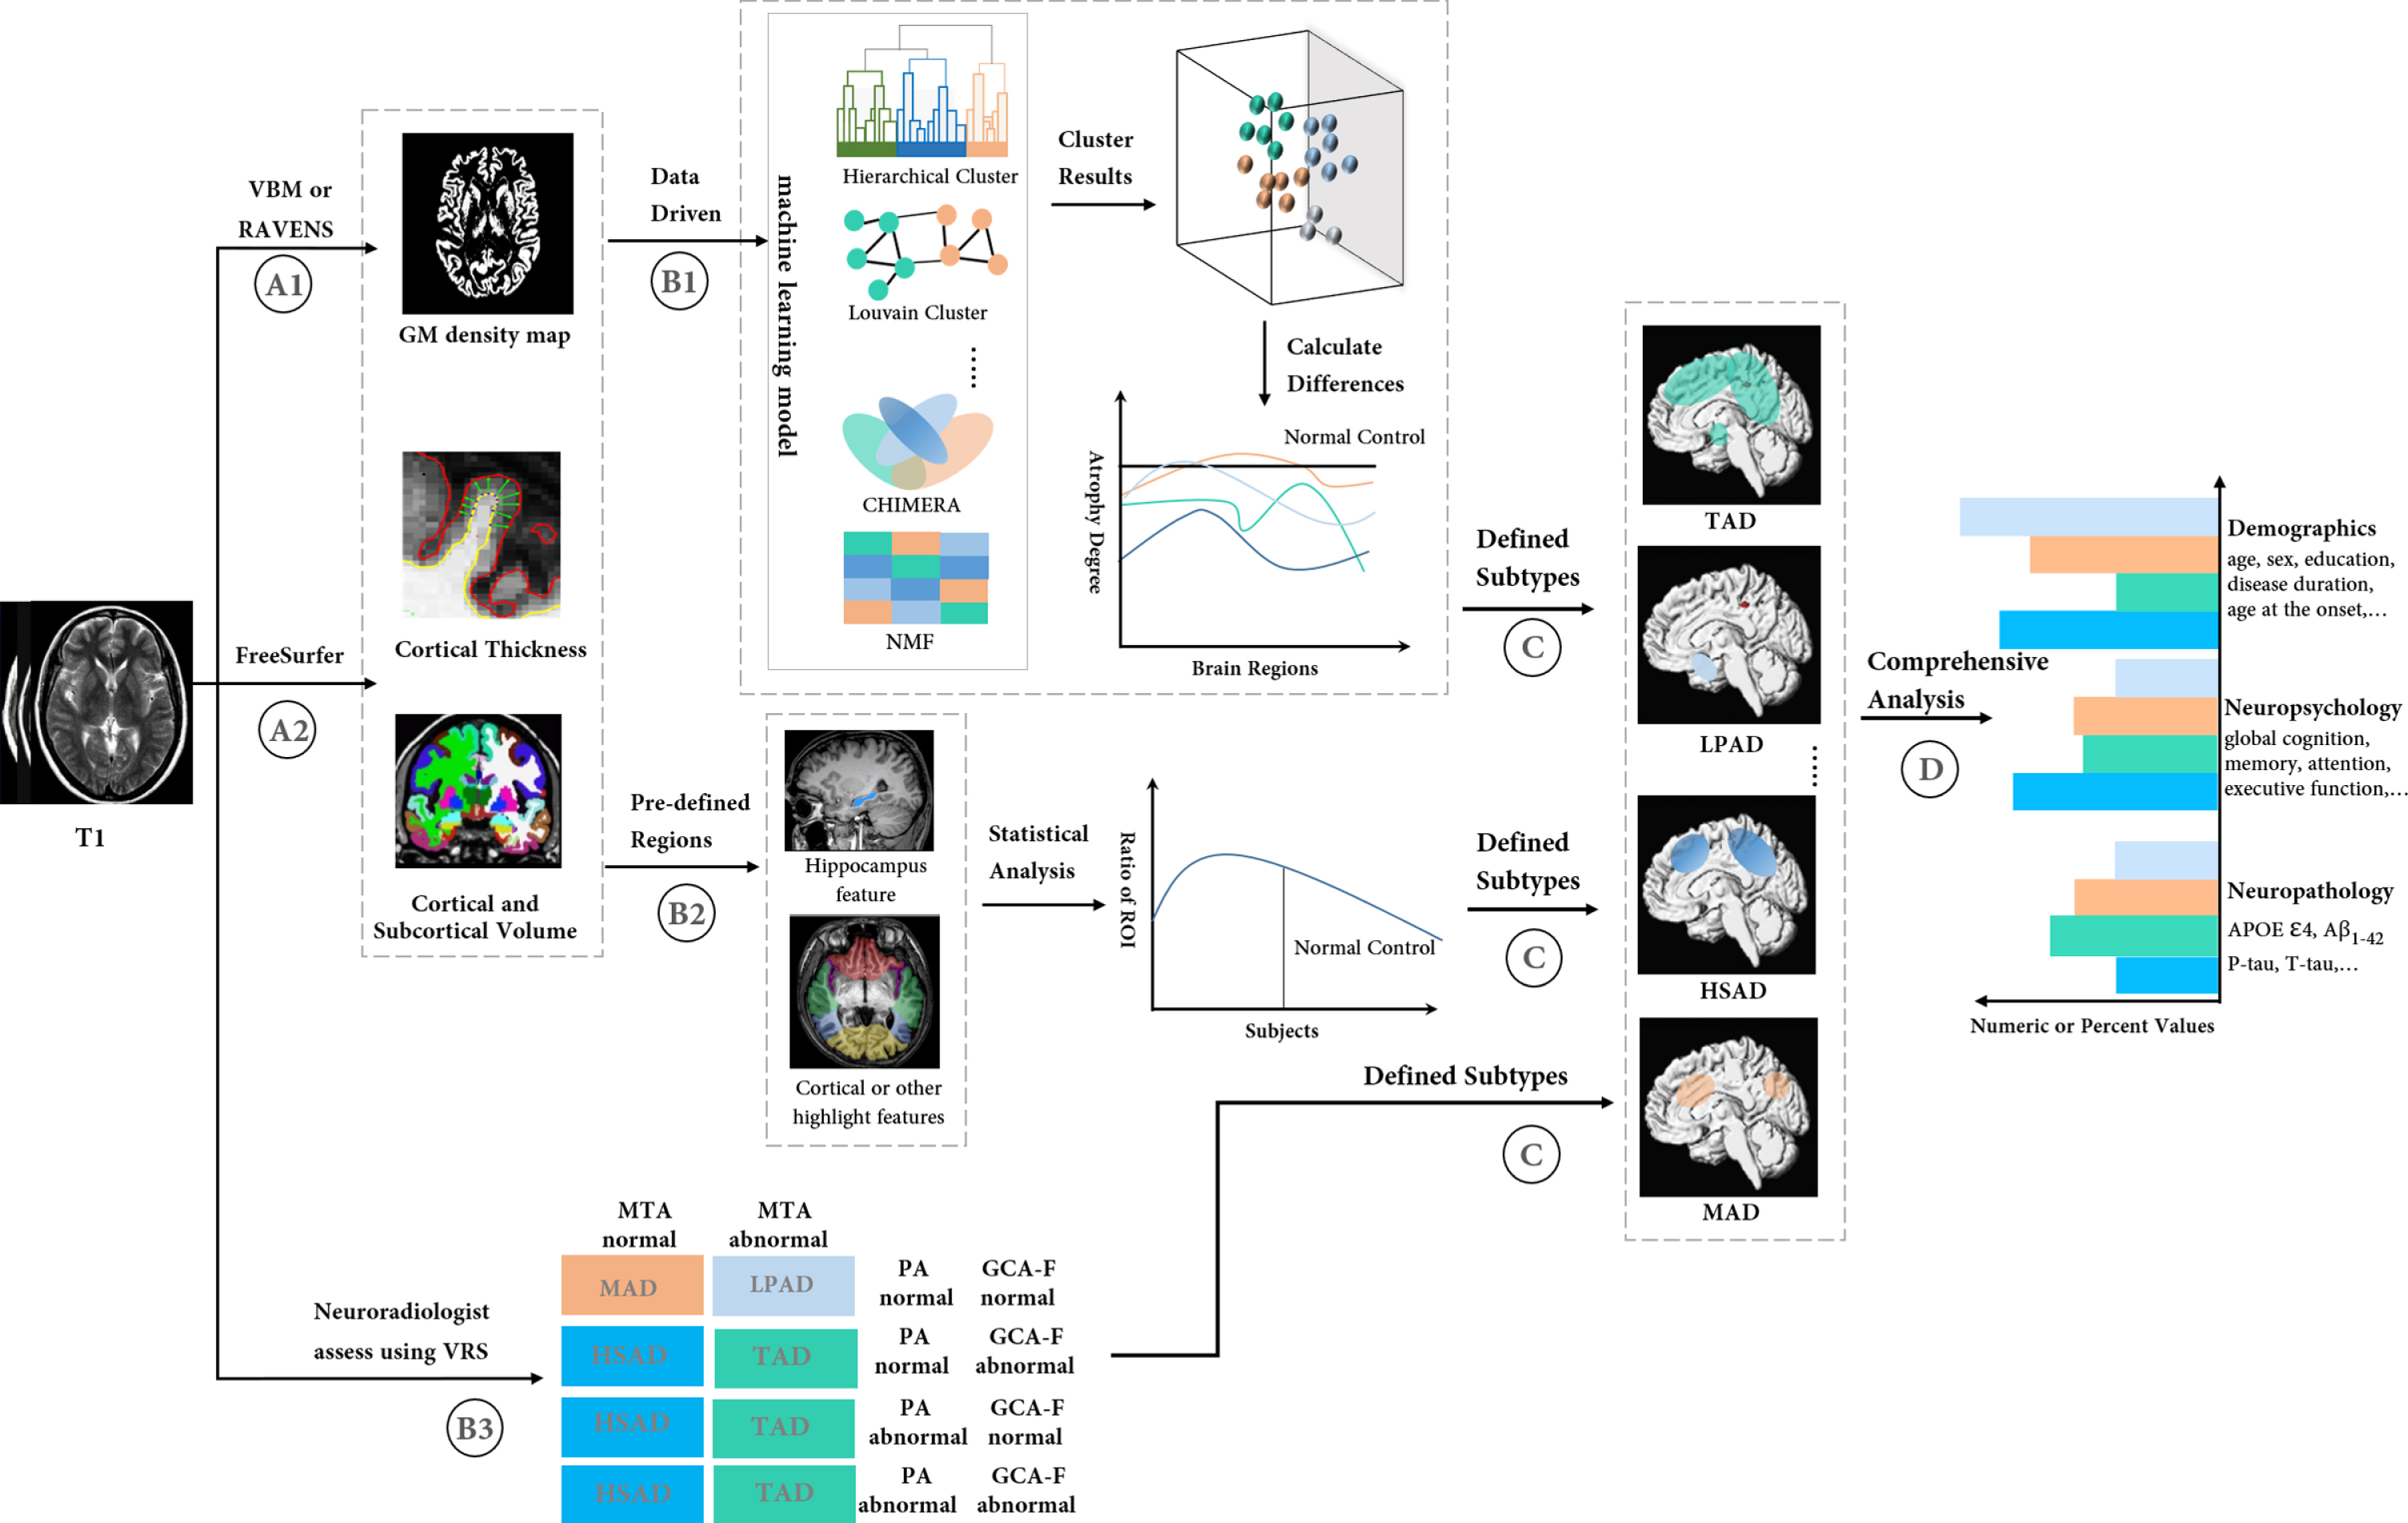
Overview steps for AD subtypes based on T1-weighted MRI, (A) feature extraction (B) subtype construction (C) subtypes definition (D) comprehensive analysis (The color-blocks on brain regions and the histograms are just being schematically depicted).
BRAIN REGIONS IN COMMON SUBTYPE DEFINITION
Taking the number of NFTs of hippocampus and three association cortices (middle frontal, inferior parietal, and superior temporal) as the basis for subtype classification, Murray et al. [4] defined 25% of atypical AD as hippocampal-sparing AD (HSAD) and limbic-predominant AD (LPAD). The definition of structural subtype also refers to a similar classification method, and it is divided mainly according to the atrophy degree of the limbic system and four lobes. With different research methods and purposes, different studies vary in the division of brain regions, subtype definition, and naming, they used the words like ‘similar to’, ‘consistent with’, ‘in line with’, etc., and their respective results are compared with the conclusion drawn by Murray et al. [4]. In addition, it is detected in some studies via sMRI that although some patients undergo clinical symptoms of AD, their brain structures present no obvious changes in comparison with normal aging, and this type is called minimal AD (MAD) [22, 26].
The brain region characteristics of AD subtypes
In sMRI, TAD is manifested by diffuse atrophy of the cerebral cortex, so it is often named ‘diffuse’ or ‘widespread’ [15, 32]. The current articles on TAD mainly focus on atrophy of frontal, temporal, and parietal, and few have involved the occipital atrophy. However, the description of specific regions varies to some extent, for example, the name of the lobe or the feature of cortical diffuse atrophy is directly used by some researchers [21, 32]. The description sometimes is refined, e.g., specific locations such as ‘medial’ or ‘lateral’ are added, or ROIs that are highly relative to AD (e.g., precuneus and cuneus) [15, 26–28]. Moreover, partial subcortical features are included in three studies [22, 29]. Clustering algorithms were adopted to divide TAD into two subtypes, which were found to be different in both regional and functional features [22, 23]. The brain regions and names of TAD are provided in Table 2.
A brief description of brain regions of TAD
LPAD refers to AD with seriously tangled neurofibrillary in the medial temporal lobe (MTL) [4], and LPAD can also be similarly defined through structural atrophy [12]. As a critical region in limbic system [35], MTL is regarded as the brain region firstly involved by AD and one of the recognized markers for AD diagnosis, and it enjoys great attention in the early stage of AD [36, 37]. Therefore, LPAD is directly named ‘MTL’ or ‘MT’ (medial temporal) in several studies. ROIs are refined to structures highly associated with AD in MTL, e.g., hippocampus and amygdala [28]. Except temporal, other lobes are scarcely mentioned in LPAD. Thus, only the temporal-related descriptions are listed in Table 3.
A brief description of brain regions of LPAD
HSAD can be interpreted as a relative form of LPAD in brain structure, namely cortical atrophy of other parts except MTL, and it is sometimes directly named ‘cortical atrophy only’ [28]. Parietal is the most concerned in HSAD. In some research, ‘parietal’ is used [15, 27] or it is named jointly with other lobes [21, 26], where ‘precuneus’ has been mentioned multiple times. ‘Posterior cortical’ was used to name the subtype, namely, the three lobes except frontal [20]. The subcortical region has almost not been mentioned in HSAD, and temporal and occipital are rarely concerned. Hence, the ROIs only involving temporal and occipital are combined in Table 4.
A brief description of brain regions of HSAD
MAD refers to AD with brain structures not much different from normal aging [38]. It accounted for 37.1% in the ADC-d database in one study [26]. Terms like ‘mild’ [24] and ‘spared’ [28] are usually used to depict the atrophy degree of atrophy. However, when describing the subtype ‘diffuse atrophy’, a study used ‘sporadic atrophy’ and described atrophy regions as ‘shallow and spanned’ [19]. The regions or description of MAD are listed in Table 5.
A brief description of brain regions of MAD
Summary and suggest improvements for brain regions of AD subtype definition
As aforementioned, the uppermost brain region characteristics of the four subtypes can be summarized in Table 6. Many studies indicate that the brain atrophy pattern of TAD follows the temporal-parietal-frontal trajectory [39], but the brain region characteristics of HSAD and MAD are apparently different from this trajectory. From the divided proportions in Table 1, HSAD and MAD are common, so understanding the AD subtype’s pathogenesis and pathologic processes will have a significant impact on the understanding of AD.
A summarize of the commonest brain regions or description for AD subtypes
The brain regions belonging to the same subtype vary in different research, especially in TAD and HSAD involving many brain regions. It is difficult to compare cognitive functions because of the difference in brain region division. Given this, the subtype division can be started by considering the locations of four lobes or from more refined brain regions. For example, TAD is further subdivided into two subtypes according to the atrophic conditions in different regions in some research, and the two subtypes are obviously different in cognition, pathology, etc. [22, 23]. Other subtypes can be further subdivided in a similar way. More refined subtype classification results can be obtained on the existing basis. In this way, new subtypes beyond those obtained through the present partitioning methods may also be acquired. For instance, new subtypes have been discovered via the Bayesian model [20], indicating that the correlation between subtypes and language ability can be verified through a temporal subdivision.
THE CHARACTERISTICS IN AD SUBTYPE ANALYSIS
Demographic
Results from these studies generally demonstrate that the average age of TAD is the maximum among all subgroups [15, 32] or only second to LPAD [26, 33]. In the dataset obtained by Dong et al. [23] in the ADNI database, the age of ‘widespread, greater temporal involvement’ is much higher than that of ‘widespread, global’. Age and education levels do not show consistent trends among related research. The average age of LPAD subjects is usually high [19, 33], females account for a relatively higher proportion in this subtype, and the subjects attacked by LPAD have partially a low education level.
In contrast to the LPAD, HSAD tend to be attacked at an earlier age, and mostly, among males, and HSAD patients have a partially higher education level than LPAD patients. The same trends are presented in other references except Ferreira et al. [34]. The onset age of AD of posterior cortical atrophy was earlier [40], which is consistent with the research conclusions listed in this paper. AD with earlier onset age might be more aggressive [41], which conforms to the statistical conclusions, e.g., ‘disease duration’, ‘age at death’ [20, 29].
MAD onset age is earlier, presenting significant differences from LPAD or TAD [22, 34], except one [28] in which the onset age tended to be the oldest among all subtypes. There is no uniform trend of gender, and the proportion of female patients is higher in two studies [26, 34]. Although the education level of MAD patients is slightly higher than LPAD or TAD in two studies [23, 28], it is the lowest in other research.
Neuropsychological
The Mini-Mental State Examination (MMSE) score of TAD is commonly low in baseline data [27, 34], but it does not present any obvious declining trend in longitudinal research, which may be related to the late stage of TAD under most circumstances [33, 34]. Memory loss, which is the fundamental characteristic of TAD [40], is generally low in the baseline assessment, but compared with LPAD, the memory deficits of TAD are rarely described specially. In most cases, the language ability scores are partially low in TAD. One study found that the ‘diffuse 2’ had higher language ability score than ‘diffuse 1’ [22]. Interestingly, in another study, TAD has a poor executive function [23]. But in most studies, TAD is insignificantly different from other subgroups or experiences no obviously declining trend in the assessment of executive functions.
Memory impairment will be aggravated with age [41, 42], which is the most common feature of LPAD, and this conforms to nearly all studies on memory baseline and longitudinal assessment [41, 42]. By establishing Bayesian latent factor models characterizing the relationship between atrophy pattern and cognitive score, two studies certified that LPAD was highly correlated with memory [20, 25].
As HSAD contains multiple brain regions in the division process, in addition to the memory impairment, the cognitive analysis of HSAD involves various fields such as vision and executive function [20]. Spatial processing and visuospatial dysfunction, which are directly related to parietal [43, 44], have attracted much attention [19, 26]. Memory, vision, and executive capacity all present a rapidly declining trend during the longitudinal statistics [22, 28].
No uniform conclusion is reached over MAD in cognitive assessment. For instance, several studies found that the MMSE scores of MAD were the highest among all subtypes [28, 34], but it was the lowest in another research [33]. Inconsistency also exists in other cognitive assessments, e.g., the conclusions drawn by Byun et al. [28] and Persson et al. [33] were the contrary in memory assessment. Nevertheless, the longitudinal cognitive statistics showed that the decline rate of MAD is low in various fields.
The AD subtype can be more intuitively estimated on the precondition of understanding of cognitive characteristics manifested by each subtype. From the current research situation, the exploration of AD subtypes in the cognitive field is still only in its infancy, and main problems include: 1) What are commonly used are MMSE and Clinical Dementia Rating (CDR) scales, which mainly investigate the differences among mild cognitive impairment (MCI), AD, and HC [45], while lacking persuasiveness and reliability for the comparison of AD patients; 2) the division of cognitive fields is not systematic, normative and elaborate enough [46]. For instance, numerous fields, such as memory and executive ability, are contained in the AD Assessment Scale (ADAS) with both sub-scores and total scores. It may be less persuasive if only sub-scores are used to evaluate the ability of one field, but it may be less meticulous if only total score is adopted. The evaluation indexes used in different research may be widely different even in the same field. To solve these problems, the evaluation indexes of memory [47] and executive ability [48] officially provided by ADNI are used in some research, or subitems in different scales are combined to construct multi-aspect evaluation indexes, e.g., memory or language [26]; the subtypes are defined by constructing brain structure-cognition model in another research [20]. These methods can make the assessment between cognitive and subtype more persuasive.
Neuropathology
The proportion of apolipoprotein E ɛ4 (APOE ɛ4) carriers of TAD is the highest among all subtypes [15, 34], but no significant difference from subgroups is embodied, and moreover, the proportion or levels of abnormal Aβ42 carriers are usually high [10, 34]. Under normal circumstances, APOE ɛ4 carriers of LPAD account for a higher proportion than HSAD [21, 34]. Total tau (T-tau) and phosphorylated tau (P-tau) levels of LPAD are generally low, especially being lower than those of HSAD [21, 33]. The proportion of APOE ɛ4 carriers is low in HSAD, while those of T-tau and P-tau are relatively higher. The abnormal proportion of Aβ42 does not show a uniform trend, and it is the subgroup that is the closest to normal aging in few research [28, 32]. The proportion of APOE ɛ4 carriers is the highest among MAD patients [22, 34], but it is the lowest in several studies [23, 33]. Abnormal Aβ42 carriers account for the smallest proportion in some research [15, 33], but the opposite result is reported in some other studies [28, 34]. The statistical results of tau also present two extremes. Specifically, the proportions of both T-tau and P-tau are the highest in some research [26, 32], but others are closer to normal aging [23, 28].
The analysis combing pathological markers is the key to decide whether the AD subtype classification result based on atrophy pattern can be clinically applied [11]. Previous research papers have indicated that the subjects with APOE ɛ4 homozygosity along with extreme levels of cerebrospinal fluid (CSF) biomarkers exhibited the worst clinical outcomes, these are more in line with TAD, while neuropathology of other subtypes remains to be further studied [49–51].
Not all subjects in the ADNI baseline data have CSF information, and even worse, there lacks tracking data. Although the impact of missing data can be mitigated by using statistical algorithms, deviations are still unavoidable [52]. Many studies suggest that Aβ42 will rapidly increase and gradually become stable before the appearance of clinical AD symptoms [53], manifesting that Aβ42 accumulation is ahead of tau accumulation and degradation of glucose metabolism [54, 55]. Higher T-tau is more likely to cause the decline in cortical plasticity and cognitive ability than lower Aβ42 [56–58]. Hence, it is believed that tau may be more closely related to the atrophy pattern. Tau-PET and FDG-PET (18F-flurodeoxyglucose-PET) have also been gradually applied to AD diagnosis [59]. The multi-modal imaging method, if used in the future, will enhance the pathological persuasiveness for AD research.
No unified statistical approaches of CSF are used in the present studies. To be specific, the proportion of abnormal carriers is used in some research (e.g., Persson et al. [33]), while mean and standard deviation are applied in others (e.g., Risacher et al. [29]), which makes it difficult for comparing among different studies. The databases listed in Table 1 had not included CSF biomarkers as the AD inclusion criteria, in view of incompletely consistent measurement criteria for pathological markers in different databases [26], the criterion-proportion of abnormal carriers-is suggested in this study.
Summary and suggest improvements for AD subtype analysis
Following the definition of AD subtypes based on structural atrophy pattern, the analysis will be gen-erally conducted from three aspects: subtype-dem-ographic statistics, subtype-neuropsychology, and subtype-pathological characteristics, which constitute an essential basis for improving individualized AD diagnosis. Although T1-weighted image features serve as the foundation for subtype research in references, inconsistent characteristic results may be obtained due to the methodology and data differe-nces, e.g., selection of different databases, or whether age, gender, etc., are excluded as covariates in the preprocessing stage [28]. Nevertheless, there are still general trends. A review paper summarized some characteristics of HSAD and LPAD based on meta-analysis [60], but MAD characteristics presented polarized distribution, which could not be well emb-odied in meta-analysis result. With the abovementioned research conclusions combined, the main characteristics of the four subtypes and currently reliable inferences are summarized in Table 7.
A summarize of characteristics and deductions for AD subtypes
EOAD, early-onset AD; LOAD, late-onset AD.
Nevertheless, there is no consistency in divided proportions among the subtypes. For example, TAD is not involved in some subtype division results [19, 24–26], which may be ascribed to the division of TAD into other subtypes in their statistical analysis of differences. Among the studies including TAD, the proportion of TAD is less than 75% of Murray et al.’s result [4] (except Poulakis et al. [22]), and it even not reaches 20% of Kate et al.’s result [26]. As the research samples of Murray et al. [4] derived from the late stage of AD, it is speculated that some atypical subtypes may be transformed into TAD with the disease progression, and this inference agrees with the fact that the onset age of TAD patients is partially older.
On this basis, a common question raised in subtype research is proposed: Are all test subjects from the same disease stage, and can all subtype division results truly reflect the heterogeneity of AD? There is no perfect answer to this question yet. At present, the disease stage of subjects is estimated mainly through statistical approaches [60], or it is judged by examining the longitudinal stability of cognitive assessment [20]. Since the subjects from different databases vary in age structure and onset age, it is difficult to objectively compare the same subtype in the aspects of age, disease stage, etc. No consistent trend is presented in the percentage and disease progression of other subtypes, either. Tau attacks MTL first and then reaches other cortices in TAD [2], so the disease characteristics of LPAD are approximate to TAD. Thus, it is more likely to develop into TAD with the disease progression. Currently, there is limited longitudinal observational study in the field AD subtypes. The course of disease and percentage of various subtypes can be better explained if, on the existing basis, research can be carried out from the angle of disease progression trajectory, especially by establishing a longitudinal analysis model using the follow-up data from the perspective of atrophy pattern in MCI stage, along with psychological and pathological perspectives.
SUMMARY AND OUTLOOK TO FURTHER WORK
Various aspects such as neuroimaging, neuropsychology, and neuropathology are included in the res-earch on AD, which is a heterogeneous disease. Generally speaking, the genesis and development of this disease are not triggered by independent factors. But age, gender, cognitive reserve, APOE ɛ4, and CSF levels may also become factors causing the heterogeneity.
Only T1-weighted image features are used in most of the current MRI-based subtype research. Recent research articles have verified that white matter hyperintensity and white matter impairment acquired from T2-weighed MRI or diffusion tensor imaging (DTI) can also reflect the AD subtype characteristics [26, 61]. The brain networks and cortical plasticity can reveal the underlying neuropathology better [62, 63], some of which have also been applied to AD subtype construction recently [64]. FDG-PET, Tau-PET, and transcranial magnetic stimulation are increasingly used to predict and diagnose AD [6, 65]. The pathological differences between subtypes may be figured out under multi-modal brain features, so as to have a more comprehensive understanding of AD subtypes.
Although the strict selection criteria applied in AD databases, this does not mean that the coexistence of neurodegenerative diseases with imaging structures similar to AD are completely excluded, such as progressive supranuclear palsy and corticobasal degeneration [66, 67]. With the improvement of data acquisition, e.g., imaging, pathology, and cognition are subsumed under AD inclusion criteria, it is possible to avoid other potential diseases in AD subjects to a certain extent [35]. Moreover, using these comparatively complete data, more analytical correlation models between atrophy pattern and influence factors can be established from the angle of disease development trajectory, so that the subtypes defined via MRI will be of greater clinical application values [68].
From a literature review regarding AD subtype construction based on T1-weighted structural atrop-hic characteristics, the research status of subtype definition and analysis was systematically summarized, the critical problems thereof were analyzed, and expectations were put forward. The summarized subtype construction and analysis methods can provide a valuable reference for AD heterogeneity research based on imaging biomarkers in the future.
Footnotes
ACKNOWLEDGMENTS
This research was financially supported by grants from National Natural Science Foundation of China (81971683), Natural Science Foundation of Beijing Municipality (L182010), and the Scientific Research General Project of Beijing Municipal Education Committee (KM201810005033).