
Abstract
Background:
African American/Black adults have a disproportionate incidence of Alzheimer’s disease (AD) and are underrepresented in biomarker discovery efforts.
Objective:
This study aimed to identify potential diagnostic biomarkers for AD using a combination of proteomics and machine learning approaches in a cohort that included African American/Black adults.
Methods:
We conducted a discovery-based plasma proteomics study on plasma samples (N = 113) obtained from clinically diagnosed AD and cognitively normal adults that were self-reported African American/Black or non-Hispanic White. Sets of differentially-expressed proteins were then classified using a support vector machine (SVM) to identify biomarker candidates.
Results:
In total, 740 proteins were identified of which, 25 differentially-expressed proteins in AD came from comparisons within a single racial and ethnic background group. Six proteins were differentially-expressed in AD regardless of racial and ethnic background. Supervised classification by SVM yielded an area under the curve (AUC) of 0.91 and accuracy of 86%for differentiating AD in samples from non-Hispanic White adults when trained with differentially-expressed proteins unique to that group. However, the same model yielded an AUC of 0.49 and accuracy of 47%for differentiating AD in samples from African American/Black adults. Other covariates such as age, APOE4 status, sex, and years of education were found to improve the model mostly in the samples from non-Hispanic White adults for classifying AD.
Conclusion:
These results demonstrate the importance of study designs in AD biomarker discovery, which must include diverse racial and ethnic groups such as African American/Black adults to develop effective biomarkers.
Keywords
INTRODUCTION
One of the fastest growing populations in the United States are ethnic minorities, such that Hispan-ics and African American/Blacks are estimated to account for 40%of older adults in 2050 [1 –3]. This is critical for the field of Alzheimer’s disease (AD) which disproportionately impacts these populations and accounts for higher incidence rates of 1.5 to 2x for African American/Black adults [4 –6]. In addition to disparities in disease incidence, there is a disparate economic burden of AD costs and caregiving for African American/Black families [7, 8]. Racial and ethnic disparities in AD are multi-factorial and can include contributions from socioeconomic status [1 , 10], quality and level of education [11 –14], comorbidities [1, 15], genetic risk factors [15], environmental stressors [16, 17], healthcare access [1, 5], and systemic racism [18]. Disease pathology is similar in African American/Black and Hispanic adults with regards to what we have learned for decades about AD in non-Hispanic White populations [5 , 19–23]. Although, understanding disease pathogenesis is complicated by higher frequency of mixed dementia cases and vascular comorbidities that are often found for example in African American/Black adults with AD [19 , 22].
Importantly, for better diagnosing AD in all communities and for developing effective therapies, better strategies are needed to increase research participation of African American/Black adults into AD and related dementia research [24]. Currently, African American/Black adults participate in clinical trials at a rate of <∼5% and in AD research assessments at <∼13%[25 –27]. Recently, there have been reports that demonstrate that biomarker discovery efforts for AD need to be inclusive of African American/Black adults as the standard cerebrospinal fluid (CSF) biomarkers, total-tau and phosphorylated (p)-tau, have different concentration levels in a cohort of African American/Black adults when compared to non-Hispanic White adults [28 –33]. Other circulatory proteins in plasma also have been reported to have differences in African American/Black AD patients such as interleukin-9 [34]. Examples of plasma biomarker studies that include or solely focus on African American/Black adults are few [35 –37]. This is critical as plasma is a less-invasive biofluid to obtain than CSF, and more importantly, as diagnostic or prognostic biomarkers for AD need to be effective for all.
Plasma proteomics is a growing field within AD biomarker discovery [38 –45]. Many studies have conducted plasma proteomics analyses across the AD spectrum from cognitively normal (CN) to mild cognitively impaired to confirmed early and late-onset AD [46 –64]. The most widely used biomarkers in plasma are amyloid-beta 40 (Aβ40) and 42 (Aβ42) peptides [38 , 65–67]. Other potential plasma protein biomarkers, a few of which have been validated within the same cohort [68] and few in independent cohorts [46 , 70], also exist. A recent review of plasma biomarkers for AD [40] analyzed findings from 22 previous discovery-based proteo-mics studies and found a lack of reproducibility across those studies. For example, the review reported alpha-2 macroglobulin as a biomarker candidate in six different studies, while pancreatic polypeptide was reported in five studies [40]. The remaining proteins reported in more than two studies included apolipoprotein A1, afamin, fibronectin, apolipoprotein A4, alpha -1- antitrypsin, fibrinogen-γ chain, insulin like growth factor binding protein-2, macrophage inflammatory protein 1-α, beta-2 glycoprotein, and complement factor B [40].
Few plasma biomarker studies utilized diverse cohorts that incorporated African American/Black adults into the study design [35 , 71]. Plasma biomarkers for an amnestic MCI cohort of females from African American/Black, Hispanic, and non-Hispanic White backgrounds were identified as ha-ving levels unique to a given racial and ethnic group and highlight the importance of including diverse groups in biomarker studies [37]. Age was deemed a critical factor in mid-life plasma Aβ concentrations in a large cohort of European and African Am-erican/Black adults, whereby there were also different genes that had race-specific changes [35]. For example, cystathionine beta-synthase gene had genome-wide significant association with plasma homocysteine levels in African American/Blacks and Yoruba cohorts, that are associated with African ancestry [71]. Inclusion of African American/Black adults in study designs is critical to ensure that specific biomarkers, combinations of biomarkers in a panel, or biomarker levels are able to accurately distinguish and diagnose disease in all groups.
Herein, we conducted a pilot study with plasma samples available from the University of Pittsburgh Alzheimer’s Disease Research Center (ADRC) that included self-reported African American/Black and non-Hispanic White adults that participated in ADRC research. Individual participants were either cognitively normal or had a clinically confirmed diagnosis of AD, and plasma was collected from a time point away from baseline that was coincident with clear disease pathology and clinical diagnosis. The samples (N = 113) were randomly divided into two sets in order to accommodate a study design that would allow us to 1) conduct discovery-based proteomics to identify differentially-expressed proteins in a cohort that included African American/Black adults; 2) use the data generated from the discovery-based proteomics studies to determine the utility of the selected panel of proteins as diagnostic AD biomarkers using machine learning; and 3) determine the extent to which the model performance depended on the racial and ethnic background of the training set samples. Comprehensive plasma proteomics biomarker discovery was conducted using quantitative tandem mass tags of peptides from plasma immunodepletion, liquid chromatography (LC), and mass spectrometry (MS) workflows. Processed proteomics data along with machine learning was used to test whether the racial and ethnic background of the training set samples impacts the accuracy of the biomarker panels for AD. In this approach, we divided the cohort into two sets: Set 1 (N = 73) was used to select the optimal protein features and Set 2 (N = 40) was used to validate the results.
METHODS
Plasma sample collection
Human plasma samples (N = 113) from African American/Black and non-Hispanic White individuals were obtained from the University of Pittsburgh Alzheimer’s Disease Research Center (ADRC). Det-ailed characteristics of the individuals are provided in Table 1. Approval for the participation of human subjects were obtained by the Institutional Review Boards of the University of Pittsburgh and Vanderbilt University. The Mini-Mental State Examination (MMSE) was performed, and disease individuals were clinically diagnosed with mild to moderate dementia at the time of blood draw according to the National Institute on Aging-Alzheimer’s Association and National Alzheimer’s Coordinating Center criteria. The samples were divided into two separate sample sets of N = 73 and N = 40, using a blinded study design. Plasma samples were obtained from participants at the most recent blood draw at the start of this study in December 2016, in order to analyze plasma that was close in chronological year and storage conditions and that corresponded to clear disease diagnosis.
Demographics of plasma sample cohorts
aPresence of comorbidity prior to or during blood draw. MMSE, Mini-Mental State Exam; APOE, Apolipoprotein E.
Plasma depletion
Plasma samples were depleted of the top six most abundant proteins (albumin, IgG, IgA, α1-antitryp-sin, transferrin, and haptoglobin) using the Multiple Affinity Removal System (MARS) Column Human 6 (Agilent, Santa Clara) according to manufacturer’s instructions. In brief, 30μL of crude plasma sample was diluted 4 times using buffer A (Agilent, Santa Clara) and centrifuged at 16000 g for 1 min through a 0.22μm spin filter to remove particulates. The sample was injected onto the MARS 6 column using a Waters Alliance 2695 Separation module LC system and the resulting fractions were collec-ted. The flow through fractions were concentrated using a 5 kDa molecular weight cutoff concentrator at 4,695 g for 1.5 h followed by a bicinchoninic acid (BCA) assay to determine protein concentration. A pooled sample containing equal amounts of protein from each of the plasma samples was generated and used as quality control (QC) sample.
Digestion
Samples were randomized into eight and four batches respectively, for Set 1 and Set 2 with corres-ponding QC sample in each batch. In Set 1, in solution digestion was performed in 100 mM ammonium bicarbonate buffer. Proteins (100μg) were reduced using 200 mM dithiothreitol (DTT) for 45 min at 55°C, while alkylation was performed using 200 mM iodoacetamide (IAM) in the dark for 30 min. Finally, proteins were digested using trypsin/Lys-C mix (Promega, Madison) overnight at 37°C (1:50 enzyme:protein ratio). The digested samples were acidified with formic acid and desalted using HLB cartridges (Waters Corporation, Milford) per manufacturer’s instructions. For Set 2, the digestion was carried out using the filter assisted sample preparation (FASP) protocol [72]. In brief, proteins (100μg) were transferred onto a 10 kDa molecular weight cutoff filter (Sartorius, Gloucestershire, UK) and reduced for 15 min with 20 mM DTT in 100 mM Tris with 8 M urea. This was followed by centrifugation at 14000 rpm for 30 min and the resulting filtrate was discarded. Proteins were then alkylated with 20 mM IAM in the dark for 15 min followed by centrifugation to remove the excess reagents. Samples were washed using 100 mM Tris with 1 M urea in a centrifuge at 14000 rpm and trypsin/Lys-C mix (Promega, Madison) was added and digested for 8 h at 37°C (1:50 enzyme:protein ratio). After digestion, the peptides were acidified with formic acid and desalted using HLB cartridges. TMT 10-plex or 11-plex labeling (ThermoFisher Scientific, Waltham) was performed following manufacturer’s instruction with 25μg of peptides. Labeled peptides were desalted and separated into 12 fraction using high pH (pH = 10) reversed-phase fractionation with acetonitrile (ACN(%)–3, 5, 8, 10, 13, 18, 22, 30, 45, 60, 80, 95) on an HLB cartridge. Fractions were dried down and reconstituted in water with 0.1%formic acid.
LC-MS/MS and MS3 parameters
Peptides were analyzed using an Orbitrap Fusion Lumos (ThermoFisher Scientific, Waltham) in positive ionization mode. The samples were loaded onto a self-packed C18 (5μm, 200Å, MICHROM Bioresources Inc.) trap column (100μM ID x 2.5 cm, IntegraFrit Capillary), and separation was performed on an in-house packed C18 (2.5μm, 100Å, XBridge BEH from Waters) capillary column (100μM ID x 25 cm, Polymicro Technologies) at 300 nL/min using solvent A (water with 0.1 %formic acid) and solvent B (acetonitrile with 0.1%formic acid). The gradient was as follows: 0–7 min, 10%B; 7–67 min, 10–30%B; 67–75 min, 30–60%B; 75–77 min, 60–90%B; 77–82 min, 90%B; 82-83 min, 90–10%B; and 83–100 min, 10%B. Full MS scans were acquired over a mass range of m/z 375–1500 at a resolution of 120,000 with the automatic gain control (AGC) target set at 4×10⁵ ions and maximum ion injection (IT) time of 50 ms. Data dependent acquisition (DDA) was used to acquire MS/MS spectra with a cycle time of 3 s. MS/MS fragmentation was performed using collision-induced dissociation (CID) with an NCE = 35%. The AGC was set at 1×10⁴ using an isolation width of 0.7 m/z, maximum injection time of 100 ms, and a dynamic exclusion of 20 s. Synchronous precursor selection (SPS) mode was used for collecting MS3 spectra of the top 10 most intense ions from the MS/MS fragments. Higher-energy collisional dissociation (HCD) was used for MS3 with the following Orbitrap parameters: NCE = 55%, scan range = 100–400 m/z, resolution = 60,000, AGC = 5×10⁴, maximum injection time = 118 ms and isolation width = 2 m/z. Each fraction was injected in duplicate and the injection order was randomized for each batch.
Data analysis
Raw files were analyzed using Proteome Discoverer software (version 2.2) and searched against the Uniprot human reviewed protein database (07/17/2018, 20289 sequences) using SEQUEST-HT. The following parameters were used: maximum two trypsin miscleavages, precursor mass tolerance 10 ppm, fragment mass tolerance 0.6 Da; dynamic modification of methionine oxidation (+15.995 Da), protein N-termini acetyl (42.011 Da), TMT 10 (229.163 Da)/11 plex (229.169 Da) on peptide N-termini and lysine residue, static modification of cysteine carbamidomethyl (+57.02 Da). Decoy database searching was employed to generate high confidence peptides (FDR < 1%). TMT reporter ions (i.e., m/z 126 –131) were identified with the following parameters: most confident centroid and 20 ppm reporter ion mass tolerance. Technical replicates and fractions from each batch were combined into one result file. Finally, the individual batch data were combined together for further processing using an in-house Python script.
Protein filtering criteria included peptide spectral matches (PSMs)≥2, and reporter ion intensity values above the minimum threshold in at least 75%of the TMT channels (i.e., present in any 54 of 73 samples or 30 of 40 samples). The final list of proteins was normalized using a two-step internal reference scaling (IRS) method which has been described previously [73]. Briefly, in-batch normalization was performed by calculating a scaling factor (SF), which is the ratio of the sum of intensity of the pooled channel to the sum of each individual TMT channel, followed by multiplying the intensities by the SF for each individual batch. Next, across-batch normalization was applied by the use of SF from the geometric mean of the TMT intensity of pooled samples. Once normalized, differentially-expressed proteins (p < 0.05) were determined by student’s t-test’s between AD and CN sample groups within each sample set. We did not use Bonferroni or other multiple hypothesis testing to keep a less stringent initial set of data to feed into the machine learning algorithm [74, 75]. A fold change cut-off of 1.23 (Set 1) and 1.33 (Set 2) was established based on biological and technical variation in the data [76]. The mass spectrometry proteomics data have been deposited to the ProteomeXchange Consortium (http://proteomecentral.proteomexchange.org/) via the PRIDE [77] partner repository with the dataset identifier PXD022265.
Machine learning
Data preparation
Supervised classification was performed using RStudio, R version 3.5.1. The data sets with at least 75%of the TMT channels filled were selected for further analysis. Models were built with two different approaches: 1) using only the protein data, and 2) using the protein data along with the variables of sex, age, years of education, and APOE status. In the models with combined data types, sex and APOE genotype status were converted to numeric variables. For APOE status, any patient with a 4/4 genotype was coded as a 4. Genotypes of 3/4 and 3/3 were coded as 3 and 2, respectively. All remaining patients, who had at least one APOE2 allele (2/3, 2/4 genotypes), were coded as 1. Prior to classification, differentially-expressed proteins were selected as the protein feature set. These were either combined or not combined with the clinical variables and then the matrix was scaled using the embedded scale function in R. After scaling, any missing values were replaced with the average value for the given feature in the dataset under consideration. Since the data had been scaled, the average value was zero in each case.
Classification
All supervised classification was performed with a support vector machine (SVM) using the R package, e1071 [78]. All area under the receiver-operator curve (AUC) values reported herein were calculated using the R package, pROC [79]. In order to ensure comparability from one experiment and one data set to the next, all of the SVM classifications were performed using identical parameters (i.e., leave-one-out cross-validation was performed in every case, and hyperparameters were not optimized). The reported accuracy was based on comparing the true class values to the probabilities generated in the model. The probabilities were also used in calculating the AUC.
To account for class imbalance and the fact that the data sets had different proportions of cases versus controls, a random undersampling and aggregation technique was employed. During undersampling, a random set of training samples was selected for model building, with the number for each class being equal and determined by subtracting one from the smallest class of samples. (For example, if there were 39 AD patients and 34 controls, the number of samples in each class in the training set would be 33.) The test sample was always excluded from consideration, and then training samples from each class were randomly selected, based on the pre-set number of samples to be used in the model. The SVM classification commenced, and the probability of the sample being assigned to Group 1 was recorded. This process was repeated 300 times for each sample. The 300 probabilities that resulted from the 300 classifications for each sample were averaged in order to determine a single probability for each sample. This algorithm maximally leverages all available data while not imparting a bias in the results based on the relative sizes of the two classes in the training set. Example code is provided in the Supplementary Material.
RESULTS
Plasma samples (N = 113) from four study groups, African American/Black cognitively normal (African American/Black CN, N = 26) and AD (African American/Black AD, N = 30), non-Hispanic White cognitively normal (non-Hispanic White CN, N = 28) and AD (non-Hispanic White AD, N = 29), were obtained from the University of Pittsburgh ADRC. Generally, there were twice as many females in each group and no significant differences were found in CN compared to AD groups with regards to sex, age, year of blood draw, and presence of other comorbidities (diabetes, hypercholesterolemia, hypertension). Each of the groups had an average 13 years of education, except the non-Hispanic White CN group which had ∼16 years of education (Table 1). The average MMSE scores for the CN samples were above 27 while for the AD samples they were below 15. Each patient sample also had information about APOE genotypes, and we note that the African American/Black AD group had a higher percentage (i.e., 23%) of the 4/4 genotype compared to non-Hispanic White AD group. AD groups overall had higher percentages of individuals who carried a homozygous and/or heterozygous 3/4 or 4/4 genotypes compared to the CN group.
A general overview of the plasma proteomics workflow employed for both Set 1 and Set 2 is shown in Fig. 1. For both experiments, all steps, except the digestion process were similar in order to simulate known variations in sample preparation study designs across proteomics laboratories. A total of 538 high confidence proteins (1%FDR, PSMs≥2) were identified in Set 1, and 596 proteins were identified in Set 2 yielding a total of 740 proteins from both sets (Fig. 2). Between Set 1 and Set 2, 395 proteins were identified in both sets. While this level of coverage is desirable, many of the proteins were identified in only a sub-population of the samples, so different filtering criteria were assessed to choose a data set size that balanced the competing needs of retaining many proteins in the data set while having quantitative data for as many samples as possible for each of the proteins. When considering only proteins with 50%of the TMT channels present, 285 and 380 proteins remained in Set 1 and Set 2, respectively. When considering only proteins with 75%of the TMT channels present, 249 and 314 proteins, respectively, were present in Set 1 and Set 2, with > 95%of the proteins in Set 1 also appearing in Set 2. This filtering option results in significantly better coverage for each protein while only minimally shrinking the size of the data set. We also considered filtering the data to include only proteins with 100%of the TMT channels present, which resulted in 189 proteins in Set 1, 257 proteins in Set 2, and 183 proteins in common between the two sets. This filtering option would likely remove too many important but low-abundant proteins. We selected those proteins present in 75%of the patient samples for further analysis, as this data set best balanced the needs of retaining as many proteins as possible while providing quantitative data for as many samples as possible for each protein.

Overview of the plasma proteomics workflow. Samples from four study groups-African American/Black Alzheimer’s disease (AD) and cognitively normal (CN), non-Hispanic White AD and CN-were obtained from the University of Pittsburgh ADRC. Samples were divided into Set 1 (N = 73) and Set 2 (N = 40) for this study. Samples were randomized into eight batches for Set 1 and four batches for Set 2. There was one QC pool sample in each batch and representation of one sample from each study group in each batch. The samples were randomly assigned TMT channels for both experiments. The experimental workflow was maintained the same except for the digestion step, where in solution digestion was used for Set 1, while FASP digestion was employed in Set 2. The plasma samples were immunodepleted of the six most abundant proteins, followed by proteolytic digestion. This was followed by isobaric tagging using either TMT 10/11 plex labels, followed by high pH reversed-phase fractionation. The resulting peptides were loaded into an Ultimate 3000 RPLC system coupled to an Orbitrap Fusion Lumos mass spectrometer for LC-MS, MS/MS and MS3 analysis. Example representative MS3 reporter ion spectra for TMT-10 plex sample (Set 1) and TMT-11 plex sample (Set 2) is also provided, demonstrating analysis of multiple samples using a single injection.
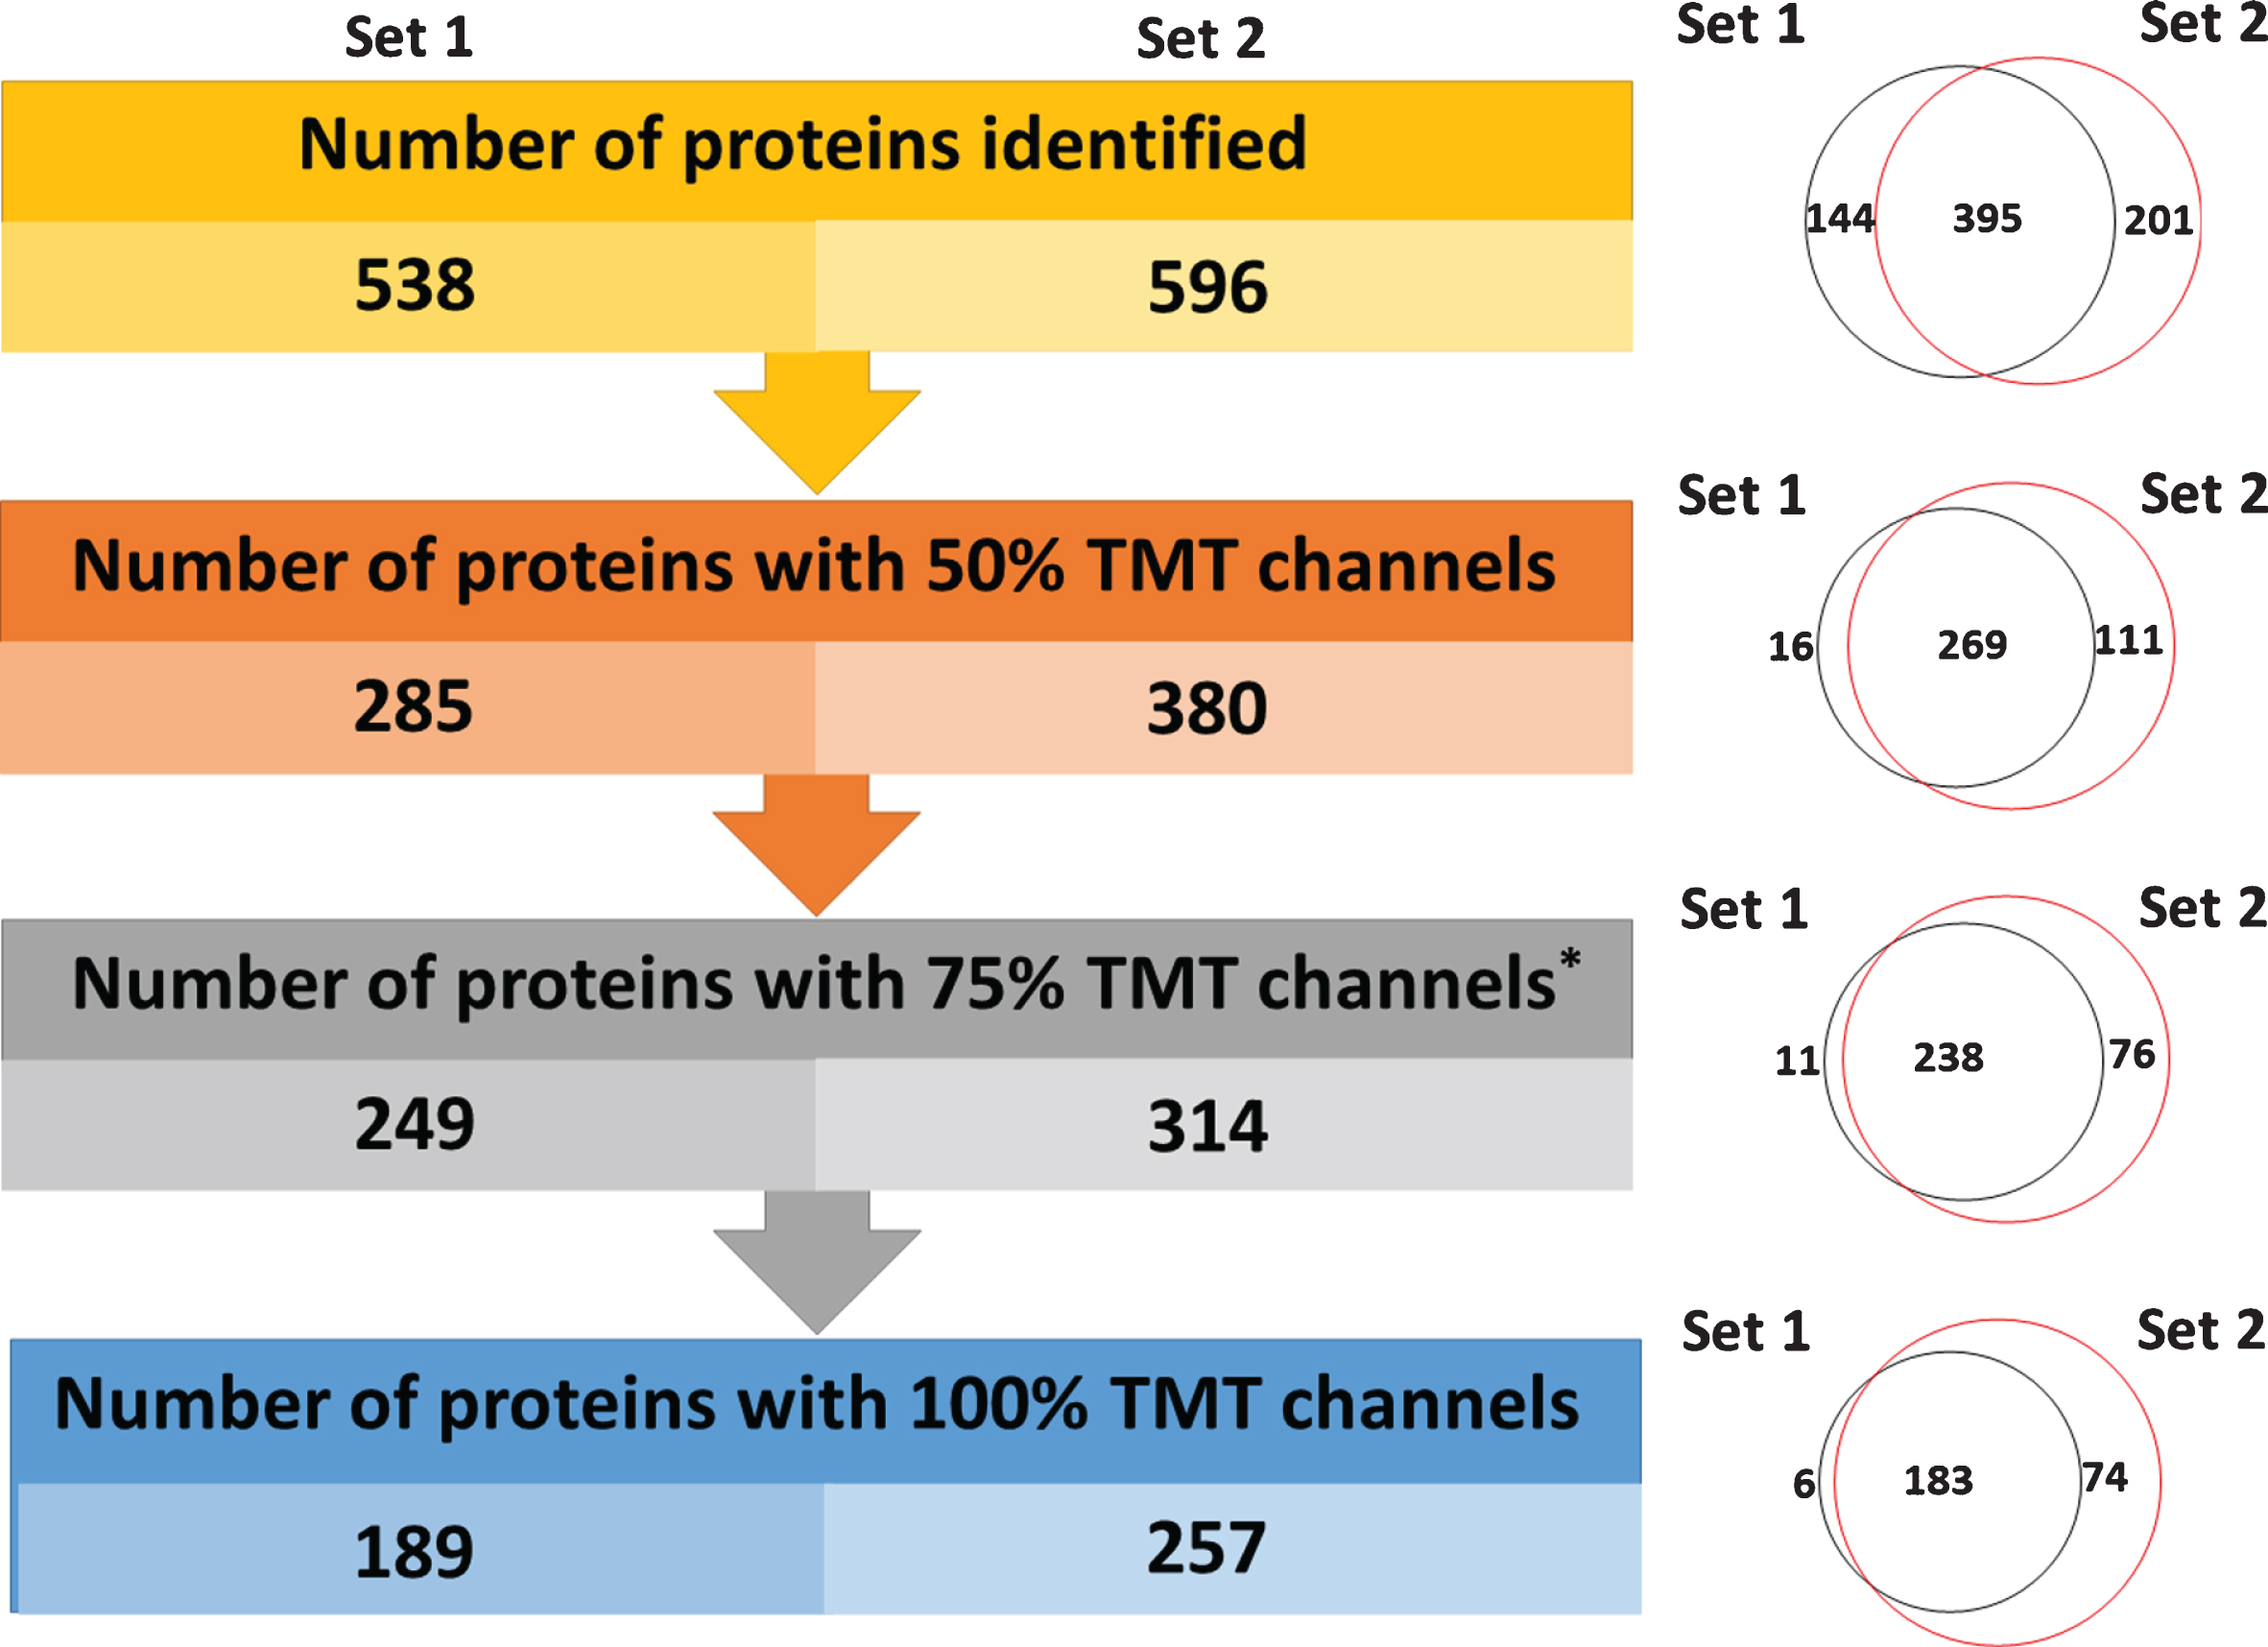
Summary of the number of identified proteins in both sample sets. On the left, are the number of high confidence identified proteins as a function of missing channels for TMT reporter ions. Values are provided for Set 1 and Set 2. On the right are Venn diagrams, displaying the overlap in common proteins at each level from Set 1 and Set 2.
Differentially-expressed proteins in AD
Since only a small fraction of plasma proteins were expected to be differentially expressed between AD and CN groups, a robust process to select the optimal proteins for machine learning was needed. Thus, we focused on identifying differentially-expressed proteins in Set 1 (N = 34 CN, N = 39 AD) which had a larger number of samples compared to Set 2 (N = 20 CN, N = 20 AD). For this initial analysis, we combined data from all of the CN individuals into one group and all with AD into a second group. Figure 3a displays a volcano plot distribution of protein TMT ratios of the AD compared to CN groups. Of the proteins with significant p-values in Set 1 (p < 0.05), four proteins had fold-changes that were > 1.18: beta-ala-his dipeptidase (FC = 0.73, p 0.0001), keratin type I cytoskeletal 9 (FC = 0.71, p 0.049), apolipoprotein L1 (FC = 0.84, p 0.03), and adiponectin (FC = 1.40, p 0.02). Beta-Ala-His dipeptidase, keratin type I cytoskeletal 9, and apolipoprotein L1 were all lower in AD compared to CN, while adiponectin was higher in AD. These changes are consistent with literature reports [80 –82]. Thus, these four proteins from Set 1 were selected as the protein feature to use in subsequent machine learning studies, and their utility for confirming AD was tested in both Set 1 and Set 2.
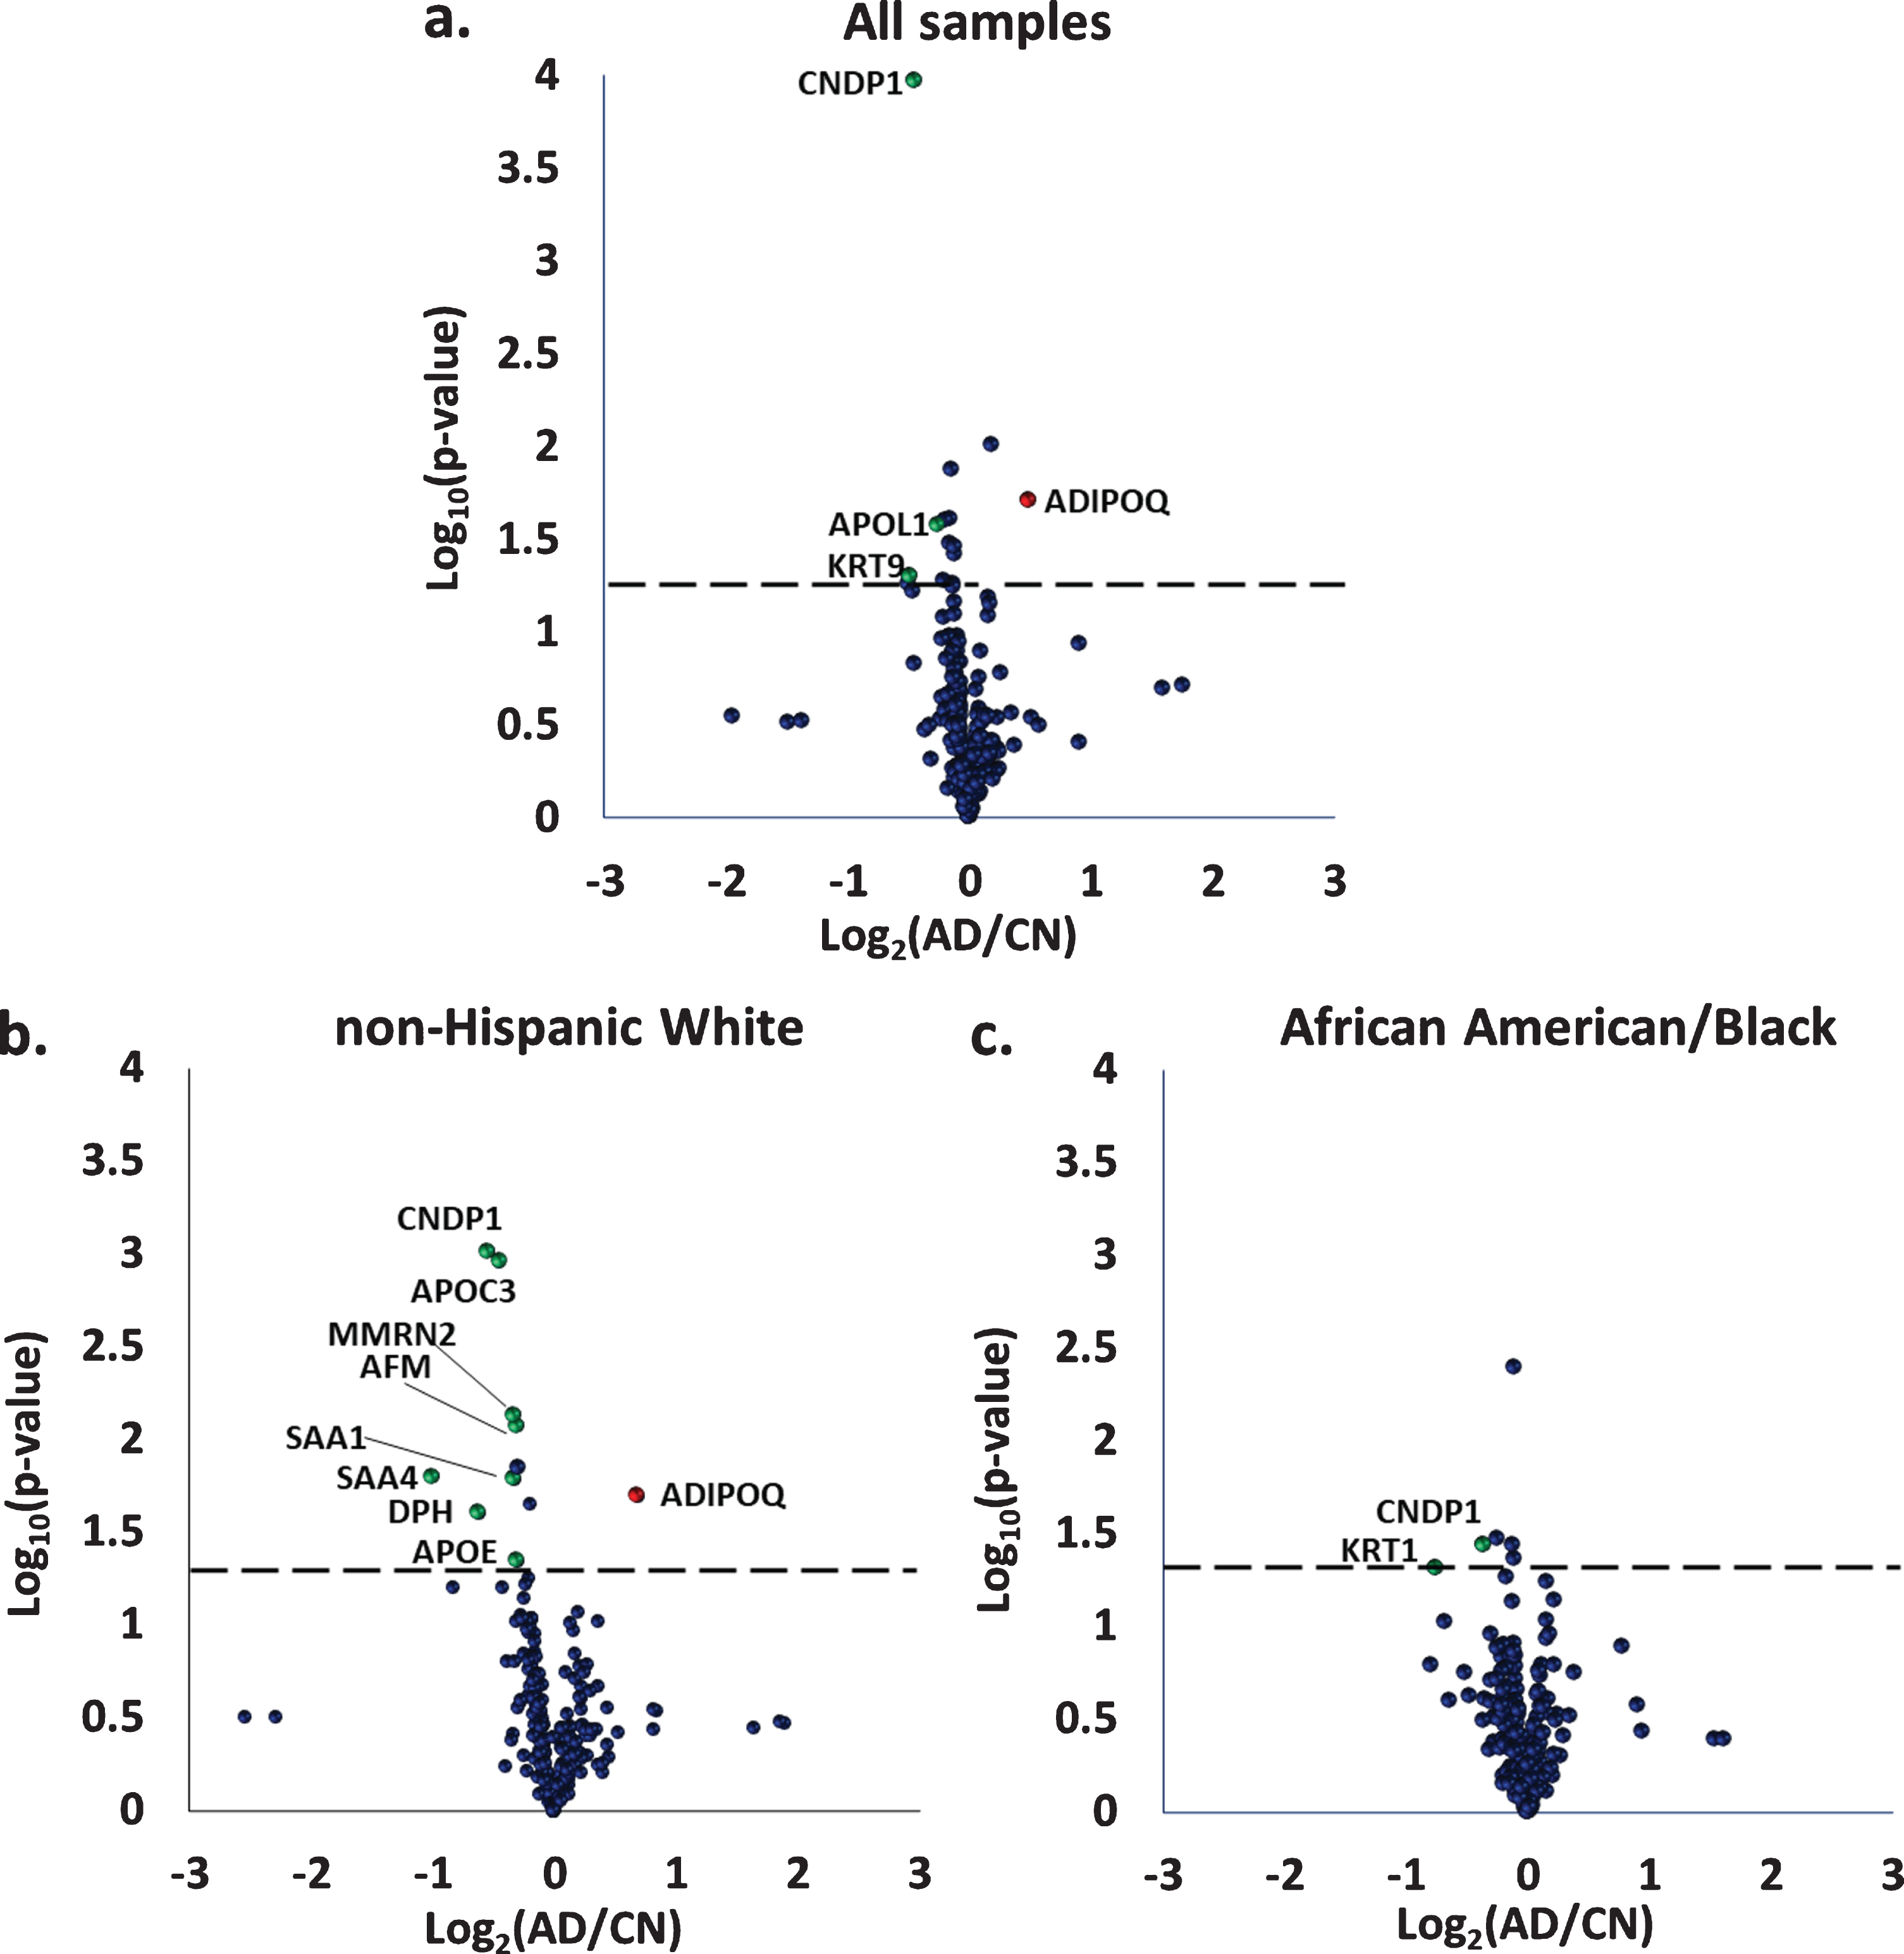
Volcano plots of differentially-expressed proteins between Alzheimer’s disease (AD) and cognitively normal individuals (CN) for the entire set of samples in a) Set 1 (N = 39 AD, N = 34 CN); b) data from the non-Hispanic White group only, Set 1 (N = 19 AD, N = 18 CN); and c) data from the African American/Black group only, Set 1 (N = 20 AD, N = 16 CN). Red circles coincide with proteins higher in AD compared to CN, while green circles coincide with proteins lower in AD. CNDP1, Beta-Ala-His dipeptidase; KRT9, Keratin type I cytoskeletal 9; APOL1, Apolipoprotein L1; ADIPOQ, Adiponectin; KRT1, Keratin type II cytoskeletal 1; APOC3, Apolipoprotein C3; MMRN2, Multimerin-2; AFM, Afamin; SAA1, Serum amyloid A-1 protein; SAA4, Serum amyloid A-4 protein; DPH, Dopamine beta-hydroxylase; APOE, Apolipoprotein E.
Using an SVM classifier and leave-one-out cross-validation, we determined the utility of the four selected proteins for confirming AD. Two models were tested: one included only the four proteins (beta-ala-his dipeptidase, keratin type I cytoskeletal 9, apolipoprotein L1, and adiponectin), and the second contained these proteins along with four additional variables: age, sex, years of education, and APOE status. These models were tested twice, using samples from either Set 1 or Set 2. The classification accuracies of the two models in Set 1 and Set 2, are shown in Fig. 4.

Histogram displaying classification accuracy for predicting AD in Set 1: N = 73 samples and Set 2: N = 40 samples. Blue bars: Accuracy determined when only the four differentially expressed proteins (beta-ala-his dipeptidase, keratin type I cytoskeletal 9, apolipoprotein L1, and adiponectin) are included in the model. Orange bars: Additional improvement in accuracy when clinical variables (age, sex, education, and APOE) are also included in the model.
Several significant outcomes are noted based on results in Fig. 4. In all four classifications, the non-Hispanic White adult samples had higher accuracy than the African American/Blacks adult samples. Additionally, in both Set 1 and Set 2, a higher overall accuracy was obtained when the other variables were included. However, the variables of age, sex, years of education, and APOE status, provided a bigger boost to the accuracy of the samples from non-Hispanic White adults compared to African American/Black adults. The fact that the two tested models were not as effective for the samples from African American/Black adults as they were for the samples from non-Hispanic White adults lead us to consider race-stratification of proteomics data prior to machine learning.
Differentially-expressed proteins in AD in race-stratified groups
Differentially-expressed proteins between AD and CN groups for the African American/Black and non-Hispanic White samples in Set 1, are shown using volcano plots in Fig. 3b, 3c. Nine proteins were differentially expressed for the non-Hispanic White samples. Most of these proteins were decreased in AD with serum amyloid A-1 protein having the largest change (FC = 0.5, p 0.02). The remaining proteins included: beta-ala-his dipeptidase (FC = 0.69, p 0.0009), dopamine beta-hydroxylase (FC = 0.69, p 0.03), apolipoprotein C3 (FC = 0.74, p 0.001), serum amyloid A-4 protein (FC = 0.8, p 0.02), multimerin-2 (FC = 0.8, p 0.01), apolipoprotein E (FC = 0.81, p 0.045), and afamin (FC = 0.81, p 0.01). Adiponectin (FC = 1.61, p-value 0.02) was the only proteins that increased in non-Hispanic White AD samples.
Two proteins were differentially-expressed in samples from African American/Black adults in Set 1 (Fig. 3c): beta-ala-his dipeptidase (FC = 0.78, p 0.04) and keratin type II cytoskeletal 1 (FC = 0.59, p 0.048). Only beta-ala-his dipeptidase was differentially-expressed in AD for both African American/Black and non-Hispanic White samples. A list of differ-entially-expressed proteins with corresponding p- and fold-change values for Set 1 and Set 2 are provided in Table 2 and Supplementary Table 1 respectively.
List of differentially-expressed proteins in race-stratified groups (Set 1)
#Fold change cut off 1.23; *p < 0.05. Bold denotes proteins that meet both fold-change cut-off and p-value<0.05.
Supervised classification of differentially-expressed proteins
Eight unique classifications were performed using the differentially-expressed proteins selected from volcano plots in Fig. 3b, 3c. The first SVM classification used the set of nine proteins that were differentially expressed in the non-Hispanic White group from Set 1 (Fig. 3b) as a feature set, and the non-Hispanic White group data from Set 1 for training. Similarly, a second classification was conducted in the same way with Set 2 samples. Two additional classifications were performed in which the nine proteins described above were combined with the four variables (age/sex/education/APOE status). In total, four classifications were performed using the proteins that were differentially expressed in the samples from non-Hispanic White AD adults in Set 1. A parallel set of four classifications was performed using the set of proteins that were differentially expressed in samples from African American/Black AD adults (Fig. 3c). These proteins were tested in Set 1 and Set 2, either on their own or with the four clinical variables. In every case where the feature set included proteins that had been differentially expressed in samples from African American/Black adults, those samples from the set being tested, were used to train the model. Results for all eight classifications, separated by racial group, are shown in Table 3. It should be noted that Table 3 exclusively includes the accuracy for test data, not training data. Test samples were always left out when training the models (see Methods).
Summary of results from machine learning
*Differentially-expressed proteins from Set 1 were used for the SVM classification. The full list of differentially-expressed proteins is provided in Table 2. Set 1: N = 73 samples, Set 2: N = 40 samples. Edu, education; APOE, Apolipoprotein E4 genotype; AUC; area under the curve.
Overall, when differentially-expressed proteins fr-om the non-Hispanic White group were used to classify AD in the samples, an effective model (i.e., AUC was 0.91 and the accuracy was 86%) was developed, but only for the samples from the non-Hispanic White adults. In contrast, the model performed noticeably worse (i.e., AUC of 0.49 and accuracy of 47%) when classifying the data from samples of African American/Black adults. When other (age, sex, education, APOE status) variables were also included in the model, the classification accuracy (i.e., AUC was 0.61 and the accuracy was 56%) of the samples from African American/Black adults improved, yet not to the level of accuracy what would be req-uired for an effective biomarker assay. Incorporating (age, sex, education, APOE status) variables improved the accuracy from 0.91 to 0.97 for the non-Hispanic White group, demonstrating that these variables could be combined with protein data to generate a model that can effectively predict AD in this demographic. This desirable outcome, which did not happen when those variables were included for the African American/Black group, suggests that other variables are needed to improve the accuracy of a given model for the African American/Black adult samples in this study.
When SVM classifications were performed on Set 2, the overall findings from Set 1 were generally replicated. Using data from samples in only the African American/Black adult group did not result in accurate classification (i.e., maximum AUC was 0.43 and the accuracy was 45%), either with or without (age, sex, education, APOE status) variables included. In Set 2, samples from non-Hispanic White adults were best classified by combining protein data and (age, sex, education, APOE) variables (Table 3).
Differences between the two racial groups are readily apparent when the classification model is built using differentially-expressed proteins (N = 2, Table 2) from the African American/Black group and only samples from this group to train the model. The best overall outcome for samples from non-Hispanic White adults occurred when Set 1 was classified using the clinical variables (sex/age/education/APOE status) and the protein features. In this case, an AUC of 0.91 and accuracy of 84%was obtained. Using similar data from samples in the African American/Black groups, resulted in worse classification performance (i.e., AUC of 0.47 and accuracy of 47%). The best overall outcome for samples from African American/Black adults was observed when no clinical variables were used and when testing data in Set 2. In that case, an improved classification was obtained (i.e., AUC of 0.84 and an accuracy of 70%) demonstrating how critical it was to evaluate various parameters and testing approaches in finding the best classification for both racial groups. However, it is clear that the performance outcomes of the machine learning model is also dependent on the samples and protein data obtained in training and test sets. In all the tests where samples from African American/Black adults were used for model training, more accurate classification without the age/sex/education/APOE status variables was obtained. By contrast, in three out of the four classifications where these variables were included for samples from non-Hispanic White adults, the samples from that group were more accurately classified.
DISCUSSION
In this study we performed two independent pl-asma proteomics experiments between AD and CN samples collected from African American/Black and non-Hispanic White participants from the University of Pittsburgh ADRC. At the time of this study, there were only 56 African American/Black participants that had banked plasma sample meeting our criterion. We used the demographics of those participants, primarily age, sex, and AD diagnosis, to match a similar size of non-Hispanic White participants. The AD diagnosis was clinically confirmed, and we used the most recent blood draw for these plasma analyses. Most characteristics that we evaluated of the participants were generally similar between African American/Black and non-Hispanic White groups.
We identified 740 proteins in total using TMT-based quantitative proteomics on an Orbitrap Fusion Lumos MS instrument, which is on par with recent plasma proteomics publications [83 –90]. However, with substantial increases in high pH reversed-phase fractionation in the sample processing, higher numbers of plasma protein identifications could have been identified [91]. Additionally, we note that our MS data acquisition method used MS3 for TMT measurements in order to increase the quantitative accuracy of differentially-expressed proteins. However, using this approach is known to increase instrument duty cycle and result in lesser protein identifications. After applying stringent criteria for identification, presence of TMT reporter ion channels across samples, and fold-change and p-value cutoffs, we identified a total of 27 differentially-expressed proteins (see Methods) in AD. These proteins were either different in a specific racial group or in comparisons of both racial groups together. Several of these proteins had changes in AD that were previously reported [80 , 90]. Notable in this study was the inclusion of samples from African American/Black ADRC participants. Based on our analyses, there was only one differentially-expressed protein (beta-Ala-His dipeptidase) in AD that was significant in both African American/Black and non-Hispanic White groups. Lower expression of this protein in AD for both groups is consistent with previous reports [90].
One of the proteins that was only differentially expressed in non-Hispanic White samples included ApoE, which has been widely reported as potential plasma biomarker in AD. There have been contradictory reports of ApoE being higher in AD [92], while others have reported it as lower in AD [52]. In our study, in samples from non-Hispanic White adults, ApoE was lower in adults in AD, whereas it did not have a significant change in AD versus CN in samples from African American/Black adults. Other proteins that were lower in samples from non-Hispanic White AD included afamin, ApoC3, serum amyloid A1 protein, and serum amyloid A4 protein, all of which have been reported to change in previous studies. Direction of change in afamin, ApoC3, and adiponectin (Table 2) were also consistent with literature reports [47 , 93–95]. Some of the differentially-expressed proteins (i.e., serum amyloid A1 and serum amyloid A4 proteins) that we identified were observed in other studies; however, the direction of change in AD versus CN was not consistent [90]. Two novel findings in this work were the differential expression of dopamine beta-hydroxylase and multimerin-2 which were only different in the non-Hispanic White group.
The main outcome from our machine learning analyses is that samples from the African American/Black and non-Hispanic White participants had not-able differences in performance outcomes. Proteo-mics data from non-Hispanic White adults was classified substantially more accurately than data from African American/Black adults when both ra-cial groups were combined in the training data (Fig. 4) and when only the non-Hispanic White group was used as training data (Table 3). The other main difference observed is that samples from the non-Hispanic White group were typically best classified when (age, sex, education, and APOE status) variables were included in the model, while the classification of the African American/Black group benefitted less from including these variables. In fact, including these variables was detrimental in both cases where samples only from the African American/Black group were used to train the model and using proteins differentially expressed only in the African American/Black group. Even in the case where samples from both African American/Black and non-Hispanic White groups were used to identify differentially-expressed proteins and to train the model (Fig. 4), including (age, sex, education, and APOE status) variables only improved the classification of the samples from African American/Black adults in test data sets.
Overall, these studies show how critical it is for biomarker discovery efforts to be inclusive of individuals from various racial and ethnic backgrounds as it can have a huge impact on effectiveness of machine learning models. These studies found overall that samples from the non-Hispanic White group were more accurately classified with SVM based on changes in plasma proteins from CN and AD adults. Also, the addition of age, sex, years of education, and APOE status as variables in the model dispro-portionally improved the classification accuracy of the non-Hispanic White group compared to the African American/Black group. It is not clear from our findings that the machine learning performance outcomes are simply just tied to the self-reported race as many factors such as life experiences, stress, age, education, mixed-dementia pathology are intermixed in the construct of race and can contribute to protein levels in plasma. These factors should be considered for the African American/Black group; however, are not easy to evaluate in terms of contributions to differential protein expressions in AD, which ultimately was used to feed proteins into the machine learning model. Achieving satisfactory outcomes with machine learning for AD with samples from African American/Black adults was possible in this study for one set of plasma proteins and without the use of covariates of age, sex, years of education, and APOE status variables. However, these studies clearly point to a need for increased plasma proteomics studies and number of plasma samples from African American/Black adults that are cognitively normal and with clinical diagnoses of AD in order to facilitate training of machine learning models and importantly, ensure favorable outcomes for African American/Black adults in plasma proteomics biomarker discovery efforts.
Study strengths and limitations
One of the major strengths of our study is the inclusion of plasma samples from both African Ame-rican/Black and non-Hispanic White individuals. The number of samples from each group was evenly distributed, with no significant differences due to sex, age, or comorbidities. Also, the AD samples having higher percentage of APOE4 allele present, as rep-orted by previous studies [1] was maintained by the samples in this study. This is the first study of its kind to compare these two racial groups in plasma proteomics experiments and directly evaluate in machine learning models for AD biomarker discovery. The majority of the proteins we found to be differentially expressed have been previously reported to change in AD; yet a few findings, with regard to AD-rel-ated protein expression, are novel, particularly when considering the protein expression data specific to samples from African American/Black adults. These findings coupled with the fact that the number of studies involving samples from African American/Black adults are very limited, puts emphasis on the need for conducting more AD research including African American/Black patient samples. This additional effort is necessary to both better understand disparities in disease incidence but also to ensure biomarker discovery efforts are effective for everyone.
We employed a randomized blinded study design and ensured samples from each study group were included in every TMT batch. This allowed us to min-imize error due to sample preparation. Also, we performed MS3 quantification, which provides highly accurate quantitative information and thus enhances confidence in the fold-changes observed for AD. This choice is potentially critical for facilitating biomarker discovery by focusing on robust protein changes [96]. Despite the use of MS3, which requires a higher duty cycle, we were able to identify similar numbers of proteins compared to recent publications using MS/MS approaches [83 –90].
Another strength is that we had enough plasma samples to establish two independent data sets so that the results obtained from a training set (Set 1) could be validated with a test set (Set 2). There was a high degree of overlap in terms of protein identifications in the training and test sets that could be considered for use in machine learning. Our study design allowed us to stratify our data post-analysis based on the self-reported racial and ethnic group of the participants. In this case, the machine learning model was able to differentiate AD samples with high accuracy for the non-Hispanic White group using a set of nine proteins that were selected based on volcano plot analysis. We believe it was a strength that our study design allowed us to test if self-reported race was a critical factor in the accuracy of potential biomarker candidates. The same protein set that produced high accuracy in the non-Hispanic White group performed poorly when applied to the African American/Black group in both data sets. This strongly indicates a need for more studies that have inclusive designs and for evaluation of whether self-reported race or other variables are critical for biomarker development.
A notable limitation of this study was that protein identifications were cut in half by filtering out proteins that were missing TMT values for at least 50%of the samples. We note that this loss is likely due to batch effects; for every additional TMT batch acquired, new proteins are observed while others can go undetected due to the stochastic nature of the data dependent acquisition [97]. Also, the use of MS3 could result in proteins being missed, as they may not have been selected for fragmentation in one TMT batch but were in another. DIA or targeted MRM methods could avoid this issue by only focusing on known protein identifications throughout the entire run.
While our sample size was a total of N = 113, which was on par with our similar studies involving AD [58 , 98], we note that for biomarker discovery efforts this sample size is still small. Obtaining samples from African American/Black participants is challenging with limited availability in ADRCs; however, we will need to work with other ADRCs and focused studies [99, 100] to generate large sample sizes especially from available African American/Black participants. Sample size is especially critical as any racial and ethnic group is not homogenous and existing knowledge in plasma proteomics for AD is based mostly on participants from non-Hispanic White and European backgrounds. We believe our moderate sample size also limited our ability to identify an adequate number and set of differentially-expressed proteins that could be effective for the machine learning classification of African American/Black adults. This is recognized by our study design to split samples into two sets for training and validation which reduced sample size in each group. However, our sample size was substantially higher than in other reported AD biomarker studies of African American/Black adults [37].
Finally, we note another limitation to this study was not including additional variables other than age/sex/education/APOE4 status that may have im-proved machine learning outcomes for samples from the African American/Black group. For example, it is recognized that biases in mini-mental state examination and other cognitive tests [101, 102] may result in inadequacies of generating similar types of participants and that quality of education may be a far more important factor than years of education to include in study designs [103]. Genetic ancestry could be included as an additional measure as well as the use of other types of genetic markers that have AD risk associated with African American/Black adults [104]. Stratification of groups based on self-reported race has limits also because it does not capture life-long experiences, such as discrimination and exposure to systemic racism [18], that have been shown to lead to inherent biases in healthcare and also impact plasma proteomic cytokine levels [105, 106].
CONCLUSIONS
Plasma proteomics analysis combined with classification by machine learning is a powerful strategy for identifying potential biomarker candidates that can be used for AD diagnosis. Plasma proteomics biomarker discovery efforts have largely excluded samples from African American/Black adults, and this study sought to include samples from this group to help facilitate biomarker discovery efforts for everyone. Our analyses demonstrated that potential biomarker candidates for AD diagnosis could be identified with high accuracy in plasma samples from non-Hispanic White adults that were cognitively normal or clinically diagnosed with AD, and that these same candidates were not effective in samples from African American/Black adults. Further improved machine learning outcomes for AD biomarker discovery were possible with the addition of variables such as age, sex, years of education, and APOE4 status in the training model; however, these specific variables do not appear to be as effective for classifying samples from African American/Black adults with plasma proteomics data. Thus, the search is on for a better set of plasma proteins and/or combined use of clinical/demographic variables which can be used to ensure biomarker discovery efforts in AD are effective for everyone, including African American/Black adults.
Footnotes
ACKNOWLEDGMENTS
The authors would like to thank the University of Pittsburgh ADRC and study participants for pro-viding plasma samples. The authors acknowledge funding from the Alzheimer’s Association (AARGD-17-533405), pilot funds from the University of Pit-tsburgh Alzheimer Disease Research Center funded by the National Institutes of Health and National Institute on Aging (P50AG005133, RASR), NICHD (R01 HD064727, NAP), the Vanderbilt Institute of Chemical Biology (T32-GM06508), the National Institutes of Health (R35GM130354, HD) and the National Institute on Aging (AG041718, AG030653, AG064877, MIK). The authors would also like to thank Dr. Lars Plate and Mahmud Reaz for providing the Python code for combining multi-batch TMT data.