
Abstract
Background:
Normal aging is accompanied by cognitive deficiencies, affecting women and men equally. Aging is the main risk factor for Alzheimer’s disease (AD), with women having a higher risk. The higher prevalence of AD in women is associated with the abrupt hormonal decline seen after menopause. However, other factors may be involved in this sex-related cognitive decline. Alterations in gut microbiota (GM) and its bioproducts have been reported in AD subjects and transgenic (Tg) mice, having a direct impact on brain amyloid-β pathology in male (M), but not in female (F) mice.
Objective:
The aim of this work was to determine GM composition and cognitive dysfunction in M and F wildtype (WT) and Tg mice, in a sex/genotype segregation design.
Methods:
Anxiety, short term working-memory, spatial learning, and long-term spatial memory were evaluated in 6-month-old WT and Tg male mice. Fecal short chain fatty acids were determined by chromatography, and DNA sequencing and bioinformatic analyses were used to determine GM differences.
Results:
We observed sex-dependent differences in cognitive skills in WT mice, favoring F mice. However, the cognitive advantage of females was lost in Tg mice. GM composition showed few sex-related differences in WT mice. Contrary, Tg-M mice presented a more severe dysbiosis than Tg-F mice. A decreased abundance of Ruminococcaceae was associated with cognitive deficits in Tg-F mice, while butyrate levels were positively associated with better working- and object recognition-memory in WT-F mice.
Conclusion:
This report describes a sex-dependent association between GM alterations and cognitive impairment in a mice model of AD.
Keywords
INTRODUCTION
Alzheimer’s disease (AD) is the most common cause of dementia, affecting around 50 million people worldwide [1]. This debilitating disorder is marked by the aggregation of two proteins: amyloid-β, which accumulates in plaques, and tau, which can become hyperphosphorylated and aggregates in neurofibrillary tangles [1]. Despite the recent advance in the understanding of AD pathology, the exact etiology continues to be debated, impeding further development of effective therapies to treat or prevent this neurodegenerative disease.
Several risk factors have been associated with AD, such as lack of primary education, metabolic alterations, smoking, depression, and APOEɛ4 genotype, among others [2]. Women had an 1.6-fold increase in AD incidence than men [3, 4], and this higher prevalence has been linked to the abrupt decline in sex hormones after menopause, and length of estrogen exposure during life [5, 6].
Cognitive abilities showed a sex dimorphism in young and old healthy subjects [7] as women showed advantages in object location memory [8, 9] and visual memory for objects [10, 11] over men. Contrary to this observation, male cognitive advantage is found on tests of mental rotation of spatial stimuli [12, 13] compared to females. With aging, however, this cognitive dimorphism in healthy subjects seems to be reversed or lost [14–16], with a worst [17–20] or better cognitive performance in men than women [14], or equal cognitive decline between genders [21].
Those conflicting results can be harmonized if we take in account the task and the related memory that was assessed. In early stages of AD, women showed still a better cognitive performance than age-matched men, but at advance stages of the disease, this cognitive advantage is lost [15, 22–26]. The Alzheimer’s Disease Neuroimaging Initiative (ADNI) study shows that during amnestic mild cognitive impairment (MCI), females performed better in verbal memory compared to males. However, high levels of amyloid burden associates with a loss of this female cognitive advantage [22–24], as no sex-related differences were observed on block design [27] and visuoconstructive tests [28] in AD patients. Notwithstanding, AD pathological hallmarks showed a sexual dimorphism that is present even in late stages of the disease, as AD women present more neuritic plaques and neurofibrillary tangles compared to aged-matched men [29]. In contrast, another study claimed that no difference in the prevalence of senile plaques or neurofibrillary tangles was found by gender [30]. The use of animal models may help to better elucidate the sex-related differences in AD pathology, as human data shows conflicting results. Age-matched female and male transgenic (Tg) mice have an identical genetic background; therefore, the pathological and cognitive differences may be associated only with sex. At 15–19 months of age, female Tg2576 mice present more amyloid plaques than their male counterparts [31]. Similarly, a stronger plaque burden was observed in female APP/PS1 Tg mice compared to males [32, 33]. Despite the greater amyloid burden developed in aged female Tg mice, no worst cognitive decline is observed compared to males [34]. Emerging research proposes that the gut microbiota (GM) could play a central role in the regulation of emotions and cognition [35, 36]. Alterations in the GM seems to accompany aging [37, 38], where a decreased bacteria diversity and a pro-inflammatory profile dominates GM in aged people [39, 40]. Moreover, recent evidence suggests that GM could play a major role in AD, as lower GM diversity is observed in AD patients compared to aged-matched healthy subjects [41–46]. So far, these studies have not discriminated the sex factor in their results, despite women’s higher incidence of AD. Experiments carried out in AD mice models showed a reduction in amyloid pathology after antibiotic-treatment in APP/PS1 male mice, but not in female mice [47]. Females’ GM antibiotic resistant effect deserves attention, as it may underlie important etiological factors associated with females’ vulnerability to develop AD. Therefore, it is necessary to determine the differences in the GM presented in female and male Tg mice, as well as describe the possible interaction between microbial communities and cognition as possible factor associated with women’s greater vulnerability to develop AD.
MATERIALS AND METHODS
Experimental design
Hemizygous APP/PS1 male (Tg-M) and female (Tg-F) mice expressing a chimeric mouse/human amyloid precursor protein (Mo/HuAPP695swe) and a mutant human presenilin 1 (PS1-dE9) transgene on a C57BL/6 genetic background (Jackson Laboratory, Bar Harbor, ME, USA, RRID: MMRRC-34829-JAX) and their wild-type (WT) littermates (males, WT-M and females, WT-F) were used for the study. Animal management was supervised by licensed veterinarian care and approved by the Bioethics Committee of the Center for Research and Advanced Studies of the National Polytechnic Institute (Cinvestav) in accordance with the Mexican official standard NOM-062-ZOO-1999 and the principles set forth in the 8th edition of the National Institute of Health (NIH) guide for the care and use of laboratory animals and endorsed by the Institute for Laboratory Animal Research, the Division on Earth and Life Studies, and the National Research Council of the National Academies. Once animals reached 4 months of age, they were individually housed with ad libitum access to food (AIN-93 diet) [48] and water under optimal vivarium conditions (12 h/12 h light–dark cycle, 20°C, and 40–50% relative humidity) for 2 months.
Estrous cycle evaluation
Cognitive evaluations in female mice were done only during the metaestrous/diestrous, the reproductive stages with the lowest hormonal levels [49], as estradiol have a direct impact in cognition and memory [50]. Cytology and typification of the reproductive stage was based on previous descriptions [51, 52].
Cognitive assessment
One week before sacrifice, behavioral testing was performed. To habituate the animals for the behavioral tests, animals were placed in the behavioral room 2 days before start testing trials. Anxiety-related behaviors were assessed by the Elevated Plus Maze (EPM) [50]. Briefly, the 50 cm elevated plus-shaped maze was made of medium-density fiberboard with a matte black acrylic surface and four arms (50 cm long and 10 cm wide) where two arms were open, and two arms were enclosed by 30 cm height walls. The task consisted of one trial per animal, where the animals were placed in the center of the EPM facing an open arm. Usually, rodents avoid open spaces and spend most of the time in enclosed places, such as the closed arms of the EPM [50]. Entries into the open/close arms were recorded during 5 min, and the animal’s trajectory was used to calculate percentage of time spent in each arm [50] (Fig. 1A, B).
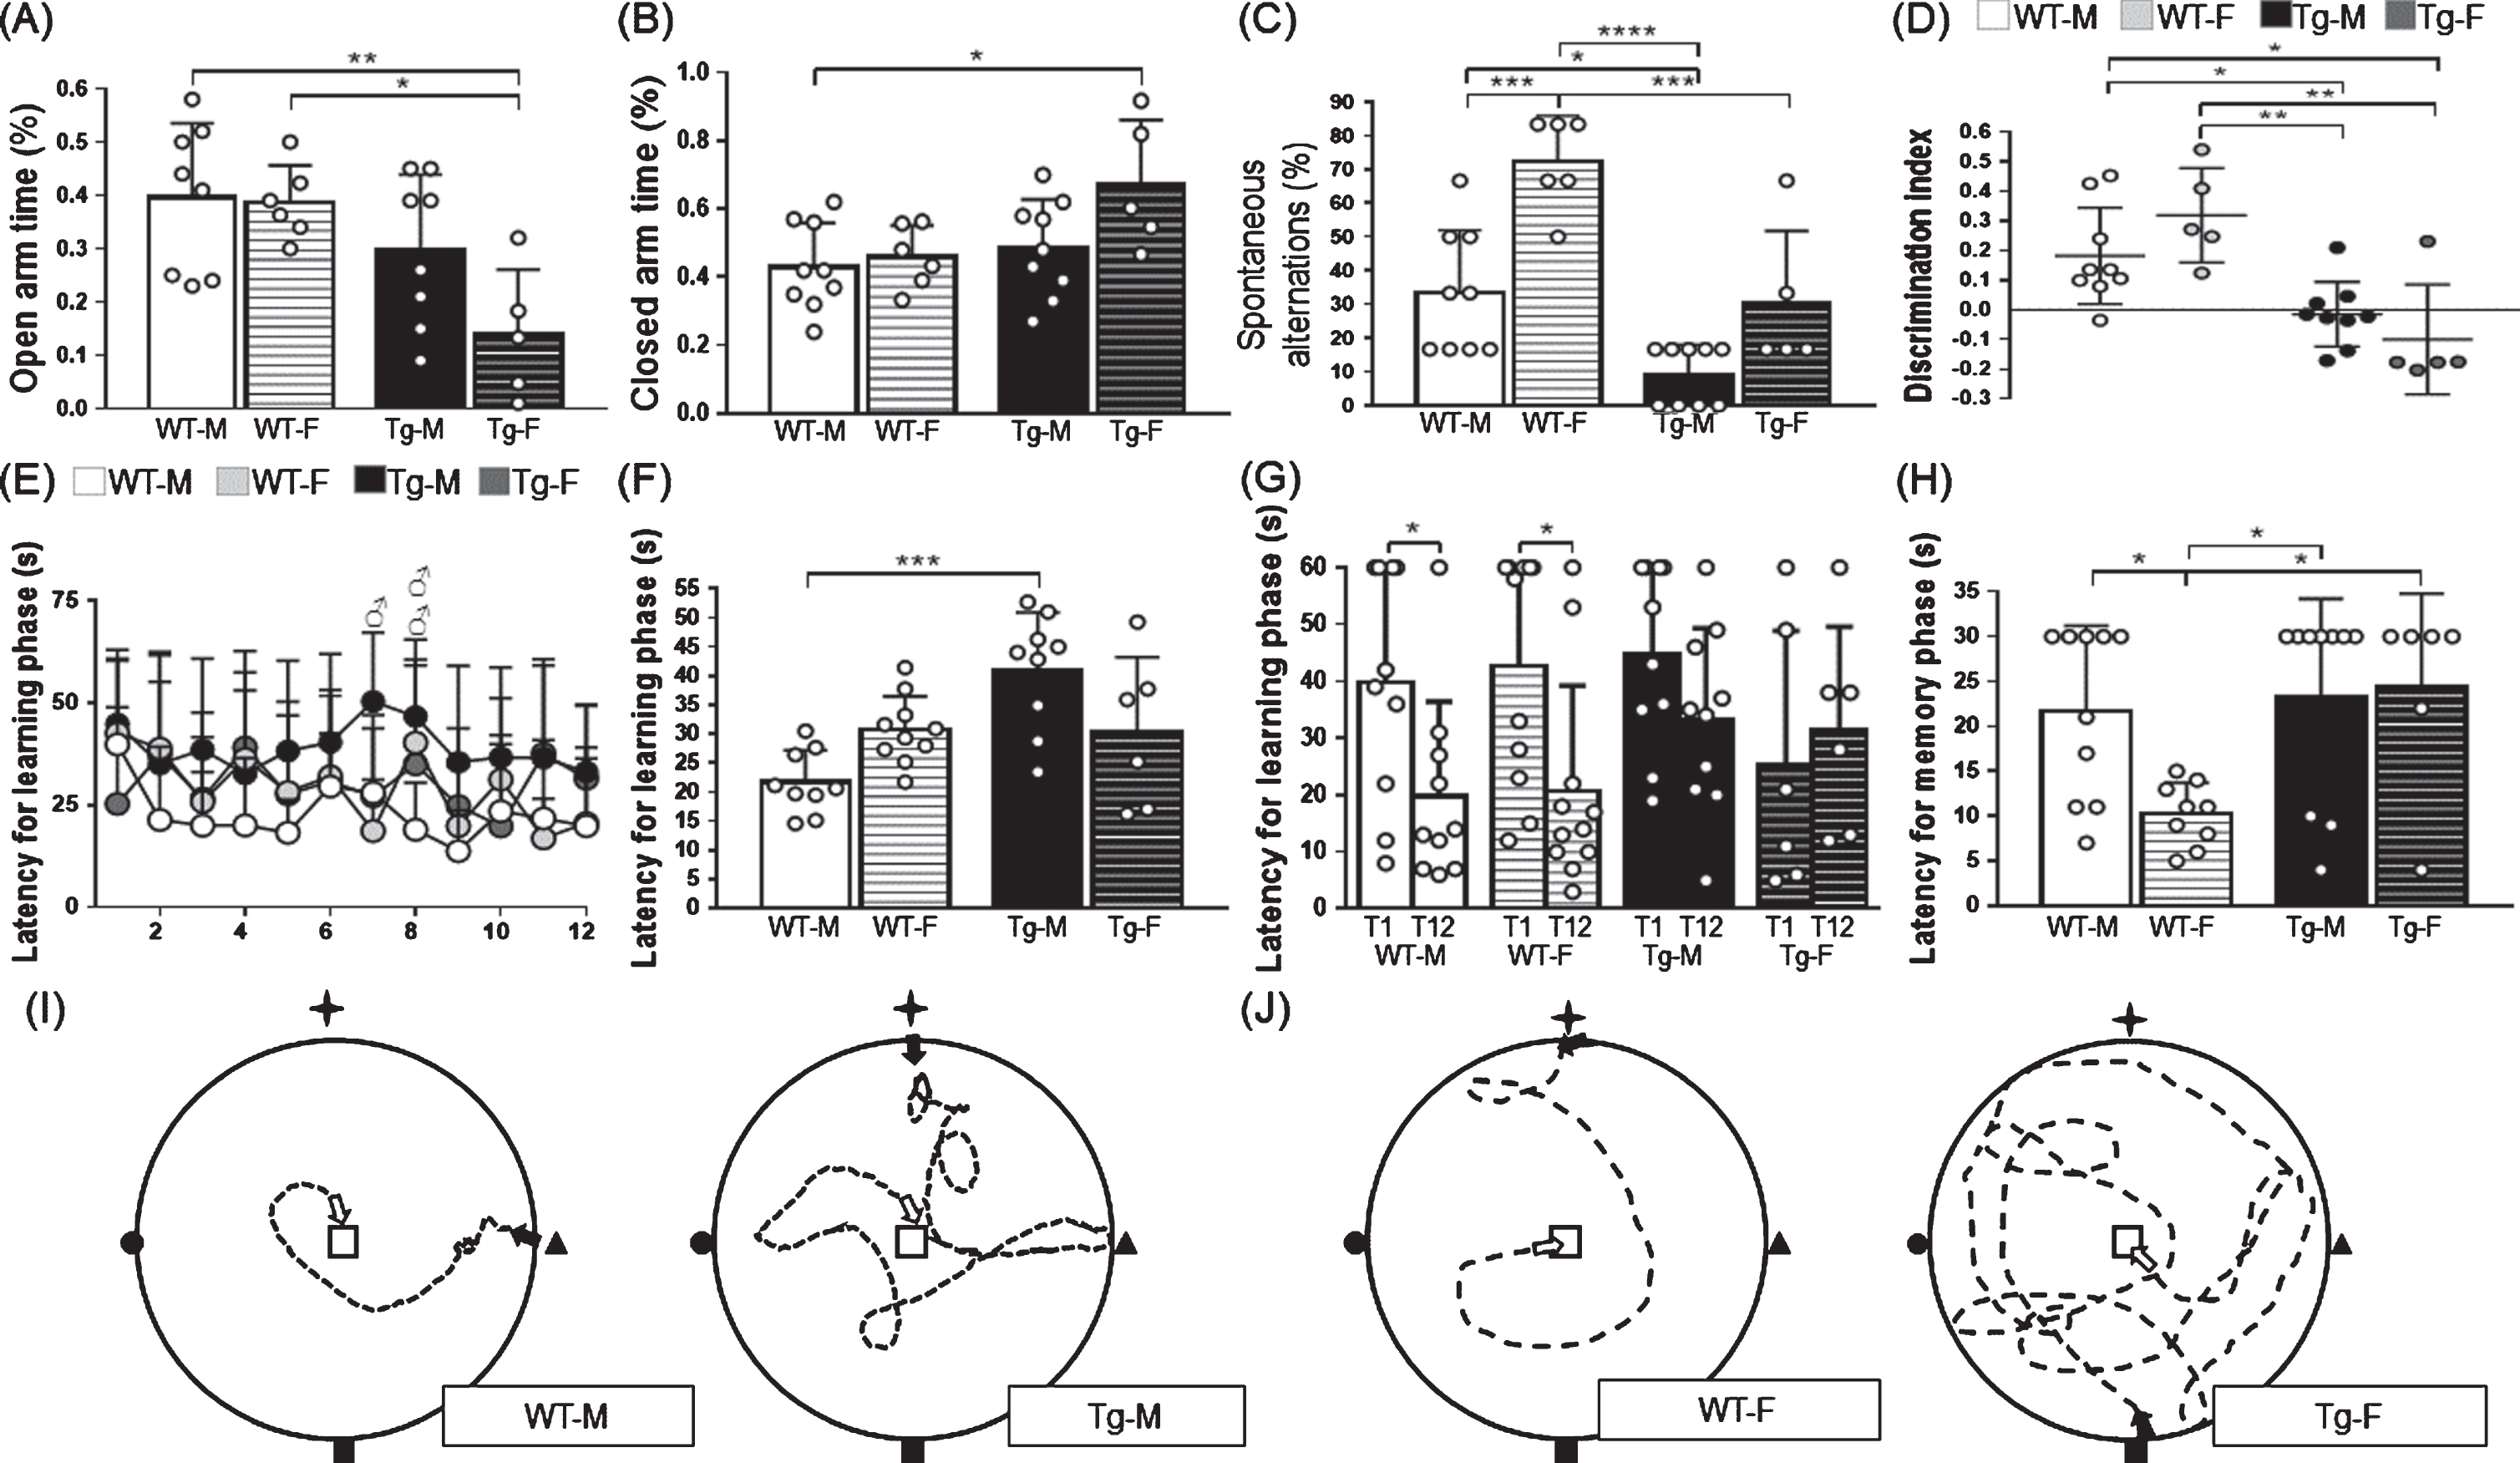
Effect of gender and genotype in anxiety and memory performance. A) Anxiety was inversely proportional to the time spent in the open arm [F (1, 23) = 2.35, 3.03 and 12.42 for interaction, row and column factor respectively] and B) directly proportional to the time spent in the closed arms [F (1, 25) = 2.15, 4.07 and 6.30 for interaction, row and column factor respectively] in the elevated plus maze. C) Working memory was directly proportional to the spontaneous alternations [F (1, 25) = 2.25, 24.31 and 30.05 for interaction, row and column factor respectively] in the T-maze. D) Recognition memory was directly proportional to the discrimination index [F (1, 24) = 3.50, 0.18 and 26.80 for interaction, row and column factor respectively] in the novel object recognition test. E) Spatial learning curves show the latency to find the hidden platform during learning phase [F (33, 396) = 1.03, F (11, 396) = 1.69 and F (3, 396) = 14.68 for interaction, row and column factor respectively] in the WM. X axis corresponds to the 12 consecutive learning assays. F) Spatial learning was inversely proportional to the latency to find the platform during learning phase [F (1, 30) = 10.95, 0.09 and 10.07 for interaction, row and column factor respectively] in the water maze. G) Learning performance was compared between trial 1 and 12 during learning phase in the WM. H) Spatial memory was inversely proportional to the latency to find the place where the platform was originally located [F (1, 31) = 4.02, 2.80 and 6.34 for interaction, row and column factor respectively] during WM memory phase. I) Representative schemes of WT-M and Tg-M mice trajectory for spatial learning trials from the start point to the platform area. J) Representative schemes of WT-F and Tg-F mice trajectory for the spatial memory trial from the start point to the platform area. Cardinal points are marked in maze walls as a star-shaped polygon (north), a square (south), a triangle (west), and a circle (east). Black arrow indicates start point, white arrow indicates finish point, central square indicates platform area and dotted line indicates mouse trajectory in the WM test. For A, WT-M n = 9, WT-F n = 7, Tg-M n = 9, and Tg-F n = 6. For B and C, WT-M n = 10, WT-F n = 7, Tg-M n = 10, and Tg-F n = 6. For D, WT-M n = 10, WT-F n = 6, Tg-M n = 10, and Tg-F n = 6. For E, F, and G, WT-M n = 10, WT-F n = 11, Tg-M n = 10, and Tg-F n = 6. For H, WT-M n = 10, WT-F n = 9, Tg-M n = 10, and Tg-F n = 6. For A-C and F-H, white color circles within bars indicate experimental subjects. For D and E, white, grey and black circles indicate experimental groups. Data are shown as mean±SD bars. For A-F and H, two-way ANOVA with Tukey post-hoc correction was performed comparing experimental groups. For G, unpaired t tests were performed comparing learning assay no.1 with no. 12 for each experimental group. For A-F and H, data between square brackets indicate F (DFn, DFd) values of two-way ANOVA with Tukey post-hoc corrections. Statistical significances are shown as *p < 0.05, **p < 0.01, ***p < 0.001, and ****p < 0.0001. For E, statistical significance between WT-M versus WT-F is shown by □, Tg-M versus Tg-F by ∘, WT-M versus Tg-F by epsfbox G:/Tex/IOSPRESS/JAD/201367/IF-01.eps, WT-F versus Tg-M by #, WT-M versus Tg-M by ♂and WT-F versus Tg-F by ♀one symbol represents p < 0.05, two symbols p < 0.01, three symbols p < 0.001, and four symbols p < 0.0001. T1 = learning trial no. 1, T12 = learning trial no.12, F, female; M, male; Tg, transgenic; WT, wild type.
Working memory was evaluated by the T-maze (TM) [53]. The TM is an appropriate test to evaluate hippocampal and PFC functions in rodents [54] and to examine cognitive deficits in early stages of AD pathology [55]. Briefly, a T-shaped maze apparatus of polymethylmethacrylate with starting arm (8.5×10.5×33.0 cm), and two choice arms (8.5×10.5×30.0 cm each, left and right) was used as previously described [56]. The TM task consisted of two phases: 1) Sample phase, animals were placed at the start arm and allowed to choose between left or right choice arms. A central divider was then inserted into the start arm to create a start box. Once animals have chosen an arm, they were confined there for 30 s, thereafter the door was reopened and allow mice to return to the start arm, where animals were removed and returned to their cage. 2) Choice phase, 2 min later, animals were placed again in the start arm without the central divider and allowed them to choose an arm. When animals faced the TM apparatus, they display a tendency to alternate and avoid the entry into the previously entered arm. If the animal chooses two different arms in both phases, this is counted as spontaneous alteration. Two hours later the procedure was repeated. Three trials were given on each day for 2 days, with a total of 6 trials per animal. Percentage of spontaneous alternations were calculated from total of correct arm entries (Fig. 1C).
Recognition memory was evaluated by the Novel Object Recognition task (NOR) [57]. NOR is an appropriate test to evaluate recognition memory related to hippocampus [58] and prefrontal cortex (PFC) [59] functions, both regions heavily affected in AD [56]. This task is based on the natural tendency of rodents to explore a novel object more than a familiar one [57]. NOR test was carried out in a 40 cm2 open field arena with 40 cm height walls of plywood surrounding the floor. NOR task consisted of three phases: 1) Habituation phase: animals explored the open field for 5 min without objects in the box; 2) Training phase: Twenty-four hours after habituation phase, animals were placed for 5 min in the box from the same starting position, and with two objects with identical features (weight, size, texture, shape and color) positioned in adjacent corners at 10 cm from the walls; 3) Trial phase: The recognition memory test was carried out 1.5 h after the training trial with the mice exploring the open field for 5 min in the presence of one familiar and one novel object, this last one different features than the former. A discrimination index (DI) was calculated for each animal after the test session (Fig. 1D) as DI = (time with novel object — time with familiar object) / (time with novel object+time with familiar object). Between all testing trials, all surfaces and objects were washed with 40 % ethanol solution. Exploration was defined as smelling and/or touching the object with the nose and/or forepaws [57].
Spatial memory was assessed by Water Maze (WM) [60]. The WM is an appropriate test to evaluate spatial memory related to hippocampus [61] and PFC [62] functions. Briefly, the WM task was carried out in a 100 cm diameter and 30 cm height round pool half filled with 26°C white water and an escape platform located in the center, as previously described [60]. Spatial clues were posted on each wall of the room with paper figures of different shapes and colors. WM task consisted of three phases, followed by an adaptation phase that consisted of placing the mice for 20 s on the scape platform visible for the animal: 1) Training phase: mice were released and allowed to swim in order to reach the scape platform in a maximum time of 60 s. This phase was repeated three times, each starting from a different cardinal point. 2) Learning phase: the animal was allowed to swim in order to find the hidden scape platform in a maximum time of 60 s for 12 consecutive trials, starting 3 non-consecutive times from different cardinal points. 3) Memory phase: immediately after all animals have completed the 12 consecutive learning trials, they performed 1 probe trial, in which the scape platform was removed from the pool. The animal was released from the north and allowed to swim to find the missing platform in a maximum time of 30 s. The time spent (latency) to find the hidden platform (learning phase) and the platform area (memory phase) in the pool was recorded and assigned as an inversely proportional measure to the spatial learning and memory respectively (Fig. 1E-H). Experiments were recorded with a Logitech DH Pro Webcam C920 camera connected to a computer equipped with Logitech Capture 1.10.110 with the Eniima software (inhouse made software) in order to track animal’s behavior and trajectory (Fig. 1I, J).
Determination of short chain fatty acids in feces
Fecal samples were collected for each animal before the cognitive tests. Animals were placed for 1 h in a Super Mouse 750™ Micro-Isolator® system cage for housing mice (15 cm width x 30 cm long x 17 cm high) previously cleaned and disinfected. At least 100 mg of feces pellets were collected per animal, immediately frozen and store at –70°C until use, for short-chain fatty acids (SCFAs) determination or microbiota analysis.
For SCFAs determination, the collected fecal samples were dried to constant weight and subsequently processed using the solid-phase extraction (SPE) method to analyze via HPLC (PerkinElmer Series N3896). At least 50 mg of dried feces were suspended completely in 1 ml of deionized water by vigorous mixing in a vortex at maximum speed for 10 min. The suspension was centrifuged at 13000 rpm for 10 min, the supernatant was transferred to a fresh tube and passed through activated C-18 max 100 mg/mL GracePure™ Reversed-Phase SPE Columns according to the manufacturer’s instructions as previously described [63]. The SCFAs were eluted with 1 mL of filtered water (Nylon Syr Filter, 13 mm, 0.22μm) and analyzed via HPLC using 20:80 acetonitrile:NaH2PO4 (J.T. Baker No. 9012-03 and Sigma-Aldrich No. S8282 respectively) at a pH of 2.2 using phosphoric acid, (J.T. Baker No. 0260-05) as mobile phase [64]. Standard curves were prepared for acetate (Sigma-Aldrich No. 45754-100ML-F), propionate (Sigma-Aldrich No. P1386-500ML), and butyrate (Sigma-Aldrich No. B103500-500ML). SCFAs proportion was calculated taking the total amount of acetate + propionate + butyrate for each experimental subject as 100% .
Fecal microbiota analysis
Bacterial DNA was extracted using the Favor-Prep™ Stool DNA Isolation Mini Kit (Favorgen Biotech Corp, Cat. No: FASTI001-1) according to the manufacturer's instructions. The purified DNA quantity was measured using 260/280 nm absorbance using a Nano Drop 2000 spectrophotometer (Thermo Scientific), and its quality was evaluated by 0.5% agarose gels electrophoresis. Genomic libraries of ∼281 base pairs (bp) 16S rDNA 3rd hypervariable region (V3) amplicons were generated for each experimental subject using specific V3-341F primers against V3 that also contained a different 12-bp Golay barcode (set of barcodes 1–100) complementary to position 340–356 of Escherichia coli 16S rRNA molecule rrnB GeneBank J01859.1 and an overhang adapter specified by Ion Torrent, and V3-518R reverse primers complementary to position 517–533 of the same molecule [65]. The amplicons of the V3 regions were generated by 1X 50μl polymerase chain reactions (PCR) containing 1μl of 10μM forward primer, 1μl of 10μM reverse primer (settings specified above), 0.25μl of 5 U/μl high thermostable DNA recombinant polymerase (Thermo Scientific No. EP0402), 1μl of 10 mM dNTP mix (Thermo Scientific No. R0191), 4μl of 25 mM MgCl2 (Thermo Scientific No. R0971), 5μl of 10X taq buffer with KCl (100 mM Tris-HCl [pH = 8.8 at 25°C], 500 mM KCl and 0.8% volume/volume [% v/v] nonidet P40, Thermo Scientific No. B38) and 20 ng of genomic DNA in 37.75μl of nuclease-free water (Thermo Scientific No. R0581) per reaction. Amplification was carried out using Applied Biosystem Veriti Thermal Cycler (Supplementary Table 1). For sequencing, equivalent amounts of 1 to 100 barcoded amplicons (∼10μg each) were combined. Each mix was purified using E-Gel iBase Power System (Invitrogen). The libraries size and concentration were determined using an Agilent 2100 Bioanalyzer, and libraries for each run were adjusted to 26 pM prior to clonal amplification. Emulsion PCR was carried out using the Ion OneTouch™ 200 Template Kit v2 DL (Life Technologies), according to the manufacturer's instructions. Amplicon enrichment with ion spheres was done using Ion OneTouch ES. The sequencing was done using the Ion 316 Chip Kit v2 and the Ion Torrent Personal Genome Machine (PGM) System. After sequencing, reads were filtered by the PGM software to remove low quality and polyclonal sequences. During this process, sequences matching the 3' adapters were automatically trimmed and filtered. Ion Torrent PGM software, Torrent Suite v4.0.2, was used to demultiplex the sequenced data based on their barcodes. Poor quality reads were eliminated from the datasets, i.e., quality score ≤20, containing homopolymers >6, length <200 nucleotides (nt), and containing errors in primers or barcodes. Filtered data were exported as FASTQ files. Demultiplexed sequencing data were analyzed using quantitative insights into microbial ecology (QIIME) software v1.9.0 pipeline [66]. FASTQ files were converted into FASTA files, and all demultiplexed files were concatenated into a single file. Closed reference operational taxonomic units (OTUs) were determined at the 97% similarity level using the UCLUST algorithm. Chimeras were detected and removed from the datasets using the ChimeraSlayer. Sequence alignments were done against the Greengenes 13.9 core set (sequencing summary is shown in Supplementary Table 2). Microbial sequence data were pooled for OTUs analysis and comparison of taxonomic relative abundance was obtained (Figs. 23, Supplementary Figure 1, Table 1, and Supplementary Table 3). Prior to calculate microbial diversity, the OTU table was rarefied at 8,700 sequences per sample (samples with <8,700 were omitted) using a “single_rarefaction.py” QIIME script for alpha diversity metrics. Taxa richness measurements (Observed and Chao1) and alpha diversity indexes (Shannon and Simpson) were calculated (Fig. 4A, Table 2, and Supplementary Figure 2). Weighted and unweighted UniFrac distances were used to perform the principal coordinate analysis (PCoA; Fig. 4B). Community diversity was determined by the number of OTUs and beta diversity, measured by UniFrac unweighted and weighted distance matrices in QIIME software v1.9.0. Analysis of similarities (ANOSIM) and permutational multivariate analysis of variance (ADONIS), were used to determine statistically significant clustering of groups based upon microbiota structure distances. Furthermore, linear discriminant analysis (LDA) effect size (LefSe) program v1.0 was used to perform LDA (scores ≥2; Fig. 5 and Supplementary Table 4) in order to estimate significant effect size of each bacterial taxa between experimental groups [67].

Relative abundance of bacterial taxa in fecal samples. A) Pie charts of phyla’s relative abundance. The numbers on/beside charts indicate the percentage of abundance. For A, the color of each tag indicates bacterial phyla. Others refers to phyla abundances < 0.1% of relative abundance. B) Relative abundance of bacterial taxa. The color of each tag indicates order, family and genus bacterial taxa. Others refers to taxa <0.5% of relative abundance. WT-M n = 9, WT-F n = 8, Tg-M n = 6, and Tg-F n = 6. Data are shown as mean. Complete abundances and statistical significances are shown in Table 1. F, female; f, family; g, genus; M, male; o, order; Tg, transgenic; WT, wild type.
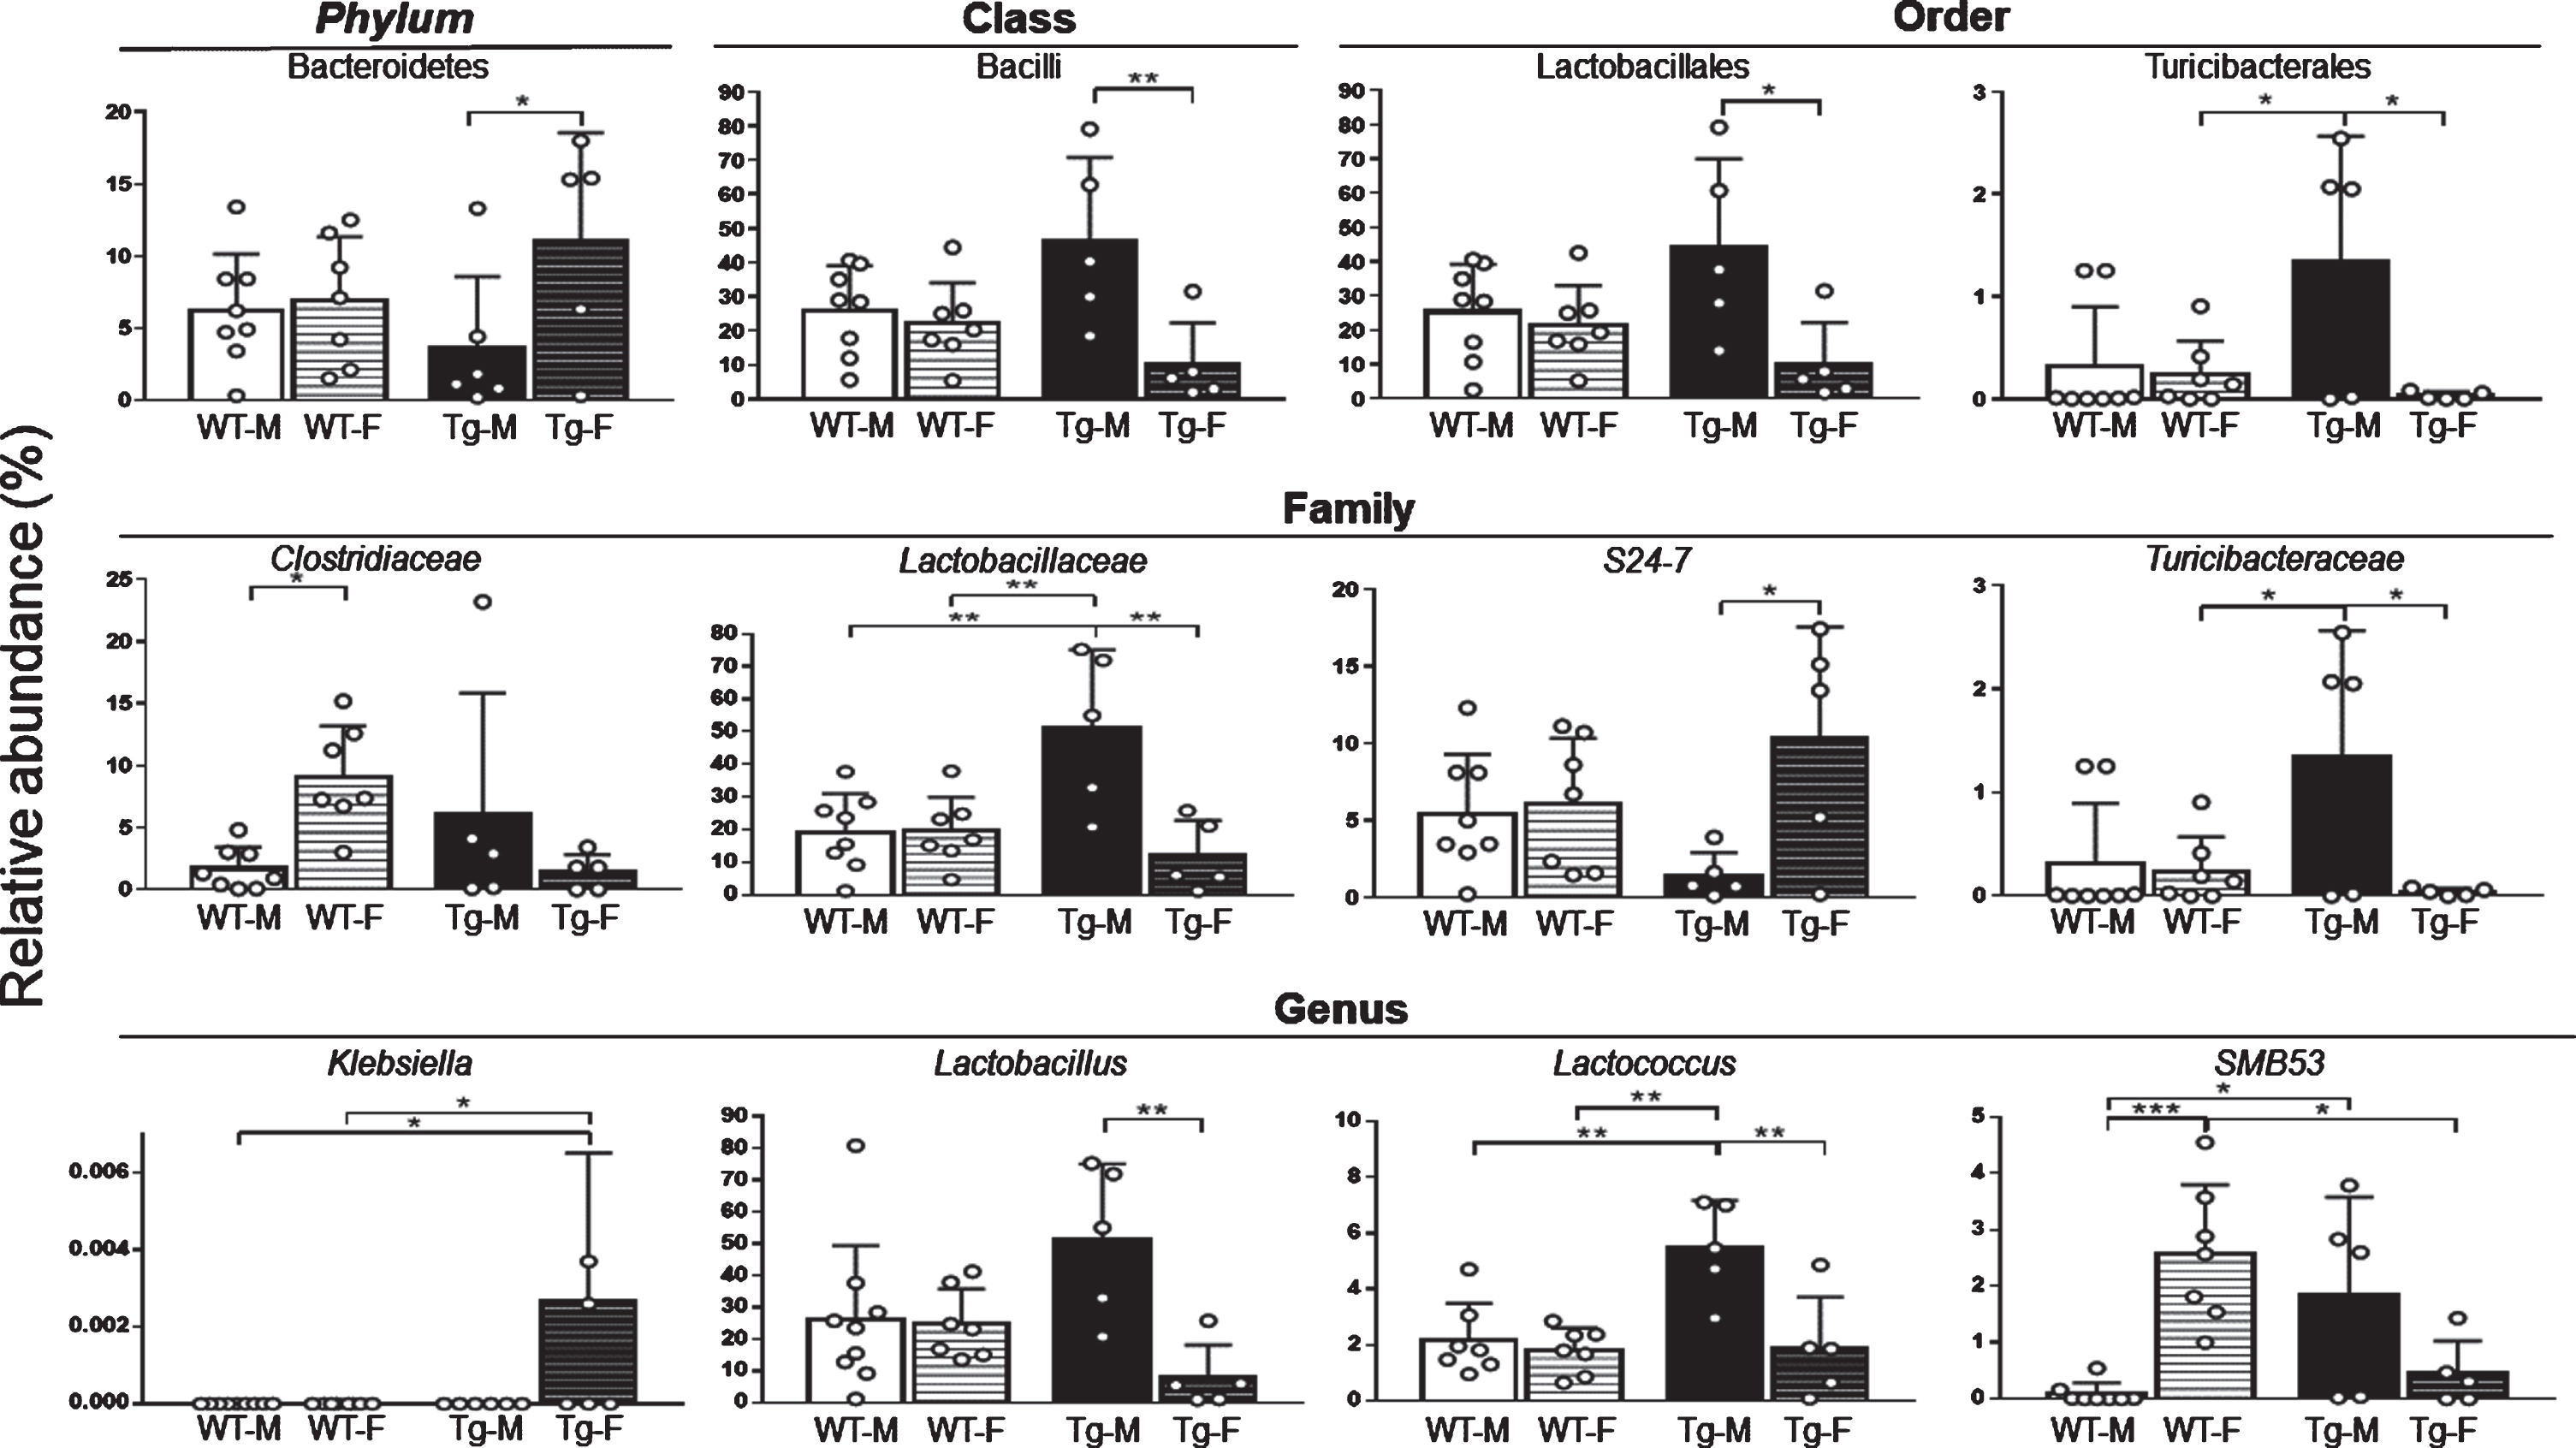
Relative abundance of prominent bacterial taxa in fecal samples. Relative abundance values of Bacteroidetes [F (1, 21) = 5.20, 6.93 and 0.92 for interaction, row and column factor respectively], Bacilli [F (1, 21) = 6.38, 9.92 and 0.42 for interaction, row and column factor respectively], Lactobacillales [F (1, 21) = 5.24, 8.15 and 0.29 for interaction, row and column factor respectively], Turicibacterales [F (1, 21) = 5.27, 6.69 and 2.29 for interaction, row and column factor respectively], Clostridiaceae [F (1, 21) = 8.99, 0.44 and 0.64 for interaction, row and column factor respectively], Lactobacillaceae [F (1, 21) = 11.16, 10.98 and 4.26 for interaction, row and column factor respectively], S24-7 [F (1, 21) = 4.96, 6.54 and 0.003 for interaction, row and column factor respectively], Turicibacteraceae [F (1, 21) = 5.20, 6.60 and 2.34 for interaction, row and column factor respectively], Klebsiella [F (1, 25) = 0.05 for interaction, row and column factor], Lactobacillus [F (1, 22) = 7.59, 8.67 and 0.30 for interaction, row and column factor respectively], Lactococcus [F (1, 21) = 7.50, 11.60 and 8.23 for interaction, row and column factor respectively] and SMB53 [F (1, 21) = 20.96, 1.55 and 0.17 for interaction, row and column factor respectively] present in fecal samples are shown. WT-M n = 9, WT-F n = 8, Tg-M n = 6, and Tg-F n = 6. White color circles within bars indicate experimental subjects. Data are shown as mean. Data between square brackets indicate F (DFn, DFd) values of two-way ANOVA with Tukey post-hoc correction. Statistical significances are shown as *p < 0.05, **p < 0.01, ***p < 0.001, and ****p < 0.0001. Complete abundances and statistical significances are shown in Table 1 and Supplementary Table 3. F, female; M, male; Tg, transgenic; WT, wild type.
Fecal microbiota relative abundance (%) reported in Figures 2 and 3
Fecal microbiota proportions are shown for bacterial phyla, orders, families, and genera in Figs.4. WT-M n = 9, WT-F n = 8, Tg-M n = 6, and Tg-F n = 6. Data are shown as mean. Statistical significances (p values) were calculated by two-way ANOVA with Tukey post-hoc correction. Statistical significance between WT-M versus WT-F is shown by □, Tg-M versus Tg-F by ∘, WT-M versus Tg-F by epsfbox G:/Tex/IOSPRESS/JAD/201367/IF-01.eps, WT-F versus Tg-M by #, WT-M versus Tg-M by ♂, and WT-F versus Tg-F by ♀; one symbol represents p < 0.05, two symbols p < 0.01, three symbols p < 0.001, and four symbols p < 0.0001. f, family; g, genus; o, order; p, phylum; Tg-C, transgenic mice fed with control diet; Tg-F, transgenic mice fed with agave fructans supplemented diet; Tg-F-Abx, transgenic mice fed with agave fructans supplemented diet and treated with antibiotics as described in materials and methods; WT-C, wild type mice fed with control diet.
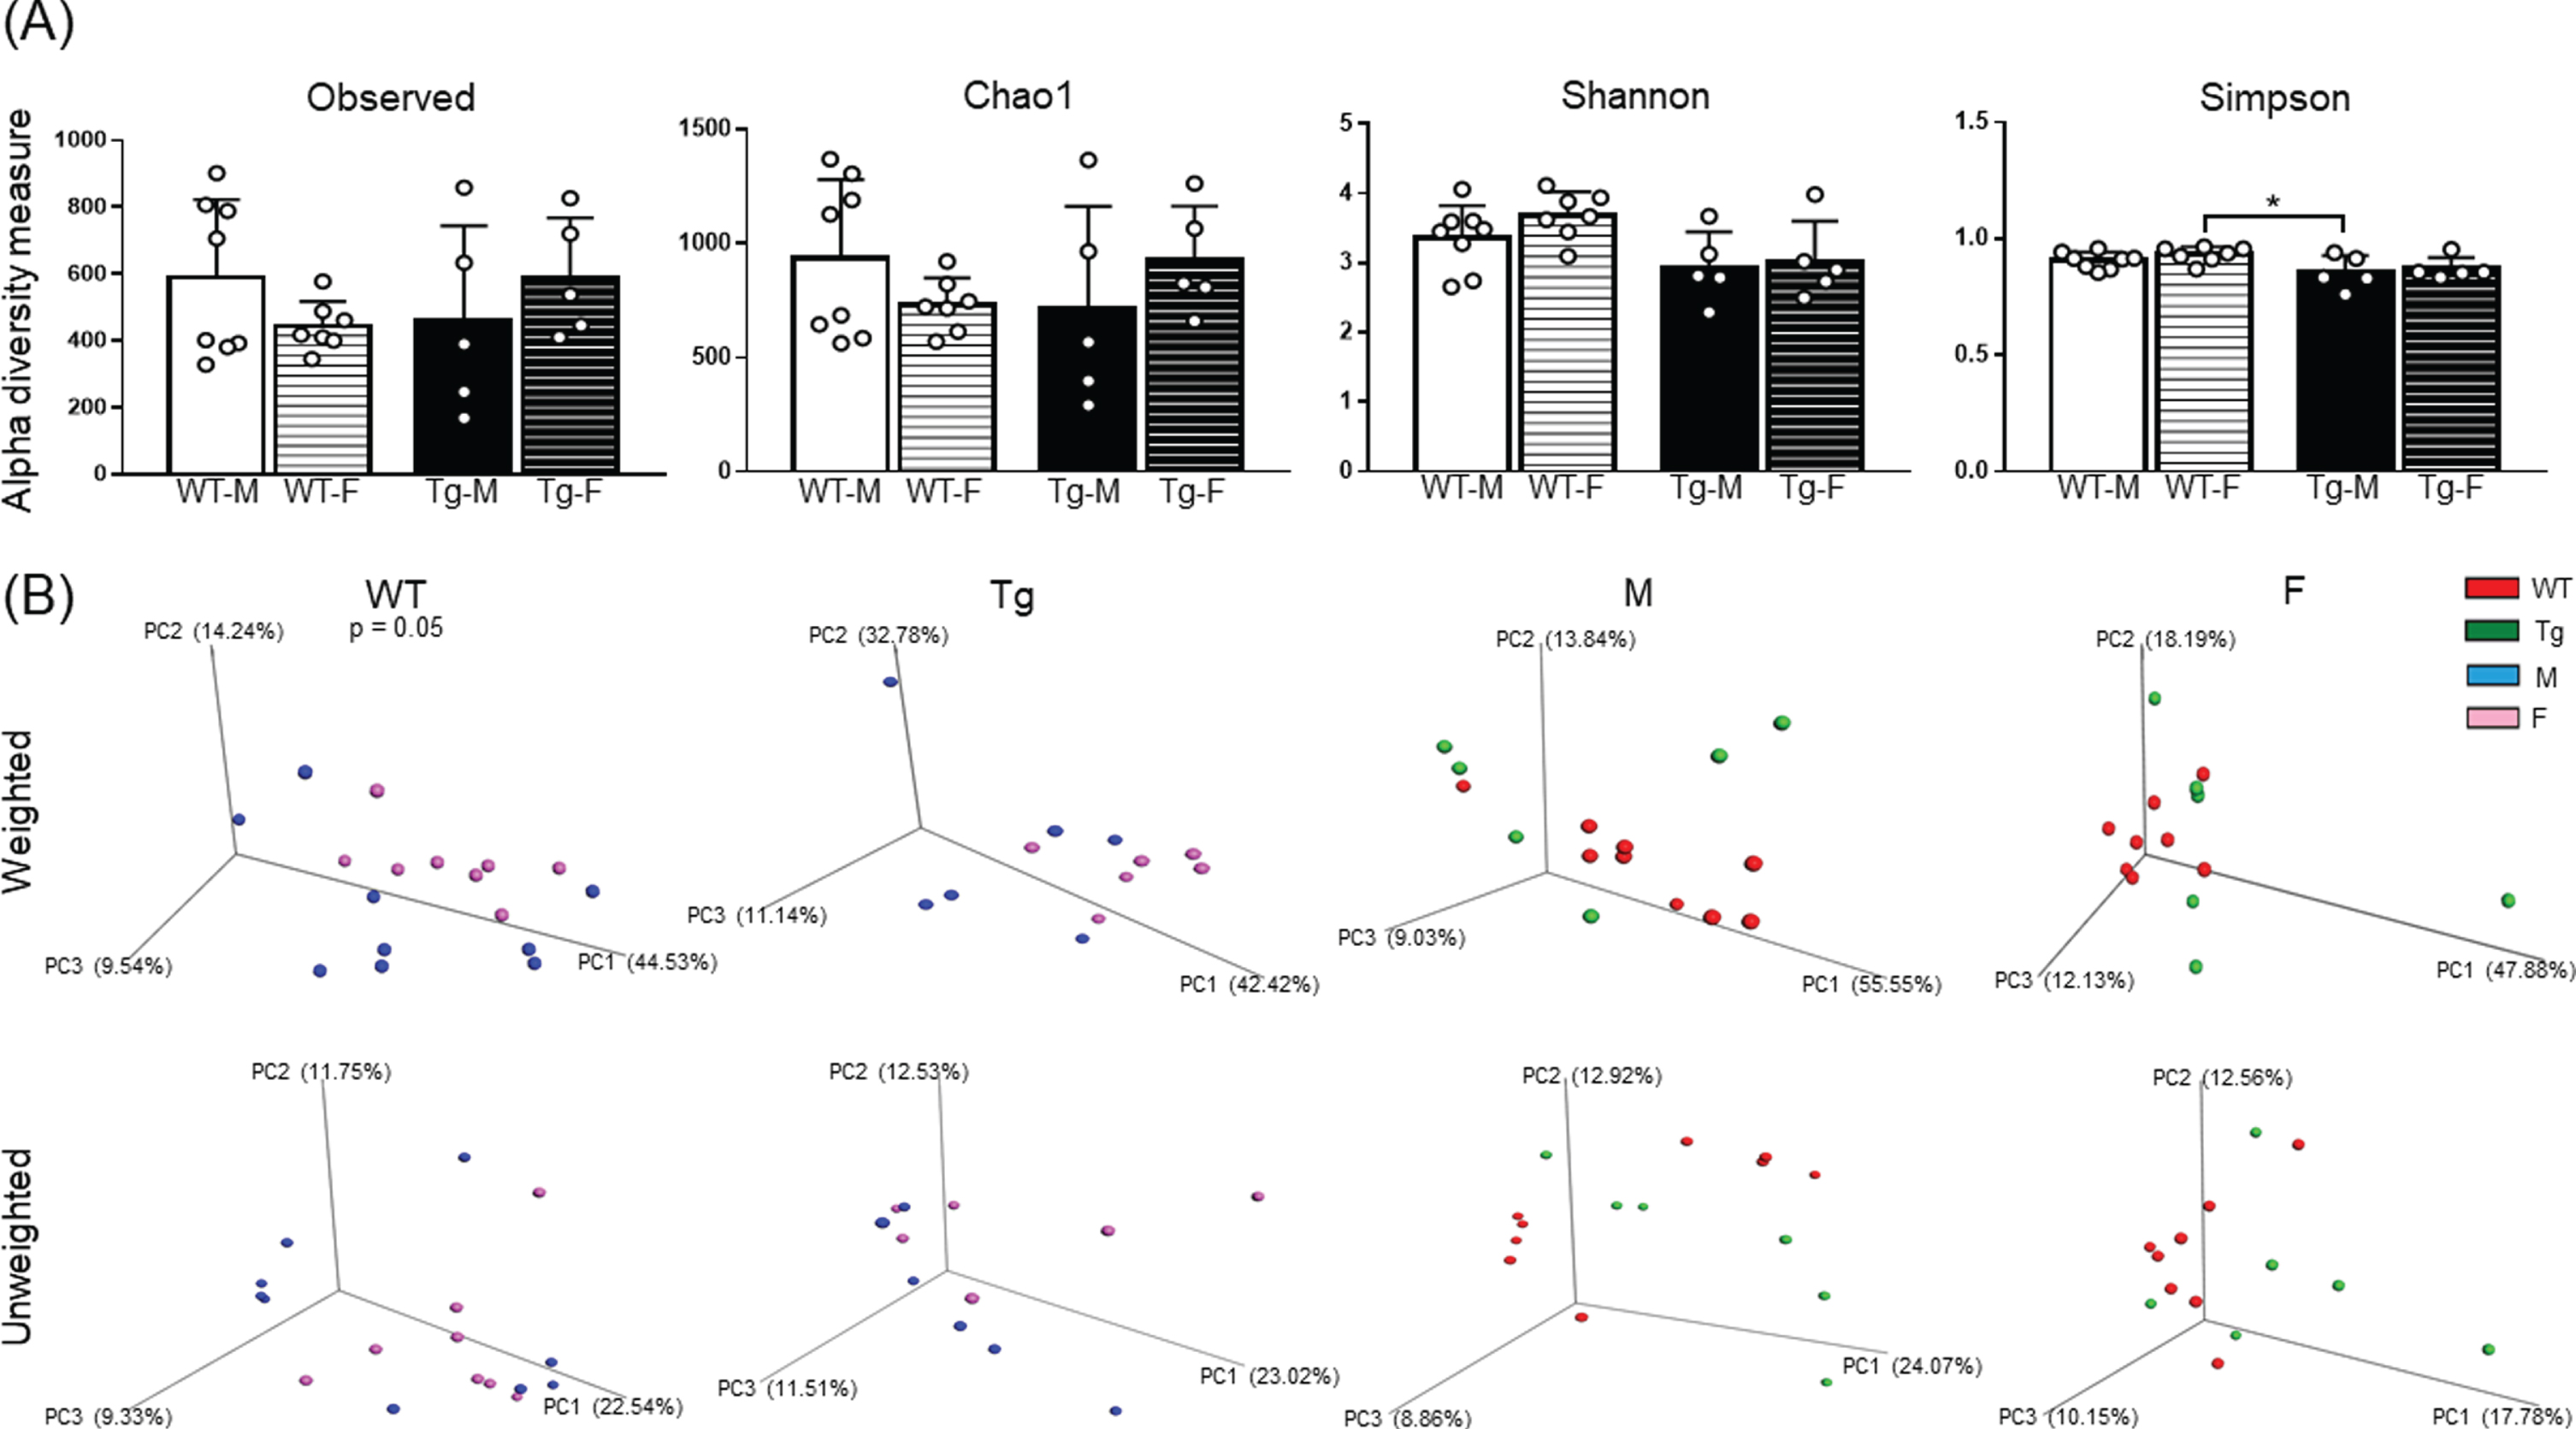
Fecal microbiota bacterial diversity. Alfa diversity analyses for experimental groups are shown in (A) by observed number of taxa, Chao1 richness [F (1, 21) = 2.74, 0.0001 and 0.01 for interaction, row and column factor respectively], Shannon index [F (1, 21) = 0.38, 1.19, and 8.02 for interaction, row and column factor respectively] and Simpson index [F (1, 21) = 0.09, 1.15 and 8.65 for interaction, row and column factor respectively]. Beta diversity analyses for experimental groups plotted as principal coordinates analysis (PCoA) in (B) of weighted and unweighted variables. WT-M n = 9, WT-F n = 8, Tg-M n = 6, and Tg-F n = 6. For A, white color circles within bars indicate experimental subjects. For B, each subject is represented by a color sphere. Data are shown as mean±SD bars. For A, data between square brackets indicate F (DFn, DFd) values of two-way ANOVA with Tukey post-hoc correction and statistical significances are shown as *p < 0.05, **p < 0.01, ***p < 0.001 and ****p < 0.0001. For B, p values for PCoA schemes with significative clustering are showed according to the following results: ADONIS: R = 0.07, p = 0.33 and ANOSIM: R = 0.02, p = 0.34 for weighted and ADONIS: R = 0.10, p = 0.05 and ANOSIM: R = 0.16, p = 0.06 for unweighted variables comparing WT mice; ADONIS: R = 0.18, p = 0.08 and ANOSIM: R = 0.11, p = 0.14 for weighted and ADONIS: R = 0.09, p = 0.47 and ANOSIM: R = –0.01, p = 0.46 for unweighted variables comparing Tg mice; ADONIS: R = 0.10, p = 0.18 and ANOSIM: R = 0.06, p = 0.24 for weighted and ADONIS: R = 0.09, p = 0.20 and ANOSIM: R = 0.11, p = 0.14 for unweighted variables comparing M mice; and ADONIS: R = 0.10, p = 0.23 and ANOSIM: R = 0.15, p = 0.07 for weighted and ADONIS: R = 0.09, p = 0.08 and ANOSIM: R = 0.26, p = 0.01 for unweighted variables comparing F mice. F, female; M, male; Tg, transgenic; WT, wild type.
Alpha diversity indexes for experimental groups
Alpha diversity indexes and statistical values for comparisons between WT-M (n = 9), WT-F (n = 8), Tg-M (n = 6), and Tg-F (n = 6) mice in Figure 5. Statistical significances (p values) were calculated by two-way ANOVA with Sidak post-hoc correction. F, female; M, male; N.A., not applicable; SD, standard deviation; Tg, transgenic mice; WT, wild type mice.

Fecal enriched bacterial taxa associated to gender and genotype. The figure shows the results of the linear discriminant analysis (LDA) effect size (LEfSe) by gender (A) and genotype (B) comparison of differentially abundant bacterial taxa (orders, families and genera) significantly associated with WT-M (n = 9), WT-F (n = 8), Tg-M (n = 6), and Tg-F (n = 6). For A and B, the color tags on the top right side indicate experimental groups. LDA score (shown at logarithmic scale underneath the bars and indicate with vertical dotted lines) cutoff of 2 was used to discriminate bacterial taxa. Specific LDA scores and statistical significances are shown in Supplementary Table 4. F, female; f, family; g, genus; M, male; o, order; Tg, transgenic; WT, wild type.
Metagenome prediction
We used Phylogenetics Investigation of Communities by Reconstruction of Unobserved States (PICRUSt v.1.1.1) in order to predict related meta-bolic profiles of the metagenomes from 16S rDNA gene data set by Kyoto Encyclopedia of Genes and Genomes (KEGG) orthologs classification database at hierarchy level 3 pathways. Statistical Analysis of Taxonomic and Function (STAMP v2.1.3) software was used to determinate significant differences in abundance of OTUs related to metabolic pathways (Fig. 6 and Supplementary Table 5) [68].
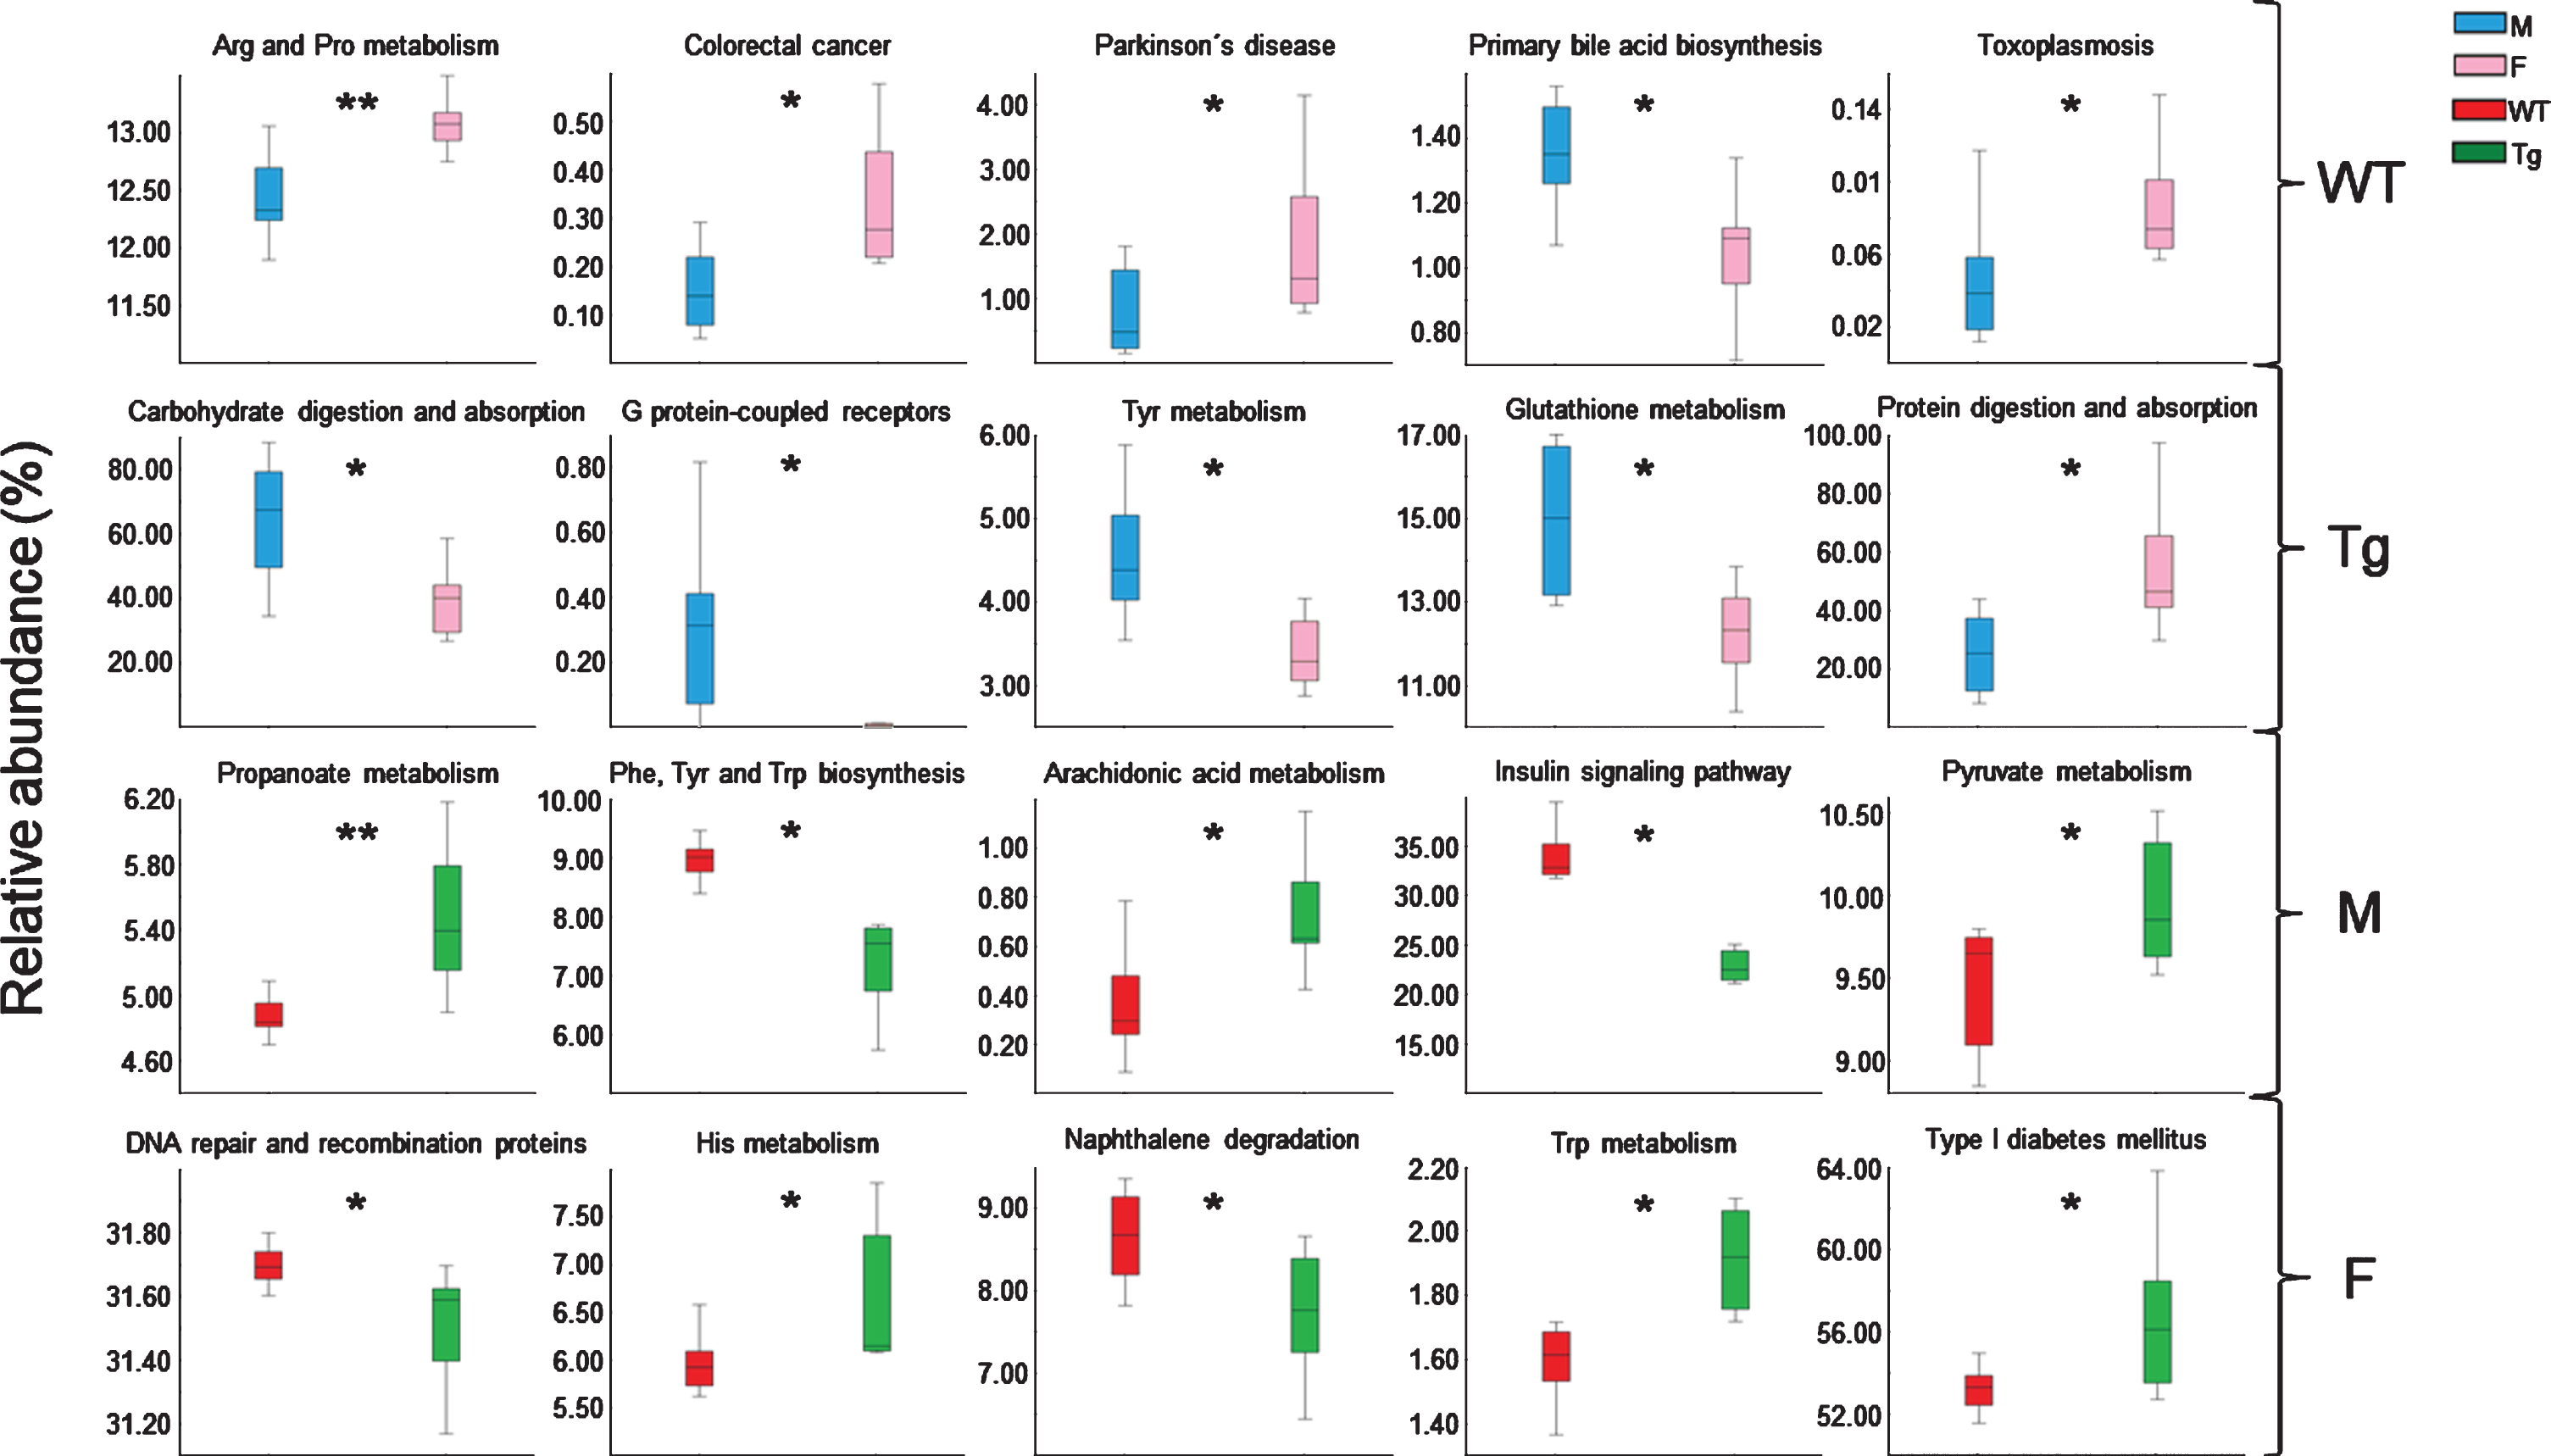
Prediction of the functional metagenome of the fecal bacterial microbiota. The figure shows graphic representations of significant predicted metabolic pathways determined by PICRUSt v1.1.1 regarding the corresponding bacterial OTU table. Y-axis shows relative abundance to corresponding pathway according to bacterial taxa composition for each experimental group (WT-M n = 9, WT-F n = 8, Tg-M n = 6, and Tg-F n = 6). Data are shown as mean±SD bars. Statistical significances calculated by t-test are shown as *p < 0.05, **p < 0.01, ***p < 0.001, and ****p < 0.0001. F, female; M, male; Tg, transgenic; WT, wild type.
Correlations between determined parameters
Associations between cognition, SCFAs concentration and proportion, bacterial taxa relative abundance, microbial diversity, and proportion of predicted metabolic pathways-related sequences were assessed by Pearson’s correlation coefficient (Graph-Pad Prism version 6) (Fig. 7).
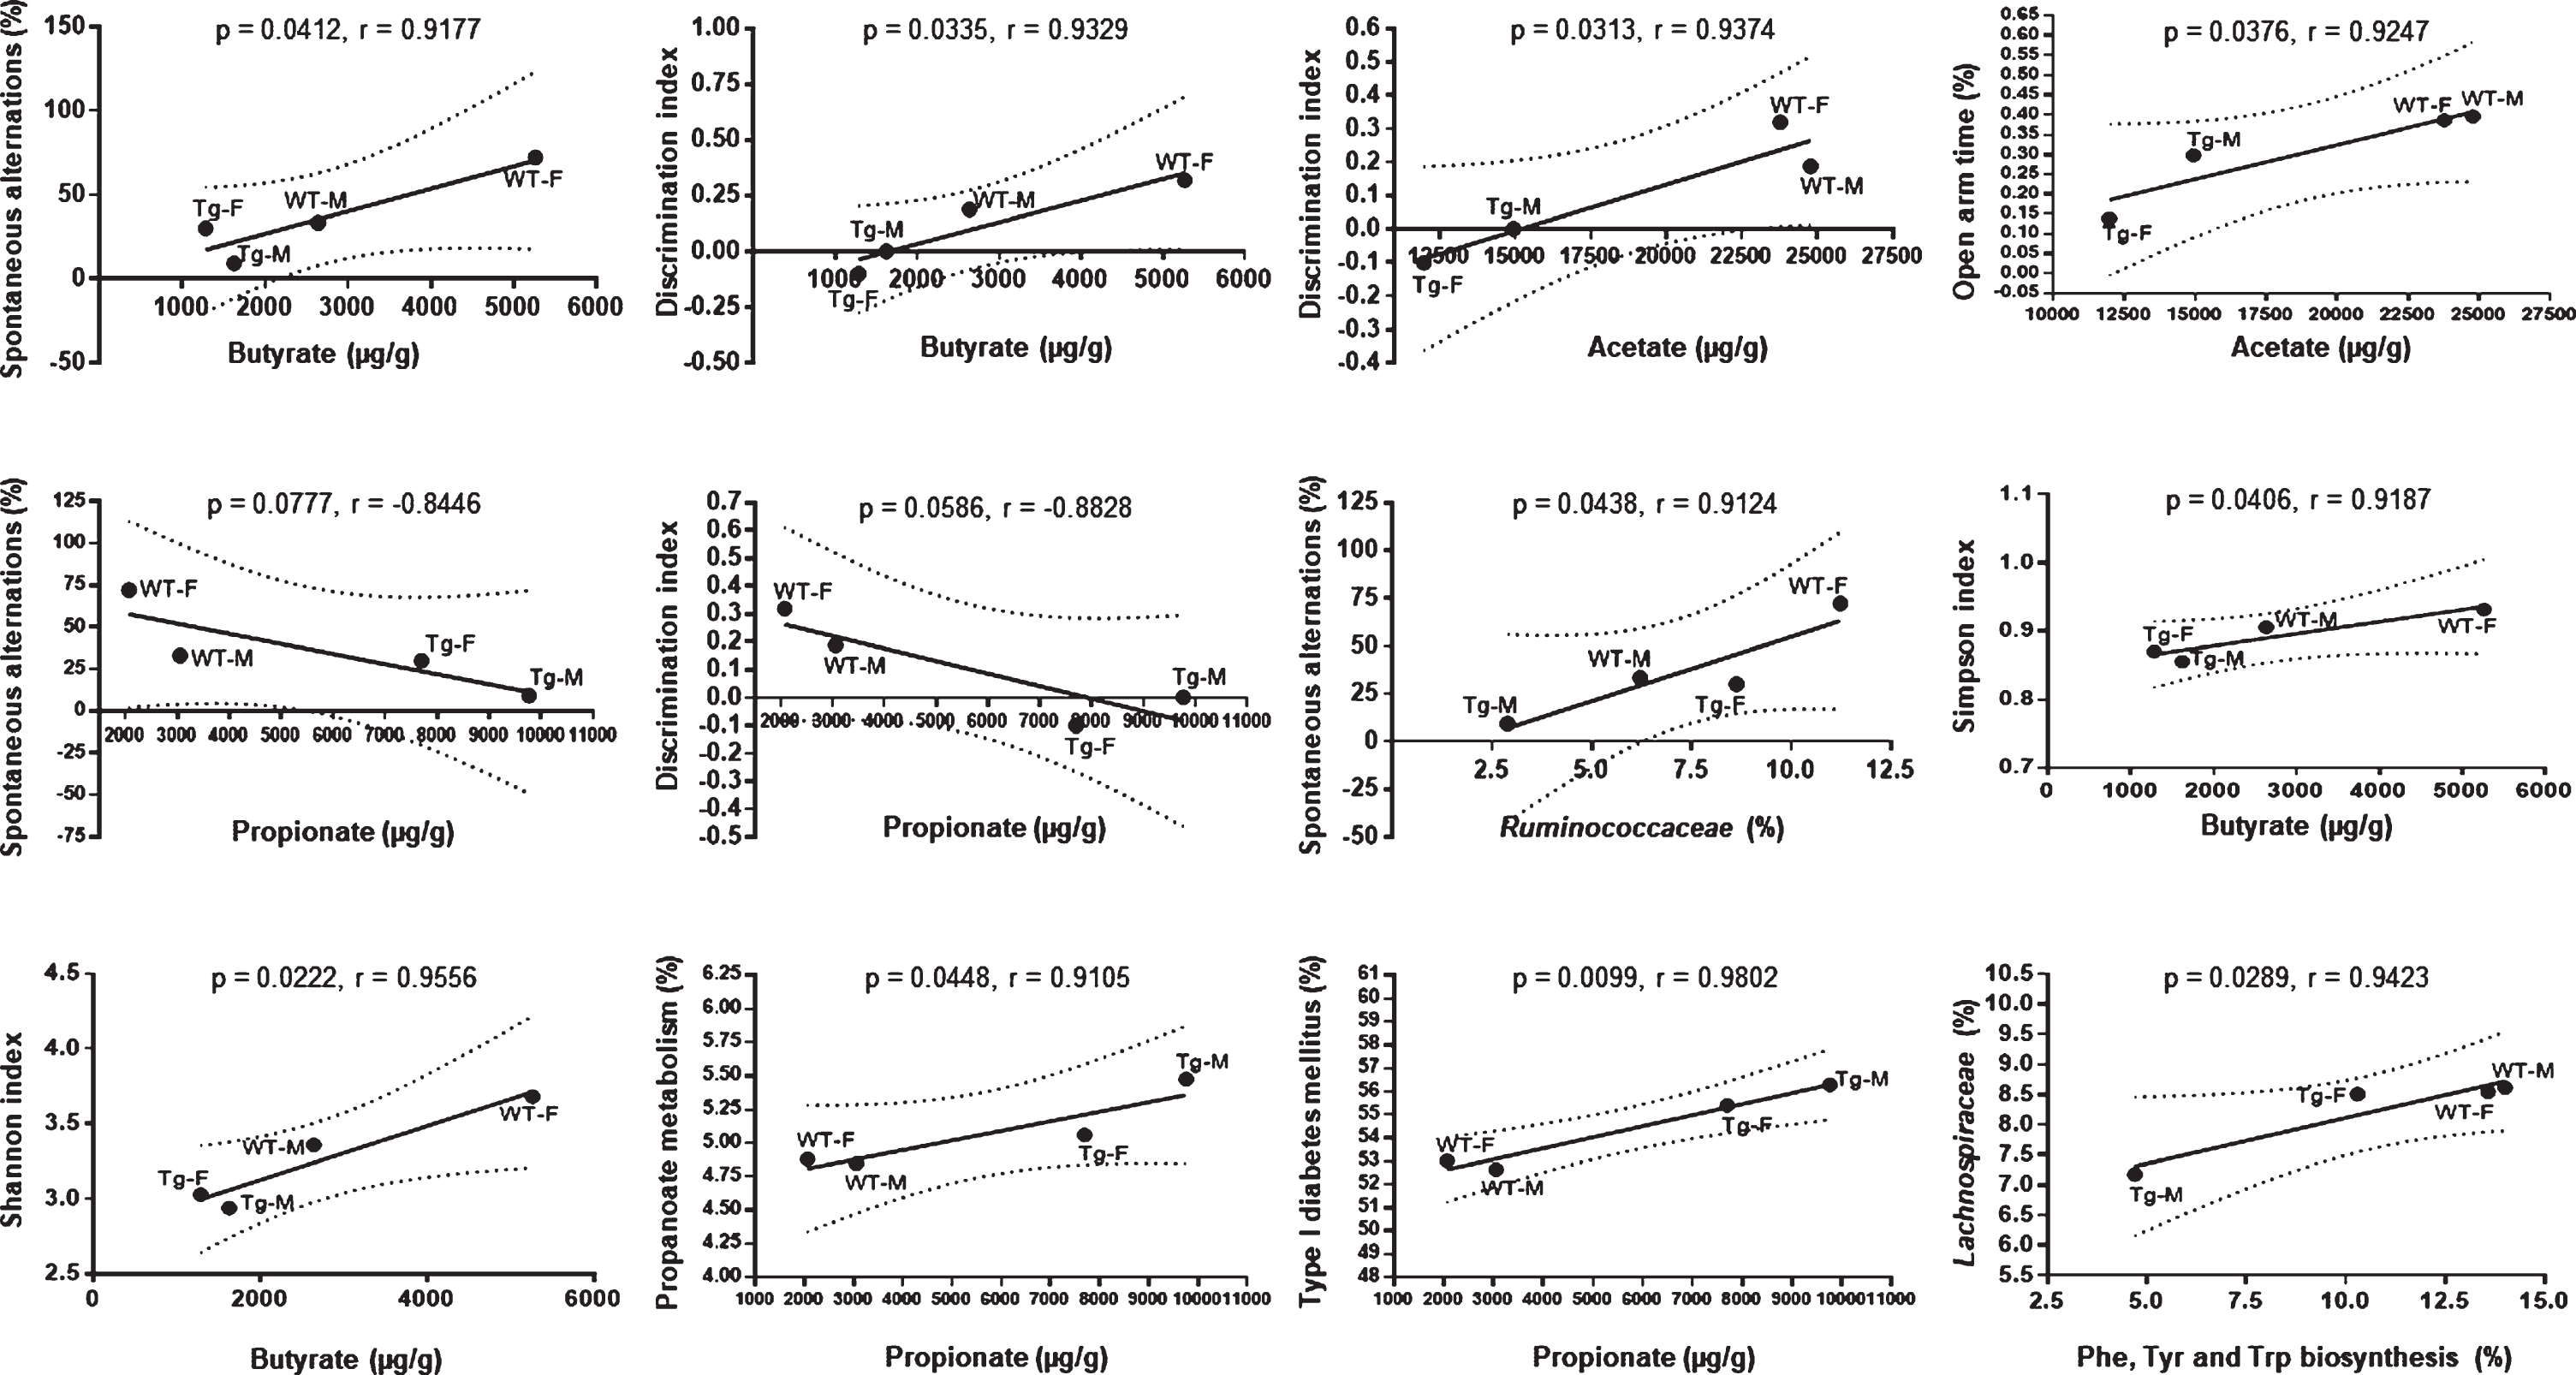
Correlations between determined parameters. Pearson’s correlation between butyrate concentration and spontaneous alternation proportion, butyrate concentration and discrimination index, acetate concentration and discrimination index, acetate concentration and open arm time proportion, propionate concentration and spontaneous alternation proportion, propionate concentration and discrimination index, Ruminococcaceae relative abundance and spontaneous alternation proportion, butyrate concentration and Simpson index, butyrate concentration and Shannon index, propionate concentration and propanoate metabolism predicted pathway, propionate concentration and type I diabetes mellitus predicted pathway, and Phe, Tyr and Trp biosynthesis predicted pathway and Lachnospiraceae relative abundance are shown. WT-M n = 9, WT-F n = 8, Tg-M n = 6, and Tg-F n = 6. Data are shown as mean. One-tailed p values (p), Pearson’s correlation coefficients (r), trend (solid line) and 95% confidence interval (dotted line) are shown for each correlation. F, female; M, male; Tg, transgenic; WT, wild type.
Statistical analysis
Data are expressed as the mean±standard deviation (SD). Open arm time, closed arms entries, spontaneous alternations, DI, WM latencies, SCFAs concentration and proportion, GM relative abundances, alpha diversity indexes, food intake, and body weight changes were analyzed by a two-way ANOVA followed by a Tukey post-hoc test. Beta diversity was analyzed by ANOSIM and ADONIS, whereas differences for taxa enrichment, abundance of sequences related to predictive metabolic pathways and correlations between determined parameters were evidenced by LefSe, t- and one-tailed tests, respectively. All results were considered statistically significant at p < 0.05.
RESULTS
Behavioral and cognitive performance
Behavioral tests in female mice were done only at metestrus-/diestrus phase of the estrous cycle. Anxiety was determined as the proportion of time spent in the open/closed arms in the EPM test. Tg-F mice spent significantly less time in the open arms compared to WT-F, whereas time spent in closed arms was higher in Tg-F compared to WT-M. This data indicates that Tg-F mice showed higher anxiety than their WT-counterpart, which was not observed in males (Fig. 1A, B). Working memory was assessed by the T-maze test. Percentage of spontaneous alternations (%) was higher in WT-F compared to WT-M, Tg-M, and Tg-F mice. WT-M also showed better working memory than Tg-M mice (Fig. 1C). Object recognition memory was determined by the NOR test. Impaired recognition memory was observed in both Tg-M and Tg-F mice, as they presented lower DIs compared to their WT-counterparts (Fig. 1D). Spatial-learning and spatial-memory were assessed by the WM test. Learning curves are shown in Fig. 1E. Average time to find the scape platform during all learning trials indicate that Tg-M mice had higher latencies compared to their WT-counterpart (Fig. 1E, F). To determine effective learning, we compared the latencies to find the scape platform in trial 1 (E1) compared to trial 12 (E12). We observed that only WT mice (both, males and females) were able to show an effective learning as E12 <E1, but Tg mice (both, males and females) did not showed significant differences between E12 and E1 (Fig. 1G). Spatial memory test was carried out after learning trials. WT-F showed better spatial memory than WT-M, Tg-M and Tg-F (Fig. 1H). Representative trajectories during learning and memory phases for M and F subjects are shown in Fig. 1I and 1J, respectively.
Short chain fatty acids concentration
SCFAs were quantified in fecal samples. The concentration of acetate was decreased in Tg mice (male: 14939.03 ± 5496.59μg/g, female: 11978.96±5480.01μg/g) compared to their WT counterparts (male: 24776.47±6380.95μg/g, female: 23768.91±3387.26μg/g). In contrast, propionate concentration increased in Tg mice (male: 9765.39±3128.70μg/g, female: 7696.35±5746.66μg/g) compared to their WT counterparts (male: 3056.42±2163.77μg/g, female: 2071.83±742.01μg/g). Butyrate concentration was higher in WT-F mice (5263.79±1455.44μg/g) compared to WT-M (2639.47±1039.08μg/g), Tg-F (1284.66±432.52μg/g), and Tg-M mice (1623.90±558.06μg/g).
Fecal microbiota analysis
To determine whether 6-month-old mice presented sex- and/or genotype-dependent GM dysbiosis, we analyzed the fecal microbiota taxa relative abundance in all experimental groups. At phylum level, we found a higher abundance of Bacteroidetes in Tg-F compared Tg-M (Figs. 2A3, and Table 1). At class level, a higher relative abundance of Bacilli was observed in Tg-M compared to Tg-F (Fig. 3, Supplementary Figure 1, and Supplementary Table 3). At order level, higher abundances of Lactobacillales and Turicibacterales were observed in Tg-M compared to Tg-F mice and compared to WT-F only for Turicibacterales (Fig. 3, Table 1, Supplementary Figure 1, and Supplementary Table 3). At family level, Clostridiaceae abundance was higher in WT-F compared to WT-M mice. Lactobacillaceae relative abundance was higher in Tg-M compared to the rest of the groups. S24-7 showed an increase in Tg-F compared to Tg-M, and Turicibacteraceae was higher in Tg-M compared to Tg-F and WT-F (Fig. 3, Table 1, Supplementary Figure 1, and Supplementary Table 3). At genus level, abundance of Klebsiella was higher in Tg-F compared to WT-F and WT-M, while Lactobacillus was higher in Tg-M compared to Tg-F. Lactococcus showed higher proportions in Tg-M compared to the other three groups, and SMB53 showed a higher abundance in WT-F compared to WT-M and Tg-F, increasing its abundance in Tg-M in comparison to WT-M mice (Figs. 2B3 and Table 1).
Alpha diversity was estimated by the Observed number of taxa, Chao1 richness and Shannon and Simpson indexes (rarefaction curves are shown in Supplementary Figure 2). A decreased bacterial diversity was observed in Tg-M compared to WT-F according to Simpson index (Fig. 4A). No significant differences were found in observed number of taxa, Chao1 richness and Shannon index (Table 2). The clustering the bacterial communities using PCoA of weighted and unweighted variables revealed a sex-dependent segregation between WT mice comparing weighted variables, without statistical clustering for the rest of comparisons (Fig. 4B).
Next, we used a linear discriminant analysis effect size (LEfSe) to determine enriched taxa per condition. Seven taxa were enriched in WT-M versus WT-F (Stenotrophomonas, Parabacteroides, Prevotella, Slackia, Acetobacter, Paraprevotella and Coprobacillus), whereas nine taxa were enriched in WT-F versus WT-M (Clostridiaceae, Ruminococcaceae , SMB53, EW055, Fusibacter, Flexispira, Peptostreptococcaceae, Kaistobacter and Mogibacteriaceae). Additionally, four taxa were enriched in Tg-M versus to Tg-F (Lactobacillus, Dietziaceae, Lactococcus and Variovorax) and four in Tg-F versus Tg-M (Koribacteraceae, Erythrobacteraceae , Koribacter and Stramenopiles) (Fig. 5A and Supplementary Table 4). Also, ten taxa were enriched for WT-M versus Tg-M (Allobaculum, Lachnospiraceae, Ruminococcus, Nitrospira, Ruminococcaceae, Coprococcus, Oscillospira, Lachnobacterium, Blautia and Christiansenellaceae), whereas nine taxa were enriched in Tg-M versus WT-M (Lactobacillus, Clostridiaceae, Adlercreutzia, SMB53, Dorea, Variovorax, Turicibacter, Clostridium and Fusibacter). Regarding females, seven taxa were enriched in WT-F versus Tg-F (Clostridiaceae, Ruminococcaceae, Ruminococcus, Fusibacter, SMB53, Peptostreptococcaceae, and Clostridium), while six enriched taxa were observed in Tg-F versus WT-F (Allobaculum, Adlercreutzia, Koribacter, Dorea, Coprobacillus and Christiansenellaceae; Fig. 5B and Supplementary Table 4).
Metagenome prediction analysis
Functional metabolic pathways related to fecal microbiota abundances was determined by PICRUSt analysis using the OTU table. The main 20 pathways showing statistically significant difference between experimental groups were mostly linked with metabolism, genetic information processing, human diseases, organismal systems, and environmental information processing (Fig. 6 and Supplementary Table 5). Among these, arginine (Arg) and proline (Pro) metabolism, colorectal cancer, Parkinson’s disease, and toxoplasmosis were increased in WT-F with respect to WT-M, while primary bile acid biosynthesis was decreased in WT-F regarding WT-M. On the other hand, carbohydrate digestion and absorption, G protein-coupled receptors, tyrosine (Tyr), and glutathione metabolism were decreased in Tg-F in comparison to Tg-M mice. Protein digestion and absorption was decreased in Tg-M compared to Tg-F. Tg-M presented increases in propanoate, arachidonic acid and pyruvate metabolic related-pathways, and decreases in insulin signaling pathway and phenylalanine (Phe), Tyr and tryptophan (Trp) biosynthesis compared to WT-M. On the other hand, Tg-F presented increases in type I diabetes mellitus and histidine (His) and Trp metabolism, and decreases in naphthalene degradation, DNA repair, and recombination proteins compared to WT-F (Fig. 6).
Correlations analysis
The determine the possible association between behavioral/cognitive performance in the experimental groups versus SCFAs concentration, taxa relative abundance, alpha diversity metrics, and predicted metabolic pathways we used the Pearson’s correlation coefficient test (Fig. 7). Butyrate concentrations correlated positively with working- and object recognition memory with the highest values in WT-F mice, and the lowest in Tg-F mice. Acetate concentration correlated positively with a better object recognition memory and with lower anxiety index, as WT mice showed the higher values and Tg-F mice the lower values. Propionate levels in fecal samples showed a negative correlation with working memory and object-recognition memory, as Tg-M mice showed the highest values. Among all detected taxa, only Ruminococcaceae and Lachnospiraceae families were positively correlated with working memory and Phe, Tyr, and Trp biosynthesis predicted pathway, respectively. Simpson and Shannon indexes were positively correlated with butyrate concentrations, with highest values found in WT-F mice. Finally, propionate concentrations in feces were positively correlated with propanoate metabolism, and Type I diabetes mellitus predicted pathways, with highest values in Tg-M mice (Fig. 7).
DISCUSSION
The higher risk for women to develop AD has been associated with a decline in sex hormones during the transition to the menopause [5, 6]. However, brain alterations can be observed even before menopause [69, 70], despite ovarian estrogen production and an active reproductive function. Therefore, it remains to be explained why women are at higher risk to develop AD than men. Here, we aimed to describe whether GM alterations can be associated with the cognitive decline in 6-month-old APP/PS1 mice (Tg) based on a sex/genotype segregation design. We observed sex-dependent differences in cognitive skills in male versus female WT mice, favoring females. However, in Tg-F mice the cognitive advantage over males was lost. GM composition showed few differences between female and male WT mice, with only a marked abundance of Clostridiaceae in WT-F compared to their opposite sex. Tg mice showed several sex-dependent GM alterations, being more pronounced in male mice. In addition, Tg mice showed decreased concentrations of butyrate and acetate compared to sex-matched WT mice. However, propionate was highly abundant in Tg mice (both sexes) compared to their sex-matched controls. Butyrate and acetate levels were directly associated with better working- and object recognition memory. Contrary, propionate was inversely associated with those types of memories.
For this work, we used APP/PS1 mice as they develop spatial, working, and recognition memory impairments starting at 3-4 months of age [71, 72]. In addition, APP/PS1 mice also presented detectable GM alterations since three months of age [73], being more pronounced after six months of age compared to WT animals [74–78]. Thus, APP/PS1 mice are an ideal AD model to evaluate dysbiosis-related to memory alterations.
The first objective of our study was to describe sex-dependent cognitive alterations in WT and Tg mice. In AD mice models, it has been shown that male and female 3xTgAD mice presented equally impaired cognition at 4 months of age and a faster rate of cognitive decline in females compared to male mice at 9 months of age, but this sex-differences were lost at 12 months of age, as both sexes performed worse than their WT counterparts [34]. We observed a better working memory in WT-F compared to WT-M mice in the T-maze test. However, this sexual dimorphism disappeared in Tg mice, as both male and females Tg mice showed similar percentage of spontaneous alternations and an impaired spatial learning compared to WT mice. APP/PS1 mice model develops neuropathological and cognitive alterations early than the previously used 3xTgAD mice. Therefore, our data supports early studies in humans and Tg models where sexual dimorphism in healthy subjects (WT) favors females, while AD pathology abates the sexual dimorphism in cognition.
The pathological hallmarks of AD also showed a sexual dimorphism that is present in young and old Tg mice as females exhibit an increased plaque burden and higher Aβ40 levels than age-matched males along aging [31–33]. Notwithstanding, female Tg mice do not show worst cognitive impairment as amyloid pathology progresses, compared to males. Previous studies addressed the concept of compensatory mechanisms against brain dysfunction during the perimenopausal period in females. Perimenopause is characterized by brain alterations such as a decline in glucose metabolism and neuronal bioenergetics [79, 80], allowing a better utilization of ketone bodies as an alternative brain fuel [70, 82]. Those compensatory mechanism are observed around 6–9 months of age in healthy mice, but as early as 3 months in Tg mice [80]. Notably, peripheral metabolic alterations are also observed in perimenopause rodents [79, 83]. GM composition has important role in host-metabolism, and dysbiosis has been associated with obesity and diabetes onset [84–86]. In this study, we did not measure brain or peripheral bioenergetics markers. However, our predicted metabolic pathway showed that Tg-F mice has an enhanced metabolic pathway linked to diabetes type-1 than WT-F, that may reflect an impaired peripheral glucose metabolism.
Recent focus has been paid to GM alterations and their possible impact in brain function. AD patients show an altered GM composition compared to healthy age-matched subjects [41–46]. However, those previous reports did not discriminate between genders. Cox et al. (2019) showed more age-related microbiome changes in female Tg mice (Tg2576) compared to female WT mice [87]. Importantly, GM alterations in Tg mice can be already detected since the first and third month of age compared to their WT littermates, preceding brain amyloid-β aggregation [73]. The impact of GM on the neuropathological hallmarks of AD was demonstrated in germ-free Tg mice and antibiotic-treated Tg mice, as under both experimental conditions Tg mice showed a reduction in brain amyloid-β aggregation in male mice [75, 76]. However, similar antibiotic treatment did not affect amyloid-β aggregation in female Tg mice [47]. This females’ antibiotic resistant effect abating amyloid aggregation may have important implications in the etiology of AD. Our data showed a lower GM diversity trend in Shannon and Simpson indexes for Tg-F compared to WT-F group. Similarly, AD patients show lower microbial diversity compared to healthy controls [45]. We did not observe significant differences at phylum level between WT and Tg mice. However, at a more specific level of taxa, several differences were detected between Tg-F and Tg-M mice, while a more homogeneous ecology was observed between WT-M and WT-F mice. In the one side, WT-F show an increased abundance of Clostridiaceace compared to WT-M. On the other side, Tg-M mice presented an increased abundance of Bacilli (class), Lactobacillales, Turicibacterales (orders), Lactobacillaceae , Turicibacteraceae (families), Lactobacillus, and Lactococcus (genera) compared to Tg-F mice. Meanwhile, Tg-F showed an enhanced abundance of Bacteroidetes (phylum), S24-7 (family), and Klebsiella (genus) compared to Tg-M mice. Turibacteraceae is a bacteria linked to inflammatory conditions [88], and Lactococcus, an acid lactic producing bacteria [89], has been associated with cognitive dysfunction and neurological impairment [90]. Sex-dependent expression of neuroinflammation markers have been reported in humans [91] and mice [92] with aging, with a more exacerbated response in females. It remains to be explored whether GM dysbiosis in Tg-F mice may initiate a stronger inflammatory reaction compared to their males counterparts at six months of age.
When comparing GM composition between WT-F and Tg-F, we observed an increased abundance of Ruminococcaceae and Clostridiaceae WT-F mice. Ruminococcaceae and Clostridiales have been associated with higher circulating estrogens levels in postmenopausal women [93]. Correlation analysis raveled a positive association between Ruminococcaceae and working memory, with highest values in WT-F. WT-F mice also presented an enrichment of Clostridiaceae and Clostridium compared to Tg-F mice. The presence of those gut bacteria may have important consequences in estrogen bioavailability. Regretfully, we did not measure serum estrogen levels in these animals.
The effect size analysis (LEfSe) by sex and genotype showed substantial differences between groups. Allobaculum, Adlercreuzia, Koribacter, and Dorea were enriched in Tg-F mice compared to WT-F. Increased abundances of Allobaculum is considered a risk factor of female hepatocellular carcinoma [94]. In addition, mucin degradation and gut-barrier dysfunction have been associated with higher Dorea abundance [95] in alcohol-dependent subjects [96], and certain species of Dorea promote IFNγ production and chronic inflammation in multiple-sclerosis patients [97]. Tg-M showed significant enrichment of Lactobacillus, Clostridiaceae, Adlercreutzia, SMB53, Dorea, Variovorax, Turicibacter, Clostridium, and Fusibacter, compared to WT-M. Clostridium butyricum has showed neuroprotective effects [98, 99]. Contrastingly, Clostridium type-structures have been detected by immunohistochemistry in AD brain tissue [100]. Thus, our data showed that Tg-M suffer a more severe GM dysbiosis compared to Tg-F mice.
One relevant data collected in this study was the genotype-dependent alterations in bacterial fermented products such as SCFAs. We observed an enhanced propionate, but a reduced butyrate concentration in Tg mice (male and female) compared to their WT-counterparts. Increased propionate and acetate levels have been found in saliva of AD patients [101, 102], indicating that microbiota dysbiosis in AD is not restricted to the gut. We previously reported a prominent abundance of Prevotella copri, a propionate producing bacteria, in fecal samples of another Tg mice model (3xTgAD), that was associated with an enhanced propionate concentration in Tg brain tissue compared to the control mice [56]. Here, we also observed a significant increase in propionate producing bacteria in Tg-M mice, such as Lactobacillus (propionate producing species: L. buchneri, L. diolivorans, L. acidophilus, L. helviticus, L. rhamnosus, and L. gasseri) [103–105]. Previous studies also reported a Lactobacillus enrichment in fecal samples of male Tg mice [106, 107] and AD patients [108]. Lactobacilli are often considered to be commensal or beneficial participants to the host microbial ecology; however, they have been identified as potential pathogens in elderly and immunocompromised patients [109, 110]. In addition, patients with myalgic encephalomyelitis/chronic fatigue syndrome present a direct correlation between Lactobacillus distribution and symptom, neurocognitive, and neurosensory factors associated with neurological impairment [111]. Thus, caution may be taken for future probiotic design and supplementation protocols for AD patients. In addition, Tg mice (both, males and females) also presented a significant reduction in butyrate-producing bacteria (e.g., Lachnospiraceae, Ruminococcaceae, Peptostreptococcaceae, and Oscillospira) and acetate-producing bacteria (Blautia, Christiansenellaceaea, and Ruminococcus [43, 112–117]. Previous investigations have reported a general reduction in SCFAs concentration in brain and fecal samples of APP/PS1 mice [77]. However, significant biological differences among the principal bacterial fermented products have been described. Intracerebroventricular infusion of propionate in rats results in neuroinflammation [118, 119], progressive development of limbic kindled seizures, oxidative stress (e.g., lipid peroxidation), microglial activation-associated with decreased glutathione activity [120], and impairments in social behavior and working memory [121]. In the present study, WT-F mice presented an increase in butyrate-producing taxa (i.e., Clostridiaceae) compared to Tg-F, and highest butyrate concentration compared to the other groups. Correlation analysis further indicates that butyrate concentration correlates positively with working- and object-recognition memory, while propionate concentrations had a negative correlation with those memory capabilities. Sodium butyrate treatment protect against cerebral Ischemia [99], improving associative memory in APP/PS1 mice even at an advance stage of the disease [122]. Moreover, butyrate suppresses microglia activation [123] and decreases astrocyte activation [124] in cell cultures. Therefore, our results may indicate that Tg mice lack several butyrate-producing bacteria, with important neuroprotective effects, but they carry specific gut bacteria capable of releasing neurotoxic substances (i.e., propionate).
Predicted metabolic pathways of the fecal bacterial microbiota by functional metagenome indicate that GM modulation by genotype and gender is related to different bacterial products that interact with the host-physiology. We observed an enhanced propanoate metabolism pathway in Tg-M that could also be associated with Lactobacillus abundance and fecal propionate levels in this group. Protein digestion and absorption were increased in Tg-F compared to Tg-M mice. A recent study showed a reduced protein digestion and absorption pathway in APPPS1-21 mice treated with antibiotics (both, female and male animals) [47]. Our study, based in a sex-discrimination analysis, showed that this metabolic pathway was reduced in Tg-M compared to Tg-F mice. The PICRUSt analysis also revealed a reduced Phe, Tyr, and Trp pathway in Tg-M mice compared to their WT counterparts. Low concentrations of Phe, Tyr, and Trp have been found in AD patients compared to control individuals [125], and lower Trp and kynurenic acid plasma concentrations were correlated with dementia severity in AD patients [126]. Thus, the collected data may indicate that several metabolic and cellular alterations observed in AD patients and Tg mice can be associated with GM dysbiosis.
In conclusion, this study shows a direct association among GM, cognitive decline, and sexual dimorphism in an AD mice model (Fig. 8). Sex differences in GM composition were observed mainly in Tg mice, which implies that sex itself exerted specific influences on the composition of the microbiota in AD pathology. The changes in composition of the GM between male and female Tg mice, and its physiological implications may be related with the dimorphism observed in the incidence of AD, affecting more women than men. Further studies are needed to understand the impact of female Tg dysbiosis in AD pathology, and to explore whether specific taxa may confer protection against brain dysfunction.
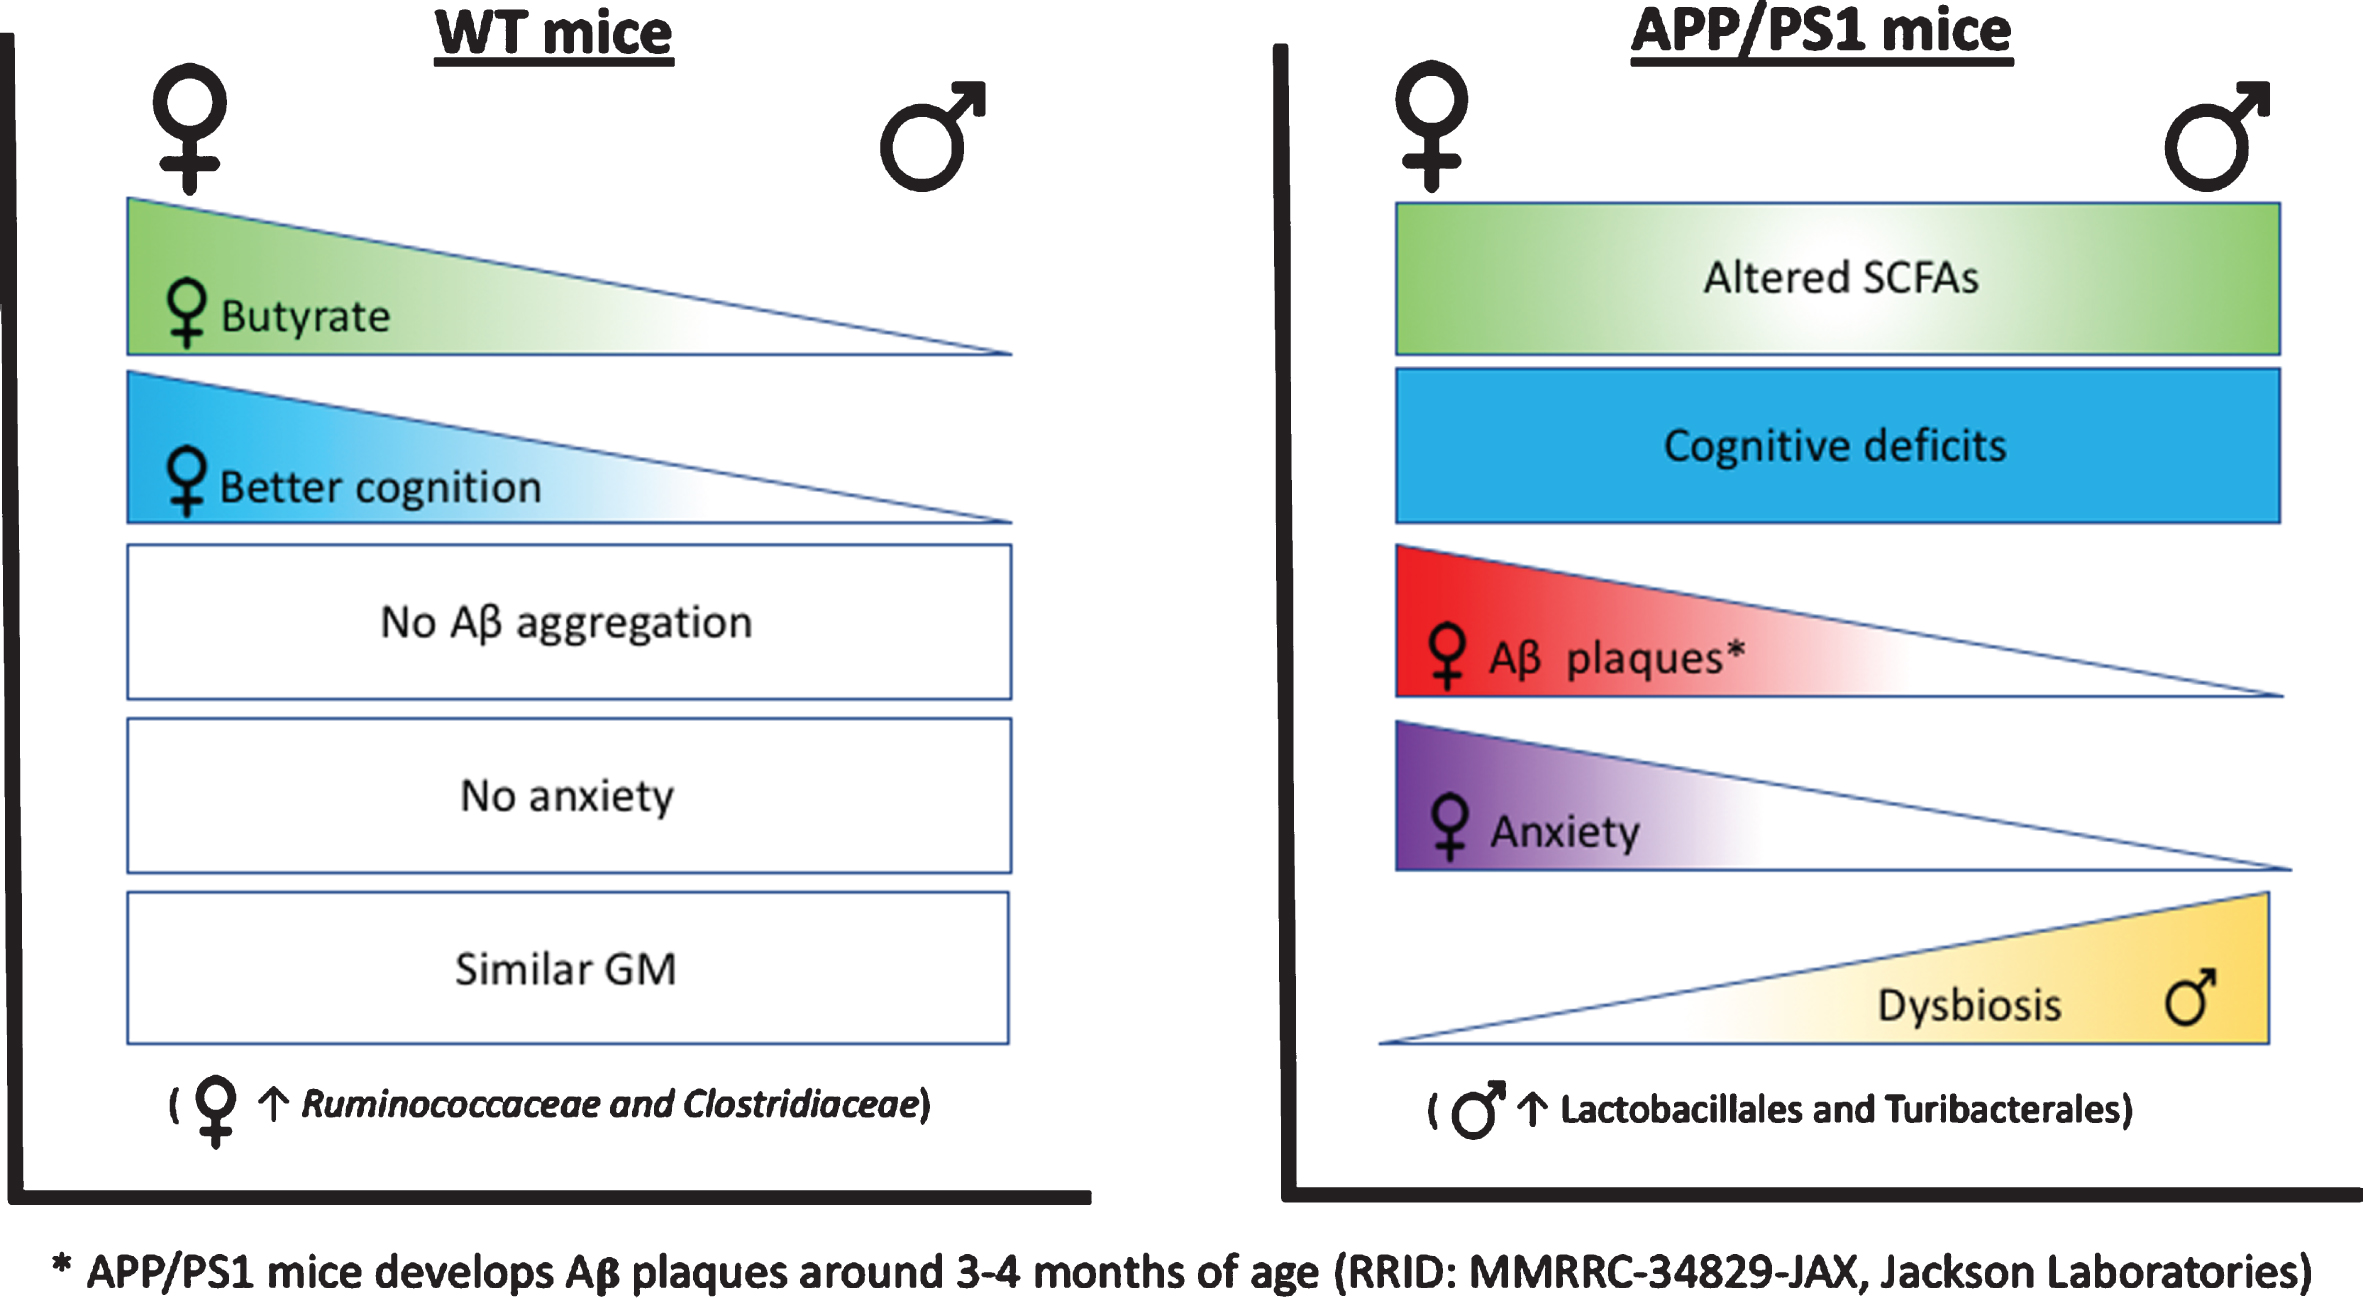
Graphical abstract: WT-F mice showed higher butyrate concentration in fecal samples, which was associated with better cognitive performance compared WT-M and Tg-F mice. WT mice (without Aβ aggregates) did not showed anxiety. WT-F and WT-M mice present similar GM composition Notably, WT-F mice presented an enrichment of Ruminococcaceae and Clostridiales compared to Tg-F mice. APP/PS1 (Tg) mice (that develop Aβ plaques), showed altered short-chain-fatty acids (SCFAs) concentration (lower acetate/butyrate, but higher propionate) compared to their WT counterparts, cognitive deficits, and enhanced anxiety compared to WT mice. GM dysbiosis was stronger in Tg-M than Tg-F. Tg-M showed enrichment of Lactobacillaceae and Turicibacteraceae compared to WT-M and Tg-F mice.
Footnotes
ACKNOWLEDGMENTS
This research was funded by SEP-CINVESTAV, and CONACyT grant numbers 163235 INFR-2011-01, A1-S-42600, and AS1600.
We thank Vicente Sánchez-Valle, Abraham Rosas-Arellano, Ricardo Gaxiola, Patricia Gonzáles, Alb-erto Piña-Escobedo, Fernando Hernández-Quiroz, Loan Edel Villalobos-Flores, Julieta Hernadez-Acosta and Jessica Cabrera for technical support. We are thankful to CONACyT Mexico for the financial support to Daniel Cuervo-Zanatta (scholarship no. 288396). JG-M (19815) and CP-C (47399) are Fellows from the Sistema Nacional de Investigadores, Mexico.