
Abstract
The detection of plasma tau and its phosphorylation is technically challenging due to the relatively low sensitivity. However, in Alzheimer’s disease and other tauopathies, it is hypothesized that tau in the biofluid may serve as a biomarker. In recent years, several ultrasensitive assays have been developed, which can successfully detect tau and its phosphorylation in various biofluids, and collectively demonstrated the prognostic and diagnostic value of plasma tau/phosphorylated tau. Here we have summarized the principle of four ultrasensitive assays newly developed suitable for plasma tau detection, namely single-molecule array, immunomagnetic reduction assay, enhanced immunoassay using multi-arrayed fiber optics, and meso scale discovery assay, with their advantages and applications. We have also compared these assays with traditional enzyme-linked-immunosorbent serologic assay, hoping to facilitate future tau-based biomarker discovery for Alzheimer’s disease and other neurodegenerative diseases.
Keywords
INTRODUCTION
A biomarker is a measurable and quantifiable bio-logical parameter that serves as an indicator of a particular physiological state. A biomarker can indicate the severity or existence of a disease and the effectiveness of interventions. The detection of biomarkers plays a vital role in diagnosing tumors, neurological diseases, heart diseases, inflammatory diseases, and infectious diseases. In particular, neurological disorders suffer from a lack of biomarkers, resulting in limited drug discovery progress. Despite the tremendous efforts of scientific researchers and pharmaceutical companies, no therapeutic drugs have been found that can effectively cure neurological diseases such as Alzheimer’s disease (AD) and Par-kinson’s disease (PD) [1]. Therefore, it is of critical importance to identify prognostic and diagnostic biomarkers for neurological diseases.
Tau protein is one of the two proteins highlighted in AD pathogenesis, since its aggregation results in neurofibrillary tangle formation, a pathological hallmark of AD [1, 2]. Although discovered to stabilize microtubules [3], tau has been found to participates in axonal transport [4], synaptic function [5], and iron transportation [6–8], and its dysfunction may be involved in PD [6, 9], stroke [8, 10], traumatic brain injury (TBI) [11], heart diseases [12], and cancer [13], in addition to AD [2]. The expression of tau is mainly in the central nervous system, but it also expresses in the blood and other periphery organs [12, 14–16]. Therefore, plasma tau has been considered as a potential biomarker for AD and other tauopathies.
Traditionally, enzyme-linked immunosorbent as-say (ELISA) is the primary assay for protein detection, and it can successfully detect tau protein in cerebrospinal fluid (CSF) and the brain [17, 18]. However, the sensitivity of ELISA is insufficient to detect low protein abundance samples, such as plasma tau. Since the 2010 s, single-molecule detection has been extensively explored to develop clinical bio-markers that could not be previously detected [19] and to allow investigations for the biological function of these biomarkers. Several ultrasensitive assays have been developed and applied. This review intends to introduce the principles of four ultrasensitive assays for plasma tau detection and compares their applications.
THE PRINCIPLES OF FOUR NEW ASSAYS
Single-molecule array (Simoa)
Simoa was invented in 2010 [20] and developed by Quanterix, with 1000-fold greater sensitivity over conventional ELISA, even with a similar principle of detection (Fig. 1). It starts with coupling magnetic beads with a capture antibody (Fig. 1a). The beads have more than 250,000 binding sites for antibodies, enabling the customized design for specific pro-tein targeting. The sample will then mix with the antibody-beads complex, labeled by a biotin tag str-eptavidin-β-galactosidase (SBG). SBG can hydrol-yze resorufin β-D-galactopyranoside (RBG) to resorufin, enabling the fluorescence (Fig. 1b). The beads will then be loaded onto a Simoa disc, and each well of the array of Simoa disc is designed to hold a single bead (Fig. 1c). Simoa disc is designed to contain 24 arrays, with more than 200000 wells for an array. Therefore, the capacity is sufficient for the detection of low abundance proteins in biofluids. The well will then be sealed by oil (Fig. 1d), while removing the redundant beads, a step to ensure one bead per well for accurate measurement. At last, the digital camera will take pictures (Fig. 1e) and poisson distribution theory is used to guide the protein concentration calculation [20].
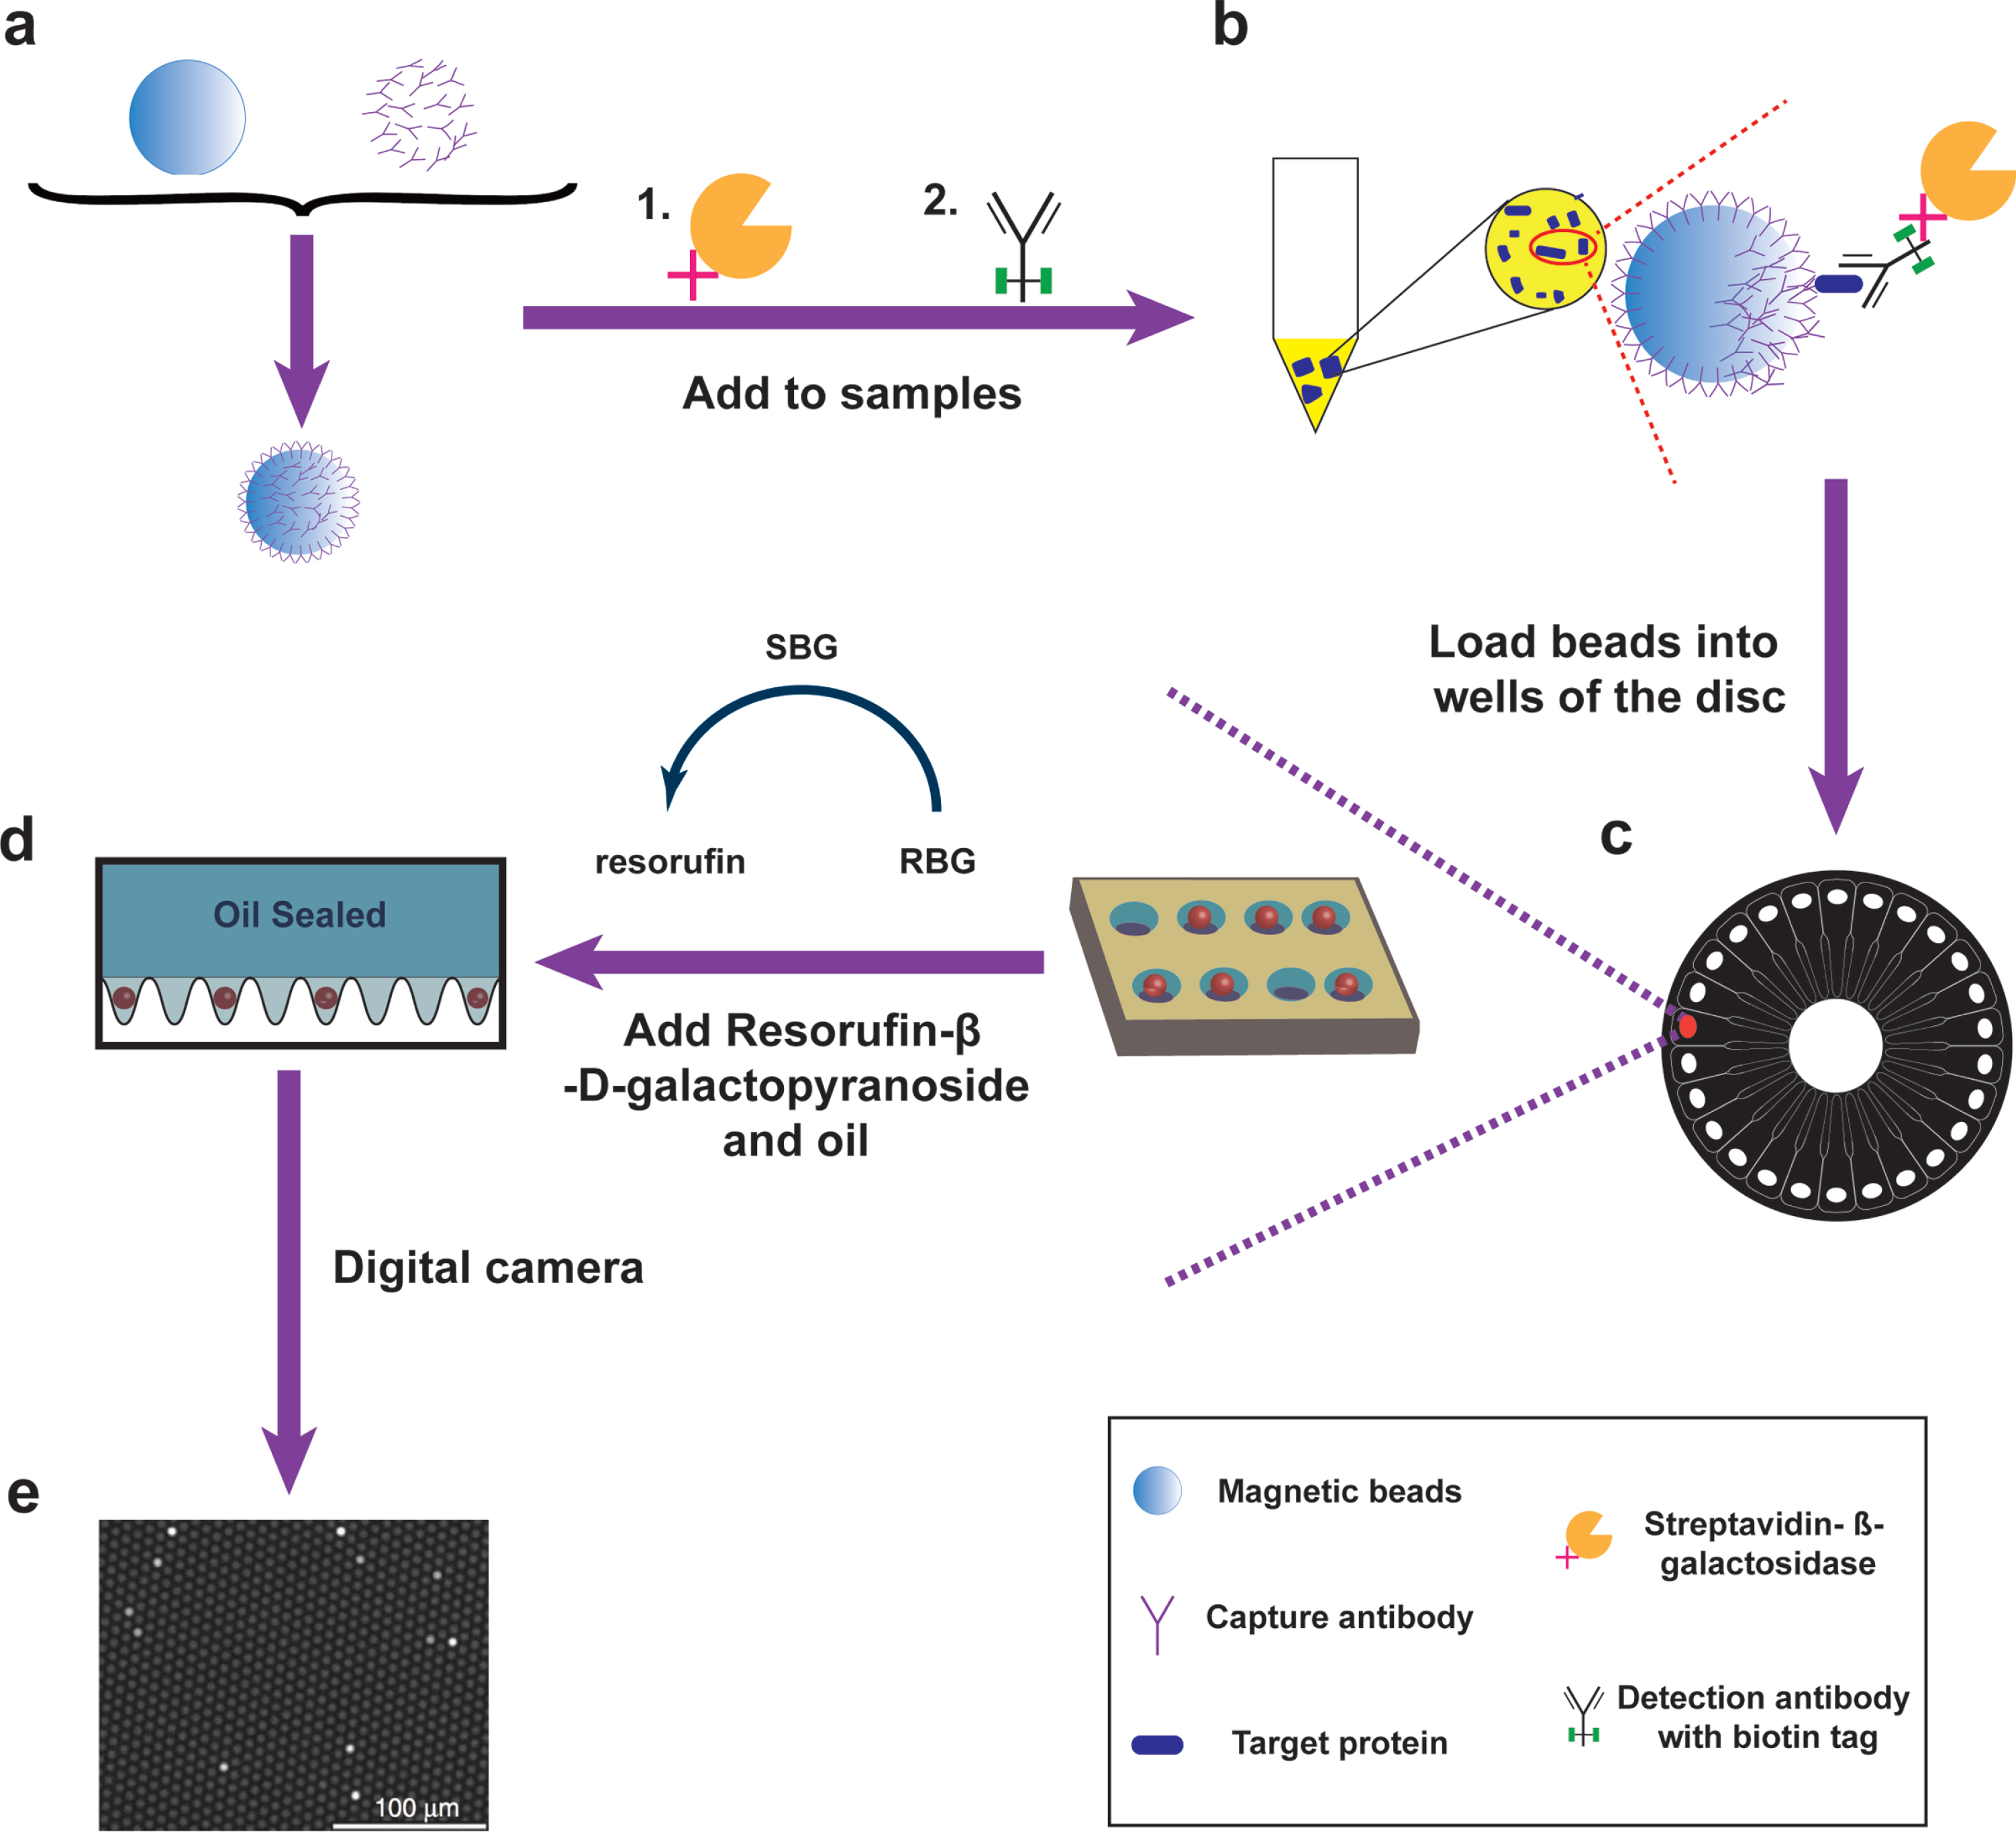
The principle of Simoa assay. a, b) Single protein molecules are captured by beads with antibody (a) and labeled by streptavidin-β-galactosidase (SBG) (b). c, d) The complex is then loaded into an array disc (c), and oil removes the redundant beads (d). e) The fluorescence signal is generated when SBG hydrolyzes Resorufin-β-D-galactopyranoside (RBG).
ImmunoMagnetic Reduction (IMR)
IMR assay was invented in 2006 [21] and developed by MagQu Co. Ltd in Taiwan (Fig. 2). The detection starts with coupling magnetic nanoparticles with hydrophilic surfactants and antibodies, and the sample will mix with the solution contains magnetic nanoparticles (Fig. 2a). These magnetic nanoparticles are suitable for tagging or labeling purposes as nanoparticles exist at the same size level as proteins [22]. The target protein will combined with magnetic nanoparticles (Fig. 2b). The final concentration is calculated by mixed-frequency alternating current magnetic susceptibility (Xac). After the external multiple alternating current magnetic fields applied, for the magnetic nanoparticles that do not bind to the antigen, they will oscillate and increase Xac; For the magnetic nanoparticles that bind to the antigen, they will be associated with each other, and magnetic nanoparticles become larger with reduced Xac (Fig. 2c). The magnetic sensor can detect the reduction of Xac to calculate the concentration of protein binding with the antibody in the magnetic nanoparticle (Fig. 2d).
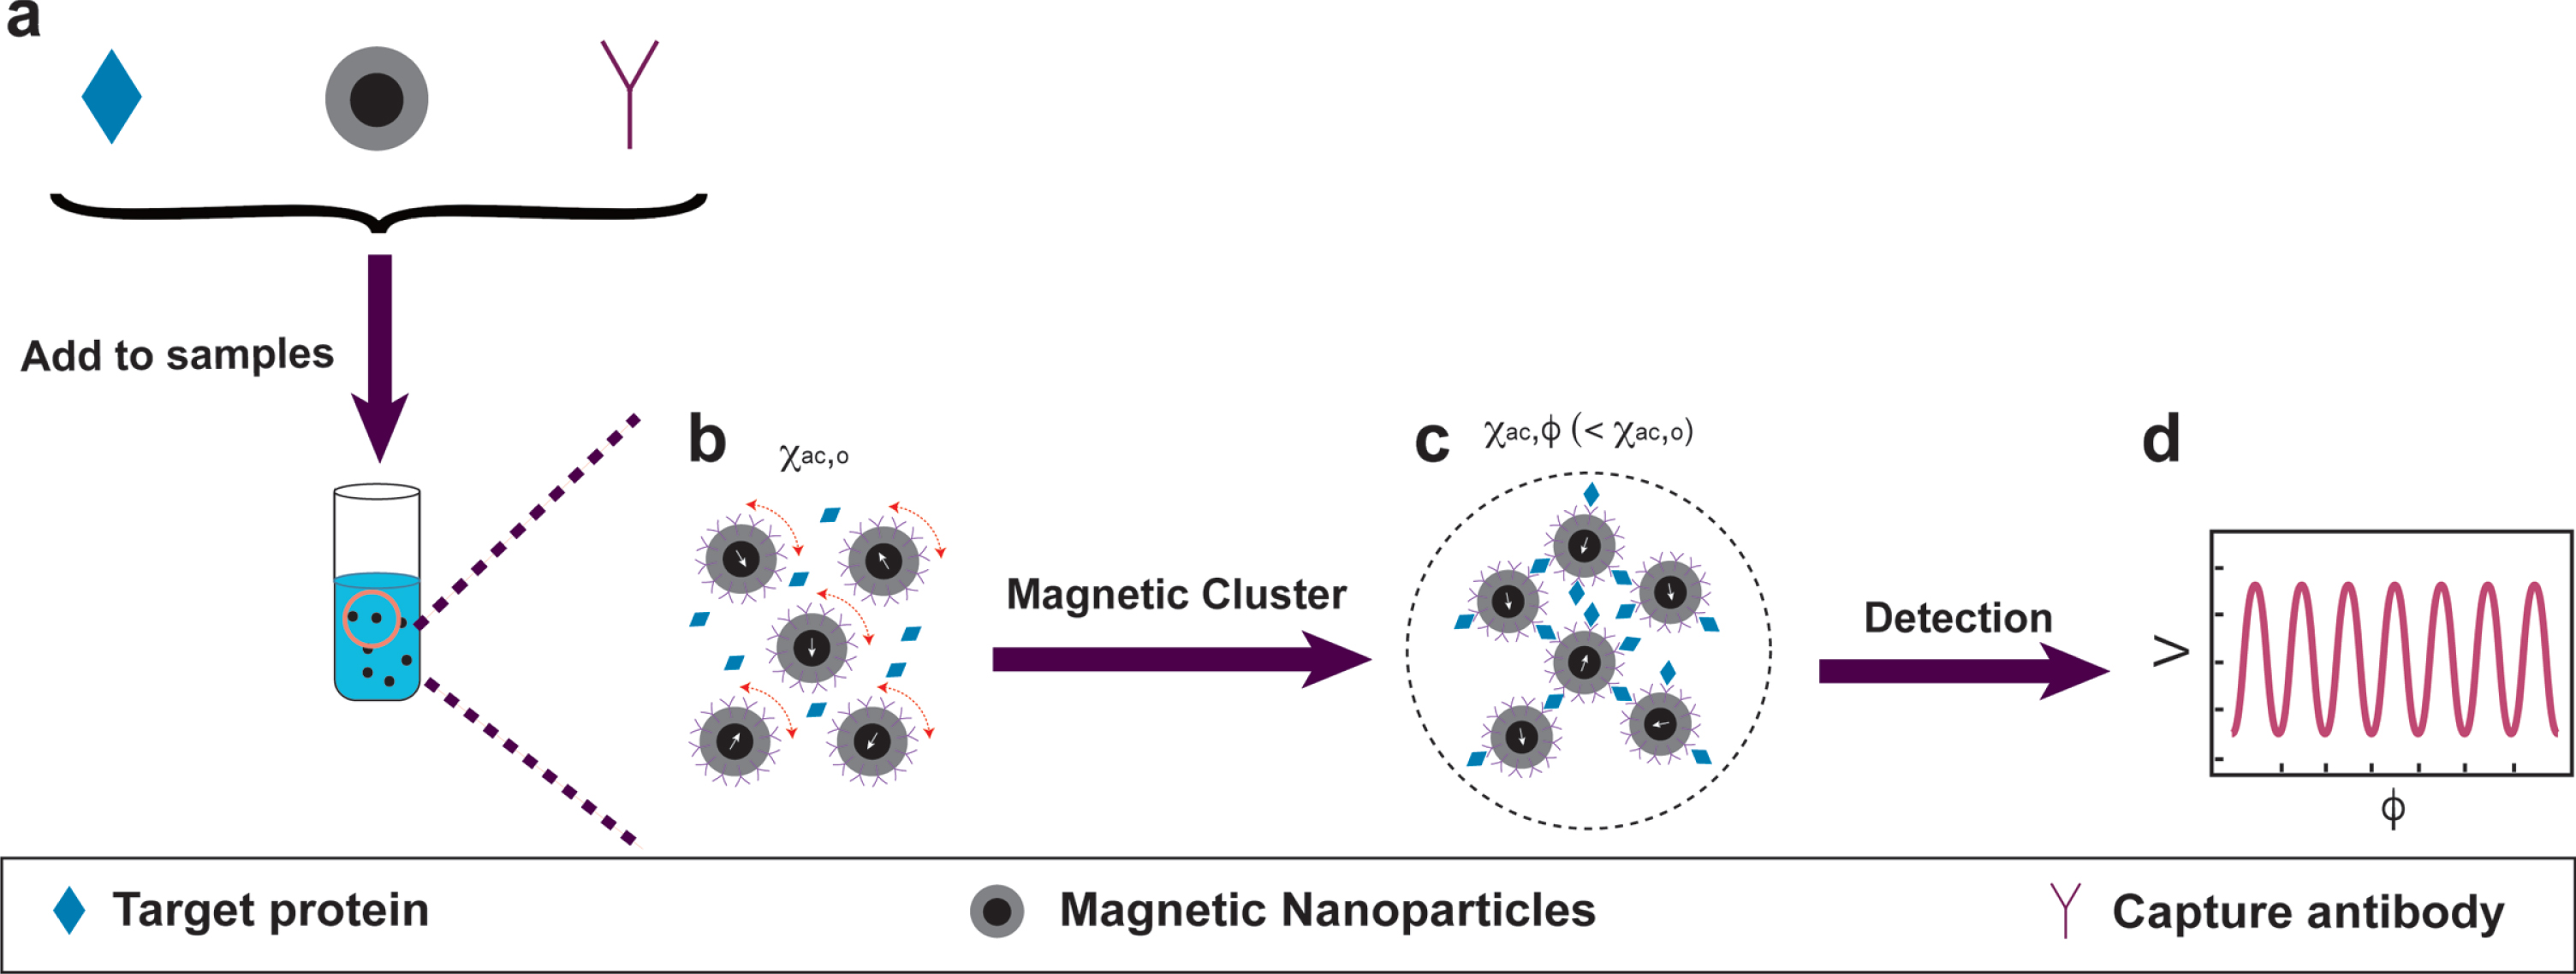
The principle of IMR assay. a) Single protein molecules are captured by magnetic nanoparticles with antibody. b) The magnetic nanoparticles oscillate and combine under external multiple alternating current magnetic fields. c, d) The change of Xac will be captured by the magnetic sensor (c), and the signal will be used to calculate protein concentrations (d).
EIMAF and a-EIMAF
Enhanced immunoassay using multi-arrayed fiber optics (EIMAF) [23], also named as surround optical-fiber immunoassay (SOFIA) [24], is a technique for biochemical assay involving fluorescent antibodies and an optical fiber surrounding the sample for detection (Fig. 3). Based on EIMAF, a-EIMAF is combined with rolling circle amplification (RCA) to increase sensitivity [23].
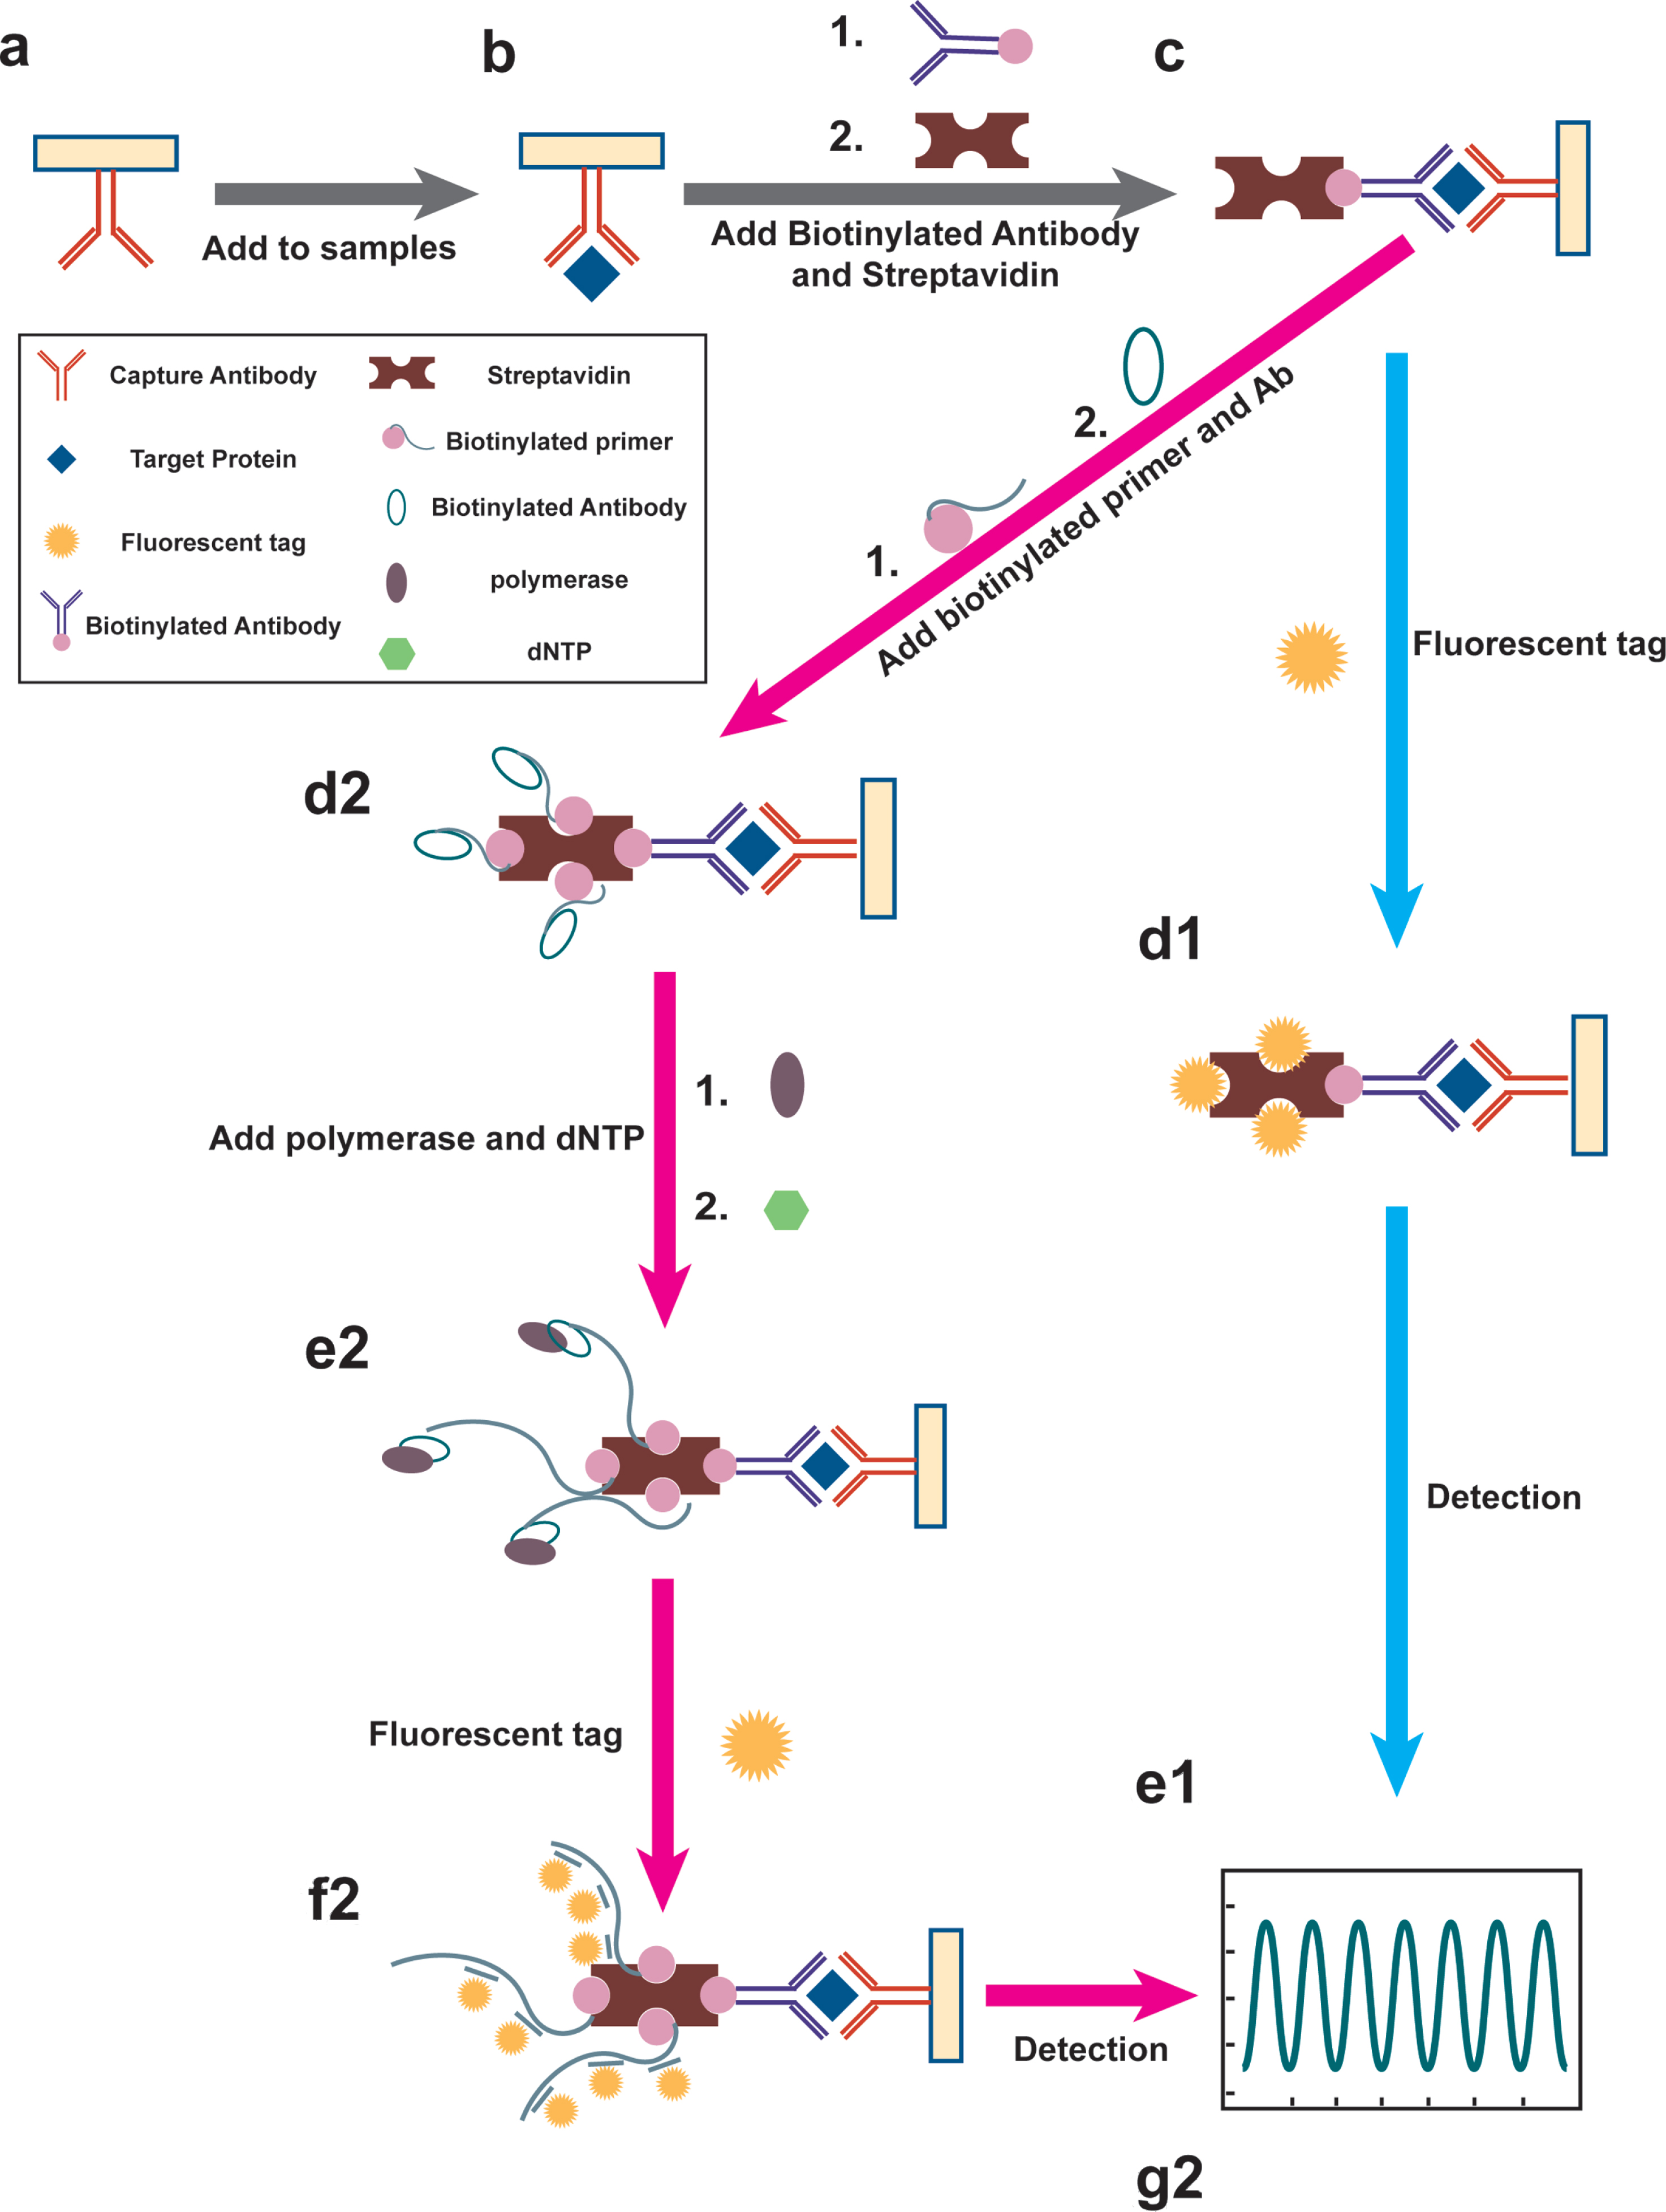
The principle of EIMAF/a-EMIAF assay. a-c) Single protein molecules are captured by capture antibody (a), biotinylated antibody and streptavidin (b, c). For EIMAF, the fluorescent tag will be added (d1) and excited by the laser (e1); For a-EIMAF, the rolling circle amplification (RCA) reaction is composed of the biotinylated primer and antibody (d2), DNA polymerase, and dNTP (e2). After the completion of amplification, the fluorescent tag will be added (f2), and the optical fiber captures the fluorescence signal used to calculate protein concentrations (g2).
For EIMAF, the detection starts with the coating with a capture antibody in 96-well microtiter plates with a high binding capacity (Fig. 3a). The sample (Fig. 3b) will then be added to the plates and form a complex. The complex will mix with bio-tinylated antibody and non-glycosylated streptavidin, which exhibits low non-specific binding levels to enable improved sensitivity (Fig. 3c). Finally, a fluorescent tag such as Rhodamine Red X will be tagged (Fig. 3d1), enabling the fluorescence reaction for detection (Fig. 3e1).
The principle of a-EIMAF is based on EIMAF with RCA. RCA is an efficient and straightforward isoth-ermal enzymatic process that utilizes unique DNA and RNA polymerases to generate long singlestran-ded DNA (ssDNA) and RNA. In RCA, biotinylated primer and antibody will combined with streptavidin (Fig. 3d2), and the polymerase continuously adds de-oxy-ribonucleoside triphosphate (dNTP) (Fig. 3e2) to a primer annealed to a circular template, which results in long ssDNA with tens to hundreds of tandem repeats. Finally, fluorescent tags will then be added to the long ssDNA (Fig. 3f2) and amplify the signal significantly, enabling the fluorescence reaction for detection (Fig. 3g2).
Meso Scale Discovery (MSD)
MSD assay is a bioanalysis platform that utilizes electrochemiluminescence, unlike the colorimetric or chemiluminescent reaction in ELISA, as a signal detection technique (Fig. 4) [25].
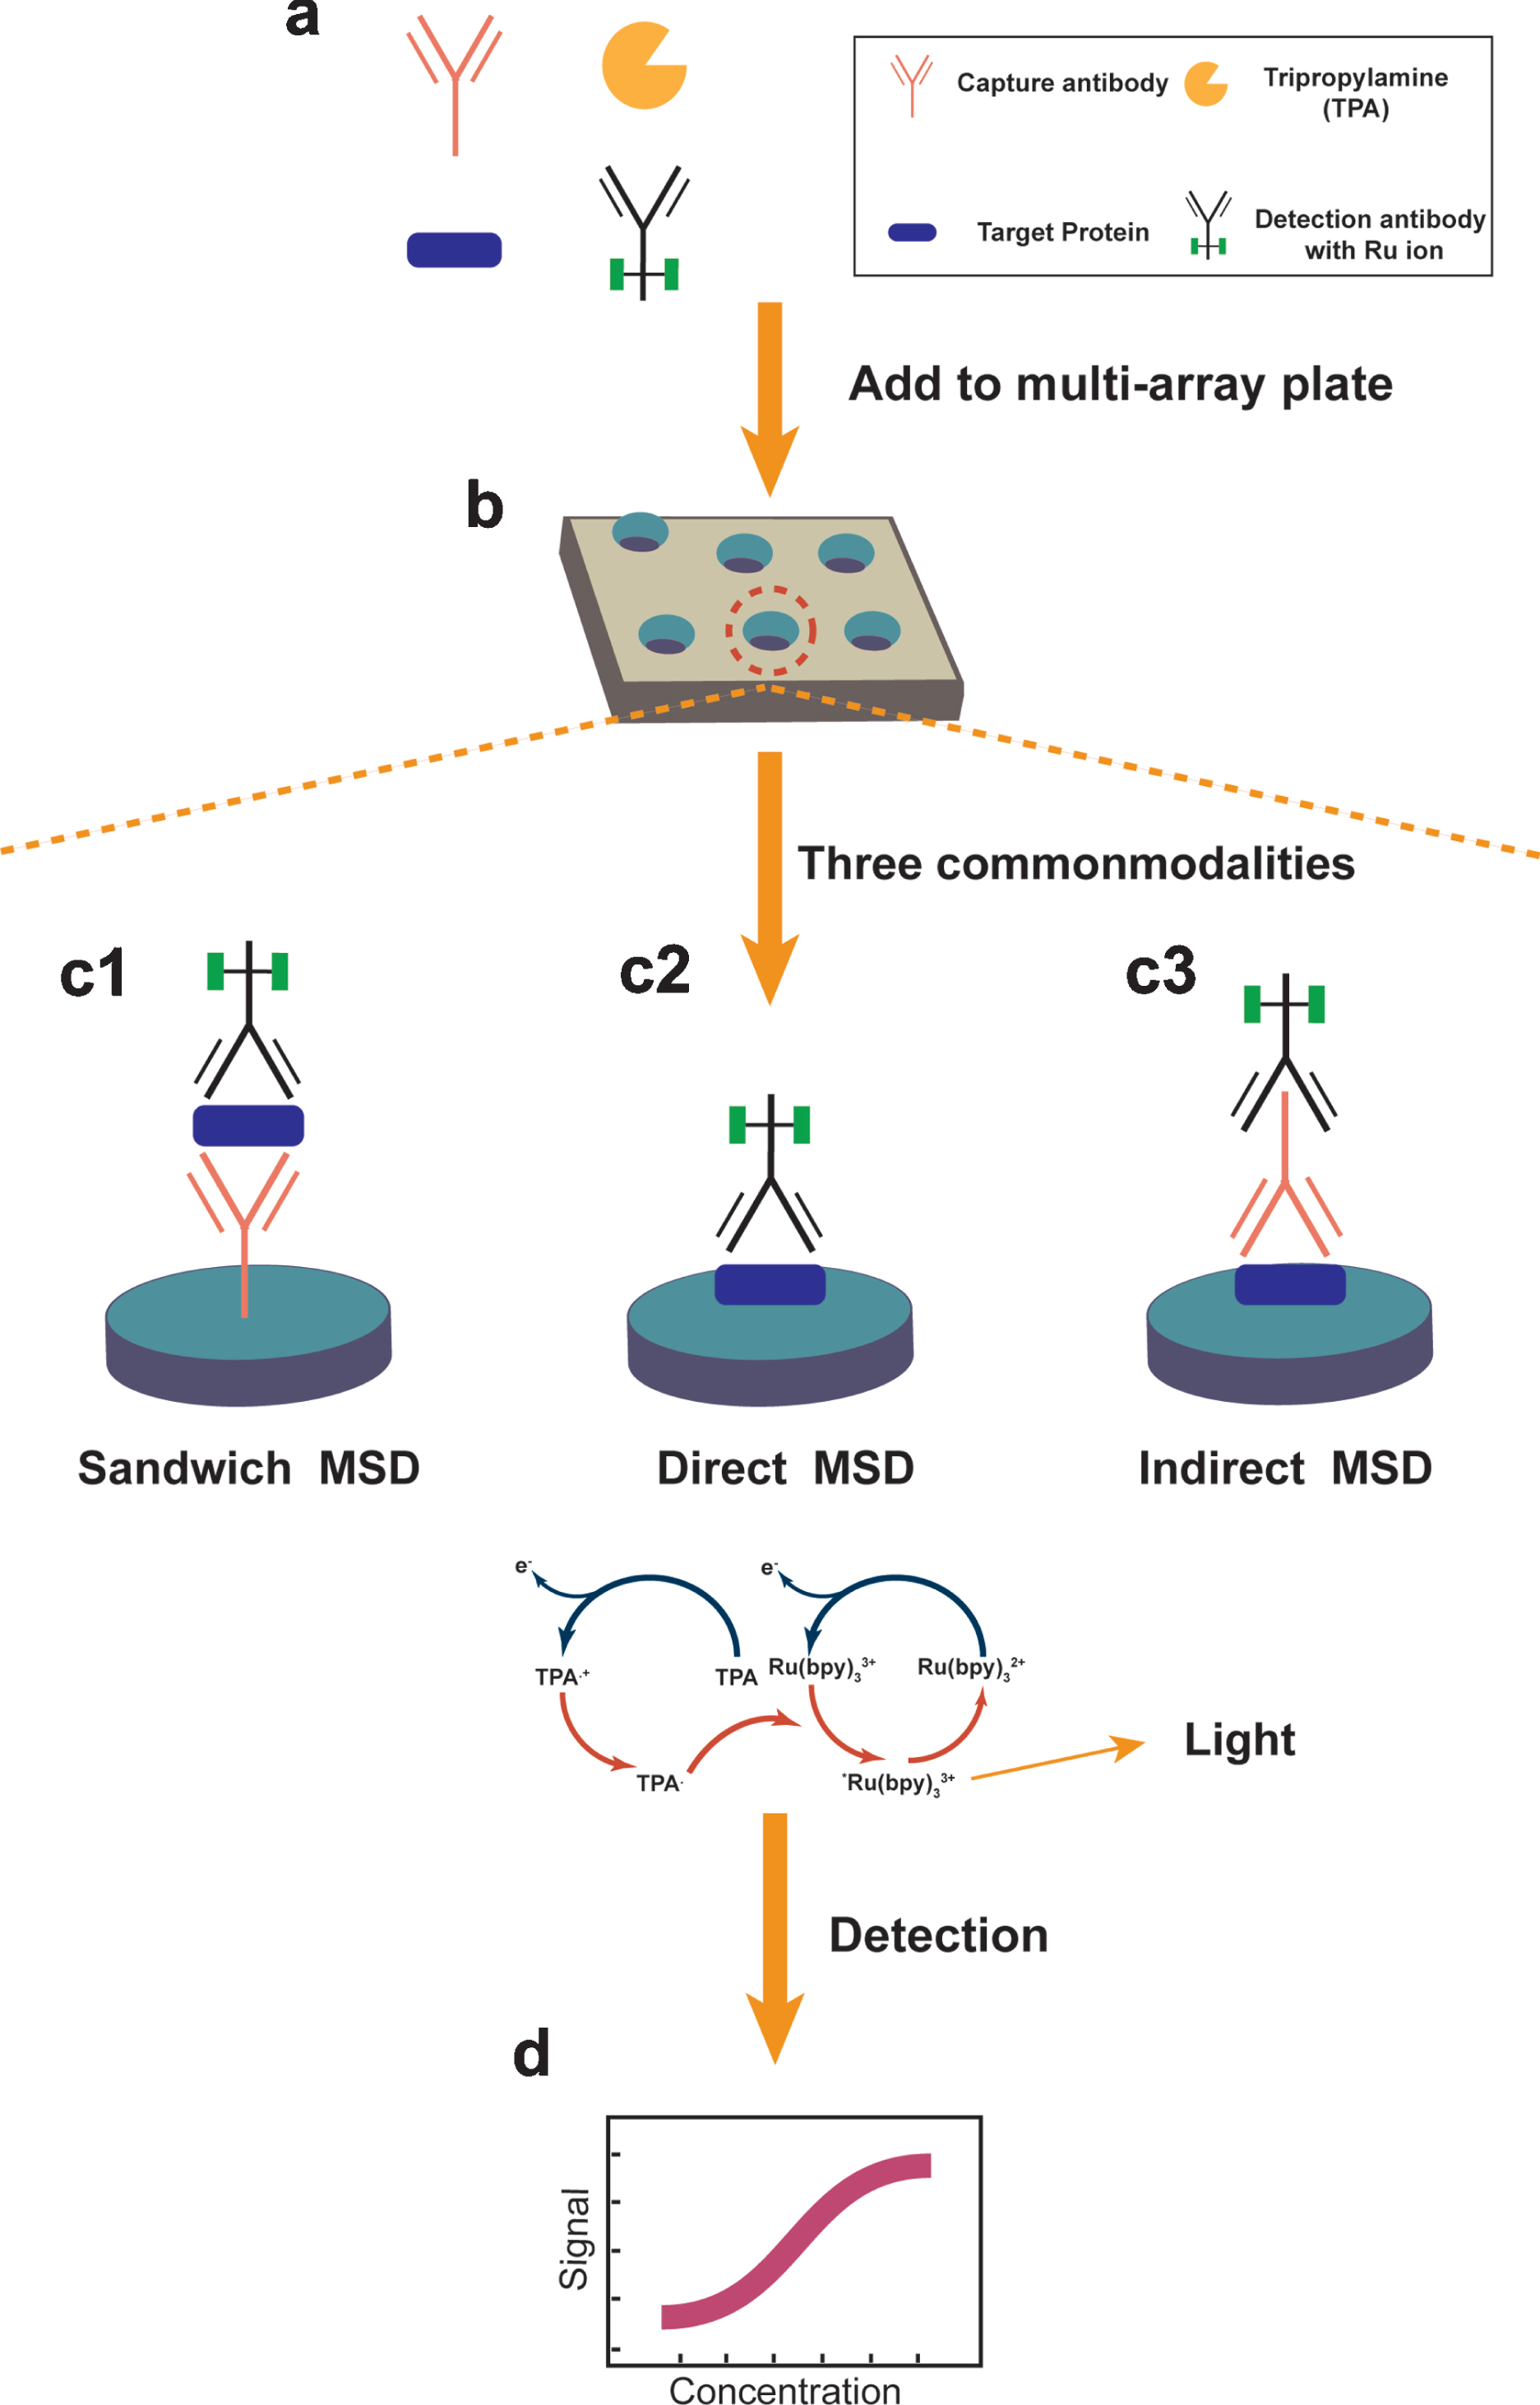
The principle of MSD assay. a) Single protein molecules are captured by capture antibody, detection antibody with Ru ion, and TPA (a). b) The complex will be loaded into the electrode plate. c) The reaction by three modalities of MSD: The sandwich (c1), direct and indirect assays (c2 and c3). d) Light signal (620 nm) emitted from Ru can be captured by a CCD camera at 620 mm.
The detection starts with the mixing sample, Tripropylamine, capture antibody and detection antibody with Ru ion in 96-well microtiter plates (Fig. 4a, b). There are three types of MSD detection based on the order and mode of antigens and antibodies combination. For sandwich MSD, the capture antibody coated in the bottom of plate first. The bottom of each well in the plate is the electrode, where the antigen will mix and bind to capture antibody, then the detection antibody with Ruthenium (Ru) will bind to the antigen (Fig. 4c1). For direct MSD, the antigen will bind to the electrodes first, then the detection antibody with Ru will bind to the antigen (Fig. 4c2). For indirect MSD, the antigen will bind to the electrodes first and the detection antibody with Ru will bind to the antigen through capture antibody (Fig. 4c3). Ru is the core factor in the MSD assay. Tris(2,2′-bipyridyl) ruthenium(II) complexes (Ru (bpy)32 +) and Tri-n-propylamine (TPA) lose electrons on the electrode surface and will be oxidized. The oxidized TPA loses one H + and becomes a strong reductant, reducing the Ru (bpy)33 + to Ru (bpy)32 +. This process repeatedly occurs on the electrode’s surface, continually emitting photons and maintaining a constant substrate concentration. After the reaction, the ruthenium ion will close enough to the electrode to trigger an oxidation-reduction reaction that will ultimately produce light. The light signal (620 nm) emitted from Ru label bound to capture electrodes is measured with a charge-coupled device camera, so that Ru counts on individual spots can be quantified. Here, only Ru label bound near the surface of the electrodes is detected (Fig. 4d).
COMPARISON BETWEEN ASSAYS
ELISA is a assay established on the combination of specific antigen-antibody reaction and enzyme-catalytic chromogenic reaction. Except for IMR ba-sed on magnetic susceptibility reduction, Simoa, EIMAF/a-EIMAF, and MSD assays are based on the same or similar principle as ELISA. Unlikely ELISA, these assays take different routes to amplify the signal, which will raise the sensitivity. For Simoa, one array consists of 200,000 microwells to ensure every protein molecule can be detected. For EIMAF/a-EIMAF, the biotin-streptavidin system and the rolling circle amplification technique have shown significant amplification efficiency. For MSD, the Ru-labeled Electro-Chemi-Luminescence technique enables the signals to increase while remaining stable in the process of detection. In addition, the high surface-to-volume ratio of magnetic nanoparticles in IMR makes the binding area between antibodies and bio-molecules extremely large, which results in a high sensitivity.
In addition to the high sensitivity, there are several additional advantages of Simoa assay, including automation, to ensure repeatability and accuracy and multifactor detection to save the cost. The researchers can also use the homebrew development kit to dev-elop a new biomarker kit if the commercial product is not available. For IMR, it belongs to a non-optical color rendering system, and a strong centrifugal force will be created to break the binding of non-specific molecules but not the targets. Therefore, the non-specific molecules do not disturb the detection. For EIMAF & a-EIMAF, they have super high sensitivities at the attogram level (10 to the power of -18 of a gram) and a very low limit of detection. For MSD, the platform is also highly sensitive, with a low sample volume requirement. It allows multiplex panels - 10 analytes simultaneously.
We have compared the maturity of assay development from several aspects, including kits availability, multiplex assay availability, homebrew developm-ent kit possibility, and the number of publications (Table 1). The number of kits for Simoa, IMR, EIMAF and a-EIMAF, and MSD are 179, 11, 2, and 394, respectively. However, there are 2,380 ELISA kits manufactured by Abcam alone, and the development of the kits is relatively easy and fast. Besides, the multiplex assay and self-make kit can be easily achieved using ELISA. However, only Simoa and MSD support multiplex assay among the new detection assays, and up to 10 factors can be detected at a time. Similarly, only Simoa, EIMAF and a-EIMAF, and MSD assays support homemade kits, where IMR does not. Besides, the ELISA generally requires a microplate spectrophotometer only, but the new assays will require specialized machines, associated with relatively high costs of detection.
The comparison among these assays about assay maturity
1Data from official website or publications (ELISA: abcam: https://www.abcam.cn/products?keywords=elisa+kits&selected.classification=ELISA% 2C+Matched+Antibody+Pairs+and+Multiplex+Immunoassays–ELISA+Kits+and+Reagents&selected.researchAreas=Immunology; Simoa: https://www.quanterix.com/productstechnology/simoa-assay-kits; IMR: http://www.magqu.com/product; EIMAF/a-EIMAF: Rubenstein et al. [33]; MSD: https://www.mesoscale.com/en/products_and_services/assay_kits).2Data obtained from the Web of science as of February 1, 2021. (ELISA: TS = ELISA AND PY = 1960–2021; Simoa: TS = Simoa AND PY = 2010–2021; IMR: TS = IMR AND PY = 2006–2021 AND AD = Taiwan; EIMAF/a-EIMAF: TS = (EIMAF OR a-EIMAF) AND PY = 2009–2021; MSD: TS = MSD AND PY = 1995–2021). 3Data included only from abcam, Inc. 4Data included from publications of all the companies’ ELISA kits.
PLASMA TAU AND PTAU DETECTION
We have then compared these assays for plasma tau detection from the aspects of sensitivity, specificity, reliability, and reproducibility (Table 2). For sensitivity, all the assays are assessed by testing across multiple kit lots, analysts, and runs according to their operation protocol. The limit of detection for Simoa, IMR, a-EIMAF, MSD, and ELISA are 0.0146, 0.026, 10–7, 1.07, and 3.3 pg/mL, and lower limit of quantification for Simoa, IMR, a-EIMAF, MSD, and ELISA are 0.049, 0.1, 10–6, 30 and 31.25 pg/mL, respectively. For specificity, except for a-EIMAF (no data available), other assays are assessed by testing with different type samples or mixing with interfering substances. The mean recovery for Simoa, IMR MSD, and ELISA are 95%, 102.6%, 99.9%, and 109.5%, respectively. For reliability and reproducibility, all the assays are assessed by testing the same samples in a run, and the coefficient of variation (CV) for Simoa, IMR, a-EIMAF, MSD, and ELISA are 9%, 5.04%, 5.51%, 7.9%, and 2.9%, respectively. Simultaneously, the influence of different lab/instrument for Simoa, IMR, and a-EIMAF was evaluated, and the CVs are 7.3%, 4.76%, and 5.16%, respectively. The sensitivities of EIMAF or a-EIMAF reach a detection limit of approximately 10–4 fg/mL, making it the most sensitive assay. However, Simoa, IMR, or MSD assays can successfully detect plasma tau at 20 fg/mL.
The comparison among these assays for total tau detection
LOD, limit of detection; LLOQ, lower limit of quantification; CV, coefficient of variation. 1Data from official website or publications (ELISA: https://www.abcam.cn/human-tau-elisa-kit-ab210972.html; Simoa: https://www.quanterix.com/products-technology/assays/tau; IMR: http://www.magqu.com/content/tau-protein-imr-reagent; EIMAF/a-EIMAF: Rubenstein et al. [33]; MSD: https://www.mesoscale.com/en/products/v-plex-plus-human-total-tau-kit-k151lag/). 2Data obtained from the Web of science as of February 1, 2021. (ELISA: TS = (ELISA AND Tau) AND PY = 1960–2021; Simoa: TS = (Simoa AND Tau) AND PY = 2010–2021; IMR: TS = (IMR AND Tau) AND PY = 2006–2021 AND AD = Taiwan; EIMAF/a-EIMAF: TS = (EIMAF OR a-EIMAF AND Tau) AND PY = 2009–2021; MSD: TS = (MSD AND Tau) AND PY = 1995–2021). 3Data included from publications of all the companies’ ELISA tau kits.
Hyperphosphorylated tau deposits in the brain of AD, and have been considered as a major pathological event in AD [1]. Consequently, the detection of tau phosphorylation has been hypothesized as a biomarker for AD progress in the brain and CSF. It was previously undetectable in the plasma. However, several of the phosphorylation sites of tau, including 181, 217, and 231, can now be detected using the assays mentioned above (compared in Table 3). It is noted that literatures are still accumulating in testing these assays, in order to determine if the status of these phosphorylation sites of tau are relevant to the events in the brains of AD patients.
The comparison among these assays for ptau detection
LOD, limit of detection; LLOQ, lower limit of quantification; CV, coefficient of variation. 1Data from the official website or publications (Simoa-ptau231: https://www.quanterix.com/simoa-assay-kits/p-tau-231/; Simoa-ptau181: https://www.quanterix.com/simoa-assay-kits/p-tau-181/; IMR-ptau181: http://www.magqu.com/content/”magqu”-phosphorylated-tau-protein-pt181-imr-reagent; EIMAF/a-EIMAF-ptau231: Rubenstein et al. [33]; MSD-ptau231: https://www.mesoscale.com/en/products/phospho-thr231-total-tau-kit-k15121d/; MSD-ptau181: Janelidze et al. [42]; MSD-ptau217: Palmqvist et al. [41]). 2Data obtained from the Web of science as of February 1, 2021. (Simoa-ptau231: TS = (Simoa AND ptau231) AND PY = 2010–2021; Simoa-ptau181: TS = (Simoa AND ptau181) AND PY = 2010–2021; IMR- ptau181: TS = (IMR AND ptau181) AND PY = 2006–2021 AND AD = Taiwan; EIMAF/a–EIMAF- ptau231: TS = (EIMAF OR a-EIMAF AND ptau231) AND PY = 2009–2021; MSD- ptau231: TS = (MSD AND ptau231) AND PY = 1995–2021); MSD- ptau181: TS = (MSD AND ptau181) AND PY = 1995–2021) MSD- ptau217: TS = (MSD AND ptau217) AND PY = 1995–2021). 3Phosphorylated tau is quantified in units because the percentage of total tau that is phosphorylated will vary with different preparations of the standard.
DISCUSSION
With the development of ultrasensitive detection assay since 2010, plasma tau and its phosphorylation can be detected and examined for the possibility as a biomarker. In AD and other dementia patients, plasma tau is significantly higher than healthy controls, using either Simoa [26, 27] or IMR [28, 29] assays. The tau level in plasma can also link with pathology, where it can predict brain tau deposition [15], and negatively correlated with grey matter density in the medial temporal lobe, precuneus, thalamus, and striatum [30]. Plasma tau can also serve as an endophenotype for identifying risk for 4-repeat tauopathies in older individuals [31]. In TBI, greater repetitive head impact exposure may predict higher later-life plasma tau concentrations in former National Football League players [32], and plasma p-tau/tau ratio can be used as diagnostic and prognostic biomarkers for acute TBI [33]. Plasma tau has also been investigated in other diseases such as Down syndrome and stroke [34–36].
Recently, phosphorylated tau can also be detected in plasma by Simoa or MSD assays [37–44], and both ptau181 and ptau217 are promising biomarkers for AD. ptau181 and ptau217 can differentiate Alz-heimer’s disease from other neurodegenerative disorders, and were associated with tau pathology [37, 41]. Some evidence suggested p-tau217 performs better than ptau181 in CSF and plasma samples as it has a higher AUC and stronger correlations with the tau positron emission tomography [40, 41].
Despite the advances made over the last few years, plasma tau detection still has its limitations to overcome. One of the issues is the blood sample itself. Although large multi-center cohort studies have standardized protocols to collect the blood, it is still difficult to avoid protein degradation during the collecting procedure. To compare the results collected from different studies, the assays used for blood collection should also be noticed, as different assays of blood collection may influence the results of protein detection. The next question is the antibodies used in the assays. The first step in the principle of all assays is based on antigen-antibody reactions. The quality of antibodies largely determines the accuracy and reliability of the results. However, the preparation of antibodies based on immunized animals can result in batch-to-batch variations. We should also note that proteins have different isoforms. For example, human tau has six isoforms, and we need to be particular about the species detected by these assays.
Our review introduces four new ultrasensitive assays and their applications to detect plasma tau and its phosphorylation. The assays have their advantages and disadvantages over the traditional ELISA, and each other. It would be critically important to test these assays in large multi-center cohorts, establish the normal range, follow up with the longitudinal changes, and determine the possibility of plasma tau and its phosphorylation states as prognostic and diagnostic biomarkers for AD and other neurodegenerative diseases.