
Abstract
Amyloid-β 1–42 (Aβ1–42) measured in the cerebrospinal fluid (CSF) can be used as a diagnostic biomarker for Alzheimer’s disease (AD) but an upward drift when using the INNOTEST ELISA has been suggested. We investigated the upwards drift of Aβ1–42 levels over a period of twelve years in a consecutive memory clinic cohort. We found a significant increase in Aβ1–42 from 2008 to 2019 independent of changes in tau. New methods for the quantification of CSF Aβ1–42 levels are being implemented but awareness of this upwards drift is crucial during the diagnostic work-up and when selecting historical samples for research.
INTRODUCTION
Amyloid plaques are one of the pathological hallmarks of Alzheimer’s disease (AD) and the concentration of amyloid-β 1–42 (Aβ1–42) in the cerebrospinal fluid (CSF) can be used as an in vivo biomarker to indicate the presence of amyloid aggregation [1].
The clinical use of Aβ1–42 levels in CSF has been hampered by preanalytical and analytical variation hindering a universal cut-point to be established. Extensive work regarding the harmonization of CSF collection, storage, and analysis has been done [2]. Despite harmonization protocols in place, the Aβ1–42 levels measured by the widely used INNOTEST ELISA seem to have increased over the years as reported by other research groups using the Amsterdam Dementia Cohort and the Washington University St. Louis dementia cohort [3–5].
The aim of this study was to investigate the upwards drift of Aβ1–42 levels in a consecutive memory clinic cohort over a period of twelve years.
MATERIAL AND METHODS
Data for this study were retrieved from the Danish Dementia Biobank (approved by the Danish Data protection agency RH-30-0284/00622). Patients who underwent diagnostic evaluation for dementia including lumbar puncture at the Memory Clinic, Rigshospitalet, gave informed consent for their data and biological samples to be used for research purposes. This project was approved by the Danish Data Protection agency VD-2018-62/6279.
Diagnoses were given after consensus meetings including specialists in neurology, psychiatry, and geriatrics as well as neuropsychologists. Dementia was diagnosed according to the ICD-10 criteria and AD was diagnosed according to the McKhann criteria [6] until 2012 where the NIA-AA criteria [7] were introduced.
Analysis of Aβ1–42, tau, and p-tau levels in CSF
All analyses were performed as part of the clinical routine diagnostic assessment of the patients between February 2008 and December 2019. From February 2008 till February 2018 the analyses were run at Statens Serum Institute, and between February 2018 and December 2019 the analyses were run at the Department of clinical biochemistry, Copenhagen University Hospital, Rigshospitalet. Both laboratories participate in the ongoing Alzheimer’s Association quality control program for CSF biomarkers.
CSF samples were obtained by lumbar puncture and collected in polypropylene tubes. CSF Aβ1–42 levels were determined using sandwich ELISA (INNOTEST® β-AMYLOID (1 –42) Fujirebio [formerly Innogenetics]). CSF levels of total tau and phosphorylated tau (p-tau) were determined using sandwich ELISAs INNOTEST hTau Ag, and INNOTEST PHOSPHO-TAU (181P) , respectively.
The amyloid/total tau ratio was calculated by dividing the concentration of amyloid beta with the concentration of total tau in the CSF.
A subset of 26 samples collected in 2008–2015 were reanalyzed in 2021 using the same INNOTEST® β-AMYLOID (1 –42) assay.
Statistics
All statistics were performed in MATLAB (vR2017b). To compare age between the years performed a one-way ANOVA. When comparing gender and number of patients with AD, we performed chi-squared tests between all groups using the crosstab function in MATLAB. When comparing the different biomarkers, we performed an ANCOVA [8] with age and sex as covariates [9]. Post-hoc tests for Aβ1–42 levels between the different years were performed using t-tests.
RESULTS
Demographics
A total of 1997 patients gave consent for use of their data and biological samples for research purposes. While all patients had an Aβ concentration measured, three patients did not have data for total tau and ten patients did not have data for phosphorylated tau. We found a significant increase in age (p < 0.001) but not in sex composition between the years investigated. Furthermore, we found that the percentage of patients with AD was unchanged through twelve years of study (Table 1).
Demographic characteristics, levels of Aβ1 - 42, tau, p-tau, and Aβ1–42/tau ratios of the population separated by year
p values are *ANOVA, #chi-squared, and ‡ANCOVA with age and sex as covariates. SD, standard deviation.
Changes in biomarkers from 2008 to 2019
We found a significant increase in the Aβ1–42 values from 2008 to 2019 (p < 0.001) (Fig. 1). A total of 55 out of 66 post-hoc tests for Aβ1–42 levels between the years were statistically significant. Furthermore, a significant difference was found for phosphorylated tau (p≤0.001) although not as an upwards trend. Levels of total tau remained stable (p = 0.099) (Fig. 2A, B). When examining the Aβ1–42/total tau ratio, we found that it was also significantly different across the twelve years (p < 0.001) (Fig. 2C). The upwards change in Aβ1–42/total tau matched the upwards drift in Aβ1–42.
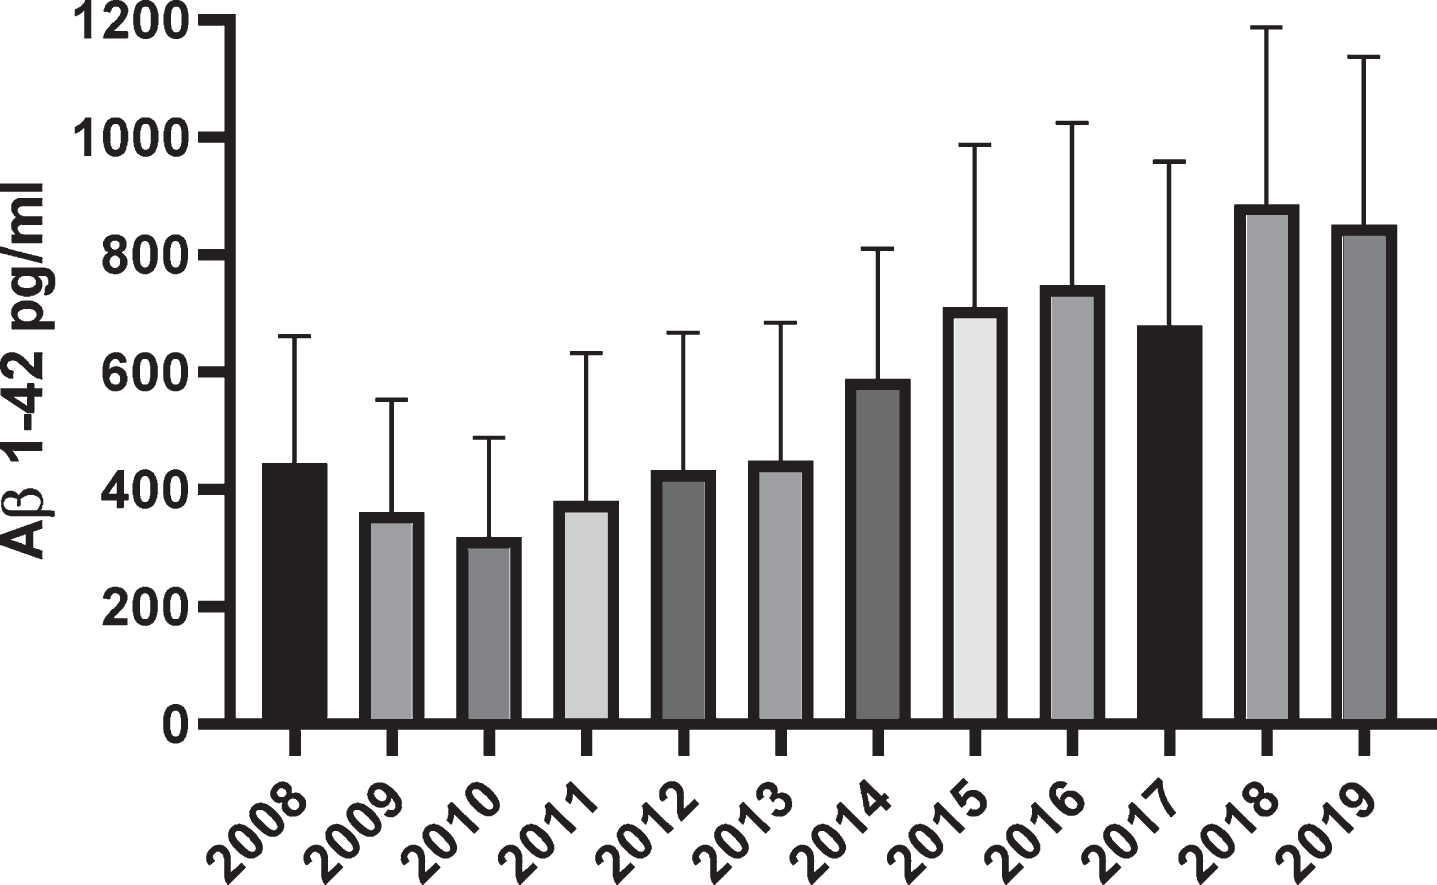
Mean CSF levels of Aβ1–42 per analysis year. Error bars denote standard deviation (SD).
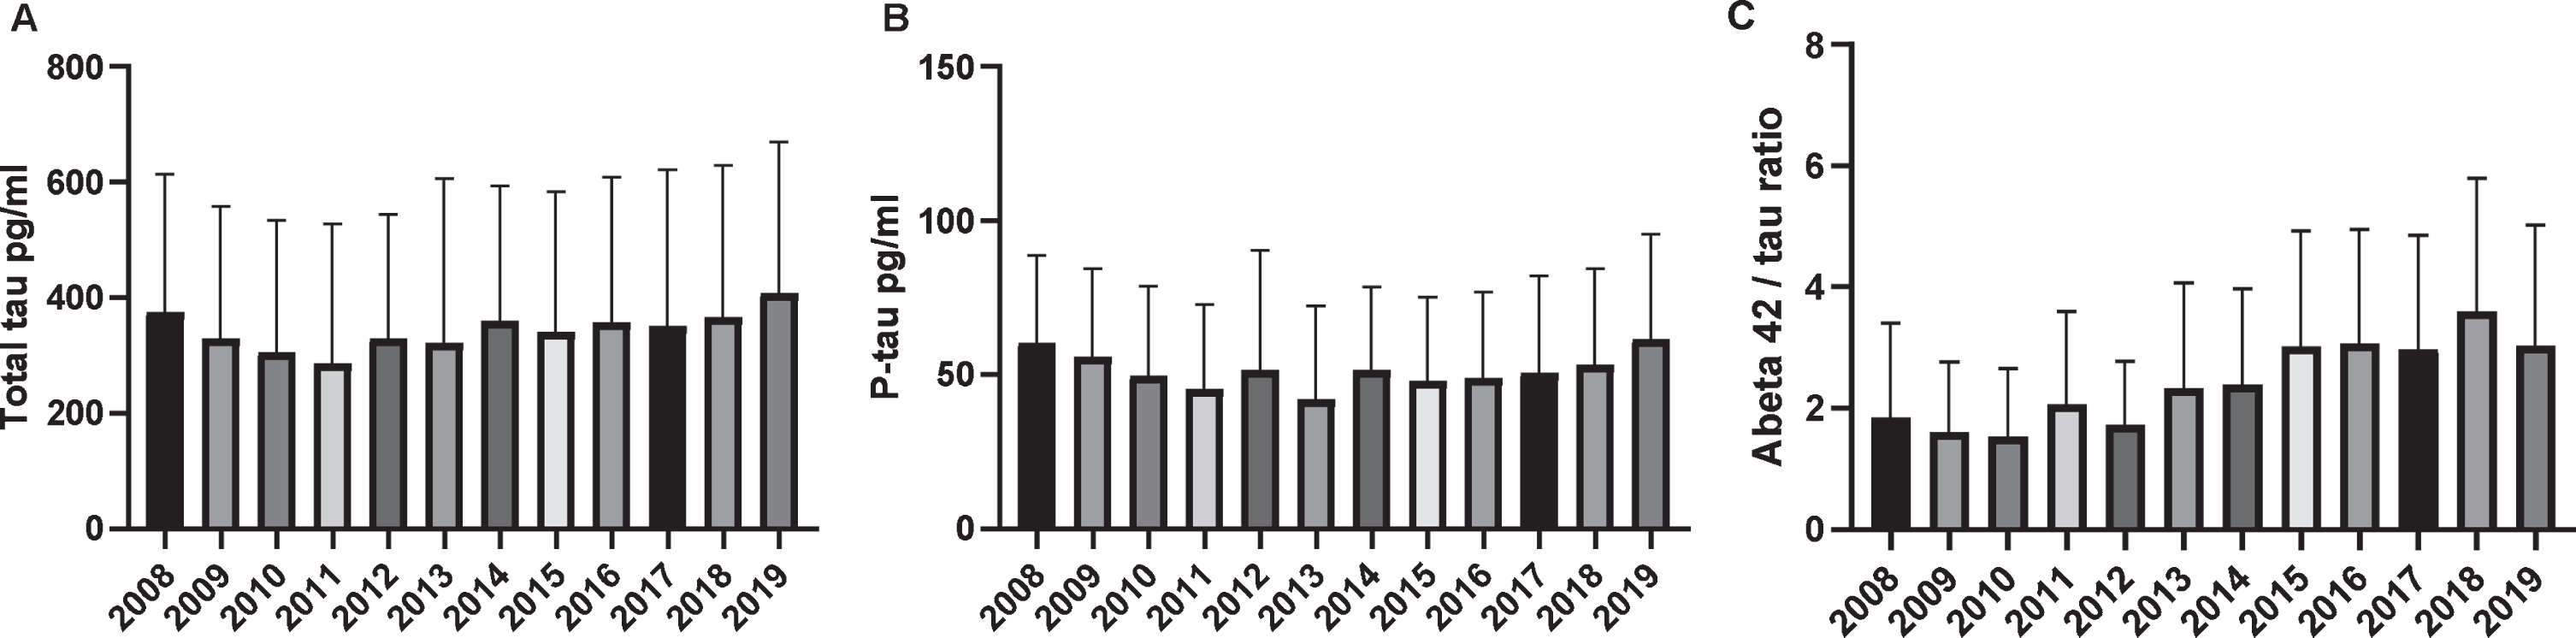
Mean CSF levels of (A) total tau, (B) p-tau, and (C) Aβ1–42/tau ratio per analysis year. Error bars denote standard deviation (SD).
A subset of 26 samples was reanalyzed in 2021. We found a substantial increase in the Aβ1–42 values after reanalysis. It seemed that the increase was most prominent in the samples with an original concentration below 350 pg/ml (Supplementary Figure 1).
DISCUSSION
In this study, we showed that there was a gradual upwards drift in the CSF Aβ1–42 levels over the twelve years studied in a consecutive memory clinic patient cohort. This is in line with previous findings from two research cohorts [3–5]. We also report a difference in CSF p-tau levels over the years, albeit not an upwards drift. In order to adjust for what might be varying levels of neurodegeneration, we also investigated the Aβ1–42/tau ratio, which was also significantly increased across the timespan of the study.
In an attempt to elucidate if the drift was caused by assay related factors a subset of 26 samples were reanalyzed. Here we also found an increase in the CSF Aβ1–42 levels over time. This was observed in samples with an original CSF Aβ1–42 concentration below 350 pg/ml. Preanalytical variables could account for some of this increase, but since 2013 we have adhered to published recommendations [2] and the continuous increase in CSF Aβ1–42 concentrations after this time cannot solely be explained by preanalytical variables.
Immunoassays, like the one used in this study to analyze Aβ1–42, are based on an antigen-antibody reaction, which can be influenced by factors such as the quality and exact concentrations of antibodies, antigens, pH, detergent, protein concentration, etc. Furthermore, a broad analytical range and low volume of analyses has also been suggested to hamper the detection of drift in other assays [10].
Due to the commercial nature of the assay used for Aβ1–42 measurements we were not able to ascertain changes in reagents comprising the kit. Also, this assay has lacked certified reference materials until very recently [11] hampering the appropriate calibration of the assays over time and between different lots and laboratories.
This study has some limitations. Due to the retrospective nature of the study, some factors changed over the years. Differences in catchment area increased the number of referred patients during the twelve-year period. The age of the investigated patients increased over the years, but the frequency of AD remained stable (Table 1) as did the overall composition of the patient cohort. These factors cannot by themselves explain the increase in CSF Aβ1–42 levels over the years, and if anything, levels should decrease with age [12].
In line with previous studies, we found that tau levels did not change over the years and p-tau levels fluctuated slightly although not with an upwards or downwards trend [3, 5].
New methods for the quantification of CSF Aβ1–42 levels are being implemented such as the Elecsys® assay from Roche Diagnostics. A high level of concordance between the Elecsys® and INNOTEST methods has been described [13]. However, there is still not enough data to ascertain whether this upwards drift could also be present when using this new method.
Awareness of this upwards drift is crucial for the interpretation of CSF Aβ1–42 results in a memory clinic and important for when selecting retrospective banked historical cohorts spanning several years for research purposes or for recruitment of research participants from databases. Studies are needed to investigate the association between Aβ1–42 measured with INNOTEST and Elecsys to understand if the upward drift is due to the methods applied.